
Analysis of the Influence of Contact Stress on the Fatigue of AD180 High-Carbon Semi-Steel Roll
by
Yaxing Liu
1,2,3,4,
Lixin Liu
1,2,3,
Qian Cheng
1,2,3,
Haipeng Hou
1,2,3,
Zehua Zhang
1,2,3 and
Zhongkai Ren
1,2,3,* 1
College of Mechanical and Vehicle Engineering, Taiyuan University of Technology, Taiyuan 030024, China
2
Engineering Research Center of Advanced Metal Composites Forming Technology and Equipment, Taiyuan University of Technology, Taiyuan 030024, China
3
National Key Laboratory of Metal Forming Technology and Heavy Equipment, Taiyuan University of Technology, Taiyuan 030024, China
4
Hai’an & Taiyuan University of Technology Advanced Manufacturing and Intelligent Equipment Industrial Research Institute, Nantong 226600, China
*
Author to whom correspondence should be addressed.
Metals 2024, 14(5), 548; https://doi.org/10.3390/met14050548
Submission received: 10 April 2024
/
Revised: 30 April 2024
/
Accepted: 2 May 2024
/
Published: 6 May 2024
(This article belongs to the Special Issue Numerical Simulation of Metal Forming Process)
Abstract
:In this study, to investigate the problem of contact fatigue and the damage mechanism of an AD180 high-carbon semi-steel roll, rolling contact fatigue tests were conducted using specimens cut from the periphery of a roll ring. These specimens were characterized under different contact stresses using SEM, a profile system, an optical microscope, and a Vickers hardness tester. The results indicates that the main forms of fatigue damage of an AD180 high-carbon semi-steel roll are peeling, pitting corrosion, and plowing. Moreover, the surface of the roll exhibits delamination and plastic deformation characteristics under high contact stress. Meanwhile, the size and depth of peeling, as well as the amount of pitting corrosion, increase with the contact stress. Peeling is mainly caused by a crack that originates at the edge of the specimen surface and propagates along the pearlite structure and the interface between pearlite and cementite. High contact stress can lead to an increase in the crack propagation depth and angle, resulting in the formation of larger peeling. Under cyclic loading, the near-surface microstructure of the specimen hardens due to grain refinement and dislocation strengthening, and the depth of the hardened layer increases with the increase in contact stress. When the contact stress reaches 1400 MPa, the near surface structure of the specimen changes from pearlite to troostite.
1. Introduction
A roll is a wear-resistant foundry product that combines casting and processing, and occupies a significant position in the rolling industry. The carbon content of an AD180 high-carbon semi-steel roll is about 1.8%, and its performance is between that of cast steel and cast iron. It is used in high-load and harsh working environments due to its good strength, wear resistance, and impact resistance, and it has become the main material for manufacturing cast steel rolls. The roll is also a key working component of a rolling mill and an important consumable in the rolling industry, with its main type of failure being rolling contact fatigue [1]. There are many factors that affect the rolling contact fatigue of materials, and many scholars have studied the influencing factors of material fatigue damage from different perspectives. For example, Gao et al. [2] found that the hardness of the bainite segregation zone is greater than that of the matrix. In addition, the combination of soft and hard structures inside the steel induces local uneven deformation under cyclic loading, which leads to the initiation and propagation of fatigue cracks at the bainite–pearlite interface. Chunpeng Liu et al. [3] found that an increase in the slip rate leads to an increase in the frictional force on the contact surface of D2 wheel steel, thereby accelerating the generation of fatigue cracks on the contact surface. Zhuofan Xia et al. [4] found that the rolling contact fatigue life of bearing steel increases with a decrease in the surface roughness of the specimen. The life of the initial low-surface-roughness specimen is four times that of the initial high-surface-roughness specimen. Yanru Liu et al. [5] found that the structural stability of 20Mn2SiMoCuV bainite wheel steel is reduced due to the high temperature effect during braking, resulting in the decomposition of residual austenite into brittle troostite and the precipitation of cementite along grain boundaries and flat noodle boundaries, thus providing conditions for crack initiation and propagation.
Studies have shown [6] that the stress interaction between rolls is also an important cause of roll failure. Through macroscopic and microscopic analysis of a composite roll, Debao Wang et al. [7] found that roll fracture is caused by stress. Peiyun Hou [8] believes that the excessive stress caused by sustained peak stress during the roll’s service process is the main reason for the early roll failure. Xing Chen et al. [9] found that the surface peeling on a roll is mainly caused by high local stress and cracks are the results of factors such as thermal cycling stress and plastic strain. Fractures are mostly caused by stress concentration at the neck of the roll or near-surface defects inside the roll under large external loads. Chengshuang Zhou et al. [10] found that rolls can also experience oblique fracture under contact stress. Lengaauer et al. [11] found that cracks in silicon nitride rolls used for wire hot rolling are mainly caused by stress and that high stress is sufficient to enhance subcritical crack propagation, leading to the development of macroscopic cracks. Xiangji Zhao et al. [12] found that with an increase in the slip ratio and contact stress, the wear amount and average crack length both increase and that the surface damage characteristics change from simple attachment spots to obvious fatigue crack aggregation. Shuyue Zhang et al. [13] found that the depth of cracks increases with increasing contact stress. Jiajie Kang et al. [14] found that the shear stress and delamination probability of the specimen increase with the contact stress. From the above literature, it can be seen that stress seriously affects the rolling contact fatigue of materials, and different levels of stress can lead to different types of damage. The AD180 high-carbon semi-steel roll has been widely used in the rolling industry, but at present, the research focuses more on whether the centrifugal casting semi-steel roll has segregation, an unreasonable casting temperature, and so on, and there is no research on the impact of contact stress on its damage [15,16]. This article investigates the effect of contact stress on the fatigue damage of the AD180 high-carbon semi-steel roll, and the damage mechanism and rule are explored and revealed, providing a scientific basis for the rational use of this roll and improvement of its service life.
2. Experimental Materials and Methods
2.1. Experimental Materials
The experimental materials came from the outer ring of a roll cast via the centrifugal process [17], made of AD180 high-carbon semi-steel, while the inner layer of the roll was made of 120 graphite steel. The research object of this experiment was AD180 high-carbon semi-steel roll. In order to ensure that the performance of the specimen was consistent with the actual roll, specimens were directly cut from the periphery of the outer ring of the roll. The yield strength and tensile strength of AD180 high-carbon semi-steel roll are 164 MPa and 633 Mpa, respectively, and its chemical composition is shown in Table 1. The actual values were determined using a scanning electron microscope (SEM).
2.2. Experimental Methods
A rolling contact fatigue test was conducted on the GPM-30 rolling contact fatigue testing machine (Shimadzu Corporation, Kyoto, Japan), with contact stresses set at 1300 Mpa, 1400 Mpa, and 1500 Mpa; the speed set at 1500 r/min; and the slip rate set at 10%. Oil lubrication was used. The test stress was determined with a combination of simulated working conditions and standard fatigue testing (lifting method), and the remaining parameters were determined with the “rolling contact fatigue Test Method for Metal materials”.
The experimental process is shown in Figure 1. Firstly, a cylindrical bar (Figure 1b) was cut from the outer circle of the AD180 high-carbon semi-steel roll (Figure 1a) via DK7740 electric discharge wire cutting. Then, the main specimen and the accompanying specimen (Figure 1c) were prepared using a CNC machining center in accordance with the “Rolling Contact Fatigue Test Method for Metal Materials”. The dimensions and accuracy requirements of specimens are shown in Figure 1d. Finally, the test was conducted using a rolling contact fatigue testing machine (GPM-30) at room temperature with the assembly method shown in Figure 1e.
After the experiment, the failed specimen was sampled and analyzed, and the sampling location is shown in Figure 2. To prevent contamination of the damaged surface of the main specimen during the sampling process, it was necessary to wrap it with copper foil tape before cutting. Then, the specimen was embedded, and after the embedding solution cooled and solidified, the surface of the specimen was subjected to rough and fine grinding using 400 #–2000 # sandpaper. The specimen was then polished to a mirror surface using a 3 μm diamond polishing agent on an automatic polishing machine (Struers GmbH, Willich, Germany) and then polished for 3.5 h using a vibration polishing machine (Buehler, Lake Bluff, IL, USA). Finally, the specimen was ultrasonically cleaned in alcohol for 5 min.
The following tests and analysis were performed on the processed specimens:
- (a)
- We observed the damage morphology of the specified test surfaces of fatigue test specimen 1 and test specimen 2 using SEM, and we performed EBSD characterization on test specimen 2.
- (b)
- AztecCrystal software (2.1.2) was used to analyze and process the test data, and the grain map was imported into AztecCrystal software. Then, the grain sizes of the sample under different conditions were calculated from the maximum Frater diameter.
- (c)
- We tested the cross-sectional hardness of the specimen using a Vickers hardness tester.
- (d)
- We captured the morphology of the peeling pits on the contact surface using a contour morphology system and analyzed and processed them using multi-file analysis software
- (e)
- We observed the metallographic structure of specimen 2 after polishing and etching with a 4% “NITAL” using an optical microscope (Leica Microsystems GmbH, Wetzlar, Germany) and analyzed the changes in its structure and crack propagation.
3. Experimental Results and Analysis
3.1. Analysis of Surface Damage of Specimens
The macroscopic morphology of the rolling contact fatigue failure specimen is shown in Figure 3, and its main damage includes pitting corrosion and peeling. The morphology of the peeling pits of the failed specimen under different contact stresses is shown in Figure 4.
From Figure 4, it can be seen that under contact stresses of 1300 MPa and 1400 MPa, the peeling pit is located on one side of the contact surface of the specimen, with peeling areas of approximately 4.57 mm2 and 5.79 mm2, respectively. However, under contact stress of 1500 MPa, the peeling pit runs through the entire contact surface of the specimen, with a peeling area of approximately 9.94 mm2.
This indicates that during the rolling contact fatigue test, stress concentration tends to occur on both sides of the contact surface, which accelerates the damage of the specimen. Moreover, the area of peeling pits on the contact surface of the fatigue specimen increases with the contact stress. Furthermore, the depth data of peeling pits on the surfaces of specimens under different contact stresses are summarized in Table 2. The average depths of peeling pits under contact stress values of 1300 MPa, 1400 MPa, and 1500 MPa were 298.83 μm, 319.67 μm, and 387.83 μm, respectively, which indicates that the average depth of peeling pits also increases with the contact stress.
The surface morphology at the non-peeling position of the specimens under different contact stresses is shown in Figure 5, characterized by approximately circular (diameter between 20 μm and 80 μm) pitting corrosion (marked by red spots). The proportions of the pitting area under contact stresses of 1300 MPa, 1400 MPa, and 1500 MPa were approximately 0.918%, 1.473%, and 2.506%, respectively, which indicates that the amount of pitting corrosion increases with the contact stress.
The SEM microstructures on the surfaces of the fatigue specimens under contact stresses of 1300 MPa and 1500 MPa are shown in Figure 6. It can be seen that the contact surface of the fatigue specimen will undergo plow grooves under cyclic loading, and the plow grooves will weaken under high contact stress, but delamination characteristics will appear on the surface of the specimen. Therefore, the surface damage of an AD180 high-carbon semi-steel roll under low contact stress comprises mainly peeling, pitting corrosion, and plowing. In addition to the above-mentioned defects, the surface damage under high contact stress also exhibits delamination and plastic deformation characteristics.
Subsequently, further observation of the fatigue specimen surface under different contact stresses revealed the presence of features as shown in Figure 7. From Figure 7a,b, it can be seen that there are obvious friction traces and a large number of transverse cracks on the surface of the specimen. Figure 7c,d show locally enlarged images of “A” and “B”, respectively. As shown in Figure 7c, the crack originates at the edge of the contact surface of the specimen and propagates along the axial direction of the roll towards the other side. As shown in Figure 7d, the crack extends along the axial direction of the roll and also radially under cyclic loading, but the transverse crack is significantly longer than the radial crack. It can be inferred that the edge of the contact surface of the roll is prone to stress concentration, leading to the generation of cracks, and the propagation speed of the transverse crack is higher than that of the radial crack, thereby accelerating the failure of the specimen.
The surface roughness values of specimens under different contact stresses were measured and analyzed using a contour morphology system and multi-file analysis software. The measurement method is as follows. First, take a point at the surface position of each specimen. Then, starting from this point, take straight paths with lengths of 400 μm and 5000 μm (width of contact surface) along the tangential and axial directions of the specimen, and take ten straight lines equally spaced on both sides of these two lines for roughness measurement. Finally, calculate the average surface roughness of six groups of specimens under different stresses. The measurement results, which are shown in Table 3, indicate that the surface roughness of the tangential and axial directions of the fatigue specimen increases with the contact stress.
The surface roughness of the axial directions of the fatigue specimen was further measured and analyzed, and surface roughness curves under different contact stresses were obtained as shown in Figure 8. It can be seen that the surface roughness of the contact surface of the fatigue specimen exhibits a phenomenon of “small in the middle and large on both sides”. Based on the analysis results in Table 3, it can be seen that the stress on the surface of the specimen shows a trend of “small in the middle and large on both sides”, further proving that stress concentration tends to occur on both sides of the contact surface.
3.2. Analysis of Radial Cross-Section Damage of Specimens
The morphology of the crack originating from the surface to the inside of the main specimen under different contact stresses was analyzed, as shown in Figure 9, and yellow dashed line with arrow crack propagation direction. The cracks in Figure 9a–c propagate downwards at angles of approximately 25°, 30°, and 35° to the surface, respectively. This indicates that the angle of crack propagation increases with the contact stress. Continuing to observe the propagation of cracks under different contact stresses, we found that cracks originating from the surface exhibited similar propagation patterns (Figure 9d). Firstly, cracks propagate towards the interior of the specimen at a certain angle to the surface, then propagate in a direction almost parallel to the surface and finally turn to propagate obliquely upwards. This indicates that cracks originating from the surface can lead to the formation of peeling pits.
The morphology of cracks originating from the subsurface of the specimen under different contact stresses is shown in Figure 10. These cracks are located 101–384 μm away from the surface of the specimen. Unlike the propagation of cracks originating from the surface of the specimen, these cracks propagate along a straight line and are wide in the middle and thin at both ends without extending to the surface of the specimen. This indicates that cracks that originate on the subsurface of the specimen do not have the ability to form peeling pits, or that their propagation rate is lower than that of cracks that originate on the surface of the specimen.
The cross-sectional morphology of the peeling pits on the fatigue specimen was analyzed and is shown in Figure 11, and the yellow dashed line is a partial enlarged image. From this, it can be seen that there are cracks at the bottoms of the peeling pits under different contact stresses, and these cracks propagate in a relatively disorderly manner, different from the crack propagation mode that occurs on the surface and subsurface of the specimen. In addition, a large number of secondary cracks are generated during the propagation process, indicating that the depth of the peeling pit will continue to increase with the continued action of cyclic load.
As shown in Figure 12, the further magnification of the local crack reveals the presence of many small granular pieces of debris inside the crack, and a closure phenomenon can be observed during the crack propagation process at location ➀. This indicates that there is mutual friction between the crack surfaces in the rolling contact fatigue specimen under cyclic loading.
The metallographic structure of the specimen corroded with a 4% nitric acid alcohol solution was observed under an optical microscope, as shown in Figure 13. It can be seen that the microstructure of the roll is mainly composed of pearlite and cementite distributed in phases. The pearlite structure is fine-lamellar in nature while the cementite structure has a fine strip shape.
The cross-section of the failed specimen under contact stresses of 1300 MPa and 1500 MPa was subjected to corrosion treatment, as shown in Figure 14. In Figure 14a, cracks generated under low cyclic load mainly propagate along the pearlite and the interface between pearlite and cementite. In Figure 14b, under high cyclic load, in addition to cracks at the metallographic interface, a large number of small cracks are also distributed on the cementite structure. This indicates that when the contact stress reaches a certain level, the crack will propagate through the cementite structure in addition to spreading along the metallographic interface.
Figure 15 shows the SEM morphology of the cross-sectional structure under different contact stresses. From Figure 15b,c, it can be seen that the pearlite area closer to the surface of the specimen is darker compared to the interior while there is no significant change in the cementite area. From Figure 15a,b, it can be seen that the near-surface structure of the specimen will not change under contact stress less than 1300 MPa but will change when it reaches 1400 MPa. In addition, when the contact stress values are 1400 MPa and 1500 MPa, the distances between the near-surface change tissue and the specimen surface are about 50 μm and 65 μm, respectively. This indicates that the depth of change tissue near the surface of the specimen increases with the contact stress.
4. Discussion
4.1. Influence of Contact Stress on the Damage of Fatigue Specimens
At present, there are two viewpoints on the location of crack initiation. The first is that cracks originate on the surfaces of parts, represented by the “ratchet effect”. Most experts and scholars believe that the ratchet effect causes the plastic deformation of materials, leading to the generation of cracks, and friction is the main reason for the ratchet effect. Under the action of friction, shear stress is generated on the surface of the material, and the material eventually forms cracks under the repeated action of shear stress [18,19]. The second viewpoint believes that the initial cracks form on the subsurface, and its representative theory is that the internal structure of the material is uneven, with defects and inclusions present [20,21]. Ekberg’s [22] study showed that subsurface defects are the main causes of subsurface cracks mainly located 3–5 mm away from the material surface. When the material surface is subjected to tangential forces, a shear strain stress field is formed on the surface and inside the material. When the internal deformation of the material reaches the toughness limit, voids will appear, resulting in the formation of internal cracks. Both of these viewpoints are reflected in Figure 9 and Figure 10, but it should be pointed out that the distance between the subsurface crack initiation and the surface of the specimen was only 101–384 μm, which was much less than 3–5 mm.
As can be seen from the above, although cracks originate on both the surface and subsurface of the specimen, the peeling pits are mainly caused by the propagation of surface cracks. In addition, the main role of cementite is to improve the wear resistance and hardness of the material, but it will also increase the brittleness of the material [23], and compared with cementite, pearlite is relatively soft, with low hardness and strength. Therefore, under cyclic loading, the deformation of pearlite and cementite is inconsistent due to the difference in performance, and cracks can easily spread along the interface of pearlite and cementite. Furthermore, due to the tendency of stress concentration on both sides of the contact surface of the specimen, cracks are more likely to initiate at the edge of the contact surface (Figure 7), resulting in peeling pits (Figure 4).
The macroscopic damages on the surface of the fatigue specimen of an AD180 high-carbon semi-steel roll are peeling pits and pitting corrosion, and the area and depth of peeling pits, as well as the amount of pitting corrosion, increase with the contact stress. For peeling, this is because an increase in contact stress will lead to an increase in shear stress and compressive stress, and an increase in shear stress will promote the occurrence of peeling, and an increase in compressive stress will lead to an increase in the crack initiation angle. Therefore, high contact stress will increase the depth and angle of crack propagation in rolling contact fatigue specimens, leading to the formation of larger peeling pits. For pitting corrosion, this is due to the small cracks generated on the surface of the material under pressure, and the increase in friction force will promote the generation of small cracks.
The elastic deformation between the contact surfaces of components will increase with the load [24], leading to an increase in the contact area between components and an increase in frictional force, resulting in the generation and development of pitting corrosion. It should be noted that the microdamage to the contact surface under low stress mainly manifests as plow grooves while under high stress, it manifests as plow grooves and delamination, but the plowing is not obvious. This is because the friction between the contact surfaces of the fatigue specimens generates abrasive particles. When the two specimens maintain relative motion, the abrasive particles are plowed into the softer material to form a plow groove. As the contact stress increases, the abrasive particles are carried away, resulting in less obvious plow groove damage but intensifying wear, and the surface undergoes plastic deformation (Figure 6b), making the contact surface of the sample rougher.
Based on a rolling contact fatigue failure analysis of non-carbide bainitic high-carbon steel, Qiu Lining et al. [25] pointed out that when the experimental stress changed from a low contact stress of 1.8 GPa to a high contact stress of 2.6 GPa, the surface roughness of the sample increased, and the results in Section 3.1 above also show that the surface roughness increased with the contact stress; thus, the two results are consistent. The roughness curves (Figure 8) show that both sides of the fatigue sample have high roughness, and studies have shown that the increase in roughness can easily cause stress concentration on the surface of the components [26], thus reducing the fatigue life of the components and proving that both sides of the sample are more prone to damage under the effect of stress concentration.
4.2. Influence of Contact Stress on the Surface Structure of Fatigue Specimens
The near-surface pearlite structure of the fatigue specimen experiences changes under cyclic loading, resulting in darker areas where the structure is called troostite or extremely fine pearlite [27,28,29]. According to the above results, the near-surface structure of an AD180 high-carbon semi-steel roll will undergo structural changes when the contact stress reaches 1400 MPa, that is, from pearlite to troostite. This indicates that troostite will only form when the contact stress reaches a certain level, which means that pearlite will be refined under cyclic loading.
At the same depth near the surface of fatigue specimens, the grain morphology and dislocation density were analyzed under different contact stresses, as shown in Figure 16.
According to Figure 16, the average grain sizes under contact stresses of 1300 Mpa and 1400 Mpa were 6.83 μm and 6.10 μm, respectively, which confirms the rule that the grain refinement becomes more pronounced with the increase in contact stress. The dislocation density of the subsurface structure of the specimen changes under cyclic loading. Under contact stresses of 1300 Mpa and 1400 Mpa, the average dislocation densities of ferrite in pearlite were 2.77 × 10¹⁴/m2 and 4.33 × 10¹⁴/m2, respectively, and the average dislocation densities of cementite in pearlite and cementite were 0.74 × 10¹⁴/m2 and 0.82 × 10¹⁴/m2. Thus, the dislocation density on the secondary surface of the fatigue specimen increases with the contact stress. Some studies have shown that the dislocation caused by deformation increases the possibility of crack initiation, so the high fault density caused by high stress will accelerate the fatigue damage of the sample [30].
At different subsurfaces of the specimens, the grain morphology and dislocation density were analyzed under same contact stress, as shown in Figure 17. Among them, the subsurface depth of the analyzed fatigue specimen in Figure 17a was smaller than that in Figure 17b. By comparing the two, it can be seen that the subsurface closer to the specimen surface had more fine grains and smaller grain sizes. In Figure 17a,b, the average dislocation densities of ferrite in pearlite are 2.78 × 10¹⁴/m2 and 1.93 × 10¹⁴/m2, respectively, and the average dislocation densities of cementite in pearlite and cementite are 0.52 × 10¹⁴/m2 and 0.43 × 10¹⁴/m2, which indicates that the dislocation density on the subsurface of the fatigue specimen decreases with increasing depth. Because grain refinement means a decrease in grain size, an increase in grain boundary area, and an increase in grain boundary energy, it has a strengthening effect and promotes an increase in specimen hardness [31,32], and the increase in dislocation density can hinder the movement of subsequent dislocations, thereby producing dislocation strengthening effects [33]. It can be inferred that the hardness of the specimen cross-section gradually decreases with increasing cross-sectional depth, and the grain size at the same distance from the specimen surface decreases with increasing contact stress.
The hardness of the specimen cross-section was measured every 50 μm from the surface using a Vickers hardness tester, and the hardness curve shown in Figure 18 was obtained. By observing the variation pattern of the hardness of the specimen cross-section, we found that the surface hardness of the specimen increases with the contact stress while the hardness of the subsurface layer gradually decreases with the increase in depth and finally tends to be consistent. This result indicates that the rolling contact fatigue specimen of an AD180 high-carbon semi-steel roll undergoes hardening under cyclic loading. The depths of the hardened layer at 1300 MPa, 1400 MPa, and 1500 MPa were approximately 550 μm, 650 μm, and 680 μm, respectively. This indicates that as the contact stress increases, the depth of the hardened layer of the specimen gradually increases. In addition, as shown in Figure 18, the near-surface hardness of the specimen increased with the contact stress, which was consistent with the above results.
5. Conclusions
This study used AD180 high-carbon semi-steel-roll steel as a test material to carry out a rolling contact fatigue test under different contact stresses and compare the resulting pitting corrosion, spalling pits, and other types of damage to samples. The influence of contact stress on the damage to fatigue samples and the surface structures of samples was discussed. This research is helpful to further understand the fatigue behavior of rolls. The research conclusions are as follows:
- (1)
- The main forms of fatigue damage of an AD180 high-carbon semi-steel roll are peeling, pitting corrosion, and plowing while the surface of the roll also exhibits delamination and plastic deformation characteristics under high contact stress. Among these, peeling causes the most severe damage to the specimen and is the main form of specimen failure.
- (2)
- The surface roughness (axial and tangential) of the rolling contact fatigue specimen and the area and depth of the peeling pits increase with the contact stress.
- (3)
- The crack initiation at the surface edge of the rolling contact fatigue specimen is the main reason for the formation and distribution of peeling pits on both sides of the contact surface. Under low cyclic load, cracks mainly propagate along the pearlite and at the interface between pearlite and cementite. Under high cyclic loads, cracks will also propagate along the cementite.
- (4)
- Repeated cyclic loading can refine the grain size of the specimen, increase the dislocation density, and thus increase the surface hardness. The cross-sectional hardness of the specimen decreases with an increasing depth and gradually stabilizes.
On the basis of the above research, the relationship between the microstructure and roll damage of the AD180 high-carbon semi-steel roll can be further studied to provide new possible approaches to improving the roll’s service life.
Author Contributions
Conceptualization, Y.L. and Z.R.; data curation, L.L. and Q.C.; formal analysis, Y.L. and H.H.; methodology, Z.R.; validation, Z.Z. and Y.L.; writing—original draft, Y.L.; writing—review and editing, L.L., Q.C. and H.H. All authors have read and agreed to the published version of the manuscript.
Funding
This research was funded by the National Key R&D Program Project (2021YFB3401002), National Natural Science Foundation of China Projects (U23B2099, 52305406), Shanxi Province Science and Technology Innovation Talent Team Special Project (202304051001025), Open Research Fund from the Hai’an & Taiyuan University of Technology Advanced Manufacturing and Intelligent Equipment Industrial Research Institute (2023HA-TYUTKFYF037), Open Research Fund from National Key Laboratory of Metal Forming Technology and Heavy Equipment (S2308100.W15), Natural Science Foundation of Shanxi Province (202303021212046), and Funding Project of Central Guiding for Local Science and Technology Development (236Z1024G).
Data Availability Statement
The data presented in this study are available on request from the corresponding author. The data are not publicly available due to privacy.
Conflicts of Interest
The authors declare no conflict of interest.
References
- Ringsberg, J.W.; Bergkvist, A. On propagation of short rolling contact fatigue cracks. Fatigue Fract. Eng. Mater. Struct. 2003, 26, 969–983. [Google Scholar] [CrossRef]
- Gao, B.; Tan, Z.; Liu, Z.; Gao, G.; Zhang, M.; Zhang, G.; Bai, B. Influence of non-uniform microstructure on rolling contact fatigue behavior of high-speed wheel steels. Eng. Fail. Anal. 2019, 100, 485–491. [Google Scholar] [CrossRef]
- Liu, C.-P.; Zhao, X.-J.; Liu, P.-T.; Xu, C.; Ren, R.-M. Influence of slip ratio on worn-surface microstructure and fatigue wear behavior of D2 wheel steel. J. Iron Steel Res. Int. 2018, 25, 1278–1286. [Google Scholar] [CrossRef]
- Xia, Z.; Wu, D.; Zhang, X.; Wang, J.; Han, E.-H. Rolling contact fatigue failure mechanism of bearing steel on different surface roughness levels under heavy load. Int. J. Fatigue 2023, 179, 108042. [Google Scholar] [CrossRef]
- Liu, Y.; Tan, Z.; Tian, Y.; Zhu, J.; Zhang, M.; Zhang, M.; Zhao, H. Temperature-dependent crack induced by microstructure evolution in 20Mn2SiMoCuV bainite wheel steel. Eng. Fail. Anal. 2022, 140, 106593. [Google Scholar] [CrossRef]
- Hanting, D. Failure Analysis for Roll Surfacing; Wuhan University of Technology: Wuhan, China, 2008. [Google Scholar]
- Wang, D.; Mou, Z.; Yang, Z.; Xu, Y.; Xu, H.; Song, X. Fracture failure analysis of high-speed steel composite rolls in hot strip rolling mills. Steel Roll. 2021, 38, 74–79. [Google Scholar]
- Hou, P. Failure analysis of crack on working surface of main roller for wheel. Heavy Cast. Forg. 2020, 6, 47–49. [Google Scholar]
- Chen, X.; Liu, X.; Tao, C.; Li, Z. Study on damage behavior and failure mechanism of rollers. Fail. Anal. Prev. 2018, 13, 60–66. [Google Scholar]
- Zhou, C.; Wu, F.; Zhang, Z.; Zhang, P.; Zhang, L. Fracture failure analysis and research on super-large-diameter roll. Eng. Fail. Anal. 2023, 145, 107043. [Google Scholar] [CrossRef]
- Failure Analysis of Si3N4 rolls for wire hot rolling by numerical simulation of thermal and mechanical stresses. Key Eng. Mater. 2005, 523, 94–101.
- Zhao, X.; Chen, Q.; Liu, Y.; Qiu, X.; Meli, E.; Rindi, A. Effects of slip ratio and contact stress on rolling contact fatigue of defected rail materials. Eng. Fail. Anal. 2021, 131, 105817. [Google Scholar] [CrossRef]
- Zhang, S.-Y.; Spiryagin, M.; Lin, Q.; Ding, H.-H.; Wu, Q.; Guo, J.; Liu, Q.-Y.; Wang, W.-J. Study on wear and rolling contact fatigue behaviours of defective rail under different slip ratio and contact stress conditions. Tribol. Int. 2022, 169, 107491. [Google Scholar] [CrossRef]
- Kang, J.-J.; Xu, B.-S.; Wang, H.-D.; Wang, C.-B. Influence of contact stress on rolling contact fatigue of composite ceramic coatings plasma sprayed on a steel roller. Tribol. Int. 2014, 73, 47–56. [Google Scholar] [CrossRef]
- Zhang, J. Formation and prevention of crack and slag inclusion defects in high carbon alloy semi-steel roll Ring. Foundry Equip. Technol. 2017, 6, 71–75. [Google Scholar]
- Wang, G.J.; Bai, S.N.; Ma, X.L. Analysis and solution of outer circle mottle problem of semi-steel roller ring. China Foundry Mach. Technol. 2022, 57, 64–67. [Google Scholar]
- Nannan, S.; Yikun, L.; Yunlong, B.; Xiuhong, K.; Lijun, X.; Dianzhong, L. Computer simulation of core filling process of cast high speed steel roll. China Foundry 2009, 6, 314–318. [Google Scholar]
- Zhang, W.; Guo, J.; Liu, Q. An investigationof rails rolling contact fatigue. Lubr. Eng. 2005, 6, 195–199. [Google Scholar]
- She, L. Study on Rolling Contact Fatigue Properties of Bainite Bearing Steels; Yanshan University: Qinhuangdao, China, 2015. [Google Scholar]
- Zhu, W. Study on Wear Mapping and Wear Transition Mechanism of CL60 Wheel Material; Southwest Jiaotong University: Chengdu, China, 2018. [Google Scholar]
- Wang, B.; Zhang, Y.; Zuo, H.; Wang, H. Study on the influence of compressive stress on the compressive shear crack propagation. Chin. J. Theor. Appl. 2019, 51, 845–851. [Google Scholar]
- Ekberg, A.; Marais, J. Effects of imperfections on fatigue initiation in railway wheels. Proc. Inst. Mech. Eng. Part F J. Rail Rapid Transit 2000, 214, 45–54. [Google Scholar] [CrossRef]
- Cao, G.; Guo, H.; Yang, J.; Bai, S.; Wang, B.; Wang, Y. Research on graphite alloy steel roll ring for H-beam. Tianjin Metall. 2020, 6, 52–54. [Google Scholar]
- Wang, W.; Guo, J.; Liu, Q. Study on adhesion characteristics of wheels/rails under different Conditions. J. Mech. Eng. 2012, 48, 100–104. [Google Scholar] [CrossRef]
- Qiu, L.N.; Li, S.X.; Jiang, G.H.; Yu, F.; Ru, S.Y. Fatigue analysis of carbide-free bainite high carbon steel under rolling contact fatigue. J. Ningbo Univ. 2021, 34, 55–60. [Google Scholar]
- Wang, X.Y.; Huang, C.Z.; Zou, B.; Liu, G.L.; Zhu, H.T.; Wang, J. Experimental study of surface integrity and fatigue life in the face milling of inconel 718. Front. Mech. Eng. 2017, 13, 243–250. [Google Scholar] [CrossRef]
- Bian, Y.; Liang, A.; Zhang, Z.; Chen, Z. Mechanism analysis of overloading contact test. J. Tongji Univ. 2017, 45, 1009–1015. [Google Scholar]
- Wang, W.J.; Guo, J.; Liu, Q.Y. Effect of contact stress on rolling frition and wear behaviour of wheel-rail material. Tribology 2011, 31, 352–366. [Google Scholar]
- Jones, A.B. Metallographic Observations of Ball Bearing Fatigue Phenomenon; American Society for Testing and Materials: Philadelphia, PA, USA, 1947; pp. 35–52. [Google Scholar]
- Masoud, M.; Mahdieh, S.; Gregor, M. Combined thermal desorption spectroscopy, hydrogen visualiza-tion, HRTEM and EBSD investigation of a Ni–Fe–Cr alloy: The role of hydrogen trapping behavior in hydrogen-assisted fracture. Mater. Sci. Eng. A 2022, 848, 143428. [Google Scholar]
- Apparao, K.C.; Bannaravuri, P.K.; Pulisheru, K.S.; Francis, E.D.; Sunny, K.A.; Rao, G.B.; Birru, A.K. Effect of novel grain refiner and Ni alloying additions on microstructure and mechanical properties of Al-Si9.8-Cu3.4 HPDC castings–optimization using Multi Criteria Decision making approach. Mater. Sci.-Pol. 2022, 40, 9–24. [Google Scholar] [CrossRef]
- Fan, W.; Bai, Y.; Zuo, G.; Hao, H. Enhanced grain refinement and mechanical properties of AZ91 alloy by a novel Al-5.1 V-2.3B refiner containing VB2 and VB particles. Addit. Manufactuing 2023, 225, 111474. [Google Scholar] [CrossRef]
- Niu, T.; Wang, X.; Wu, X. Effect of shot peening process on surface properties and wear behavior of 4Cr5Mo2V steel. Heat Treat. Met. 2023, 48, 153–159. [Google Scholar]
Figure 1.
Schematic diagram of the test process: (a) AD180 high-carbon semi-steel roll, (b) cylindrical bar, (c) standard specimens, (d) size and accuracy, and (e) specimen assembly.
Figure 1.
Schematic diagram of the test process: (a) AD180 high-carbon semi-steel roll, (b) cylindrical bar, (c) standard specimens, (d) size and accuracy, and (e) specimen assembly.

Figure 2.
Sampling locations for topographical observations.

Figure 3.
Macroscopic morphology of the failed specimen.

Figure 4.
Peeling pit morphology under different stresses: (a) 1300 MPa, (b) 1400 MPa, and (c) 1500 MPa.
Figure 4.
Peeling pit morphology under different stresses: (a) 1300 MPa, (b) 1400 MPa, and (c) 1500 MPa.
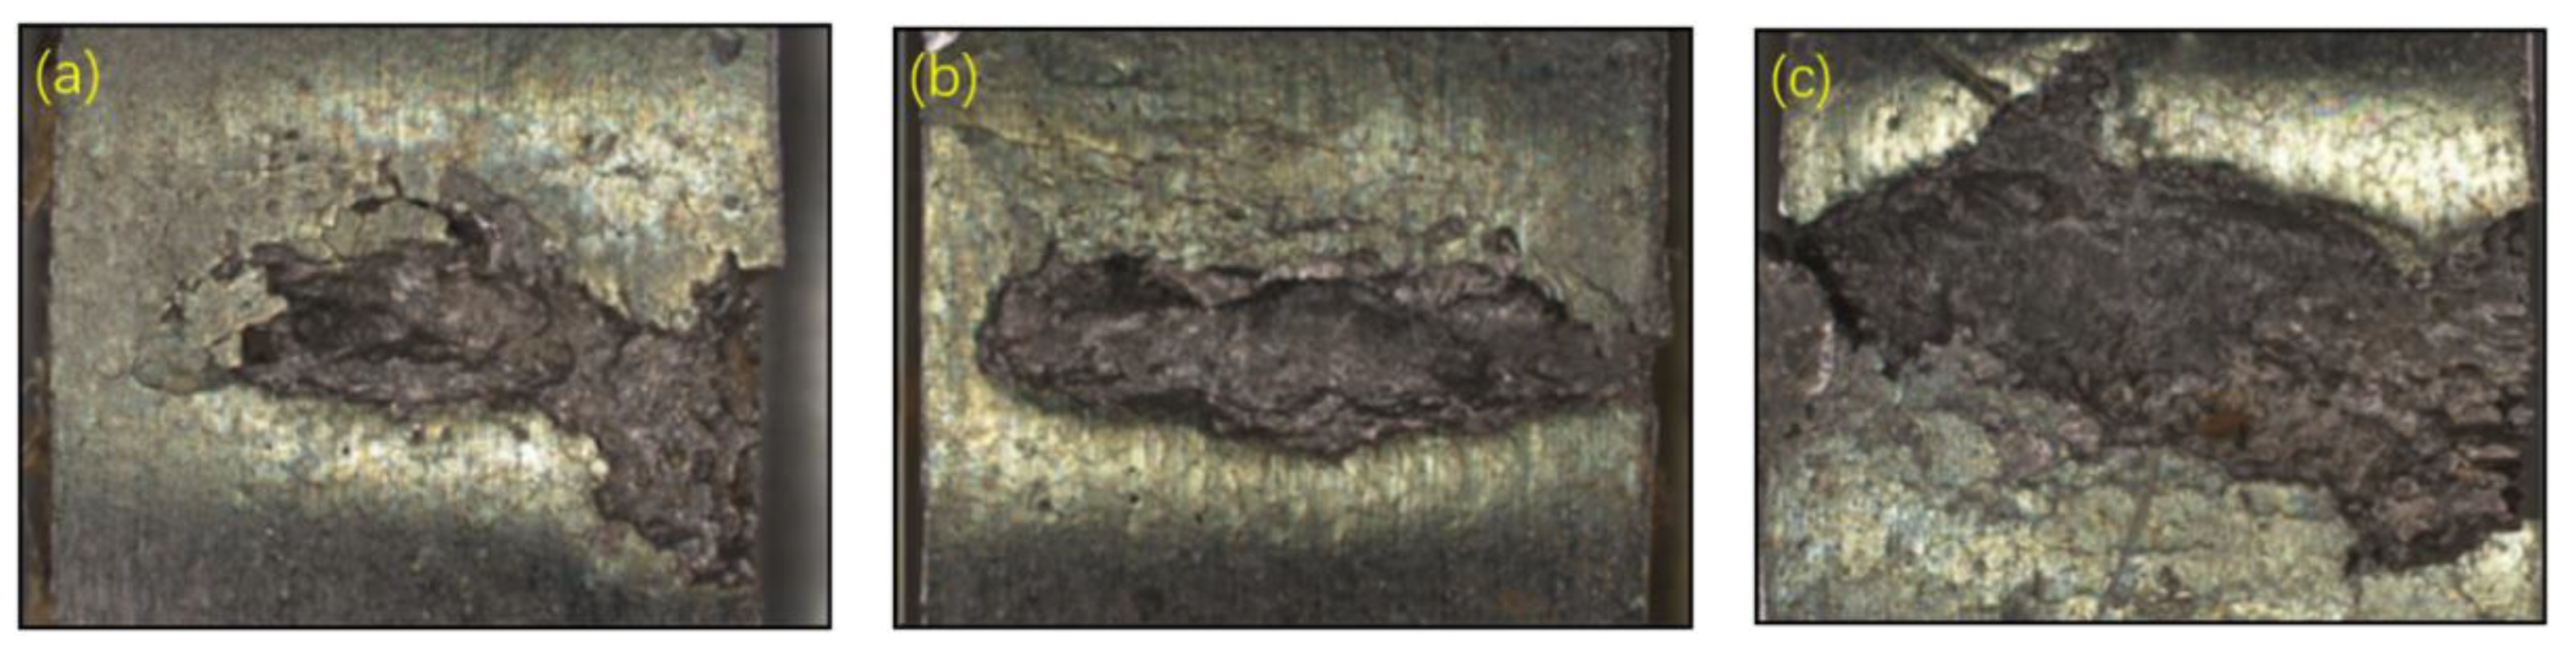
Figure 5.
Morphology of pitting corrosion under different contact stresses: (a) 1300 MPa, (b) 1400 MPa, and (c) 1500 MPa.
Figure 5.
Morphology of pitting corrosion under different contact stresses: (a) 1300 MPa, (b) 1400 MPa, and (c) 1500 MPa.

Figure 6.
Surface microstructure of fatigue specimens: (a) 1300 MPa and (b) 1500 MPa.

Figure 7.
Surface crack morphology of fatigue specimens: (a) friction trace, (b) friction trace and transverse crack, (c) locally enlarged images of “A”, and (d) locally enlarged images of “B”.
Figure 7.
Surface crack morphology of fatigue specimens: (a) friction trace, (b) friction trace and transverse crack, (c) locally enlarged images of “A”, and (d) locally enlarged images of “B”.

Figure 8.
Surface roughness curves of the specimen along the axial direction.

Figure 9.
Morphology of cracks originating from the surface of the specimen under different contact stresses: (a) 1300 MPa, (b) 1400 MPa, (c) 1500 MPa, and (d) crack propagation path.
Figure 9.
Morphology of cracks originating from the surface of the specimen under different contact stresses: (a) 1300 MPa, (b) 1400 MPa, (c) 1500 MPa, and (d) crack propagation path.

Figure 10.
Morphology of cracks originating from the subsurface of the specimen under different contact stresses: (a) 1300 MPa, (b) 1400 MPa, and (c) 1500 MPa.
Figure 10.
Morphology of cracks originating from the subsurface of the specimen under different contact stresses: (a) 1300 MPa, (b) 1400 MPa, and (c) 1500 MPa.

Figure 11.
Cross-sectional morphology of the peeling pits on the fatigue specimen under different contact stresses: (a) 1300 MPa, (b) 1400 MPa, and (c) 1500 MPa.
Figure 11.
Cross-sectional morphology of the peeling pits on the fatigue specimen under different contact stresses: (a) 1300 MPa, (b) 1400 MPa, and (c) 1500 MPa.

Figure 12.
Morphology of internal cracks.
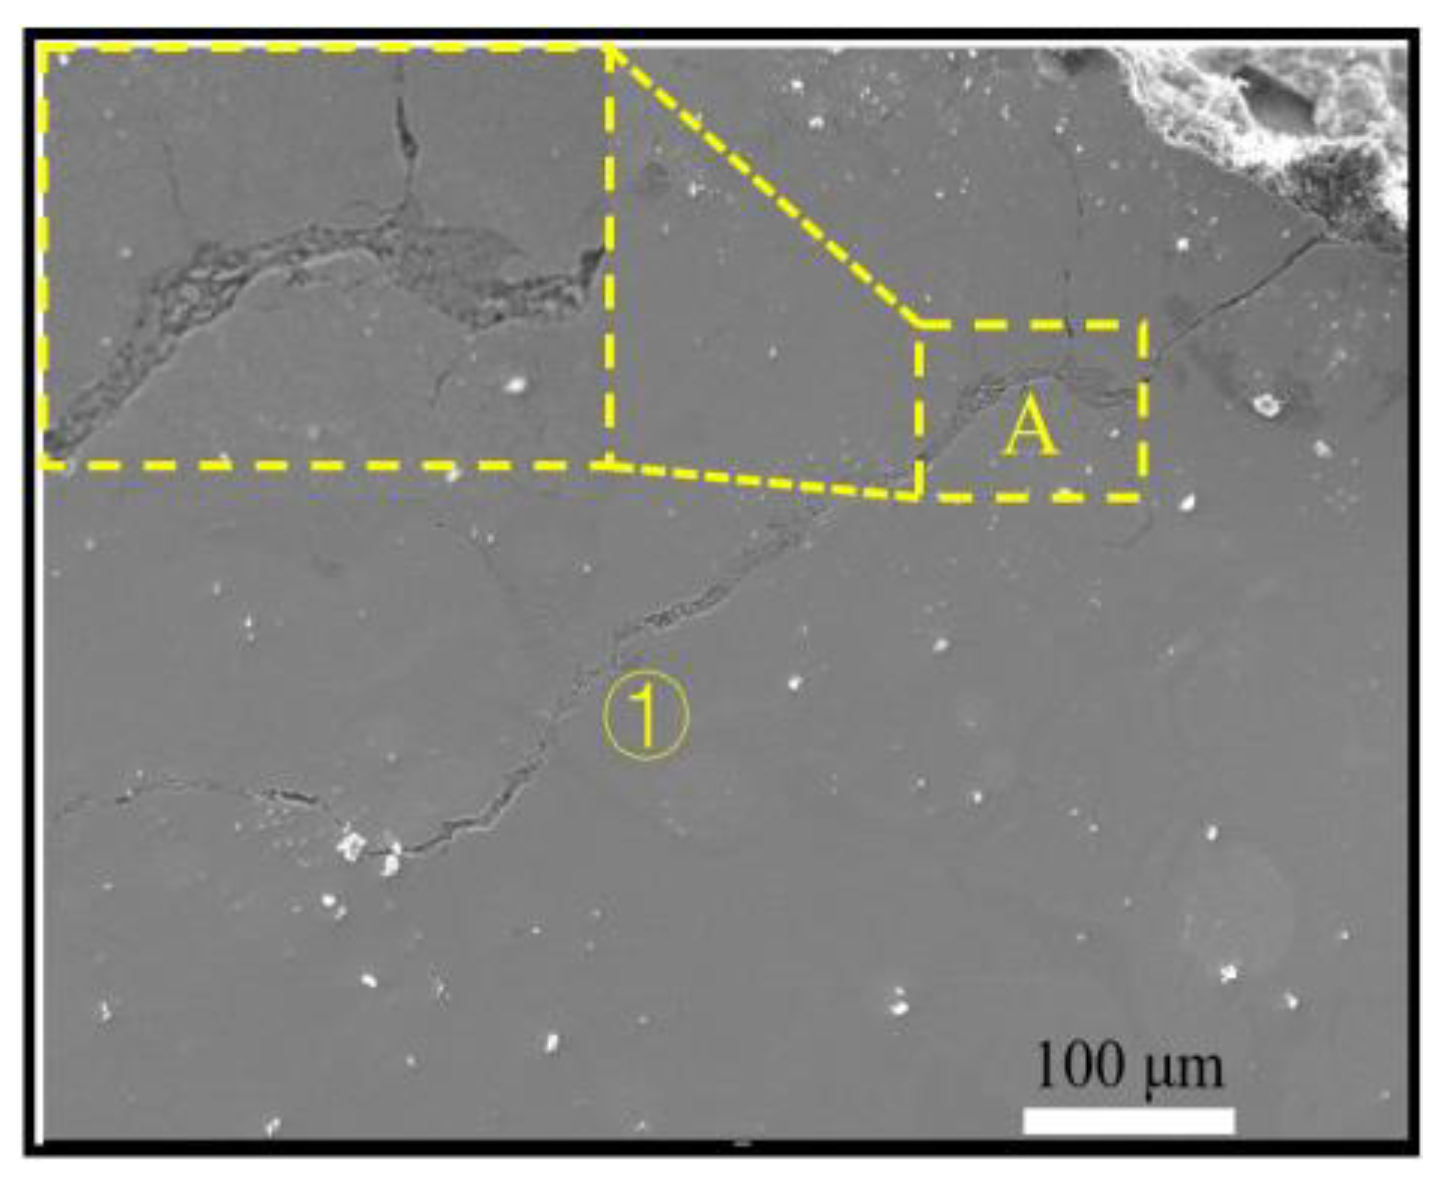
Figure 13.
Metallographic structure of AD180 high-carbon semi-steel roll.

Figure 14.
Metallographic structure of the cross-section of the failed specimen: (a) 1300 MPa and (b) 1500 MPa.
Figure 14.
Metallographic structure of the cross-section of the failed specimen: (a) 1300 MPa and (b) 1500 MPa.

Figure 15.
SEM morphology of cross-sectional structure under different contact stresses: (a) 1300 MPa, (b) 1400 MPa, and (c) 1500 MPa.
Figure 15.
SEM morphology of cross-sectional structure under different contact stresses: (a) 1300 MPa, (b) 1400 MPa, and (c) 1500 MPa.

Figure 16.
Grain morphology and grain size bar chart of fatigue specimens under different contact stresses: (a) 1300 MPa and (b) 1400 MPa.
Figure 16.
Grain morphology and grain size bar chart of fatigue specimens under different contact stresses: (a) 1300 MPa and (b) 1400 MPa.

Figure 17.
Grain morphology and grain size bar charts of fatigue specimens at different subsurfaces: (a) subsurface depth 1 and (b) subsurface depth 2.
Figure 17.
Grain morphology and grain size bar charts of fatigue specimens at different subsurfaces: (a) subsurface depth 1 and (b) subsurface depth 2.

Figure 18.
Hardness curve of specimen cross-section.


Table 1.
Chemical composition of AD180 high-carbon semi-steel roll (Wt%).
| Elements | C | Si | Mn | P | S | Cr | Ni | Mo |
|---|---|---|---|---|---|---|---|---|
| Actual chemical composition content | 2.2 | 0.5 | 0.9 | <0.035 | <0.03 | 1.7 | 1.4 | 0.5 |
Table 2.
Depths of peeling pits on surfaces of specimens under different contact stresses.
| Contact Stress [MPa] | Depth Data of Each Group [μm] | ||||||
|---|---|---|---|---|---|---|---|
| 1 | 2 | 3 | 4 | 5 | 6 | Average Depth | |
| 1300 | 305 | 311 | 247 | 327 | 396 | 207 | 298.83 |
| 1400 | 339 | 280 | 357 | 460 | 246 | 236 | 319.67 |
| 1500 | 545 | 404 | 420 | 362 | 233 | 363 | 387.83 |
Table 3.
Surface roughness of fatigue specimens.
| Contact Stress [MPa] | 1 | 2 | 3 | 4 | 5 | 6 | Average Value [μm] | |
|---|---|---|---|---|---|---|---|---|
| Tangential roughness | 1300 | 3.215 | 3.427 | 3.620 | 4.210 | 3.746 | 3.998 | 3.703 |
| 1400 | 4.785 | 4.875 | 4.595 | 4.120 | 4.280 | 4.657 | 4.552 | |
| 1500 | 5.513 | 4.810 | 5.029 | 4.941 | 5.755 | 4.577 | 5.104 | |
| Axial roughness | 1300 | 5.537 | 4.525 | 4.508 | 4.753 | 4.741 | 4.596 | 4.777 |
| 1400 | 5.952 | 6.600 | 5.130 | 4.286 | 4.706 | 5.546 | 5.370 | |
| 1500 | 5.997 | 5.530 | 6.685 | 6.876 | 8.058 | 6.519 | 6.611 | |
Disclaimer/Publisher’s Note: The statements, opinions and data contained in all publications are solely those of the individual author(s) and contributor(s) and not of MDPI and/or the editor(s). MDPI and/or the editor(s) disclaim responsibility for any injury to people or property resulting from any ideas, methods, instructions or products referred to in the content. |
© 2024 by the authors. Licensee MDPI, Basel, Switzerland. This article is an open access article distributed under the terms and conditions of the Creative Commons Attribution (CC BY) license (https://creativecommons.org/licenses/by/4.0/).
Share and Cite
MDPI and ACS Style
Liu, Y.; Liu, L.; Cheng, Q.; Hou, H.; Zhang, Z.; Ren, Z. Analysis of the Influence of Contact Stress on the Fatigue of AD180 High-Carbon Semi-Steel Roll. Metals 2024, 14, 548. https://doi.org/10.3390/met14050548
AMA Style
Liu Y, Liu L, Cheng Q, Hou H, Zhang Z, Ren Z. Analysis of the Influence of Contact Stress on the Fatigue of AD180 High-Carbon Semi-Steel Roll. Metals. 2024; 14(5):548. https://doi.org/10.3390/met14050548
Chicago/Turabian StyleLiu, Yaxing, Lixin Liu, Qian Cheng, Haipeng Hou, Zehua Zhang, and Zhongkai Ren. 2024. "Analysis of the Influence of Contact Stress on the Fatigue of AD180 High-Carbon Semi-Steel Roll" Metals 14, no. 5: 548. https://doi.org/10.3390/met14050548
Note that from the first issue of 2016, this journal uses article numbers instead of page numbers. See further details here.