

A Numerical Study of the Performance of Point Absorber Wave Energy Converters

1
Department of Chemical Engineering, Indian Institute of Technology Roorkee, Roorkee 247667, India
2
Energy and Sustainability, Cranfield University, Cranfield MK43 0AL, UK
*
Authors to whom correspondence should be addressed.
Appl. Sci. 2024, 14(10), 4039; https://doi.org/10.3390/app14104039
Submission received: 7 March 2024
/
Revised: 4 May 2024
/
Accepted: 6 May 2024
/
Published: 9 May 2024
(This article belongs to the Special Issue Offshore Wind Turbines and Wave Energy: Modeling, Simulation and Applications)
Abstract
:Free-floating and submerged wave energy converters (SWECs) are regarded as promising technologies for renewable energy production. These converters rely on a heave-motion buoy to capture the kinetic energy of ocean waves and convert it into electrical energy through power conversion systems. To better understand the impact of various factors on power generation and efficiency, the effects of different buoy shapes (rectangular, circular cylinder, and trapezoidal fin), submergence depths (0, 0.1, and 0.2 m), wave heights (0.04, 0.06, and 0.1 m), and spring stiffness (50 and 100 N/m) were investigated. A 2D numerical wave tank with a buoy was simulated, and the results were validated against experimental data. Information on vorticity, vertical displacement, power absorption, and efficiency are provided. The findings indicate that the buoy shape and wave height significantly affect power absorption and efficiency. Additionally, this study reveals that increasing submergence leads to higher power absorption and lower conversion efficiency.
1. Introduction
Wave energy converters (WECs) can capture and convert energy from ocean waves into electrical energy. Different types of WECs exist, including oscillating water columns, point absorbers, and overtopping systems. The design investigated here is a point absorber for offshore applications [1,2,3]. This system consists of a buoy interacting with ocean waves and different mechanical units, which convert the buoy’s movement into electricity. It harnesses the energy from the sea in all directions and is small in shape, with the buoy generally floating on the water surface.
Frequent changes in wave conditions, harsh weather, and storms can make a buoy’s operation unpredictable. To avoid these problems, submerged wave energy converter (SWEC) devices are designed. They are typically attached to a static platform [2,4,5], are well suited for offshore applications, and can be deployed in large arrays to generate significant amounts of electricity.
SWECs should withstand extreme wave loads and corrosion from seawater. Although submergence increases their survivability in harsh conditions, as negative effects due to strong wind and rain are limited, their hydrodynamic properties are affected, for instance, the maximum absorbed power [6].
A cylindrical submerged wave energy converter was investigated in [7,8], and the authors demonstrated that the linear theory fails to predict its performance for steep waves. The effects of the phase shift, cylinder radius, wave height, and wave period on the efficiency of a similar system were considered in [9]. The authors used the potential flow theory for their simulation work and found that the elliptical motion of the WEC was more efficient than the horizontal and vertical ones.
The performance of different point absorber converters was studied in terms of energy extraction, bandwidth, and optimal size for a particular wave condition in [6]. A sphere, a vertical cylinder, an ellipsoid, and a chamfered cylinder were simulated at different submergence depths (0, 3.75, and 6.5 m) using the Boundary Element Method (BEM) under regular and irregular waves. The authors showed that the sphere and the vertical cylinder displayed lower energy conversion than the other two systems.
The impact of pitch on the power extraction capabilities of a submerged cylindrical WEC with a radius of 12.5 m and a height of 5 m using a weak-scatterer model was studied in [10]. The authors considered linear and nonlinear potential theories for water and submergence depths of 6.5 and 30 m. The results show that using the nonlinear theory improves the WEC performance due to more stable pitch adjustments, resulting in better power absorption. The importance of the controller and geometric design aspects in the development of multi-mode WECs is highlighted, as these factors significantly affect the system’s dynamics. The authors also investigated the design of a planar three-tethered WEC, focusing on optimizing the surge, heave, and pitch hydrodynamic modes to maximize power absorption.
Most studies of submerged point absorbers are based on the BEM [11]. This approach shows drawbacks due to limiting assumptions, the flow being considered linear and irrotational, and viscosity effects being neglected. The nonlinear effects of point absorber wave energy converters can, however, be modeled through Computational Fluid Dynamics (CFD). There are two approaches: conventional mesh-based methods (typically Eulerian) and mesh-free methods, such as Smooth Particle Hydrodynamics (SPH), which is a Lagrangian approach. For the first approach, the Finite Volume Method (FVM) is generally used to track the nonlinear interaction between a floating object and water waves, with the coupling of the fluid and the rigid body. For the SPH method, the fluid is modeled as a collection of particles, and the solid body is modeled through a boundary representation.
The SPH approach is beneficial for simulating the behavior of wave energy converters and other similar systems where fluid–solid interactions (FSIs) are critical [12,13]. SPH was used in [14] for a top-mounted pitching absorber simulation, improving displacement predictions. SPH models also prove robust in handling complex wave phenomena. However, they do not seem to be considered much for submerged point absorber wave energy converters.
The flow around a submerged buoy was studied through a mesh-based CFD approach in [15]. Three different submerged cylinder diameters were considered (1.4, 1.8, and 2.1 m), with the same mass of 2.9 tonnes and a buoy volume of 8.4 m3. The authors compared the buoy geometries’ responses with four modeling approaches: a viscous CFD simulation, the Morison equation with drag force using numerical quadrature, the Morison equation with translation and rotation, and the Morison equation on a vertical cylinder. They concluded that a cylinder with a diameter of 1.4m is the most suitable design for a high buoy displacement. They recommend that the quadrature-based Morison drag method always be used for simulating submerged mooring buoys, as this method shows higher fidelity than others and is more general.
A submerged circular cylinder with a radius of 0.1m with mooring, spring, and damper forces was simulated in [16] using the fast-fictitious-domain method for treating solid objects. The authors used a 1.6 m water depth and a 0.2 m submergence depth for the cylinder, with an inlet wave height of 0.03 m. They performed CFD simulations for various wave frequencies and heights using the Volume-of-Fluid (VOF) multiphase model. They established that, as the wave height rises, the optimal performance of the submerged cylinder WEC is achieved with larger damping coefficients than those calculated with the linear theory.
CFD can therefore be used to simulate floating-point absorbers, but limited information is currently available on submerged point absorbers. SPH, while effective for the problem at hand, is computationally expensive compared to a mesh-based approach. Although past CFD studies of immersed point absorbers were mostly based on a cylindrical buoy shape, the performance of a floating-point absorber depends on the floating buoy [17]. The current investigation aimed to identify the most efficient float shape for a SWEC through a mesh-based CFD analysis using a VOF-coupled FSI technique. Various aspects of SWECs were analyzed, especially regarding the optimization of the float design under various wave conditions. The analysis also considered other parameters, such as the submergence depth and spring constant. Finally, power absorption and wave conversion efficiency were investigated.
2. Numerical Model
2.1. Computational Domain and Mesh
The schematic diagram of the two-dimensional (2D) computational domain considered for a single wave energy converter is shown in Figure 1. The domain consists of a 5 m × 0.7 m numerical wave tank, with the 0.3 m × 0.2 m WEC shown in Figure 1a located 2.15 m from the inlet. The entire domain comprises five boundaries: the inlet, outlet, atmosphere, bottom, and WEC.
A hexahedral-based structured mesh consisting of non-uniform cells was generated. Overall, 1.6 million cells were present in the multiregional segmented tank. The overset mesh method was applied to the surroundings of the solid WEC to capture its motion. A coarse mesh was first built in the tank and then refined around the WEC. To minimize mesh deformation, a dynamic mesh technique based on topological change was applied. For the problem simulated here, the cell size in the core of the domain should be larger than the cell surrounding the solid surface; see Figure 1b. The mesh resolution surrounding the WEC was significantly refined, and ten inflation layers were built near the buoy wall, with the thickness of the first layer falling within 0.08–0.085 mm.
2.2. Flow Settings
Figure 2 shows the three WEC submergence depths for three float shapes. Different wave parameters are considered, such as a wave height H = 0.04 m and a time period Tp = 1.2 s. These parameters are used to examine the free-surface elevation of the wave through the empirical expression from Dean and Dalrymple [18]. The expression of the surface elevation is then defined as , where k is the wave number, the angular frequency, t the time, and the phase shift.
The shallow water theory was applied to the absorbed incident wave at the outlet. A wave with the same velocity and height was generated in the opposite direction to cancel out the incident wave [19]. All parameters used in the simulations are provided in Table 1. The rectangular WEC (W1) dimensions and wave conditions considered here are similar to those described in [17].
Two-dimensional transient simulations were carried out with the open-source CFD code OpenFOAM v-2006. Mass and momentum equations were solved with the flow considered incompressible, and the VOF model [20,21,22] was applied to track the water–air interface, similar to the research carried out in [19,23]. The thermophysical properties were thus calculated in each cell of the computational domain using the phase fraction [24], and the interaction between the fluid and the structure was resolved through a finite volume discretization method. The densities of air and water considered are 1.161 and 1000 kg/m3, respectively. A similar approach was applied in [16] to simulate a SWEC in an infinitely deep liquid for a submerged 2D circular cylinder at various wave frequencies.
Newton’s second law was used to investigate the motion of the WEC. The pressure and shear forces of the fluid were applied on the solid surface to generate the total vertical force. The second-order Crank–Nicolson integration scheme was used for the WEC velocity calculation. Similar fluid–motion solver equations are proposed in the literature (see [17,23], for instance).
Four boundaries were defined: the inlet is set as the ‘velocity-inlet’; the outlet and top are defined as ‘pressure outlets’, which are conditions typically considered for an incompressible flow; and the last one (bottom part) is set as a ‘wall’-type condition. A wave was generated at the system inlet, and, as mentioned previously, a wave absorption condition was imposed at the outlet section of the numerical domain for the absorption of the incident wave. A no-slip condition was applied, and no penetration was considered at the walls of the numerical tank (bottom) and other solid surfaces. Finally, atmospheric pressure was applied at the top surface of the tank.
The OpenFOAM ‘OverInterDyMFoam’ solver was used in all simulations. A second-order upwind scheme with linear interpolation was applied for the divergence, gradient, and Laplacian terms in the governing equations. The PIMPLE (Pressure Implicit Method for Pressure-Linked Equations) algorithm was used for pressure–velocity coupling to solve the momentum and continuity equations together in a segregated manner. The PIMPLE algorithm integrates the PISO (inner corrector) and SIMPLE (outer corrector) loops to achieve a fully converged steady-state solution within each time step. The estimated size of the time step can be determined by the Courant number (), where v is the velocity through the shared face between two neighboring cells and the distance between the centers of these two cells. A Courant number value = 0.5 was selected, as in [17], giving a time-step requirement of 0.001s for the mesh size and flow velocity considered.
2.3. Mesh Independence Study and Validation
The numerical results were validated using experimental data published in [11], considering the same wave height, rectangular buoy, and numerical wave tank. The effective density of the rectangular floating buoy considered is 500 kg/m3. A mesh independence study was carried out by plotting the dimensionless vertical displacement (z/d) as a function of the dimensionless time (t/T) obtained for meshes comprising 107,686, 115,660, 140,320, and 126,676 cells; see Figure 3a.
In Figure 3, z represents the center position of the buoy at time t, d is the water tank depth, and T is the wave time period. Meshes comprising 140,320 and 126,676 cells generate the same displacement, which is slightly smaller than that obtained with the 115,660 and 107,686 cell meshes; see Table 2 for information at the maximum displacement, i.e., at t = 1.49 s, corresponding to t/T = 1.241. Although all meshes can be used for the simulation work due to there being little difference in the displacement obtained with each of them, the mesh comprising 115,660 cells was selected in subsequent simulations, as this mesh provides a good compromise between simulation time and accuracy.
The simulated data points obtained with the selected mesh were further compared with the non-dimensional experimental vertical displacement of the rectangular buoy (z/d); see Figure 3b. The simulation results show between a 5 and 12% absolute error in vertical displacement when compared to the measured data, validating the numerical results. It should be noted that a time step of 0.001s provides numerical results in good agreement with the experimental data, so no time-step sensitivity analysis was carried out.
3. Results and Discussion
This study is based on work performed in [17], where the authors considered the same model and validated their numerical results against experimental data. This validated case is thus taken as the base case here. Looking at the results, more parameters affecting power absorption and efficiency are identified, such as the influence of stiffness and wave height [11] on the half-submerged buoy, as highlighted by the authors.
An optimal float shape for a heaving point absorber was also identified via a CFD investigation in [17]. Among the three basic shapes tested (rectangular, hemispherical, and trapezoidal), the rectangular float displayed more vertical displacement, followed by the trapezoidal and hemispherical floats. The rectangular shape was therefore established as one good option for wave energy converters based on pitch motion. The trapezoidal geometry can be optimized further by adding a fin in its bottom region, minimizing the drag and enhancing the lift.
The parameters mentioned above are also key for submerged buoys. The influence of the submergence depth, WEC shape, wave height, and spring constant are thus discussed in the following sections.
Information on submerged WECs in water is, however, now required to enhance energy generation. For this purpose, WECs are considered with a density of 1000 kg/m3 and a weight of 6 kg, keeping the volume constant at 0.006 m3. Figure 2 displays the series of floating and submerged WECs at different submergence depths: ds0 = 0 m, ds1 = 0.1 m, and ds2 = 0.2 m. A rectangular box (W1), a circular cylinder (W2), and a trapezoidal fin (W3) are the shapes of the wave energy converter investigated.
3.1. Effect of Submergence Depth
The motion and forces of the WEC and the effects on the power absorption and efficiency of the WEC topology under different wave conditions are now discussed. The literature shows that a simple rectangular box design provides high displacement and good efficiency at half submergence. The idea here is to assess submergence effects on this particular design. Figure 4 thus shows the influence of the different submergence depths of W1 in water with a wave height H = 0.04 m and a spring constant k2 = 50 N/m.
Figure 4a displays the horizontal displacement Dx of W1 at all three submergence depths. This horizontal displacement is lower at ds2 = 0.2 m. The vertical displacement Dz of W1 is shown in Figure 4b. W1 is seen to initially fall at ds0 = 0 m because of an unbalanced buoyancy force without spring support. After 3 s, the vertical movement of the WEC becomes stable. The heave motion (Dz) is thus stable, with a higher amplitude value at ds0 and ds1 than at ds2.
The sequence of movements for W1 is shown in Figure 5 for one complete wave cycle considering ds0 and ds2. The interaction between the wave and W1 is visible at those submergence depths.
3.2. Effect of WEC Shape
The influence of the WEC design on its movement and forces was analyzed for H = 0.04 m, k2, and ds0. Figure 6a,b display the displacement of the WECs over time in the x- and z-directions. The maximum displacement appears larger for W1 than for W2 and W3 in both the horizontal and vertical directions. The horizontal displacements for W1 and W2 are not very different, though, but the vertical movement is lower for W2. The horizontal displacement of W3 seems about twice as low as those of W1 and W2.
Significant horizontal velocity variations for W1 and W2 can be noticed; see Figure 6c. Figure 6d shows that the velocity differences of W1 and W3 in the vertical direction are marginal. Due to the small vertical displacement of W2, the vertical velocity is also small.
The velocity variations of the WECs can be explained through the vorticity contour plots presented in Figure 7. Vorticity is present at the corners of W1 and W3 but is sparse near W2, as there is not much perturbation inherent to the cylindrical device. It can also be noticed that the pressure is low where high vorticity is present; see Figure 8.
The pressure force exerted by the wave on the WECs in the x-direction is higher for W1 and W2; see Figure 6e. Fx and Fz are two times higher for W2 than for W3. On the other hand, the vertical force Fz exerted on W1 is lower than on W3 due to the higher lift force; see Figure 6f. W3 is at a greater depth, inducing higher hydrostatic pressure. Any smaller or identical displacement requires a large upward vertical force. As a result, the pressure forces in the horizontal and vertical directions are dependent on the hydrostatic force () and higher for W2.
A general relation between the force F, the velocity v, and the displacement/position D of the buoy in the vertical direction can be written. Newton’s second law is used to investigate the motion of the WEC. The pressure and shear forces of the fluid are applied on the solid surface and generate the total vertical force.
where M and are the mass and vertical acceleration of the solid WEC, respectively. The vertical movement of the WEC is calculated as follows:
where n and are the previous and current times, and is the time step. Once the acceleration is known, the vertical velocity and the vertical position can be calculated at the same time . Similar fluid–motion solver equations were used in [17].
The submergence depth of all WECs is now increased. At ds1, the displacement of W3 is more significant than that of W1 and W2 in both the x- and z-directions, as shown in Figure 9a,b. Correspondingly, the trend of velocity Vx in the horizontal direction displays similarities for W1 and W2. The Vx of W3 is lower, while the velocities Vz in the vertical direction for W3 and W1 overlap and are higher than for W2. Figure 9e,f show that the force Fz on W1 and W2 increases with the increase in submergence depth ds1. The force Fx on W1 also increases as the depth ds1 increases. As a result, it appears that the depth of W1 decreases with increased displacement in the z-direction. However, W3 behaves slightly differently, as seen in Figure 6b and Figure 9b.
The effects of submergence ds2 on the displacement and velocity of all WECs are shown in Figure 10. The irregular displacement of W1 in the x- and z-directions increases with depth. However, the horizontal displacements of W2 and W3 are smaller than that of W1. Velocities and forces in the x- and z-directions are larger for W3 than for W1 and W2. This is due to the lower kinetic energy that develops in water as the depth increases. The vorticity and pressure contours provide clear information regarding this effect; see Figure 11.
Figure 11a,b show the vorticity contours for W1 and W3. The vorticity is seen to be higher for W3 than for W1. High vorticity shedding is developed at the corners and near the tip of W3; it provides additional lift force to the WEC. Fluctuations usually occur due to both the lift and drag coefficients, but here, the fluctuations are due to a high lift coefficient.
The vertical force increases as submergence depth increases, as shown in Figure 9f and Figure 10f. However, the Froude–Krylov force can also be a reason behind this huge fluctuation. The Froude–Krylov force is obtained by integrating the incident-wave pressure over the instantaneous wetted buoy surface, which changes according to the body motions and incident-wave elevations at every time step. This force increases the displacement of the buoy by more than 3 times its actual displacement. Figure 11c,d show that a higher pressure is present for W3.
The Reynolds number can be calculated through , where and are the viscosity and density of water, respectively, d = 0.3 m is the characteristic length of the WEC, and v is the flow velocity. The inlet velocity is calculated through the wavelength () and the time period (T), . The inlet wave velocity and the maximum velocity of each simulated case are used to establish values, which are found here to be between 15,000 and 48,000 based on the different buoy submergence depths. This shows a laminar flow regime. Although = 105 has been suggested [25,26], there is currently no clear definition in the literature regarding the critical Reynolds number for such applications, with the value being largely dependent on the problem studied [27].
3.3. Effect of Wave Height
The influence of the wave height on the power absorbed by the WECs is now investigated. A similar power absorption and efficiency of the WEC () expression is provided in [28]:
where is the absorbed power estimated from the simulations, is the instantaneous lift force, and is the instantaneous heave velocity. is the incidence power, T in Equation (6) is the total time of the simulation, and L is the characteristic dimension of the WEC. The lift force (FL) is dependent on the region where the vertical fluid velocity increases and lowers the pressure. It is calculated as follows:
where is the lift coefficient, is the velocity of the SWEC relative to the fluid, is the cross-sectional area perpendicular to the z-axis, and is the fluid density.
Figure 12a,b illustrate the absolute power absorbed and the efficiency for W1 for different wave heights (H) at ds0 with k2. Figure 12b shows that for W1, decreases with an increase in wave height. This is attributed to the higher value of when H increases. It can be concluded that with an increase in H, the power absorption increases. A similar observation was made by Anbarsooz et al. [16]. Figure 12c shows the absolute power absorption of W1 for the studied submergence depths. It can be noticed that the power absorption decreases with an increase in WEC depth for W1. Figure 12d,e show the effect of the WEC shape on power absorption. It can be seen from Figure 12f that the efficiency is higher for W3 than for W1 and W2 with an increase in depth, and the efficiency decreases with an increase in depth for W1. This is attributed to the power absorption, which is higher for W3 than for W1 and W2. However, as shown in Figure 12f, the efficiency of all three WECs seems to be identical at the ds0 submergence depth.
3.4. Effect of Spring Constant
All WECs considered have a density of 1000 kg/m3. The spring constant value k plays a major role in obtaining stable movement. The values k1 = 0 N/m, k2 = 50 N/m, and k3 = 100 N/m were tested numerically. Their effect is discussed for W1 at ds0 = 0 and H = 0.04 m. The vertical and horizontal movements of W1 are shown in Figure 13a,b for all three k values.
The sinusoidal trend of W1’s vertical displacement with time is similar for all k values tested, but the trend of W1’s horizontal displacement is not. As shown in Figure 13a, for k1, the vertical displacement is less stable than for the other two cases. The vertical and horizontal motions of the WECs are more stable in amplitude with k2. It can also be noticed that for k3, the vertical movement is regular, but the moment is lower.
Figure 13c shows the instantaneous values of the power absorption of W1. It can be seen in Figure 13d that the float efficiency difference between k2 and k3 is negligible at ds0 = 0 m. It seems that the float efficiency remains constant when increasing the spring constant from k2. Based on the above points, it can be concluded that the k2 spring constant is more suitable for WEC design optimization with increased submergence depth.
4. Conclusions
A numerical investigation was carried out to compare submergence and the SWEC shape subjected to regular waves. This work provides valuable insights for designing and optimizing WECs with CFD using the multiphase VOF model and a coupled fluid–motion solver for submerged and free-floating buoys. The following conclusions can be drawn from this study:
- The spring constant reduces the efficiency of the WEC but develops a stable floating movement of the submerged WEC.
- Submergence increases with increased power absorption but reduces the conversion efficiency.
- A trapezoidal fin provides higher efficiency than either a rectangular box or a circular cylinder.
- With an increase in wave height, the power absorption increases, but the efficiency decreases.
The developed model can simulate the interaction between waves and wave energy converters and determine the influence of wave sizes and SWEC shapes on the power generation. The model can thus be applied to different scenarios involving wave energy converters.
Author Contributions
Conceptualization, R.R.; methodology, R.R.; investigation, R.R.; writing—original draft preparation, R.R., S.G. and P.G.V.; writing—review and editing, R.R., S.G. and P.G.V.; supervision, S.G. and P.G.V. All authors have read and agreed to the published version of the manuscript.
Funding
The authors acknowledge the financial support from the UK Commonwealth Split-Site Commission.
Institutional Review Board Statement
Not applicable.
Informed Consent Statement
Not applicable.
Data Availability Statement
The raw data supporting the conclusions of this article will be made available by the authors on request.
Conflicts of Interest
The authors declare no conflicts of interest.
References
- López, I.; Andreu, J.; Ceballos, S.; De Alegría, I.M.; Kortabarria, I. Review of wave energy technologies and the necessary power-equipment. Renew. Sustain. Energy Rev. 2013, 27, 413–434. [Google Scholar] [CrossRef]
- Chen, Z.; Yu, H.; Hu, M.; Meng, G.; Wen, C. A Review of Offshore Wave Energy Extraction System. Adv. Mech. Eng. 2013, 5, 623020. [Google Scholar] [CrossRef]
- He, G.; Luan, Z.; Zhang, W.; He, R.; Liu, C.; Yang, K.; Yang, C.; Jing, P.; Zhang, Z. Review on research approaches for multi-point absorber wave energy converters. Renew. Energy 2023, 218, 119237. [Google Scholar] [CrossRef]
- Ahamed, R.; Mckee, K.; Howard, I. Advancements of wave energy converters based on power take off (PTO) systems: A review. Ocean. Eng. 2020, 204, 107248. [Google Scholar] [CrossRef]
- Bracco, G.; Cagninei, A.; Giorcelli, E.; Mattiazzo, G.; Poggi, D.; Raffero, M. Experimental validation of the ISWEC wave to PTO model. Ocean Eng. 2016, 120, 40–51. [Google Scholar] [CrossRef]
- Sergiienko, N.Y.; Cazzolato, B.S.; Ding, B.; Hardy, P.; Arjomandi, M. Performance comparison of the floating and fully submerged quasi-point absorber wave energy converters. Renew. Energy 2017, 108, 425–437. [Google Scholar] [CrossRef]
- Mciver, P.; Evans, D.V. The occurrence of negative added mass in free-surface problems involving submerged oscillating bodies. J. Eng. Math. 1984, 18, 7–22. [Google Scholar] [CrossRef]
- Davis, J.P. Wave energy absorption by the Bristol Cylinder. Linear and non-linear effects. Proc. Inst. Civ. Eng. Part 2 Res. Theory 1990, 89, 317–340. [Google Scholar] [CrossRef]
- Heikkinen, H.; Lampinen, M.J.; Böling, J. Analytical study of the interaction between waves and cylindrical wave energy converters oscillating in two modes. Renew. Energy 2013, 50, 150–160. [Google Scholar] [CrossRef]
- Tran, N.; Sergiienko, N.Y.; Cazzolato, B.S.; Ghayesh, M.H.; Arjomandi, M. Design considerations for a three-tethered point absorber wave energy converter with nonlinear coupling between hydrodynamic modes. Ocean Eng. 2022, 254, 111351. [Google Scholar] [CrossRef]
- Ren, B.; He, M.; Dong, P.; Wen, H. Nonlinear simulations of wave-induced motions of a freely floating body using WCSPH method. Appl. Ocean. Res. 2015, 50, 1–12. [Google Scholar] [CrossRef]
- Ropero-Giralda, P.; Crespo, A.J.C.; Coe, R.G.; Tagliafierro, B.; Domínguez, J.M.; Bacelli, G.; Gómez-Gesteira, M. Modelling a heaving point-absorber with a closed-loop control system using the dualsphysics code. Energies 2021, 14, 760. [Google Scholar] [CrossRef]
- He, M.; Gao, X.; Xu, W.; Ren, B.; Wang, H. Potential application of submerged horizontal plate as a wave energy breakwater: A 2D study using the WCSPH method. Ocean Eng. 2019, 185, 27–46. [Google Scholar] [CrossRef]
- Zheng, X.; Chen, G.; Cao, W.; Xu, H.; Zhao, R.; Xu, Q.; Kramer, M.; Le Touzé, D.; Borthwick, A.G.L.; Li, Y. On the energy conversion characteristics of a top-mounted pitching absorber by using smoothed particle hydrodynamics. Energy Convers. Manag. 2021, 250, 114893. [Google Scholar] [CrossRef]
- Palm, J.; Eskilsson, C. Mooring systems with submerged buoys: Influence of buoy geometry and modelling fidelity. Appl. Ocean Res. 2020, 102, 102302. [Google Scholar] [CrossRef]
- Anbarsooz, M.; Passandideh-Fard, M.; Moghiman, M. Numerical simulation of a submerged cylindrical wave energy converter. Renew. Energy 2014, 64, 132–143. [Google Scholar] [CrossRef]
- Prakash, R.; Rathaur, R.; Gupta, S.; Ghosh, S.; Kumar, D.; Agarwal, R.; Vatsa, S.K.; Khandige, M. A numerical study on float design for wave energy converter. Ocean Eng. 2022, 264, 112410. [Google Scholar] [CrossRef]
- Dean, R.G.; Dalrymple, R.A. Water Wave Mechanics for Engineers and Scientists; World Scientific Publishing Co. Pte. Ltd.: Singapore, 1984. [Google Scholar] [CrossRef]
- Higuera, P.; Lara, J.L.; Losada, I.J. Realistic wave generation and active wave absorption for Navier-Stokes models. Application to OpenFOAM®. Coast. Eng. 2013, 71, 102–118. [Google Scholar] [CrossRef]
- Gourma, M.; Verdin, P. Two-phase slug flows in helical pipes: Slug frequency alterations and helicity fluctuations. Int. J. Multiph. Flow. 2016, 86, 10–20. [Google Scholar] [CrossRef]
- Gourma, M.; Verdin, P. Nature and magnitude of operating forces in a horizontal bend conveying gas-liquid slug flows. J. Pet. Sci. Eng. 2020, 190, 107062. [Google Scholar] [CrossRef]
- Ibnu Syihab, A.B.M.; Verdin, P.G.; Wright, R.M.; Piper, A.T.; Rivas Casado, M. Computational fluid dynamics simulations of water flow on a studded upstream eel pass. River Res. Appl. 2021, 37, 1279–1293. [Google Scholar] [CrossRef]
- Devolder, B.; Troch, P.; Rauwoens, P. Accelerated numerical simulations of a heaving floating body by coupling a motion solver with a two-phase fluid solver. Comput. Math. Appl. 2019, 77, 1605–1625. [Google Scholar] [CrossRef]
- Kissling, K.; Springer, J.; Jasak, H.; Schutz, S.; Urban, K.; Piesche, M. A Coupled Pressure Based Solution Algorithm Based on the Volume-of-Fluid Approach for Two or More Immiscible Fluids. In Proceedings of the V European Conference on Computational Fluid Dynamics ECCOMAS CFD 2010, Lisbon, Portugal, 14–17 June 2010. [Google Scholar]
- Saghafian, M.; Stansby, P.K.; Saidi, M.S.; Apsley, D.D. Simulation of turbulent flows around a circular cylinder using nonlinear eddy-viscosity modelling: Steady and oscillatory ambient flows. J. Fluids Struct. 2003, 17, 1213–1236. [Google Scholar] [CrossRef]
- Jamalabadi, M.Y.A.; Ho-Huu, V.; Nguyen, T.K. Optimal design of circular baffles on sloshing in a rectangular tank horizontally coupled by structure. Water 2018, 10, 1504. [Google Scholar] [CrossRef]
- Sheng, W.; Alcorn, R.; Lewis, T. Physical modelling of wave energy converters. Ocean. Eng. 2014, 84, 29–36. [Google Scholar] [CrossRef]
- Jin, S.; Patton, R.J.; Guo, B. Enhancement of wave energy absorption efficiency via geometry and power take-off damping tuning. Energy 2019, 169, 819–832. [Google Scholar] [CrossRef]
Figure 1.
(a) Tank design. (b) Mesh of numerical wave tank. (c) Rectangular, circular cylindrical, and trapezoidal fin shapes of the wave energy converter.
Figure 1.
(a) Tank design. (b) Mesh of numerical wave tank. (c) Rectangular, circular cylindrical, and trapezoidal fin shapes of the wave energy converter.

Figure 2.
Schematic representation of floating (ds0 = 0 m) and submerged (ds1 = 0.1 m, ds2 = 0.2 m). (a) Rectangular box (W1). (b) Circular cylinder (W2). (c) Trapezoidal fin (W3).
Figure 2.
Schematic representation of floating (ds0 = 0 m) and submerged (ds1 = 0.1 m, ds2 = 0.2 m). (a) Rectangular box (W1). (b) Circular cylinder (W2). (c) Trapezoidal fin (W3).

Figure 3.
Mesh independence study of the rectangular buoy of density 500 kg/m3. (a) Dimensionless vertical displacement (z/d) of the buoy plotted with respect to dimensionless time (t/T). (b) Comparison between numerical and experimental displacements at a wave height of 0.04 m.
Figure 3.
Mesh independence study of the rectangular buoy of density 500 kg/m3. (a) Dimensionless vertical displacement (z/d) of the buoy plotted with respect to dimensionless time (t/T). (b) Comparison between numerical and experimental displacements at a wave height of 0.04 m.

Figure 4.
Effect of depth of W1 at effective density 1000 kg/m3, wave height H = 0.04 m, and k2 = 50 N/m. (a,b) Vertical and horizontal displacements of W1 as a function of time. (c,d) Horizontal and vertical velocities of W1. (e,f) Forces on W1 in z- and x-directions.
Figure 4.
Effect of depth of W1 at effective density 1000 kg/m3, wave height H = 0.04 m, and k2 = 50 N/m. (a,b) Vertical and horizontal displacements of W1 as a function of time. (c,d) Horizontal and vertical velocities of W1. (e,f) Forces on W1 in z- and x-directions.

Figure 5.
Contour plots showing the interaction between the waves and W1 (blue color: water; red color: air). (a) ds0 = 0 m. (b) ds2 = 0.2 m. Time period Tp = 1.2 s, wave height H = 0.04 m, and k2 = 50 N/m.
Figure 5.
Contour plots showing the interaction between the waves and W1 (blue color: water; red color: air). (a) ds0 = 0 m. (b) ds2 = 0.2 m. Time period Tp = 1.2 s, wave height H = 0.04 m, and k2 = 50 N/m.

Figure 6.
Effect of different WEC shapes of effective density 1000 kg/m3, wave height H = 0.04 m, submergence depth ds0 = 0 m, and k2 = 50 N/m. (a,b) Horizontal (Dx) and vertical (Dz) displacements of the WECs in function of time. (c,d) Horizontal and vertical velocities of all WECs. (e,f) Forces on all WECs in x- and z-directions.

Figure 7.
Vorticity contours. (a) W1. (b) W2. (c) W3. Wave height H = 0.04 m, submergence depth ds0 = 0 m, and k2 = 50 N/m.
Figure 7.
Vorticity contours. (a) W1. (b) W2. (c) W3. Wave height H = 0.04 m, submergence depth ds0 = 0 m, and k2 = 50 N/m.

Figure 8.
Pressure contours. (a) W1. (b) W3. Wave height H = 0.04 m, submergence depth ds = 0 m, and k2 = 50 N/m.
Figure 8.
Pressure contours. (a) W1. (b) W3. Wave height H = 0.04 m, submergence depth ds = 0 m, and k2 = 50 N/m.

Figure 9.
Effect of WEC shape with effective density of 1000 kg/m3, wave height H = 0.04 m, submergence depth ds1 = 0.1 m, and k2 = 50 N/m. (a,b) Horizontal (Dx) and vertical (Dz) displacements of WECs as a function of time. (c,d) Horizontal and vertical velocities of all WECs. (e,f) Forces on all WECs in x- and z-directions.

Figure 10.
Effect of different WEC shapes with effective density of 1000 kg/m3, wave height H = 0.04 m, submergence depth ds2 = 0.2 m, and k2 = 50 N/m. (a,b) Horizontal (Dx) and vertical (Dz) displacements of WECs as a function of time. (c,d) Horizontal and vertical velocities of all WECs. (e,f) Forces on all WECs in x- and z-directions.

Figure 11.
(a,b) Vorticity contours of W1 and W3. (c,d) Dynamic pressure of W1 and W3 at H = 0.04 m, submergence depth ds = 0.2 m, and k2 = 50 N/m.
Figure 11.
(a,b) Vorticity contours of W1 and W3. (c,d) Dynamic pressure of W1 and W3 at H = 0.04 m, submergence depth ds = 0.2 m, and k2 = 50 N/m.

Figure 12.
(a,b) Effect of wave height (H) on absolute power absorbed and efficiency at ds1 = 0.1 m. (c) Effect of submergence depth (ds). (d) Different wave energy converter shapes for ds0 on absolute power absorption. (e) Power absorption of WECs for ds2 at H = 0.04 m with constant spring k2. (f) Efficiency of all WECs at all ds.
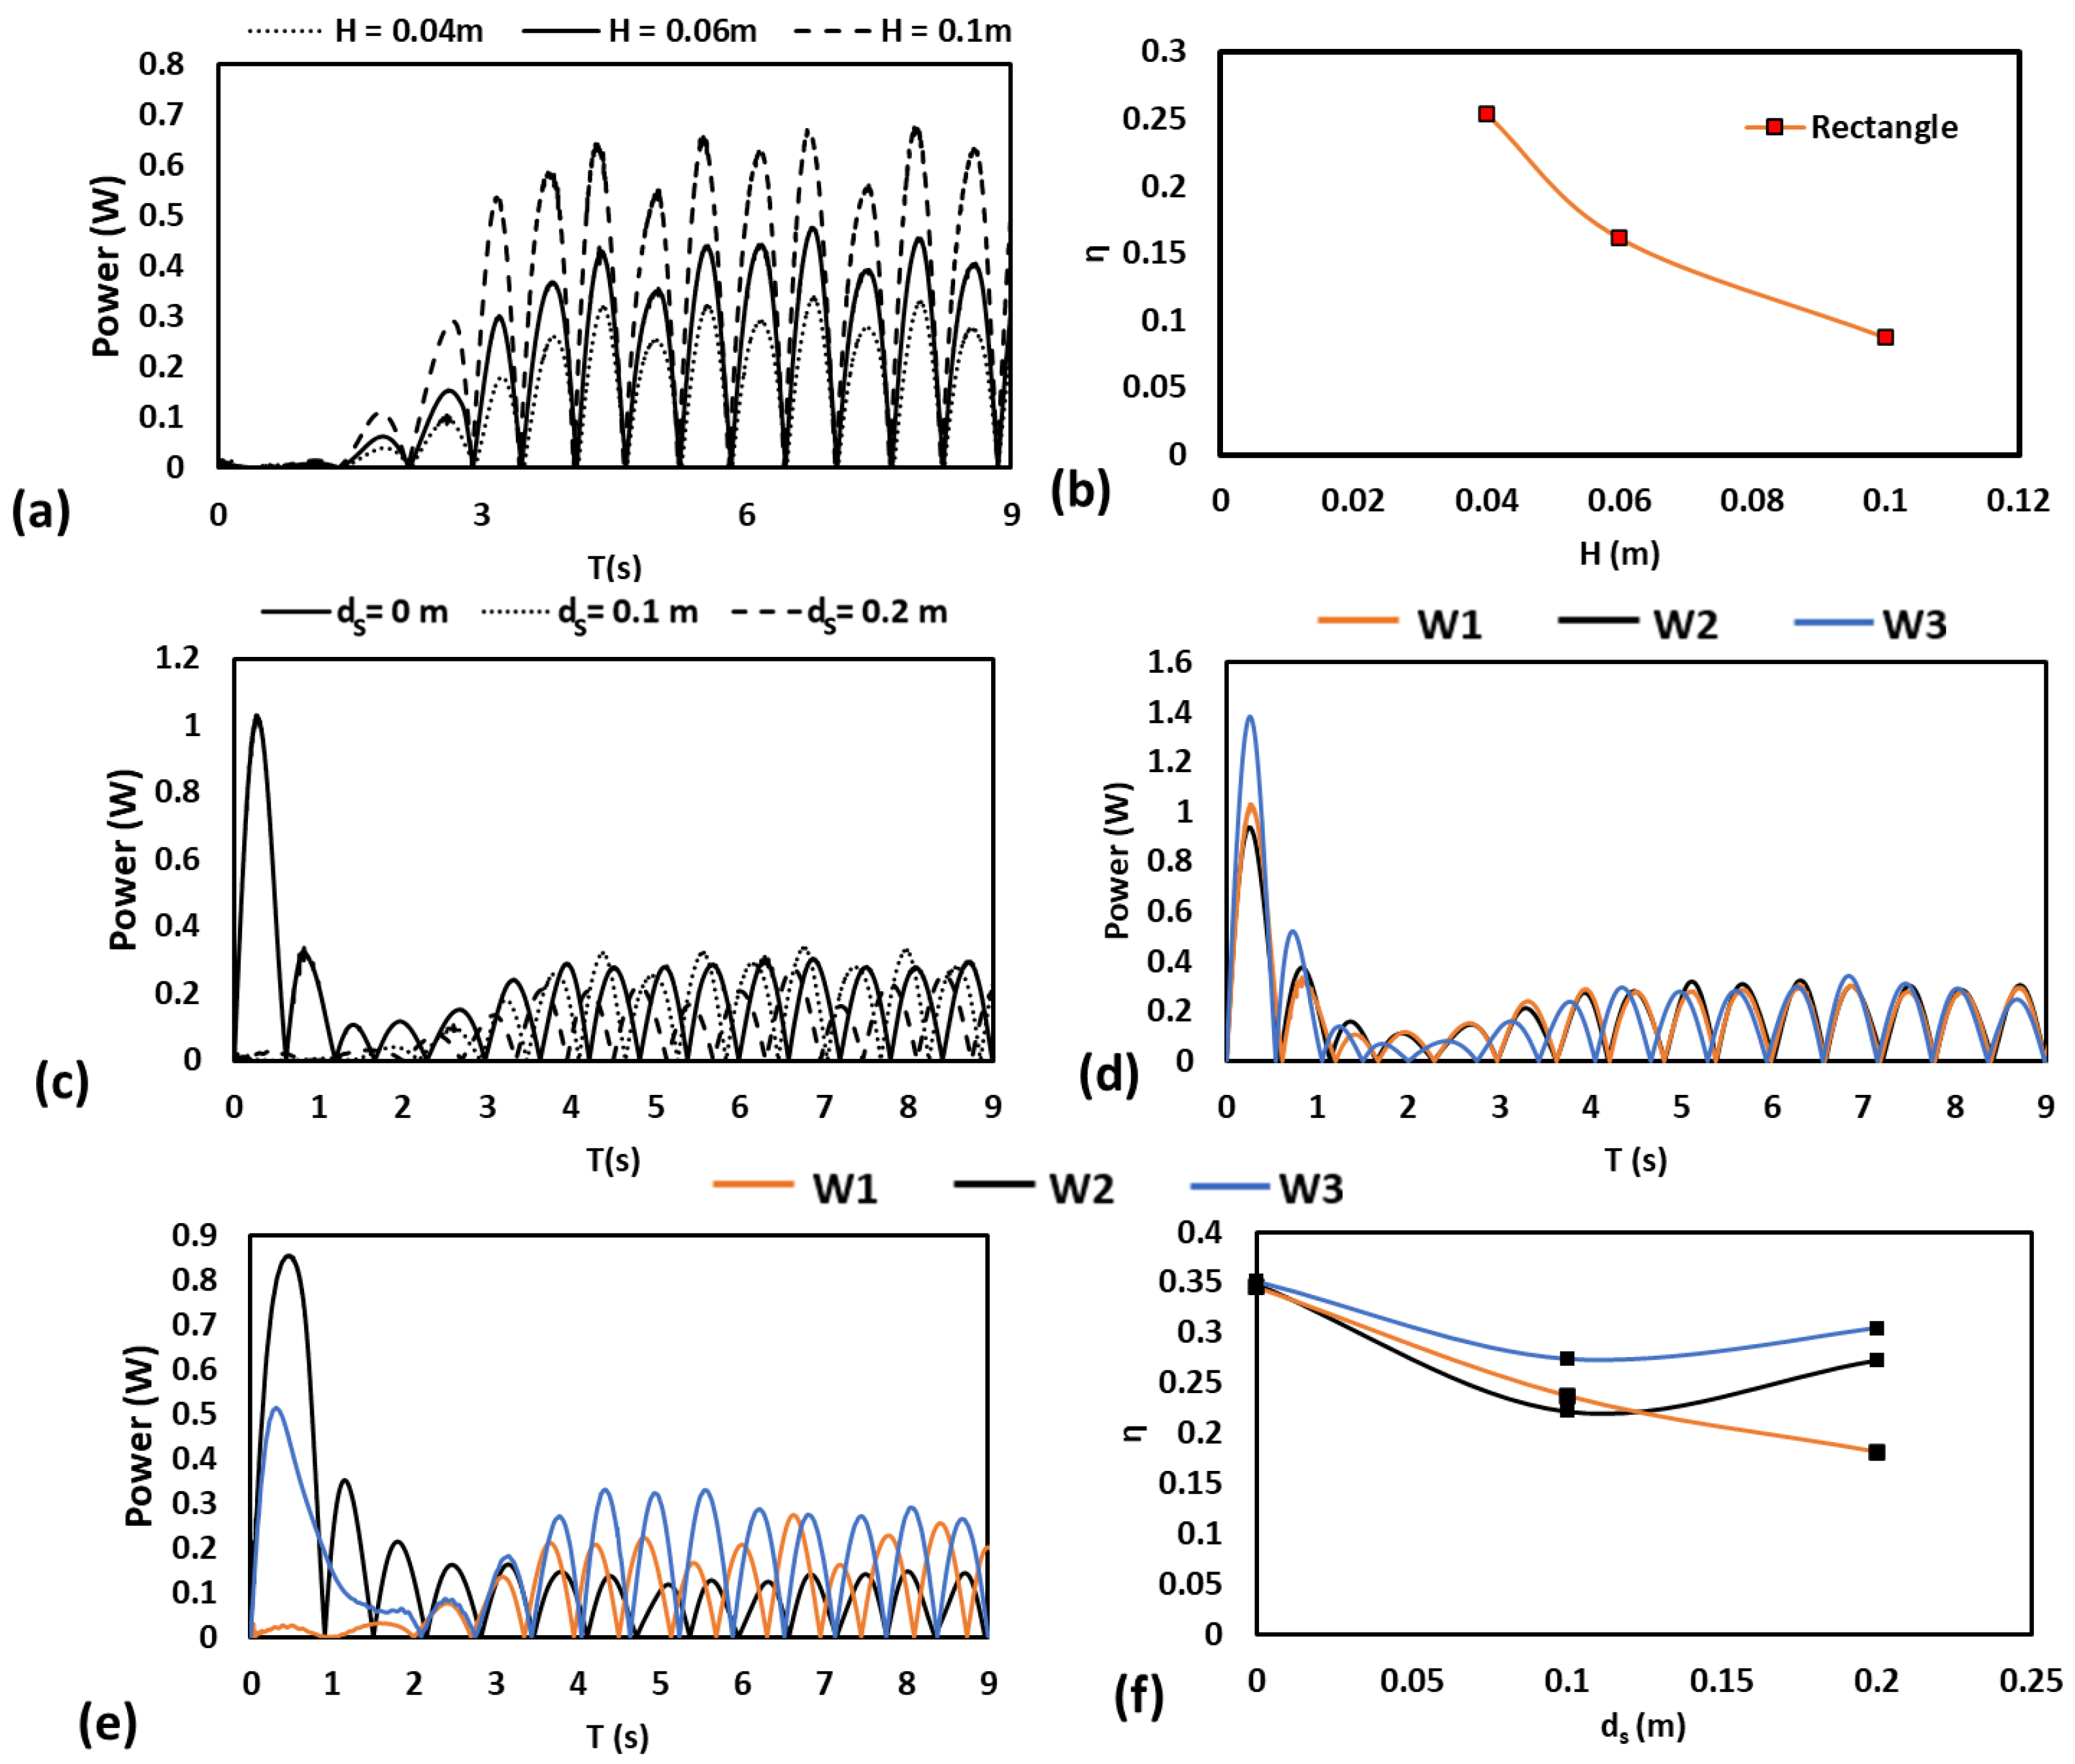
Figure 13.
Effect of the spring constant (k) on the stability of W1 with an effective density of 1000 kg/m3, depth ds0 = 0 m, and wave height H = 0.04 m. (a,b) Vertical displacement (Dz) and horizontal displacement (Dx) of the object as a function of time. (c) Power absorption versus time for W1. (d) Efficiency versus spring constant for W1.


Table 1.
Details of parameters used in the simulations.
| Shape | Density (kg/m3) | Wave Height (m) | Spring Stiffness (k) | Submergence Depth (ds) | Time Period (s) |
|---|---|---|---|---|---|
| Rectangular | 1000 | 0.04, 0.06, 0.1 | 0, 50, 100 | 0, 0.1, 0.2 | 1.2 |
| Circular cylindrical | 1000 | 0.04 | 50 | 0, 0.1, 0.2 | 1.2 |
| Trapezoidal fin | 1000 | 0.04 | 50 | 0, 0.1, 0.2 | 1.2 |
Table 2.
Mesh independence study results at t = 1.49 s.
| Case | Coarse | Medium | Fine | Extra-Fine |
|---|---|---|---|---|
| Number of cells | 107,686 | 115,660 | 126,676 | 140,320 |
| Min. cell size (mm) | 0.015 | 0.010 | 0.005 | 0.002 |
| Max. disp. z/d | 0.071 | 0.071 | 0.060 | 0.060 |
Disclaimer/Publisher’s Note: The statements, opinions and data contained in all publications are solely those of the individual author(s) and contributor(s) and not of MDPI and/or the editor(s). MDPI and/or the editor(s) disclaim responsibility for any injury to people or property resulting from any ideas, methods, instructions or products referred to in the content. |
© 2024 by the authors. Licensee MDPI, Basel, Switzerland. This article is an open access article distributed under the terms and conditions of the Creative Commons Attribution (CC BY) license (https://creativecommons.org/licenses/by/4.0/).
Share and Cite
MDPI and ACS Style
Rathaur, R.; Verdin, P.G.; Ghosh, S. A Numerical Study of the Performance of Point Absorber Wave Energy Converters. Appl. Sci. 2024, 14, 4039. https://doi.org/10.3390/app14104039
AMA Style
Rathaur R, Verdin PG, Ghosh S. A Numerical Study of the Performance of Point Absorber Wave Energy Converters. Applied Sciences. 2024; 14(10):4039. https://doi.org/10.3390/app14104039
Chicago/Turabian StyleRathaur, Ranjana, Patrick G. Verdin, and Sumana Ghosh. 2024. "A Numerical Study of the Performance of Point Absorber Wave Energy Converters" Applied Sciences 14, no. 10: 4039. https://doi.org/10.3390/app14104039
Note that from the first issue of 2016, this journal uses article numbers instead of page numbers. See further details here.