

The Biodistribution of the Spike Protein after Ad26.COV2.S Vaccination Is Unlikely to Play a Role in Vaccine-Induced Immune Thrombotic Thrombocytopenia
 , , , , , , and
Abstract
:1. Introduction
2. Materials and Methods
2.1. Ethics Statement
2.2. Participants
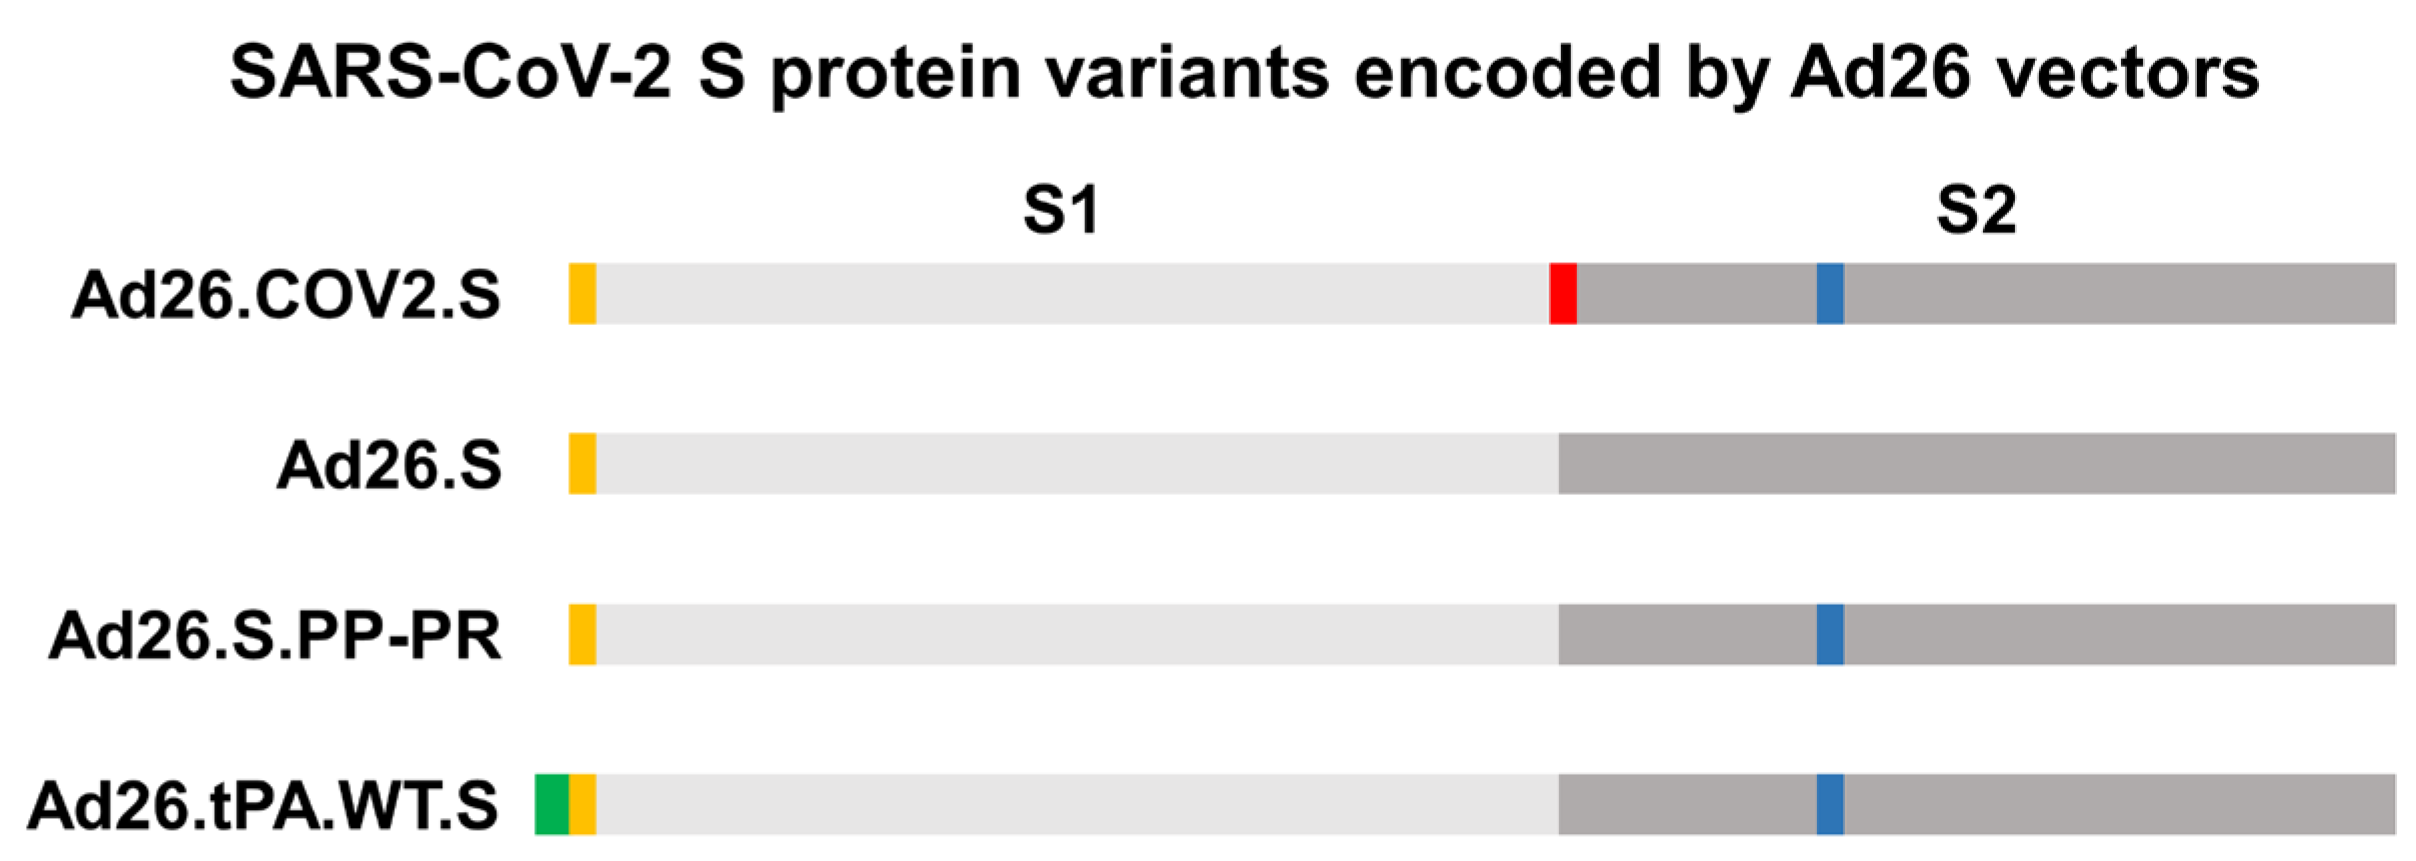
2.3. Vaccines
2.4. Purified SARS-CoV-2 S Protein and Adjuvant
2.5. Animals and Housing
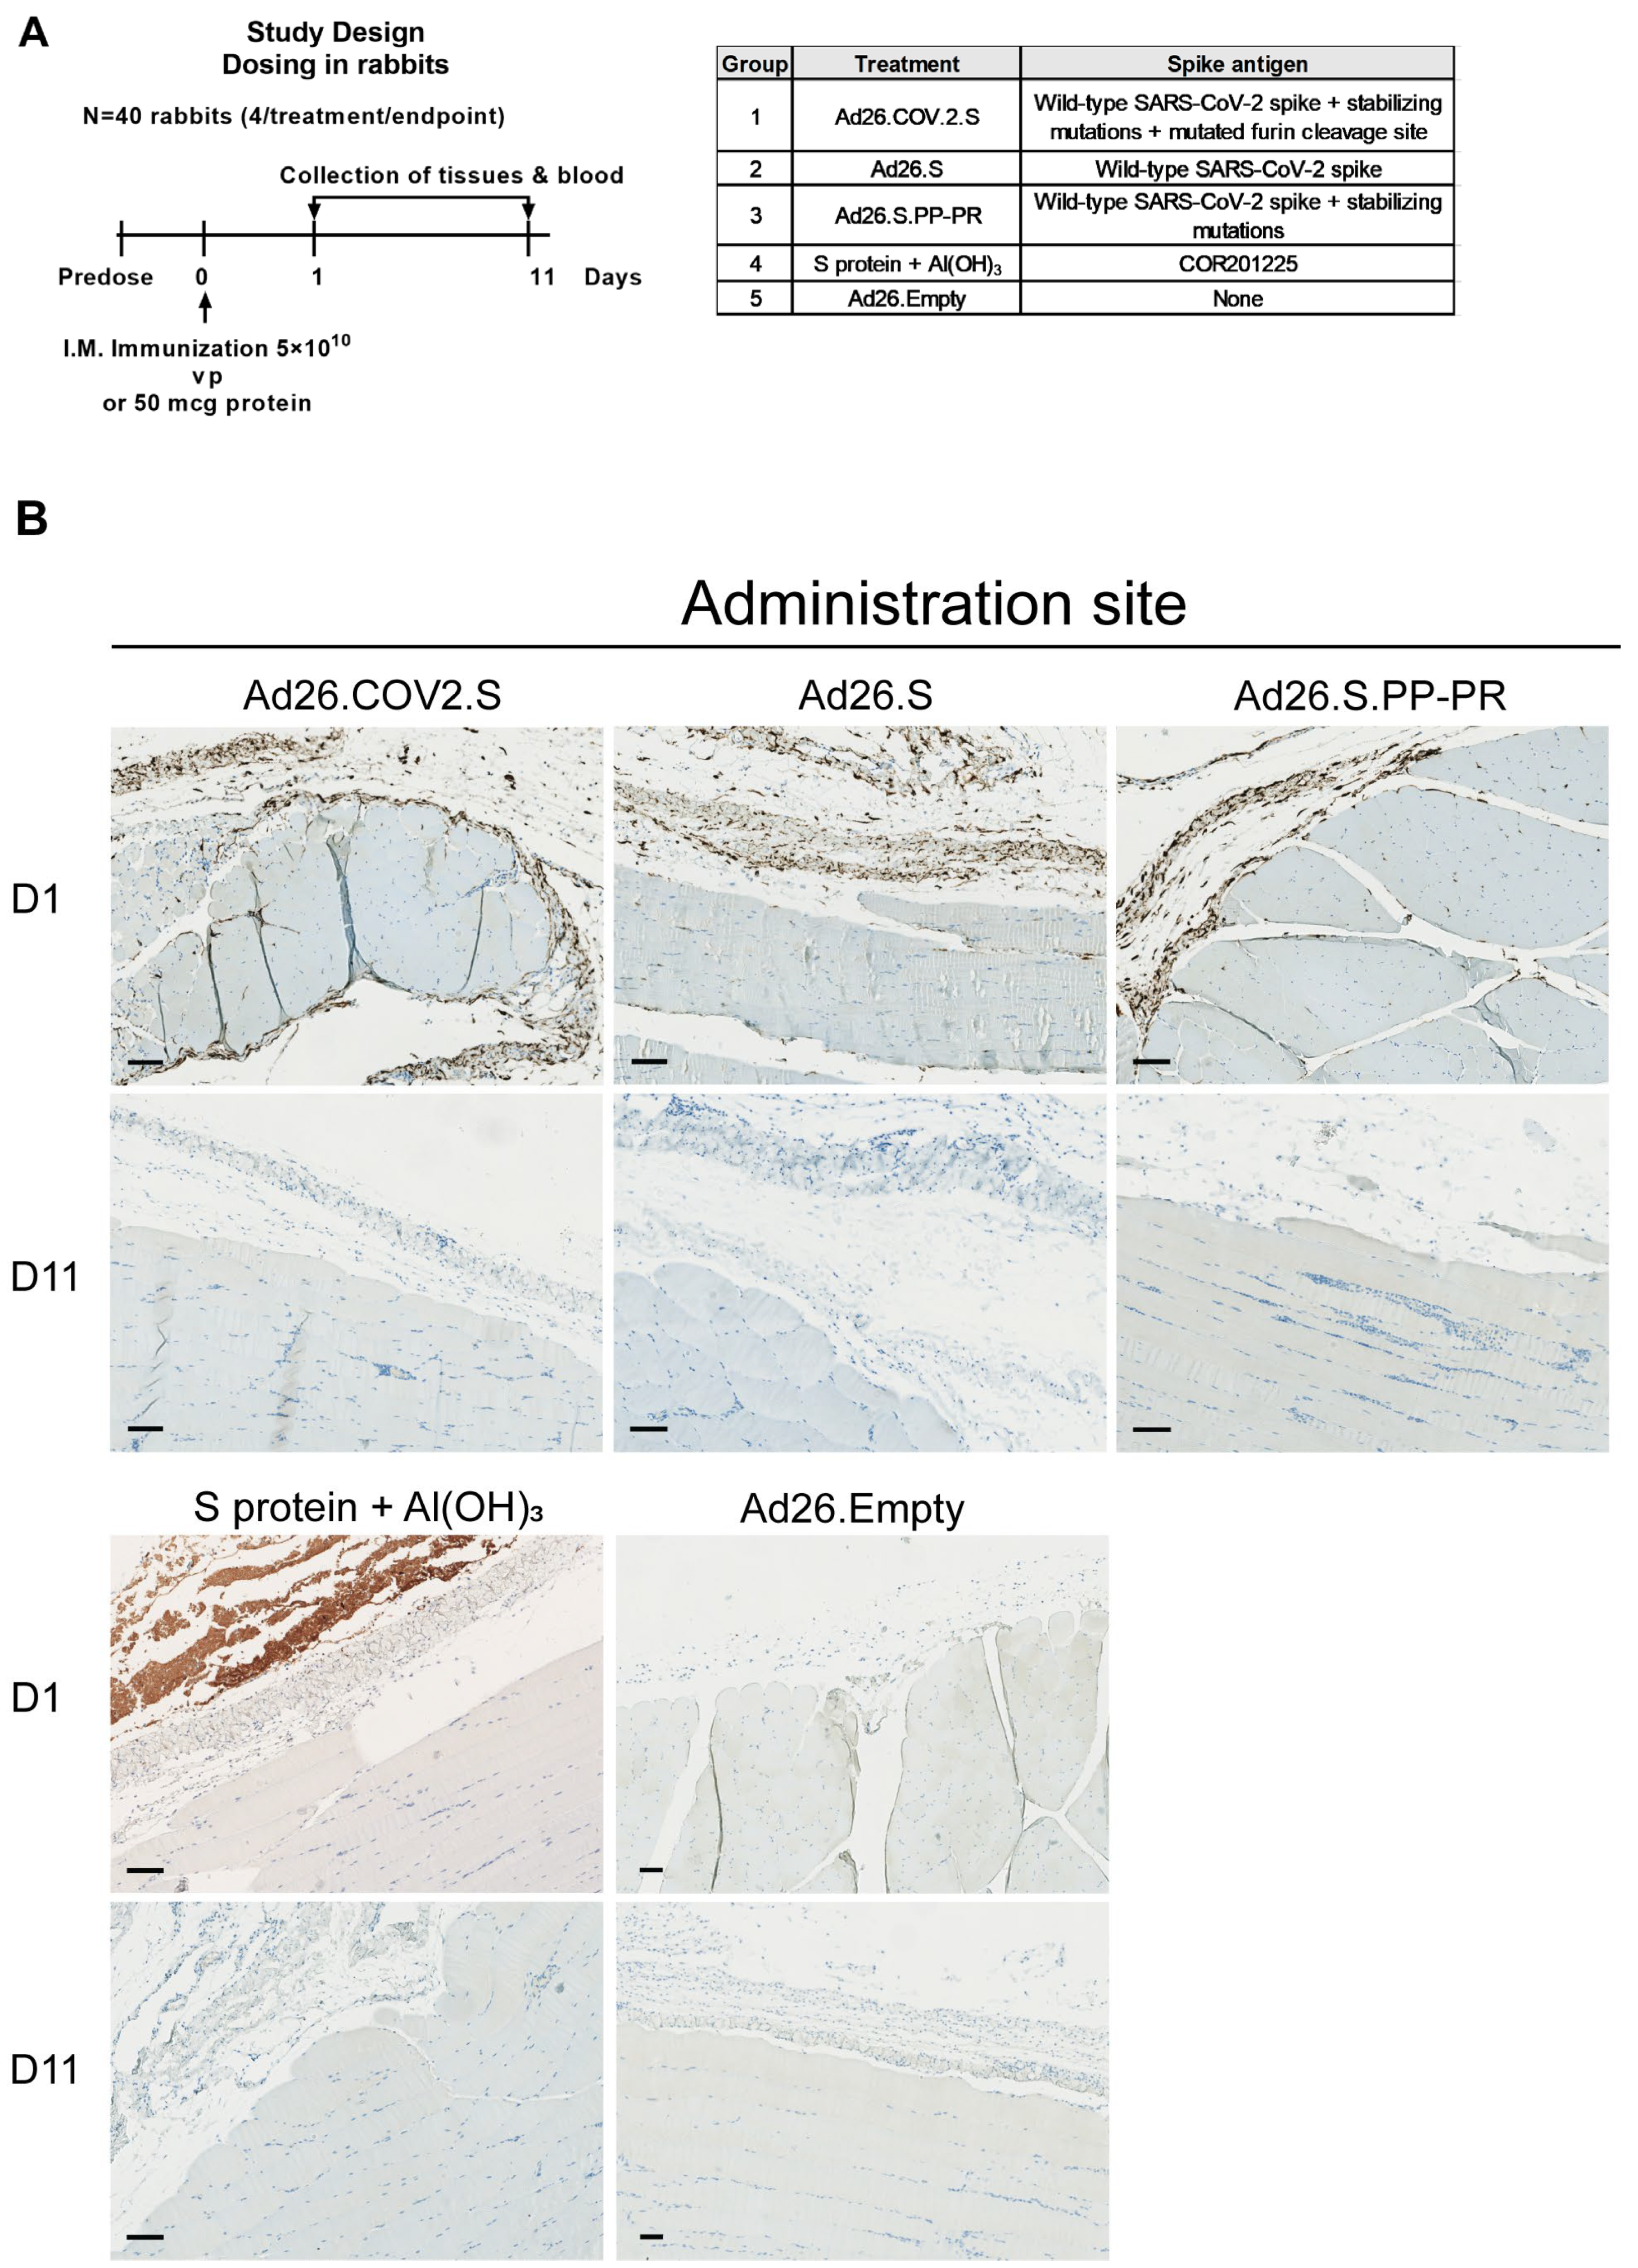
2.6. Animal Study Designs and Procedures
2.7. Processing of Whole Blood for Serum and Plasma Generation
2.8. Detection of S Protein in Tissues by Immunohistochemistry Staining
2.9. Detection of Spike mRNA in Tissues by RNAscope
2.10. Detection of the S Protein in Blood by Electrochemiluminescence
2.11. Detection of S1–S2 Protein in Blood by Electrochemiluminescence
2.12. Detection of Spike-Specific Immunoglobulin G (IgG) in Serum by Enzyme-Linked Immunosorbent Assay (ELISA)
2.13. Serum Coincubation Study
2.14. Statistical Analysis
3. Results
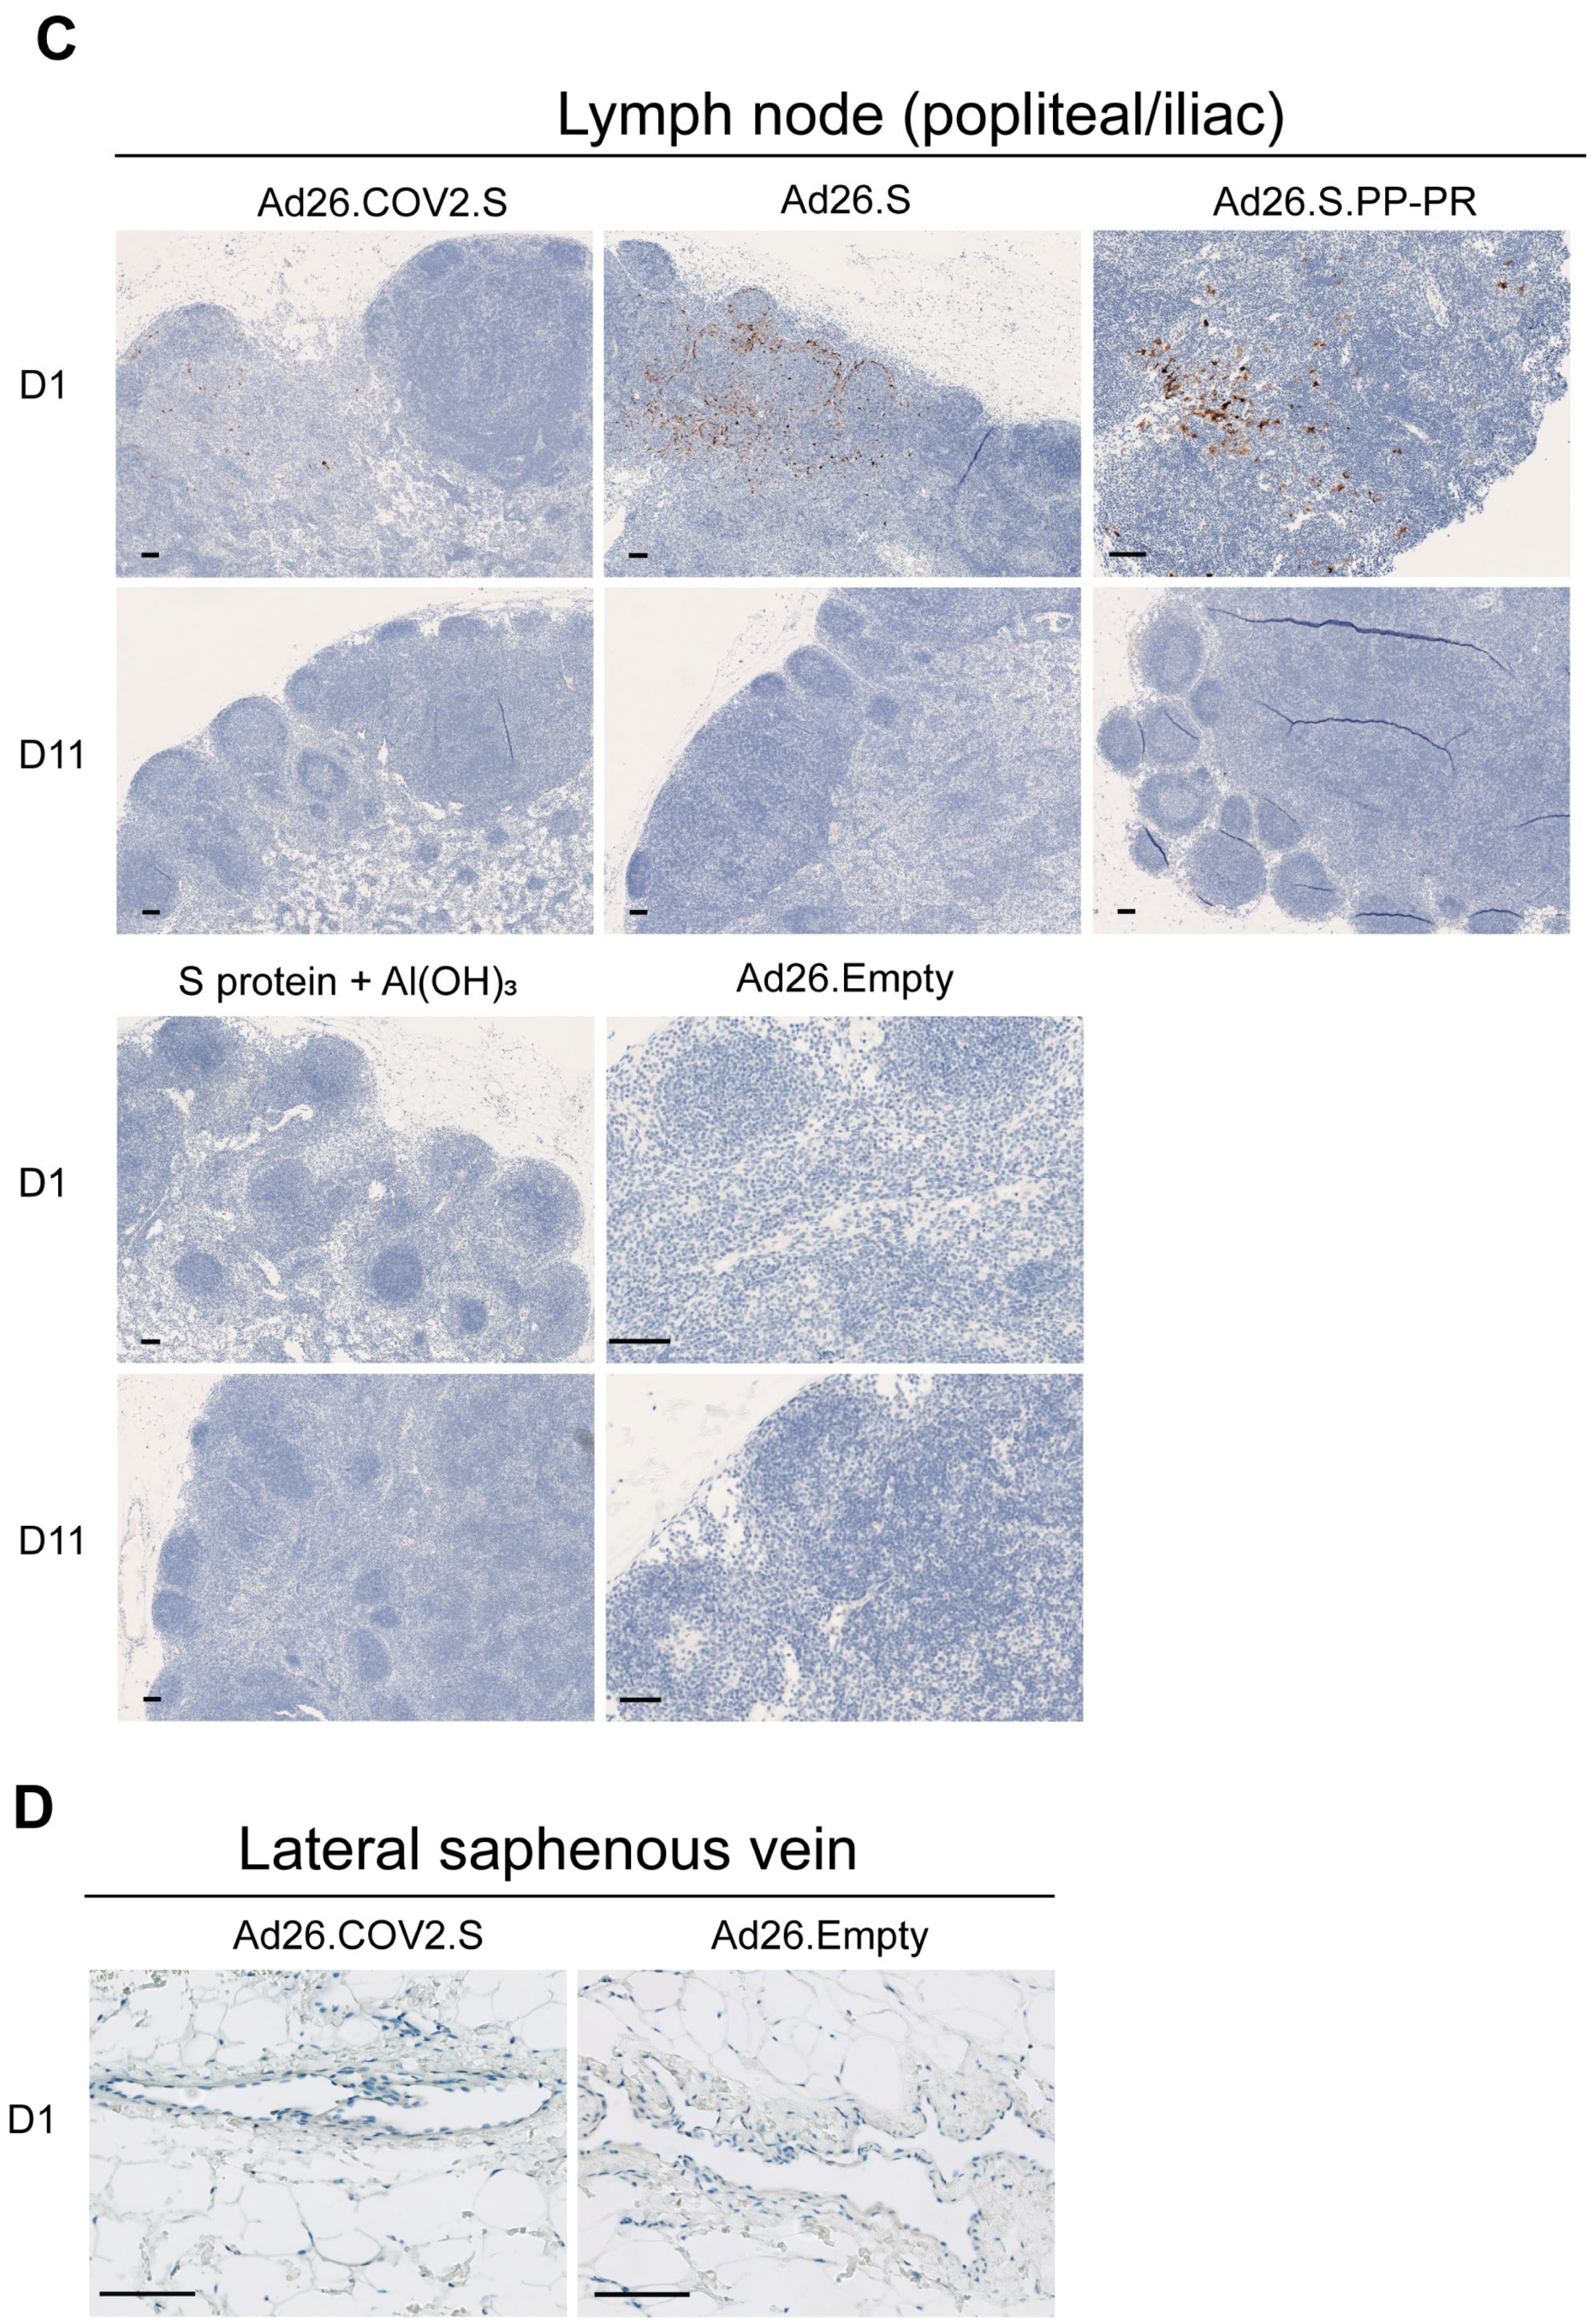
3.1. S Protein and S mRNA Were Detectable at the Site of Administration and in Draining Lymph Nodes at Day 1 but Not Day 11 after IM Ad26.COV2.S Vaccination in Rabbits

3.2. S protein Was Detectable in Plasma/Serum after IM Administration of Ad26.COV2.S and Other S-Protein-Encoding Ad26-Based Vectors in Rabbits, but Not in Platelet-Rich Cell Fraction

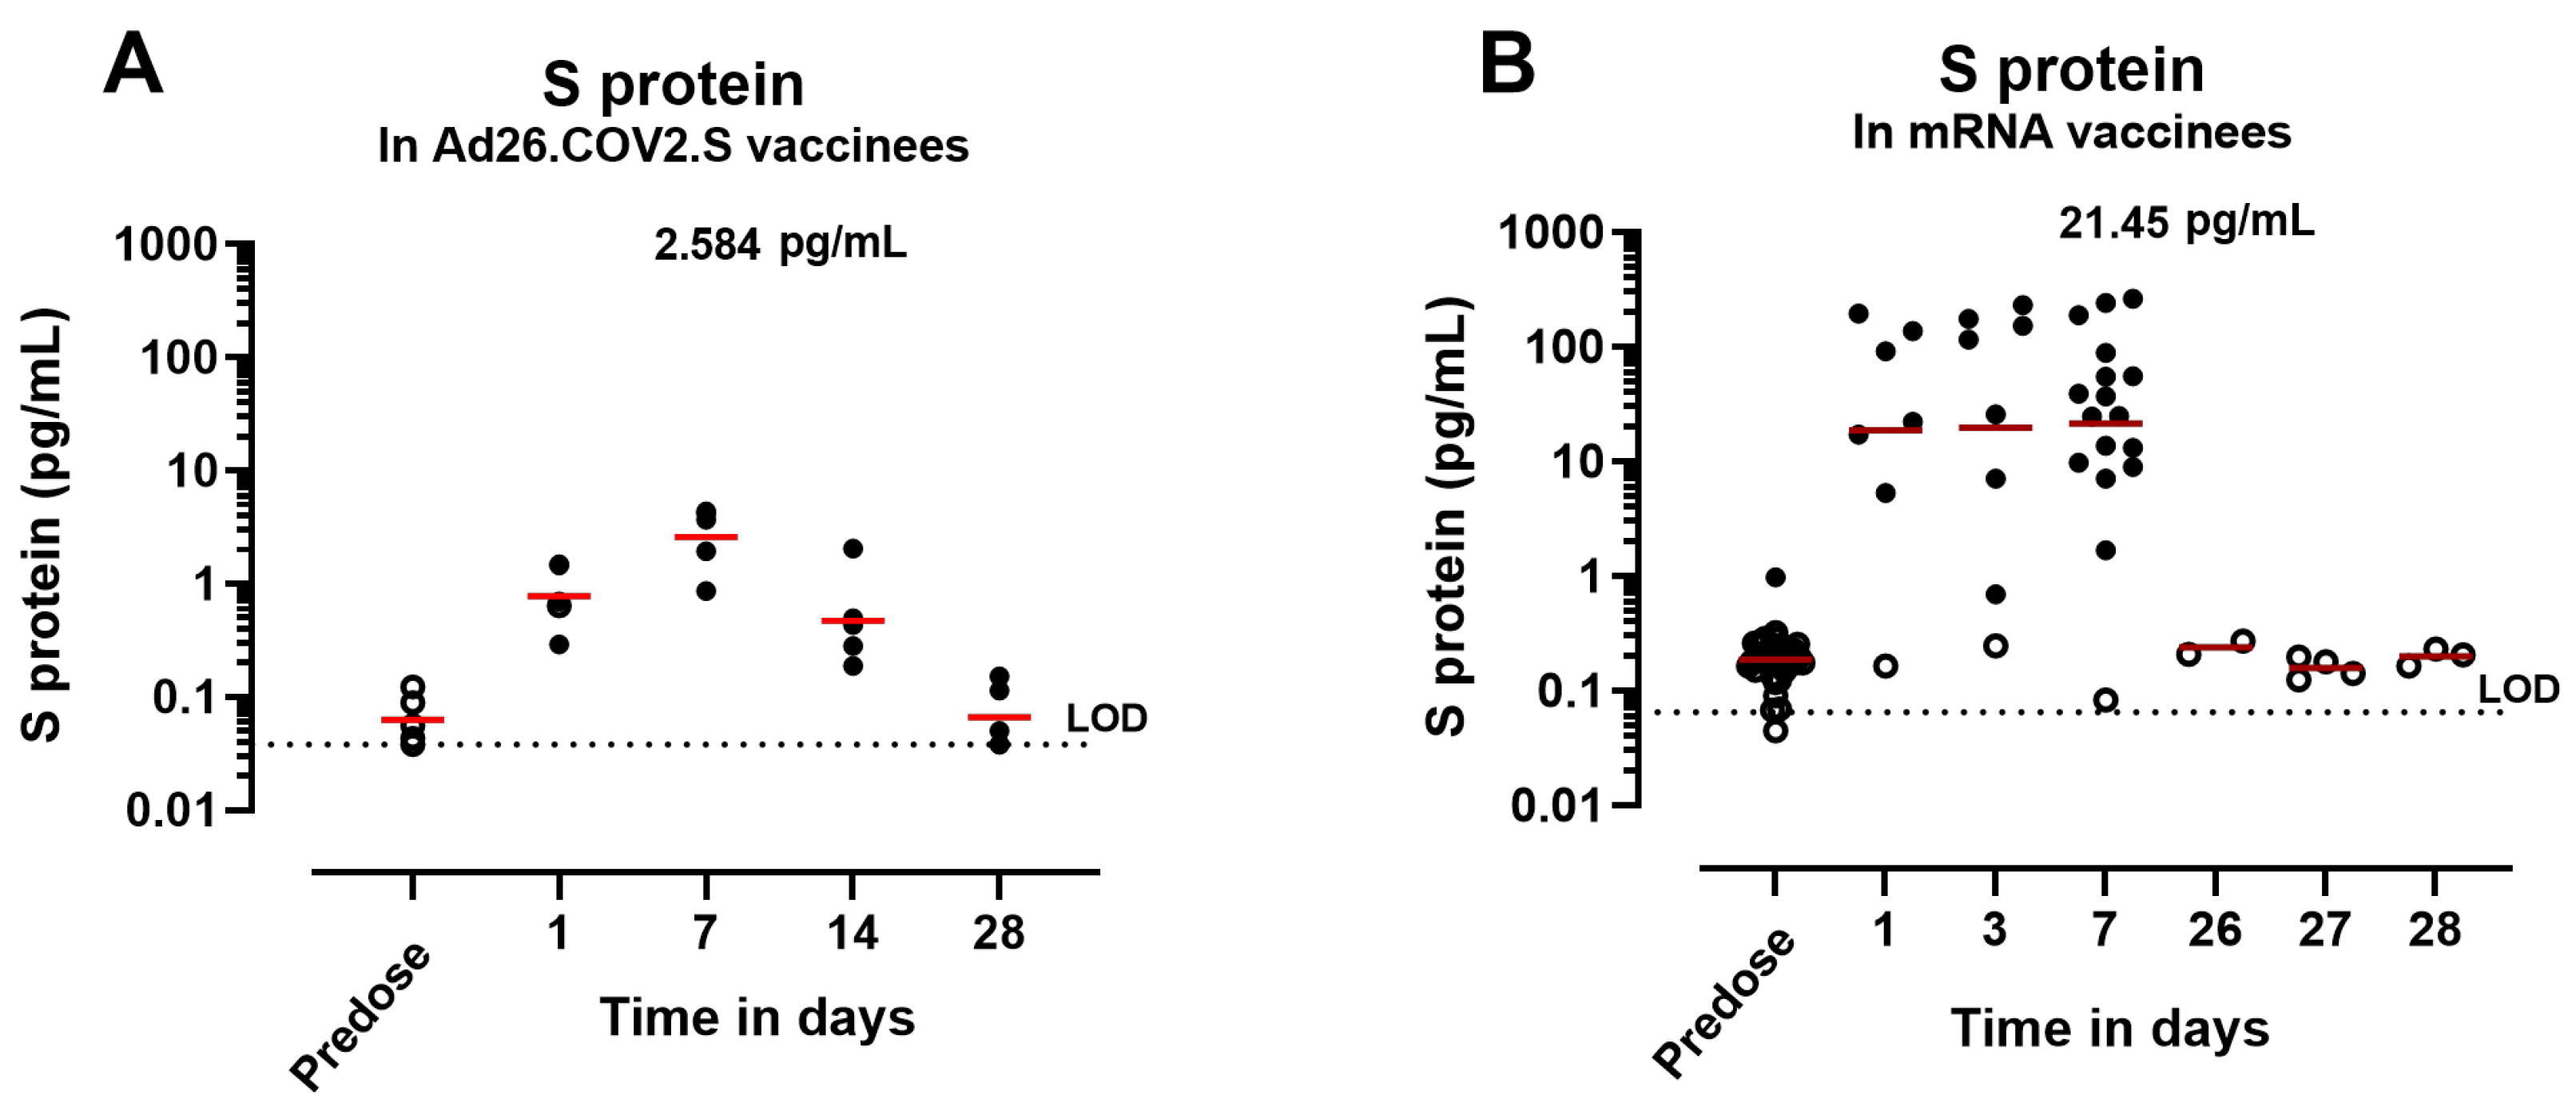
3.3. Circulating S Protein Presents Similar Expression Kinetics but Different Magnitude of Expression and Subunit Composition after IM Administration of S-Encoding mRNA Compared with Ad26.COV2.S

3.4. Anti-Spike Antibodies Interfere with S-Protein Detection in Serum after IM Administration of Ad26.COV2.S in NHPs and Humans

3.5. Low Levels of Circulating S Protein Were Detectable for a Prolonged Period after Ad26.COV2.S Administration in Antibody-Deficient Mice

4. Discussion
5. Conclusions
Author Contributions
Funding
Institutional Review Board Statement
Informed Consent Statement
Data Availability Statement
Acknowledgments
Conflicts of Interest
Appendix A


References
- Sadoff, J.; Gray, G.; Vandebosch, A.; Cardenas, V.; Shukarev, G.; Grinsztejn, B.; Goepfert, P.A.; Truyers, C.; Van Dromme, I.; Spiessens, B.; et al. Final Analysis of Efficacy and Safety of Single-Dose Ad26.COV2.S. N. Engl. J. Med. 2022, 386, 847–860. [Google Scholar] [CrossRef]
- Bos, R.; Rutten, L.; van der Lubbe, J.E.M.; Bakkers, M.J.G.; Hardenberg, G.; Wegmann, F.; Zuijdgeest, D.; de Wilde, A.H.; Koornneef, A.; Verwilligen, A.; et al. Ad26 vector-based COVID-19 vaccine encoding a prefusion-stabilized SARS-CoV-2 Spike immunogen induces potent humoral and cellular immune responses. NPJ Vaccines 2020, 5, 91. [Google Scholar] [CrossRef]
- Sadoff, J.; Le Gars, M.; Shukarev, G.; Heerwegh, D.; Truyers, C.; de Groot, A.M.; Stoop, J.; Tete, S.; Van Damme, W.; Leroux-Roels, I.; et al. Interim Results of a Phase 1-2a Trial of Ad26.COV2.S COVID-19 Vaccine. N. Engl. J. Med. 2021, 384, 1824–1835. [Google Scholar] [CrossRef]
- Ogata, A.F.; Cheng, C.A.; Desjardins, M.; Senussi, Y.; Sherman, A.C.; Powell, M.; Novack, L.; Von, S.; Li, X.; Baden, L.R.; et al. Circulating Severe Acute Respiratory Syndrome Coronavirus 2 (SARS-CoV-2) Vaccine Antigen Detected in the Plasma of mRNA-1273 Vaccine Recipients. Clin. Infect. Dis. 2022, 74, 715–718. [Google Scholar] [CrossRef]
- Shimabukuro, T.T. Thrombosis with Thrombocytopenia Syndrome (TTS) following Janssen COVID-19 Vaccine; CDC COVID-19 Vaccine Task Force Vaccine Safety Team: Atlanta, GA, USA, 2021. [Google Scholar]
- Struyf, F.; Hardt, K.; Van Rampelbergh, R.; Shukarev, G.; Inamdar, A.; Ruiz-Guinazu, J.; van Paassen, V.; Anaya-Velarde, L.; Diba, C.; Ceuppens, M.; et al. Thrombosis with thrombocytopenia syndrome: A database review of clinical trial and post-marketing experience with Ad26.COV2.S. Vaccine 2023, 41, 5351–5359. [Google Scholar] [CrossRef]
- See, I.; Lale, A.; Marquez, P.; Streiff, M.B.; Wheeler, A.P.; Tepper, N.K.; Woo, E.J.; Broder, K.R.; Edwards, K.M.; Gallego, R.; et al. Case Series of Thrombosis with Thrombocytopenia Syndrome after COVID-19 Vaccination-United States, December 2020 to August 2021. Ann. Intern. Med. 2022, 175, 513–522. [Google Scholar] [CrossRef]
- Buoninfante, A.; Andeweg, A.; Baker, A.T.; Borad, M.; Crawford, N.; Dogne, J.M.; Garcia-Azorin, D.; Greinacher, A.; Helfand, R.; Hviid, A.; et al. Understanding thrombosis with thrombocytopenia syndrome after COVID-19 vaccination. NPJ Vaccines 2022, 7, 141. [Google Scholar] [CrossRef]
- Praet, N. Janssen epidemiology activities to characterize the risk of vaccine-induced TTS. In Proceedings of the EMA Workshop on Thrombosis with Thrombocytopenia Syndrome, Virtual, 27 June 2022. [Google Scholar]
- Chen, R.T. Updated Brighton Collaboration Case Definition for Thrombosis with Thrombocytopenia Syndrome (TTS); Brighton Collaboration: Decatur, GA, USA, 2021. [Google Scholar]
- Bhuyan, P.; Medin, J.; da Silva, H.G.; Yadavalli, M.; Shankar, N.K.; Mullerova, H.; Arnold, M.; Nord, M. Very rare thrombosis with thrombocytopenia after second AZD1222 dose: A global safety database analysis. Lancet 2021, 398, 577–578. [Google Scholar] [CrossRef]
- Tsilingiris, D.; Vallianou, N.G.; Karampela, I.; Dalamaga, M. Vaccine induced thrombotic thrombocytopenia: The shady chapter of a success story. Metabol. Open 2021, 11, 100101. [Google Scholar] [CrossRef]
- Pavord, S.; Scully, M.; Hunt, B.J.; Lester, W.; Bagot, C.; Craven, B.; Rampotas, A.; Ambler, G.; Makris, M. Clinical Features of Vaccine-Induced Immune Thrombocytopenia and Thrombosis. N. Engl. J. Med. 2021, 385, 1680–1689. [Google Scholar] [CrossRef]
- Greinacher, A.; Thiele, T.; Warkentin, T.E.; Weisser, K.; Kyrle, P.A.; Eichinger, S. Thrombotic Thrombocytopenia after ChAdOx1 nCov-19 Vaccination. N. Engl. J. Med. 2021, 384, 2092–2101. [Google Scholar] [CrossRef]
- Sadoff, J.; Davis, K.; Douoguih, M. Thrombotic Thrombocytopenia after Ad26.COV2.S Vaccination—Response from the Manufacturer. N. Engl. J. Med. 2021, 384, 1965–1966. [Google Scholar] [CrossRef]
- Padmanabhan, A.; Kanack, A.J.; Kaplan, R.B.; Sangli, S. COVID-19 mRNA-1273 vaccine induces production of vaccine-induced immune thrombotic thrombocytopenia antibodies. Am. J. Hematol. 2022, 97, E223–E225. [Google Scholar] [CrossRef]
- Devi, K.; Ali, N.; Nasir, N.; Mahmood, S.F. VITT with inactivated SARS-CoV-2 vaccine—Index case. Hum. Vaccin. Immunother. 2022, 18, 2036556. [Google Scholar] [CrossRef]
- Hosseinzadeh, R.; Barary, M.; Mehdinezhad, H.; Sio, T.T.; Langer, F.; Khosravi, S. Thrombotic thrombocytopenia After Sinopharm BBIBP-CorV COVID-19 vaccination. Res. Pract. Thromb. Haemost. 2022, 6, e12750. [Google Scholar] [CrossRef]
- Herrera-Comoglio, R.; Lane, S. Vaccine-Induced Immune Thrombocytopenia and Thrombosis after the Sputnik V Vaccine. N. Engl. J. Med. 2022, 387, 1431–1432. [Google Scholar] [CrossRef]
- Johansen, S.; Laegreid, I.J.; Ernstsen, S.L.; Azrakhsh, N.A.; Kittang, A.O.; Lindas, R.; Gjertsen, B.T.; Vetti, N.; Mortberg, T.V.; Sorvoll, I.H.; et al. Thrombosis and thrombocytopenia after HPV vaccination. J. Thromb. Haemost. 2022, 20, 700–704. [Google Scholar] [CrossRef]
- Baker, A.T.; Boyd, R.J.; Sarkar, D.; Teijeira-Crespo, A.; Chan, C.K.; Bates, E.; Waraich, K.; Vant, J.; Wilson, E.; Truong, C.D.; et al. ChAdOx1 interacts with CAR and PF4 with implications for thrombosis with thrombocytopenia syndrome. Sci. Adv. 2021, 7, eabl8213. [Google Scholar] [CrossRef]
- Michalik, S.; Siegerist, F.; Palankar, R.; Franzke, K.; Schindler, M.; Reder, A.; Seifert, U.; Cammann, C.; Wesche, J.; Steil, L.; et al. Comparative analysis of ChAdOx1 nCoV-19 and Ad26.COV2.S SARS-CoV-2 vector vaccines. Haematologica 2022, 107, 947–957. [Google Scholar] [CrossRef]
- van der Neut Kolfschoten, M.; Inganas, H.; Perez-Peinado, C.; da Silva Freire, J.C.; Melchers, J.M.; van Dijk, N.; Przeradzka, M.; Kourkouta, E.; van Manen, D.; Vellinga, J.; et al. Biophysical studies do not reveal direct interactions between human PF4 and Ad26.COV2.S vaccine. J. Thromb. Haemost. 2023. [Google Scholar] [CrossRef]
- Warkentin, T.E.; Baskin-Miller, J.; Raybould, A.L.; Sheppard, J.I.; Daka, M.; Nazy, I.; Moll, S. Adenovirus-Associated Thrombocytopenia, Thrombosis, and VITT-like Antibodies. N. Engl. J. Med. 2023, 389, 574–577. [Google Scholar] [CrossRef]
- Schonborn, L.; Esteban, O.; Wesche, J.; Dobosz, P.; Broto, M.; Rovira Puig, S.; Fuhrmann, J.; Torres, R.; Serra, J.; Llevadot, R.; et al. Anti-PF4 immunothrombosis without proximate heparin or adenovirus vector vaccine exposure. Blood 2023, 142, 2305–2314. [Google Scholar] [CrossRef]
- Daviet, F.; Guervilly, C.; Baldesi, O.; Bernard-Guervilly, F.; Pilarczyk, E.; Genin, A.; Lefebvre, L.; Forel, J.M.; Papazian, L.; Camoin-Jau, L. Heparin-Induced Thrombocytopenia in Severe COVID-19. Circulation 2020, 142, 1875–1877. [Google Scholar] [CrossRef]
- Taquet, M.; Husain, M.; Geddes, J.R.; Luciano, S.; Harrison, P.J. Cerebral venous thrombosis and portal vein thrombosis: A retrospective cohort study of 537,913 COVID-19 cases. eClinicalMedicine 2021, 39, 101061. [Google Scholar] [CrossRef]
- Luhn, K. Janssen Perspective on Clinical and Non-Clinical Aspects of VITT/TTS MoA; EMA: Amsterdam, The Netherlands, 2022. [Google Scholar]
- Roytenberg, R.; Garcia-Sastre, A.; Li, W. Vaccine-induced immune thrombotic thrombocytopenia: What do we know hitherto? Front. Med. 2023, 10, 1155727. [Google Scholar] [CrossRef]
- Lei, Y.; Zhang, J.; Schiavon, C.R.; He, M.; Chen, L.; Shen, H.; Zhang, Y.; Yin, Q.; Cho, Y.; Andrade, L.; et al. SARS-CoV-2 Spike Protein Impairs Endothelial Function via Downregulation of ACE 2. Circ. Res. 2021, 128, 1323–1326. [Google Scholar] [CrossRef]
- Geeraerts, T.; Guilbeau-Frugier, C.; Garcia, C.; Memier, V.; Raposo, N.; Bonneville, F.; Gales, C.; Darcourt, J.; Voisin, S.; Ribes, A.; et al. Immunohistologic Features of Cerebral Venous Thrombosis Due to Vaccine-Induced Immune Thrombotic Thrombocytopenia. Neurol. Neuroimmunol. Neuroinflammation 2023, 10, 2287. [Google Scholar] [CrossRef]
- Zhang, S.; Liu, Y.; Wang, X.; Yang, L.; Li, H.; Wang, Y.; Liu, M.; Zhao, X.; Xie, Y.; Yang, Y.; et al. SARS-CoV-2 binds platelet ACE2 to enhance thrombosis in COVID-19. J. Hematol. Oncol. 2020, 13, 120. [Google Scholar] [CrossRef]
- Azzarone, B.; Veneziani, I.; Moretta, L.; Maggi, E. Pathogenic Mechanisms of Vaccine-Induced Immune Thrombotic Thrombocytopenia in People Receiving Anti-COVID-19 Adenoviral-Based Vaccines: A Proposal. Front. Immunol. 2021, 12, 728513. [Google Scholar] [CrossRef]
- Guide for the Care and Use of Laboratory Animals, 8th ed.; The National Academies Collection: Reports funded by National Institutes of Health; The National Academies Press: Washington, DC, USA, 2011.
- U.S. Department of Health and Human Services; National Institutes of Health Office of Laboratory Animal Welfare. Public Health Service Policy on Humane Care and Use of Laboratory Animals; U.S. Department of Health and Human Services: Washington, DC, USA, 2015; No. 15-8013. [Google Scholar]
- Stephenson, K.E.; Le Gars, M.; Sadoff, J.; de Groot, A.M.; Heerwegh, D.; Truyers, C.; Atyeo, C.; Loos, C.; Chandrashekar, A.; McMahan, K.; et al. Immunogenicity of the Ad26.COV2.S Vaccine for COVID-19. JAMA 2021, 325, 1535–1544. [Google Scholar] [CrossRef]
- Hardt, K.; Vandebosch, A.; Sadoff, J.; Le Gars, M.; Truyers, C.; Lowson, D.; Van Dromme, I.; Vingerhoets, J.; Kamphuis, T.; Scheper, G.; et al. Efficacy, safety, and immunogenicity of a booster regimen of Ad26.COV2.S vaccine against COVID-19 (ENSEMBLE2): Results of a randomised, double-blind, placebo-controlled, phase 3 trial. Lancet Infect. Dis. 2022, 22, 1703–1715. [Google Scholar] [CrossRef]
- Zahn, R.; Gillisen, G.; Roos, A.; Koning, M.; van der Helm, E.; Spek, D.; Weijtens, M.; Grazia Pau, M.; Radosevic, K.; Weverling, G.J.; et al. Ad35 and ad26 vaccine vectors induce potent and cross-reactive antibody and T-cell responses to multiple filovirus species. PLoS ONE 2012, 7, e44115. [Google Scholar] [CrossRef]
- Widjojoatmodjo, M.N.; Bogaert, L.; Meek, B.; Zahn, R.; Vellinga, J.; Custers, J.; Serroyen, J.; Radosevic, K.; Schuitemaker, H. Recombinant low-seroprevalent adenoviral vectors Ad26 and Ad35 expressing the respiratory syncytial virus (RSV) fusion protein induce protective immunity against RSV infection in cotton rats. Vaccine 2015, 33, 5406–5414. [Google Scholar] [CrossRef]
- Salisch, N.C.; Stephenson, K.E.; Williams, K.; Cox, F.; van der Fits, L.; Heerwegh, D.; Truyers, C.; Habets, M.N.; Kanjilal, D.G.; Larocca, R.A.; et al. A Double-Blind, Randomized, Placebo-Controlled Phase 1 Study of Ad26.ZIKV.001, an Ad26-Vectored Anti-Zika Virus Vaccine. Ann. Intern. Med. 2021, 174, 585–594. [Google Scholar] [CrossRef]
- EMA. Comirnaty; Assessment report; EMA: Amsterdam, The Netherlands, 2021; Volume 46, p. 47. [Google Scholar]
- Juraszek, J.; Rutten, L.; Blokland, S.; Bouchier, P.; Voorzaat, R.; Ritschel, T.; Bakkers, M.J.G.; Renault, L.L.R.; Langedijk, J.P.M. Stabilizing the closed SARS-CoV-2 spike trimer. Nat. Commun. 2021, 12, 244. [Google Scholar] [CrossRef]
- Sheets, R.L.; Stein, J.; Bailer, R.T.; Koup, R.A.; Andrews, C.; Nason, M.; He, B.; Koo, E.; Trotter, H.; Duffy, C.; et al. Biodistribution and toxicological safety of adenovirus type 5 and type 35 vectored vaccines against human immunodeficiency virus-1 (HIV-1), Ebola, or Marburg are similar despite differing adenovirus serotype vector, manufacturer’s construct, or gene inserts. J. Immunotoxicol. 2008, 5, 315–335. [Google Scholar] [CrossRef]
- van der Lubbe, J.E.M.; Rosendahl Huber, S.K.; Vijayan, A.; Dekking, L.; van Huizen, E.; Vreugdenhil, J.; Choi, Y.; Baert, M.R.M.; Feddes-de Boer, K.; Izquierdo Gil, A.; et al. Ad26.COV2.S protects Syrian hamsters against G614 spike variant SARS-CoV-2 and does not enhance respiratory disease. NPJ Vaccines 2021, 6, 39. [Google Scholar] [CrossRef]
- Khan, S.; Marquez-Martinez, S.; Erkens, T.; de Wilde, A.; Costes, L.M.M.; Vinken, P.; De Jonghe, S.; Roosen, W.; Talia, C.; Chamanza, R.; et al. Intravenous Administration of Ad26.COV2.S Does Not Induce Thrombocytopenia or Thrombotic Events or Affect SARS-CoV-2 Spike Protein Bioavailability in Blood Compared with Intramuscular Vaccination in Rabbits. Vaccines 2023, 11, 1792. [Google Scholar] [CrossRef]
- Chen, J.; Trounstine, M.; Alt, F.W.; Young, F.; Kurahara, C.; Loring, J.F.; Huszar, D. Immunoglobulin gene rearrangement in B cell deficient mice generated by targeted deletion of the JH locus. Int. Immunol. 1993, 5, 647–656. [Google Scholar] [CrossRef]
- Robles, J.P.; Zamora, M.; Adan-Castro, E.; Siqueiros-Marquez, L.; Martinez de la Escalera, G.; Clapp, C. The spike protein of SARS-CoV-2 induces endothelial inflammation through integrin alpha5beta1 and NF-kappaB signaling. J. Biol. Chem. 2022, 298, 101695. [Google Scholar] [CrossRef]
- Raghavan, S.; Kenchappa, D.B.; Leo, M.D. SARS-CoV-2 Spike Protein Induces Degradation of Junctional Proteins That Maintain Endothelial Barrier Integrity. Front. Cardiovasc. Med. 2021, 8, 687783. [Google Scholar] [CrossRef] [PubMed]
- Stebbings, R.; Jones, C.; Cotton, P.; Armour, G.; Maguire, S.; Skellett, V.; Tang, C.M.; Goodman, J.; Brady, T.; Takahashi, V.; et al. SARS-CoV-2 Spike Protein Expression In Vitro and Hematologic Effects in Mice Vaccinated With AZD1222 (ChAdOx1 nCoV-19). Front. Immunol. 2022, 13, 836492. [Google Scholar] [CrossRef] [PubMed]
- De Michele, M.; Piscopo, P.; Crestini, A.; Rivabene, R.; D’Amati, G.; Leopizzi, M.; Stefanini, L.; Pulcinelli, F.; Chistolini, A.; Iacobucci, M.; et al. Vaccine-induced immune thrombotic thrombocytopenia: A possible pathogenic role of ChAdOx1 nCoV-19 vaccine-encoded soluble SARS-CoV-2 spike protein. Haematologica 2022, 107, 1687–1692. [Google Scholar] [CrossRef] [PubMed]
Disclaimer/Publisher’s Note: The statements, opinions and data contained in all publications are solely those of the individual author(s) and contributor(s) and not of MDPI and/or the editor(s). MDPI and/or the editor(s) disclaim responsibility for any injury to people or property resulting from any ideas, methods, instructions or products referred to in the content. |
© 2024 by the authors. Licensee MDPI, Basel, Switzerland. This article is an open access article distributed under the terms and conditions of the Creative Commons Attribution (CC BY) license (https://creativecommons.org/licenses/by/4.0/).
Share and Cite
Marquez-Martinez, S.; Khan, S.; Lubbe, J.v.d.; Solforosi, L.; Costes, L.M.M.; Choi, Y.; Boedhoe, S.; Verslegers, M.; Heerden, M.v.; Roosen, W.; et al. The Biodistribution of the Spike Protein after Ad26.COV2.S Vaccination Is Unlikely to Play a Role in Vaccine-Induced Immune Thrombotic Thrombocytopenia. Vaccines 2024, 12, 559. https://doi.org/10.3390/vaccines12050559
Marquez-Martinez S, Khan S, Lubbe Jvd, Solforosi L, Costes LMM, Choi Y, Boedhoe S, Verslegers M, Heerden Mv, Roosen W, et al. The Biodistribution of the Spike Protein after Ad26.COV2.S Vaccination Is Unlikely to Play a Role in Vaccine-Induced Immune Thrombotic Thrombocytopenia. Vaccines. 2024; 12(5):559. https://doi.org/10.3390/vaccines12050559
Chicago/Turabian StyleMarquez-Martinez, Sonia, Selina Khan, Joan van der Lubbe, Laura Solforosi, Lea M. M. Costes, Ying Choi, Satish Boedhoe, Mieke Verslegers, Marjolein van Heerden, Wendy Roosen, and et al. 2024. "The Biodistribution of the Spike Protein after Ad26.COV2.S Vaccination Is Unlikely to Play a Role in Vaccine-Induced Immune Thrombotic Thrombocytopenia" Vaccines 12, no. 5: 559. https://doi.org/10.3390/vaccines12050559