Article

High-Throughput Phenotyping for the Evaluation of Agronomic Potential and Root Quality in Tropical Carrot Using RGB Sensors

by
Fernanda Gabriela Teixeira Coelho
1,
Gabriel Mascarenhas Maciel
2,*,
Ana Carolina Silva Siquieroli
3,
Rodrigo Bezerra de Araújo Gallis
4,
Camila Soares de Oliveira
2,
Ana Luisa Alves Ribeiro
1 and
Lucas Medeiros Pereira
1
1
Postgraduate Program in Agronomy, Institute of Agrarian Sciences, Federal University of Uberlândia, Uberlândia 38410-337, Brazil
2
Institute of Agrarian Sciences, Federal University of Uberlândia, Monte Carmelo 38500-000, Brazil
3
Institute of Biotechnology, Federal University of Uberlândia, Monte Carmelo 38500-000, Brazil
4
Institute of Geography, Federal University of Uberlândia, Monte Carmelo 38500-000, Brazil
*
Author to whom correspondence should be addressed.
Agriculture 2024, 14(5), 710; https://doi.org/10.3390/agriculture14050710
Submission received: 17 March 2024 / Revised: 21 April 2024 / Accepted: 25 April 2024 / Published: 30 April 2024
(This article belongs to the Section Genotype Evaluation and Breeding)

Abstract

:
The objective of this study was to verify the genetic dissimilarity and validate image phenotyping using RGB (red, green, and blue) sensors in tropical carrot germplasms. The experiment was conducted in the city of Carandaí-MG, Brazil, using 57 tropical carrot entries from Seminis and three commercial entries. The entries were evaluated agronomically and two flights with Remotely Piloted Aircraft (RPA) were conducted. Clustering was performed to validate the existence of genetic variability among the entries using an artificial neural network to produce a Kohonen’s self-organizing map. The genotype–ideotype distance index was used to verify the best entries. Genetic variability among the tropical carrot entries was evidenced by the formation of six groups. The Brightness Index (BI), Primary Colors Hue Index (HI), Overall Hue Index (HUE), Normalized Green Red Difference Index (NGRDI), Soil Color Index (SCI), and Visible Atmospherically Resistant Index (VARI), as well as the calculated areas of marketable, unmarketable, and total roots, were correlated with agronomic characters, including leaf blight severity and root yield. This indicates that tropical carrot materials can be indirectly evaluated via remote sensing. Ten entries were selected using the genotype–ideotype distance (2, 15, 16, 22, 34, 37, 39, 51, 52, and 53), confirming the superiority of the entries.

1. Introduction

The carrot (Daucus carota L.) is a vegetable of global economic importance. It represents a significant source of nutrients such as carotenoids, phenolic compounds, and vitamins, with benefits for human health [1]. Annual carrot production in the world exceeds 40 million tons and 1.1 million hectares [2]. In Brazil, it is the root vegetable with the highest economic value, with production estimates exceeding 700 thousand tons per year [3].
The development of cultivars adapted to summer and winter cultivation on all continents has allowed for the year-round availability of carrot products with relatively stable prices for consumers. However, genetic improvement of the carrot has been a continuous effort throughout its cultivation and domestication [4]. A current, major challenge lies in the need to advance phenotyping in scale, accuracy, and reproducibility for the exploration of new traits.
Consequently, increasingly modern methods of plant analysis have been used, mainly using images generated on automated platforms or obtained by drones, such as Remotely Piloted Aircraft (RPA) [5,6]. Image phenotyping can be used to calculate vegetation indices and correlate them with qualitative or quantitative values regarding genotype performance in a given environment [7]. In addition, image phenotyping offers a non-destructive analysis of plant traits with lower cost, time, and labor [5,8].
UAVs equipped with RGB (red, green, and blue) sensors offer a platform for image collection with good resolution permitting decision-making across a wide range of applications in precision agriculture and contribute to increased efficiency and productivity. RGB sensors capture high-resolution imagery, enabling a detailed analysis of features. This high spatial resolution is beneficial for applications such as crop monitoring. They have lower costs, making them an attractive option for organizations with budget constraints. RGB sensors can provide high-resolution information for crop monitoring, disease detection, and in our case, high-throughput phenotyping. Herzig et al. [9] used RGB and multispectral sensors to evaluate both high-throughput phenotyping and yield prediction in barley breeding. The authors concluded that for yield prediction, the RGB system used in the study would be preferable to the multispectral system due to lower costs and consumer-friendly handling in image acquisition and processing.
Several studies demonstrate the potential of vegetation indices calculated from imagery to assess agronomic traits in potato [10], lettuce [6], onion and garlic [11,12], eggplant, tomato, cabbage [8], soybean, and corn [13,14], with few studies evaluating roots. In this way, studies with carrots are limited. The genetic improvement of carrots has been carried out through data collection and direct field evaluations [3], mainly focusing on roots. This demands a lot of labor, high costs, and delays in advancing productivity and quality for this crop. After harvesting, the roots are classified, requiring a high standard of quality. The scarcity of new alternatives for selection has resulted in waste and a lack of incentive to advance in germplasm improvement. Thus, the objective of the current study was to quantify the genetic dissimilarity and validate image phenotyping using RGB (red, green, and blue) sensors in tropical carrot germplasm from RGB images.

2. Materials and Methods

2.1. Genetic Material, Experimental Site, and Flow

The experiment was conducted at the Bayer Vegetable Experiment Station in the city of Carandaí-MG, Brazil (1096 m altitude) from November 2019 to March 2020 (Figure 1) and data were processed at the Federal University of Uberlândia, Monte Carmelo campus, Brazil. The average data regarding maximum, average, and minimum temperature and precipitation during the experiment are described in Figure 1.
We evaluated 57 entries from the Seminis tropical carrot breeding program (Brazil) and three commercial entries as controls (two hybrids—entries 1 and 2, and a tropical open pollination cultivar—entry 3).
The experimental design was a randomized complete block design (RCBD) with three repetitions. The entries were sown in 1.5 m wide beds and the plots consisted of five 2 m long planting lines, spaced 20 cm apart. The useful area of the plot consisted of all rows, excluding 50 cm at the beginning and end of the plots.
The methodological steps for agronomic evaluation, image processing, and data analysis are presented in the flow chart in Figure 2.

2.2. Evaluation of Agronomic Traits in the Field

One hundred and ten days after sowing, the agronomic evaluation of the entries was performed. The bolting percentage (BP), and the severity of leaf blight in the plots (DIS), which was evaluated using a scale of grades from 1 to 5 (1 = >90% severity, 2 = 50–90%, 3 = 12.5–50%, 4 = 3.8–12.55%, and 5 = <3.8% severity), were evaluated [15].
After harvest, fresh leaf weight (kg) (LW) and percentage of purple or green shoulder (SHP) were measured. The number and mass (kg) of marketable roots (10 to 26 cm in length) and unmarketable roots (smaller than 10 cm in length, broken, cracked, and forked) were evaluated. Data were transformed into the percentage of marketable roots (%) (MRP) and percentage of unmarketable roots (%) (URP), estimated yield of marketable roots (t ha−1) (MYH), and estimated total yield (t ha−1) (TYH). On a random sample of ten roots, the average root diameter (performed at the middle portion of the root) (RD) and average root length (RL) were determined.

2.3. Acquisition and Processing of Aerial Images

On the same day of the agronomic data collection, two flights were performed: a flight before harvest, to verify the foliar portion of the entries; and a flight after harvest, obtaining images of the roots produced by each genotype, separated into marketable and unmarketable roots. The aerial images were collected using a Phantom 4 Advanced drone, with a 20-megapixel RGB camera (model FC6310). The flight was performed automatically using the software DroneDeploy version 5.23.0, using the parameters of 20 m high, longitudinal overlap of 80%, and lateral overlap of 75%.
The collected images were processed in the Remote Sensing and Photogrammetry Laboratory (LASER) of the Federal University of Uberlândia (UFU), Monte Carmelo Campus, Brazil, using the software Pix4Dmapper version 1.1.38, to generate the orthomosaic. The software, Quantum GIS 3.10.0 (QGIS Development Team, Open-Source Geospatial Foundation) was used to calculate the vegetation indices from orthophoto 1 of the leaf portion of the entries (Table 1), in addition to the marketable root area (MRA), unmarketable root area (URA), and total root area (TRA) (m2) from orthophoto 2. The root areas were determined from the identification and contour of the marketable and unmarketable roots in each plot.

2.4. Statistical Analysis

The results of the agronomic characters were submitted to an analysis of variance using the F-test at the p ≥ 0.01 and p ≥ 0.05 levels of statistical significance, and the genetic parameters and genotypic determination coefficient (H2) were estimated. The means of the entries were grouped based on the Scott–Knott test at the p ≥ 0.01 and p ≥ 0.05 probability levels. Pearson’s correlation matrix was calculated at the p ≥ 0.05 significance level between the evaluated agronomic characters and the vegetation values and indices obtained using remote sensing. The statistical analysis was performed using the GENES software version 1990.2021.131 [22].

2.5. Artificial Neural Intelligence for Grouping

In order to validate the existence of genetic variability among the carrot entries, the grouping of the entries was performed using neural intelligence to produce Kohonen’s Self-Organizing Map (SOM). The SOMs were obtained by applying a traditional, unsupervised approach according to the evaluated characteristics and needs of the study.
The determination of the optimal number of groups was completed using the K-means test, and the map was drawn in a 3 × 2 arrangement (three rows and two columns). Other parameters included: radius equal to one, hexagonal neighborhood topology, feedforward network architecture with one input layer and one output neuron, and the activation function of Euclidean Distance, and 3000 thousand epochs. The GENES software with Metalab version 1990.2021.131 [22] was used.

2.6. Selection of the Best Entries Using the Genotype–Ideotype Distance Index

The genotype–ideotype distance index was used based on the best behavior verified for each character evaluated in this study. This ideotype was defined by the highest means for the characters RL, RD, LW, MRP, TYH, and MYH; and the lowest means for the characters BP, DIS, SHP, and URP. Then, Mahalanobis distances (D2) were estimated from standardized data between the 60 entries and the ideotype, using the GENES computer program [22]. In this way, the entries were classified according to the distance they presented in relation to the ideotype, considering the best entries to be those that presented the smallest distances.

3. Results and Discussion

3.1. Germoplasm Evaluation

Genetic variability was observed among carrot entries for all agronomic characters evaluated (p < 0.01 and p < 0.05) (Table 2).
The coefficient of variation (CV) ranged from 5.6–74.58% for RD and BP, respectively. The lowest and highest phenotypic, environmental, and genotypic variances were found for the traits RD and SHP. The agronomic traits, BP, SHP, TYH, and MYH, had genotypic variances that were greater than the environmental variance, in agreement with the high heritabilities (89.46, 72.48, 89.15, and 88.17%, respectively), and CVg/CVe quotient values close to or greater than 1. The characters, MRP and URP, had an environmental variance greater than the genetic variance, low heritability (36.86% for both), and a low CVg/CVe quotient, indicating the predominance of environmental effects over genetic effects. In agreement with the present study, De Carvalho et al. [23] also found high heritability for the characters marketable root mass (82.18%) and total root mass (81.85%).
The means of the phenotypic values of the tropical carrot entries in relation to the agronomic characters were evaluated. The flowering percentage ranged from 0 to 34.07%, with the highest tolerance to flowering seen in entries 7, 21, 31, and 55 and the highest flowering in entry 3. Entries 1 and 2 did not differ and were in the group of best resistance to flowering. Importantly, the entry 3 presented inferior characteristics to the other entries because it is a tropical open-pollination cultivar, being the first tropical carrot cultivar adapted for Brazil to boost carrot production [24]. However, current breeding programs aim at the development of hybrids, which present greater root uniformity and a higher yield of marketable roots [23].
For leaf blight severity and percentage of purple or green shoulder there were two groups, with an average variation of scores from 2–4, and 4.70–40.71%, respectively. The highest severity of disease was observed in entry 60 and the highest percentage of green or purple shoulder was in entries 3 and 5. Leaf blight is a disease caused by the Alternaria dauci, Cercospora carotae, and Xanthomonas campestris complex, considered worldwide as the main disease of carrots in summer crops and responsible for important production losses [25]. Pereira et al. [15] found a higher severity of leaf blight in the Brasília and Juliana cultivars compared to the other entries evaluated in their study.
Average root length (13.17–19.67 cm) and diameter (2.13–2.97 cm) led to the formation of three groups in which entries 1, 2, 9, 10, 15, 31, 33, 34, 36, 37, 38, 39, 47, 49, 51, 53, and 56 had the highest averages for both variables. For fresh leaf weight, there was variation from 0.5–2.05 kg for entries 13 and 39, respectively, and the formation of five groups. De Carvalho et al. [3], in a study with three carrot cultivars to determine harvest time, found average root lengths very similar to the present studies of 17.25 to 18.47 cm, and higher average root diameters with values between 3.03 and 3.26 cm.
The percentages of marketable roots and unmarketable roots are complementary variables, and entry 2 is the one that presented the best results, with 92.01% of marketable roots and 7.99% of unmarketable roots; entry 54 presented the worst results, with 68.29% of marketable roots and 31.71% of unmarketable roots. De Carvalho et al. [26], in a study with carrots in the city of Brasília-DF, obtained a percentage of marketable roots from 0.04–62.20%, values far from the present study.
The estimated total yield ranged from 11.46–37.60 t ha−1 for entries 13 and 53, respectively. For the estimated yield of marketable roots, the variation among entries was from 9.07–33.28 t ha−1 for entries 13 and 2, respectively. Entry 53, despite being the most productive, had fewer marketable roots than entry 2. De Carvalho et al. [26] also analyzed the estimated total yield and found results that varied from 10.20 to 52.06 t ha−1, and for marketable roots the range was 5.14 to 27.97 t ha−1, results close to those found in this article.

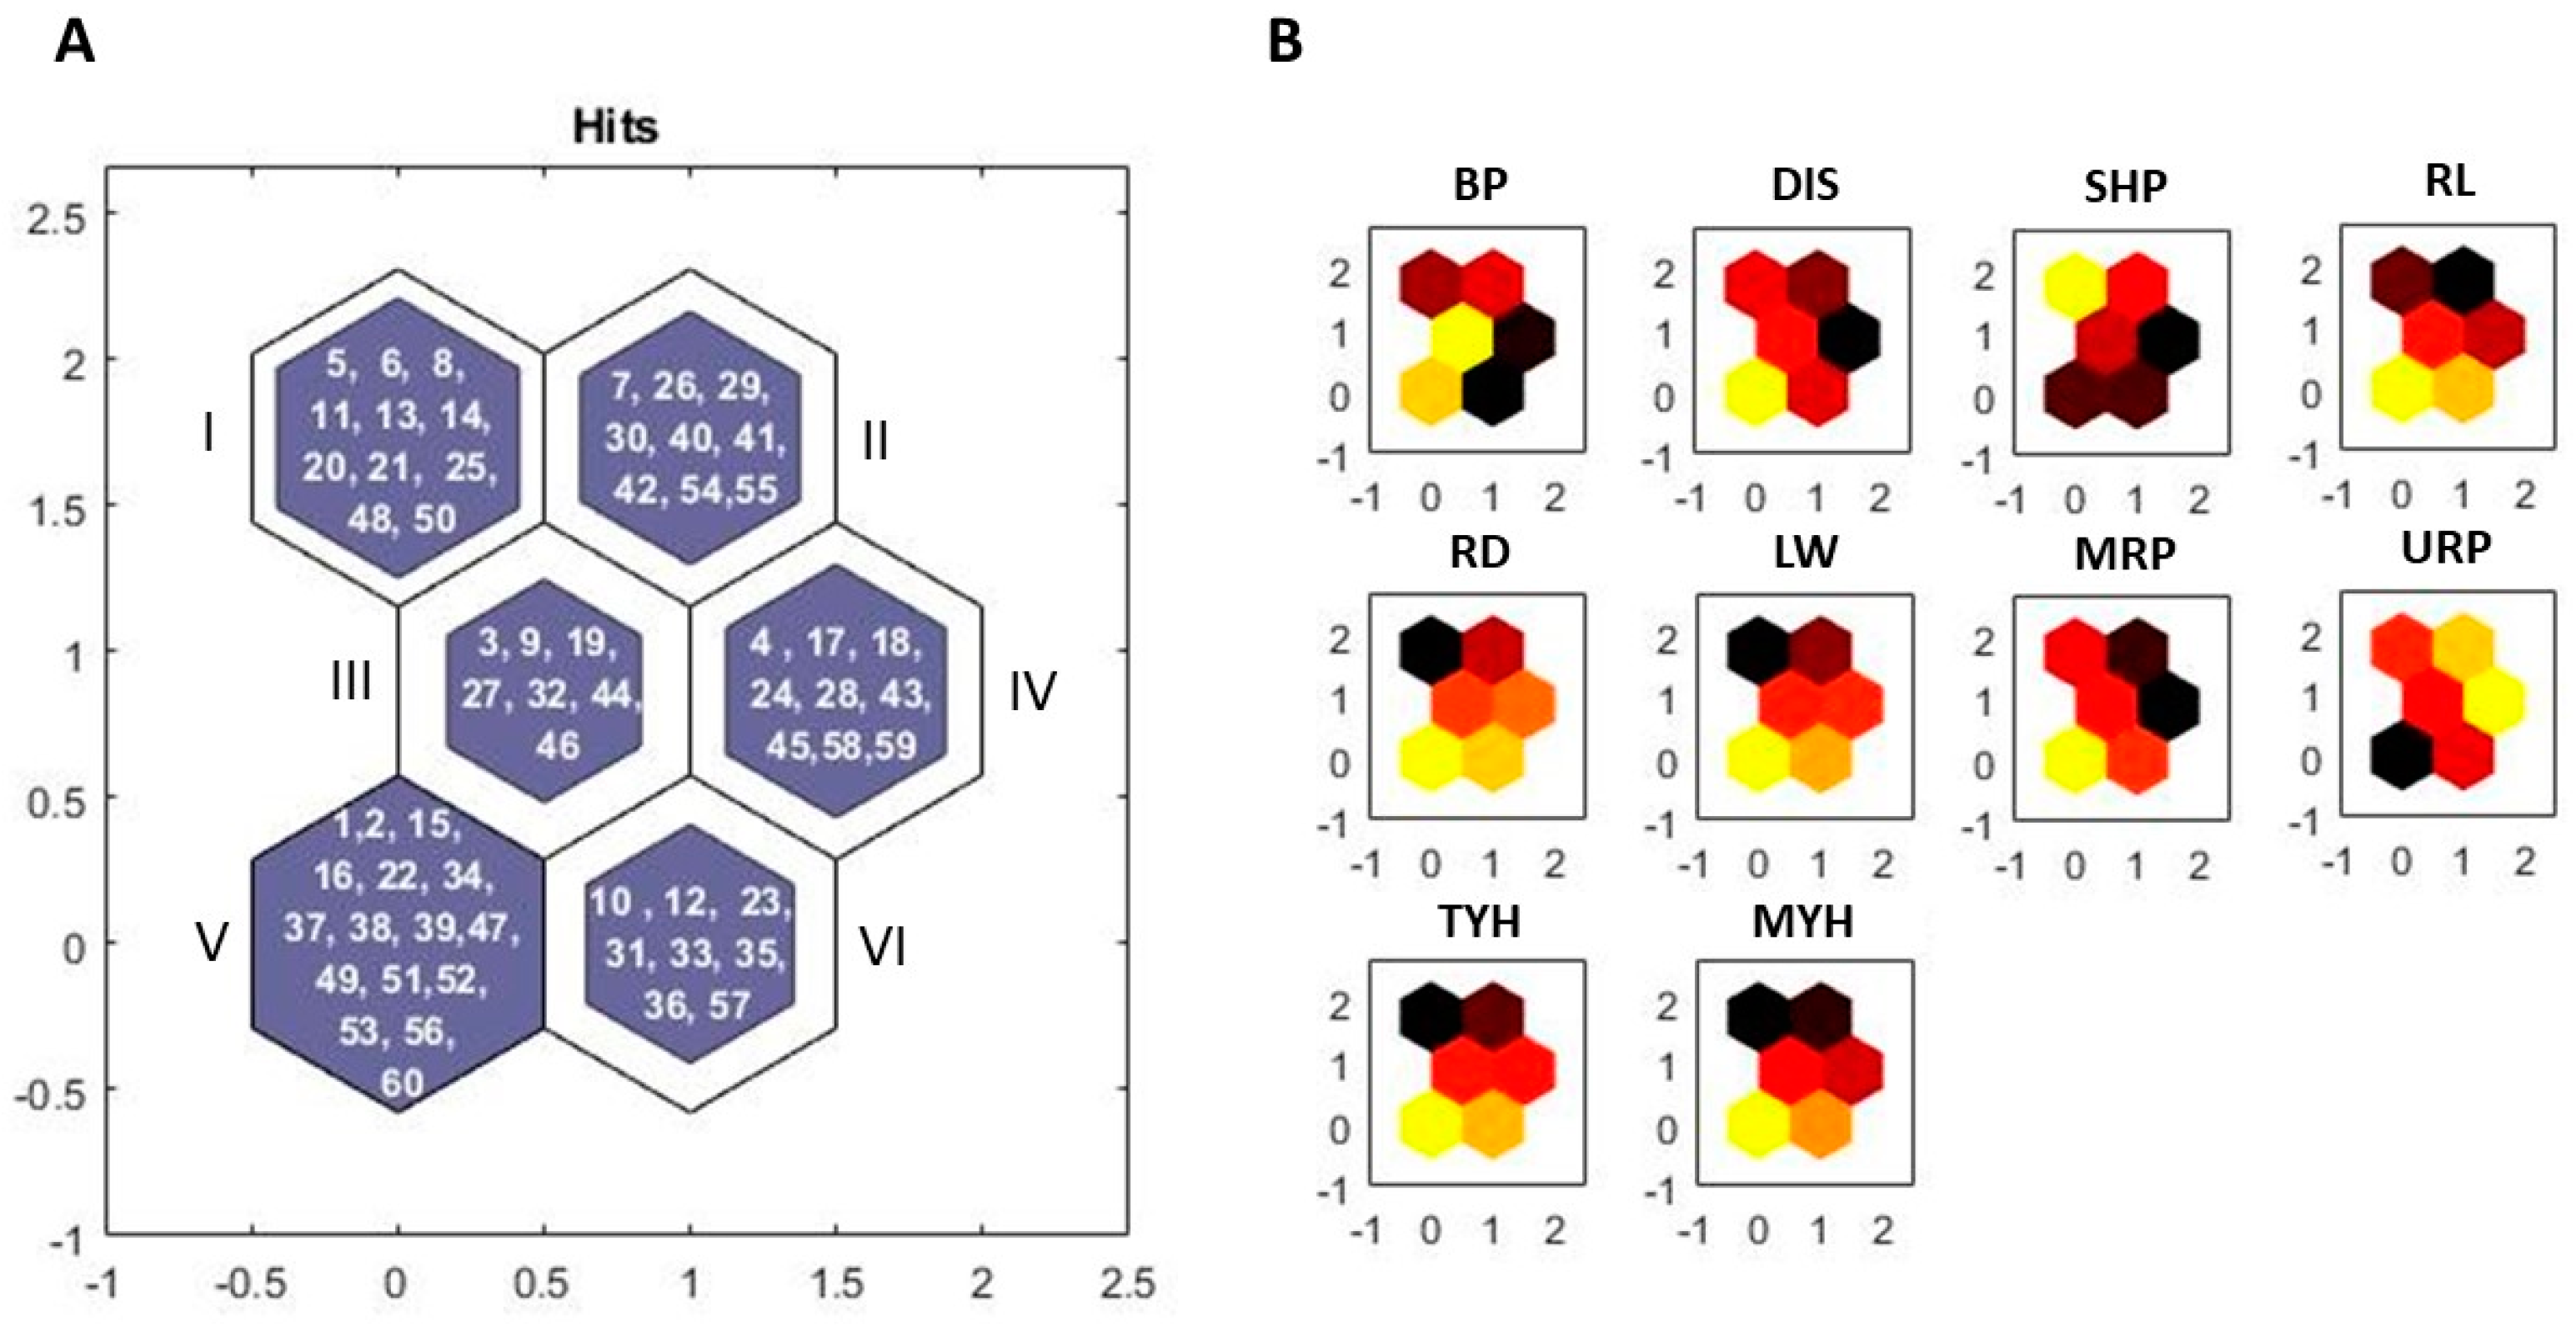
3.2. Grouping of Entries by Kohonen’s Self-Organizing Map

The 60 entries evaluated were classified and distributed in six distinct groups (Figure 3). This result proves the diversity of the germplasm and facilitates the study of phenotyping using images. The contribution of agronomic variables to the grouping was also determined, where lighter colors indicate a greater contribution to group formation and identical color patterns between variables correspond to a positive correlation between them.
Group I was composed of 11 entries with a greater contribution from the variable percentage of purple or green shoulder. Group II was formed by nine entries and the greatest contribution from the variable percentage of unmarketable roots. Group III was formed by nine entries, where the greatest contribution of this group was from the variable bolting percentage. Group IV was composed of nine entries and had the largest contribution from the variable percentage of unmarketable roots.
Group V had 16 entries, among them the commercial hybrids, entry 1 and 2. This group indicated a higher contribution from the variables leaf blight severity, root length and diameter, fresh leaf weight, percentage of marketable roots, total yield estimate, and marketable root yield estimate. This indicates that this group, despite having higher scores for disease, contains the most superior entries in the present study. Group VI presents the eight entries with the highest contribution, but not as strong, of the variables root length and diameter, fresh leaf weight, estimated total yield, and estimated yield of marketable roots.
The results presented indicate that there is genetic variability among the tropical carrot entries evaluated. The artificial neural network method using the Kohonen self-organizing map was efficient in demonstrating this diversity and facilitated a comprehensive evaluation of the entries, simplifying the interpretation of the similarities and differences among them.
Important results were also found in the literature, which reinforce the data found in the present study. Janaszek and Trajer [27] also found genetic variability using Kohonen’s self-organizing map for clustering carrot cultivars in Poland in terms of coloration and nutritional components, in which they obtained 49 clusters in a 7 × 7 arrangement. Monyr et al. [28] also used Kohonen’s self-organizing map to study heavy-metal-contaminated sediments in carrots. Classifying the data using this method allowed for understanding and visualizing of the spatial and temporal distribution of the samples.
The study by Abreu et al. [1] presented information that makes it possible to consider artificial neural networks as an effective tool for data treatment and grouping according to their similarities, as carried out in this study. The results obtained by the authors provided the same information when compared to traditional multivariate statistical techniques, whereas the self-organized maps were easier to visualize and analyze.

3.3. Validation of Image Phenotyping for Tropical Carrot

Considering the existence of genetic diversity among the materials, we proceeded with the evaluation of the entries using imaging. Obtaining data from images obtained by RPAs in agriculture depends on image processing to extract the appropriate information and achieve the desired objectives [5,8]. After calculating the vegetation indices of the first flight (Table 1), the distribution of the values of each index on the pixels was analyzed using histograms (Figure 4).
Most indices show high variability among entries, especially for BGI, GLI, NGRDI, SCI, SI, and VARI, indicating that these indices are potential tools for differentiating tropical carrot entries.
Figure 5A demonstrates the behavior of some selection indices (VARI, SCI, GLI, NGRDI) calculated according to Table 1 from orthophoto 1, in the leaf portion of the carrot entries. The vegetation indices showed different behavior for the entries under study and facilitated the analysis of each entry individually. Figure 5B represents the marketable and unmarketable roots areas produced by each entry (calculated by means of orthophoto 2, obtained after harvest), and the separation of the marketable and unmarketable roots. The area of the roots also indicated important differences regarding the production of each genotype.
Through the correlation matrix (Pearson’s r), it was possible to verify the possibility of selecting carrot entries from the vegetation indices calculated using RPA images and understand the correlation that exists between the agronomic characters (Figure 6). Understanding correlation is important because strongly correlated traits make indirect selection possible using the trait that is simplest to measure [29]. An r-coefficient less than 0.30 is considered weak, 0.30 to 0.59 moderate, 0.60 to 0.89 strong, and 0.90 to 1.00 very strong.
As for the correlations among the agronomic characters, average root diameter was strongly correlated with estimated total yield (0.79) and estimated yield of marketable roots (0.74). A strong correlation between fresh leaf weight and estimated total yield (0.67) and estimated yield of marketable roots (0.63) was found. The estimated yield of marketable roots was strongly correlated with the percentage of marketable roots (0.64) and estimated total yield (0.98). The percentage of marketable roots was strongly correlated with the percentage of unmarketable roots (−1.00).
Other authors also studied the correlations between agronomic traits in carrots. De Carvalho et al. [3], evaluating 36 carrot genotypes, found a strong correlation between marketable root mass and unmarketable roots mass (1.00), resembling what we found for the percentage of marketable and percentage of unmarketable roots. They also detected that the marketable root mass also showed a strong correlation with the number of marketable roots, average root length, and average root mass. Similarly to the present study, Da Silva et al. [29] in carrot trials conducted in Brasília-DF, found that root mass has a high correlation with root diameter.
For the vegetation indices and object area calculated by means of the orthophotos, there were important correlations with the agronomic characters. This indicates that tropical carrot entries can be indirectly evaluated by vegetation indices obtained using remote sensing.
We highlight the correlation of the vegetation index, BI, with average root diameter (−0.60), total yield estimate (−0.64), and marketable root yield estimate (−0.61). The HI showed a strong correlation with leaf-burn severity (−0.65) and a moderate correlation with average root diameter (−0.51), total yield estimate (−0.54), and marketable root yield estimate (−0.52). The HUE index showed a moderate correlation with leaf blight severity (−0.56). NGRDI had a strong correlation with leaf blight severity (0.61), and a moderate correlation with mean root diameter (0.49), estimated total yield (0.53), and estimated marketable root yield (0.50).
The SCI showed a strong correlation with leaf blight severity (−0.61) and a moderate correlation with the mean root diameter (−0.49), estimated total yield (−0.53), and estimated marketable root yield (−0.50). The VARI was strongly correlated with leaf blight severity (0.63) and moderately correlated with mean root diameter (0.49), total yield estimate (0.53), and marketable root yield estimate (0.50). All indices showed a strong correlation with fresh leaf weight, except the SI.
As for the values obtained using the calculated object area, the marketable root area had a moderate correlation with average root length (0.55), average root diameter (0.59), and fresh leaf weight (0.58); a strong correlation with percentage of marketable roots (0.69) and percentage of unmarketable roots (−0.69); and a very strong correlation with estimated total yield (0.91) and estimated yield of marketable roots (0.95).
The area of unmarketable roots showed a strong correlation with the percentage of marketable roots (−0.80) and the percentage of unmarketable roots (0.80). Total root area had a moderate correlation with average root length (0.50), percentage of marketable roots (0.42), and percentage of unmarketable roots (−0.42); a strong correlation with average root diameter (0.62), fresh leaf weight (0.64), and estimated yield of marketable roots (0.89); and a very strong correlation with estimated total yield (0.92).
These results indicate that tropical carrot entries can be indirectly evaluated via remote sensing. Although studies on carrot phenotyping using RGB images from RPAs are limited and additional research should be carried out, this is a state-of-the-art methodology for this crop. The RGB sensors are readily available, inexpensive, easy to acquire, able to capture high-spatial-resolution images, and widely used to extract morphological and color traits across many crop species [30,31]. Several studies indicate the potential of the tool for vegetable phenotyping and have already applied it to other vegetables, such as onions, garlic, lettuce, eggplant, tomatoes, and cabbage.
Ballesteros et al. [11], in a study on onion biomass, stated that the high spatial and temporal resolution and flexibility in the use of RGB cameras mounted on RPAs offer new possibilities for crop monitoring and biomass estimation compared to other sensors. Maciel et al. [6] demonstrated that high-performance phenotyping through imaging was highly correlated with traditional methodology in purple lettuce evaluation and could therefore be considered as an alternative in identifying genetic diversity in a germoplasm bank.
The results of Moeckel et al. [8] demonstrated that data generated from RGB images based on RPAs could be used to effectively measure vegetable biomass (relative error = 17.6%, 19.7%, and 15.2% for eggplant, tomato, and cabbage, respectively), with a similar accuracy to biomass prediction models based on crop height measurement (relative error = 21.6, 18.8, and 15.2% for eggplant, tomato, and cabbage). Lee et al. [32] confirmed the applicability of RGB images in the estimation of onion and garlic leaf chlorophyll content, considering the economic feasibility and versatility of the RGB camera coupled to RPAs.
RGB cameras present many advantages and extensive application in agriculture and vegetables. However, there are opportunities and challenges for phenotyping using ARP-based RGB imaging. As they can only measure three bands (red, green, and blue) of the electromagnetic spectrum, this causes RGB images to be less accurate than multispectral or hyperspectral images in terms of the spectral resolution of the camera system. RGB cameras should be carefully operated in order to have uniform coloring and lighting in the images [30,31].
However, the use of image phenotyping using an RGB sensor has been proven to reduce evaluation costs [6]. The experiment was carried out with 60 genotypes in three replications, totaling 180 plots. The harvest and evaluation processes spent around 64 h, which would have resulted in a labor cost of USD 400.00. The duration of the flight and image processing took just six hours. This time was ten times shorter when compared to the manual procedure. In this context, image phenotyping can be an excellent alternative to obtain fast, satisfactory, and extremely low-cost results. Herzig et al. [9] in their barley studies compared RGB and multispectral sensors to evaluate high-throughput phenotyping. The authors concluded that for yield prediction, the RGB would be preferable to the multispectral system due to lower costs and ease of image acquisition and processing.
In this manuscript, image phenotyping using an RGB sensor was efficient in the indirect evaluation of carrot entries. In future research, the use of machine learning, deep learning, and neural network techniques, such as YOLO, for root recognition and classification may be considered.

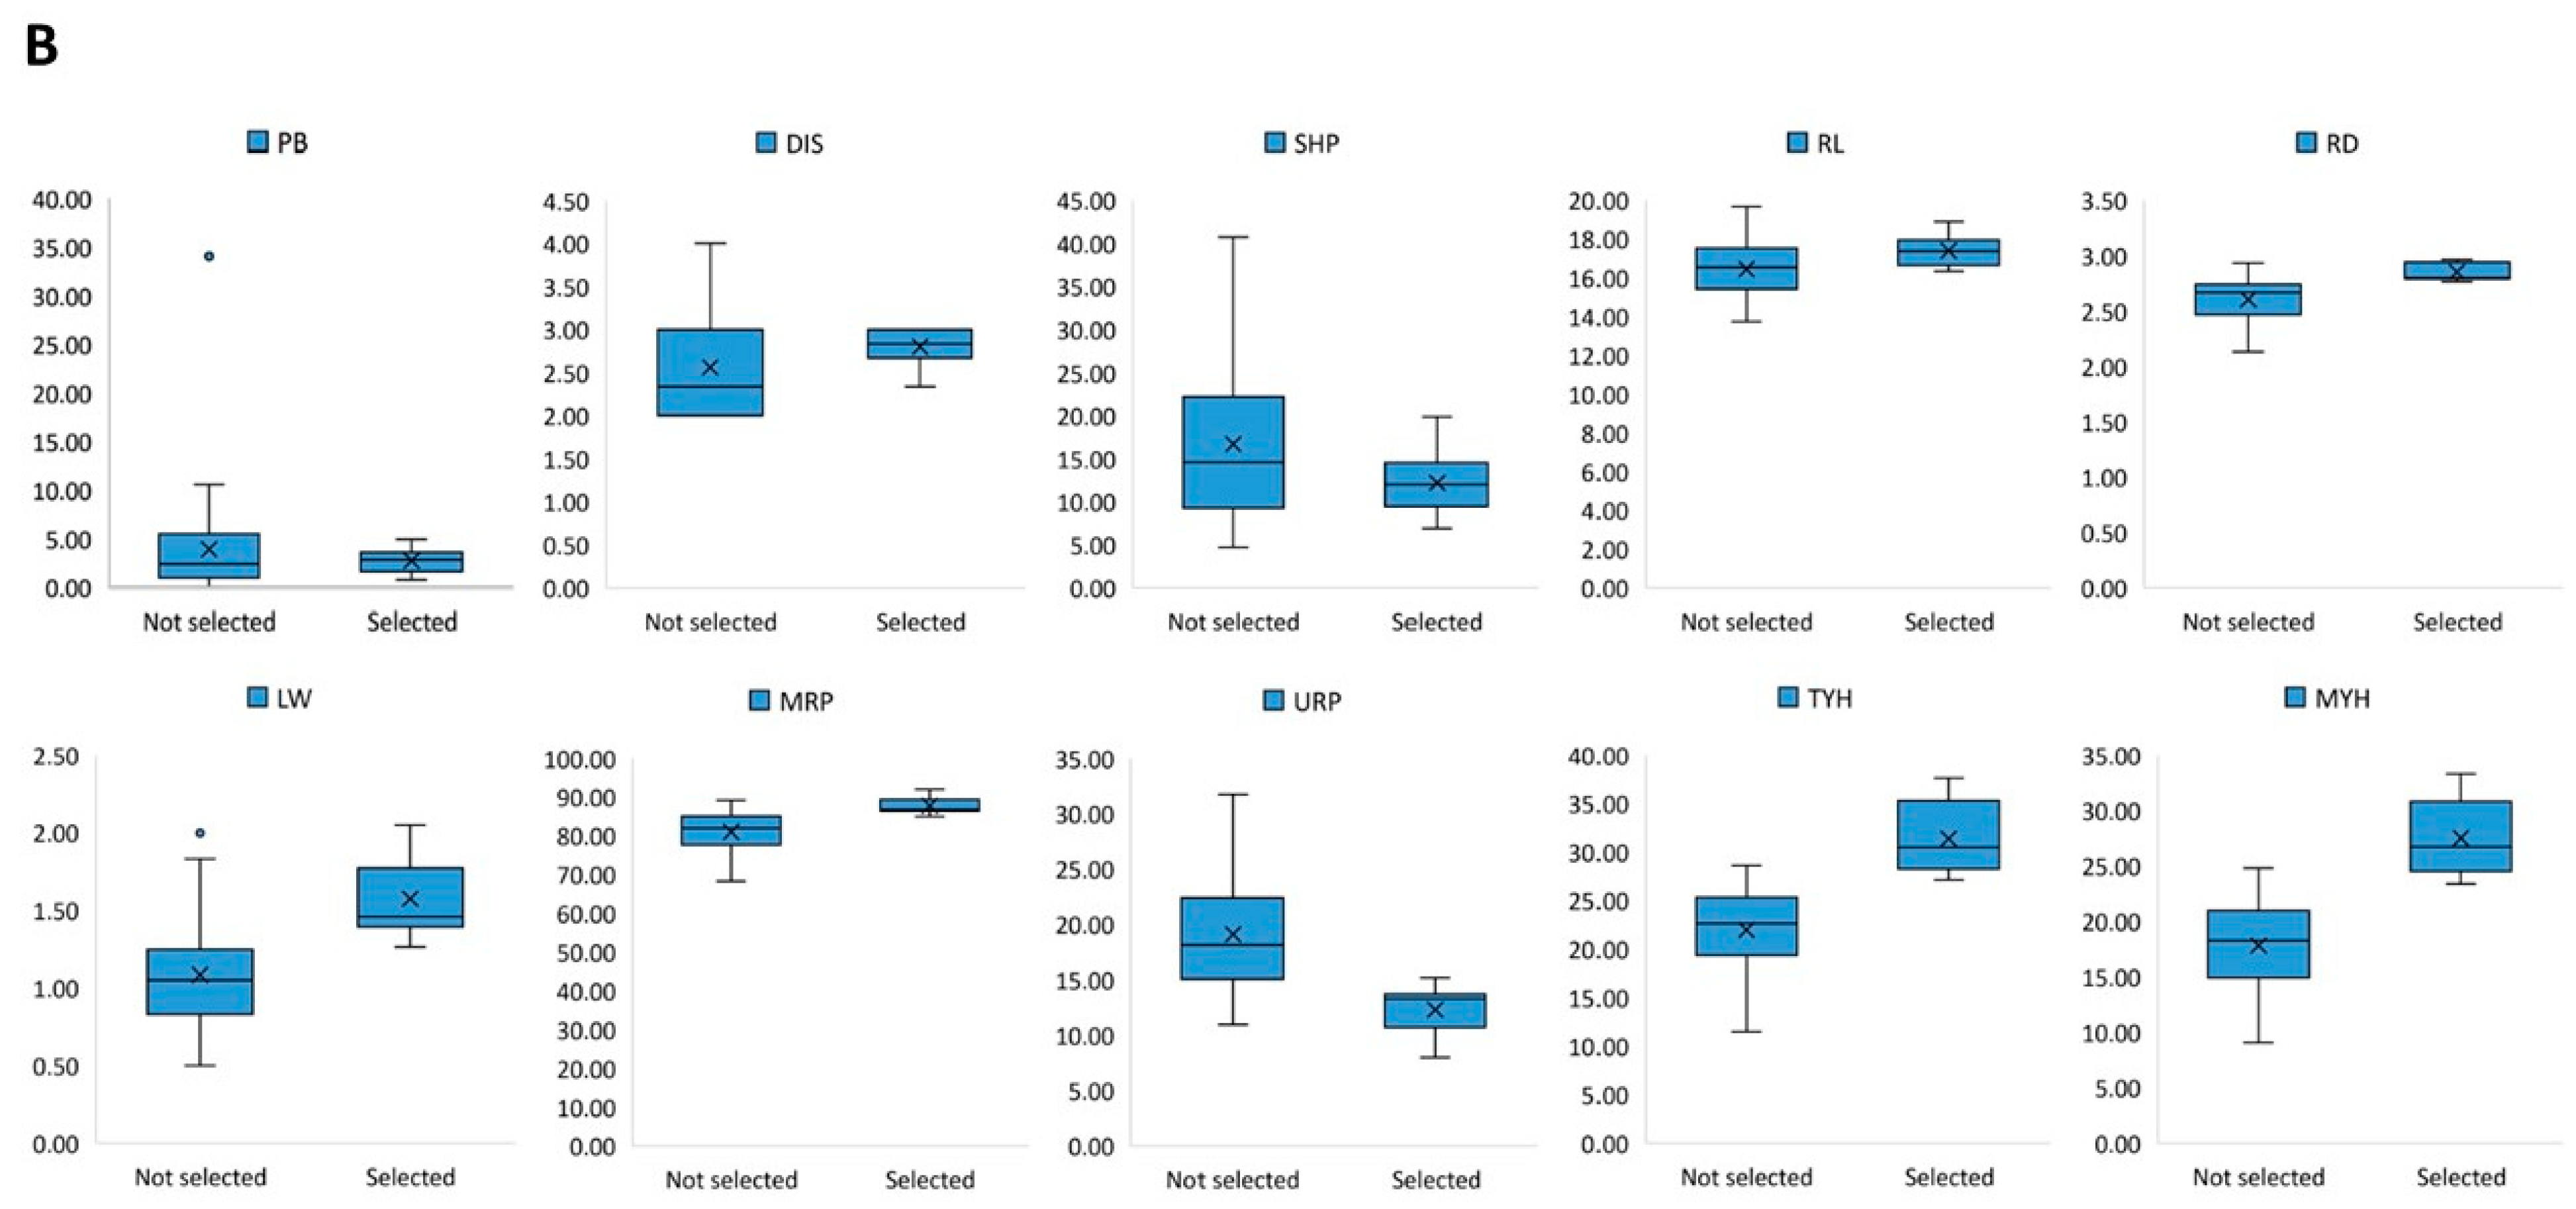
3.4. Selection of the Best Entries

The selection of more productive carrot entries is essential for the improvement of this crop that aims to increase production with reduced costs [23]. Thus, the superior individuals among the tropical carrot entries were selected using the genotype–ideotype distance index, based on the data of agronomic characters (Figure 7). Selection indices are an alternative that allows for simultaneous selection and efficiency, by combining several characters [22].
Ten superior entries were selected: 2, 15, 16, 22, 34, 37, 39, 51, 52, and 53 (Figure 7A). These entries were in the same group (V) defined by Kohonen’s self-organizing map (Figure 3), already indicated as superior because of the contribution of the variables to the formation of this group. Figure 7B shows boxplots of the selected and non-selected entries according to the agronomic characters. Higher means were observed for the traits to be increased (RL, RD, LW, MRP, TYH, MYH) and lower means for the traits to be reduced (BP, DIS, SHP, and URP).
A study carried out by De Carvalho et al. [24] corroborates the results found in the present work. They used the selection index of distance to ideotype in carrots, and found that the simultaneous selection for the characters, total root mass, marketable root mass, root diameter, higher percentage of roots with cylindrical shape, higher percentage of roots without green shoulder, and higher percentage of roots with dark orange coloration, enabled positive gains for all characters, demonstrating the efficiency of the index.
The selection of superior genotypes with positive gains in the characters of interest was also observed by other authors. De Carvalho et al. [3], in a study with 36 carrot genotypes in Brasília, found that the genotype–ideotype selection index, using the genetic coefficients of variation as economic weight, provided greater gains for the set of characters evaluated. As advantages, Olivoto and Nardino [33] indicated that the genotype–ideotype index could effectively identify superior treatments/genotypes based on multi-trait data, helping practitioners make better strategic decisions for effective multivariate selection in biological experiments.

4. Conclusions

Genetic variability was observed among the tropical carrot entries and the formation of six groups using artificial neural networks by Kohonen’s self-organizing map. Group V was formed by 16 entries, among them the commercial hybrids, entry 1 and 2, with a greater contribution of variables related to leaf blight severity, root quality, and yield.
The vegetation indices, HI, HUE, NGRDI, SCI, and VARI, showed a strong or moderate correlation with leaf blight severity. The indices BI, HI, NGRDI, SCI, and VARI had a strong or moderate correlation with the agronomic characters: root diameter, estimated total yield, and estimated marketable root yield. Marketable and total root area were strongly or moderately correlated with the agronomic characters: root length and diameter, fresh leaf weight, percentage of marketable and unmarketable roots, estimated total yield, and marketable root yield. Unmarketable roots area showed a strong correlation with marketable roots and unmarketable roots percentage. This indicates that tropical carrot entries can be indirectly evaluated via remote sensing for traits related to leaf blight severity and yield potential.
Ten entries were selected by the genotype–ideotype distance, being the entries 2, 15, 16, 22, 34, 37, 39, 51, 52, and 53, which were designated to the same group using Kohonen’s self-organizing map. This confirmed their superiority in the present study.

Author Contributions

Conceptualization, F.G.T.C. and G.M.M.; methodology, F.G.T.C., C.S.d.O. and L.M.P.; software, F.G.T.C., R.B.d.A.G. and A.L.A.R.; validation, F.G.T.C., C.S.d.O., A.L.A.R. and L.M.P.; formal analysis, G.M.M., A.C.S.S., R.B.d.A.G. and C.S.d.O.; investigation, F.G.T.C. and G.M.M.; resources, G.M.M., A.C.S.S. and R.B.d.A.G.; data curation, F.G.T.C., G.M.M. and A.C.S.S.; writing—original draft preparation, F.G.T.C.; writing—review and editing, G.M.M. and A.C.S.S.; visualization, F.G.T.C., G.M.M., A.C.S.S. and A.L.A.R.; supervision, G.M.M.; project administration, G.M.M.; funding acquisition, G.M.M., A.C.S.S. and R.B.d.A.G. All authors have read and agreed to the published version of the manuscript.

Funding

This research was funded by the Brazilian National Council for Scientific and Technological Development (CNPq), the Minas Gerais Research Foundation (FAPEMIG), the Coordination for the Improvement of Higher Education Personnel (CAPES) finance Code 001, and the Federal University of Uberlândia (UFU).

Institutional Review Board Statement

Not applicable.

Data Availability Statement

Data are contained within the article.

Conflicts of Interest

The authors declare no conflicts of interest.

Abbreviations

The following abbreviations are used in this manuscript:
RGBRed–green–blue
UAVUnmanned Aerial Vehicle
RPARemotely Piloted Aircraft
RCBDRandomized complete block design
BPBolting percentage
DISSeverity of leaf blight
LWFresh leaf weight (kg)
SHPPercentage of purple or green shoulder
MRPPercentage of marketable roots (%)
URPPercentage of unmarketable roots (%)
MYHEstimated yield of marketable roots (t ha−1)
TYHEstimated total yield (t ha−1)
RDRoot diameter (cm)
RLRoot length (cm)
MRAMarketable root area (m2)
URAUnmarketable root area (m2)
TRATotal root area (m2)
BIBrightness Index
GLIGreen Leaf Index
HIPrimary Colors Hue Index
HUEOverall Hue Index
NGRDINormalized Green Red Difference Index
SCISoil Color Index
SISpectral Slope Saturation Index
VARIVisible Atmospherically Resistant Index
SOMSelf-Organizing Map

References

  1. Abreu, D.J.M.D.; Lorenço, M.S.; Ferreira, A.N.; Scalice, H.K.; Vilas Boas, E.V.D.B.; Piccoli, R.H.; Carvalho, E.E.N. Artificial neural networks for the evaluation of physicochemical properties of carrots (Daucus carota L.) subjected to different cooking conditions as an alternative to traditional statistical methods. ACS Food Sci. Technol. 2021, 2, 143–150. [Google Scholar] [CrossRef]
  2. FAO. Food and Agriculture Organization of the United Nations Statistics Database. Available online: http://www.fao.org/faostat/en/#data (accessed on 2 May 2023).
  3. De Carvalho, A.D.F.; Pereira, G.E.; Da Silva, G.O. Estimates of genetic gains in the carrot using different selection indices. Rev. Agro@mbiente 2022, 16, 1–14. [Google Scholar] [CrossRef]
  4. Simon, P.W.; Freeman, R.E.; Vieira, J.V.; Boiteux, L.S.; Briard, M.; Nothnagel, T.; Michalik, B.; Kwon, Y.S. Carrot. In Vegetables II, 2nd ed.; Prohens, J., Nuez, F., Eds.; Springer: New York, NY, USA, 2008; Volume 2, pp. 327–357. [Google Scholar] [CrossRef]
  5. Walter, A.; Liebisch, F.; Hund, A. Plant phenotyping: From bean weighing to image analysis. Plant Methods 2015, 11, 14. [Google Scholar] [CrossRef] [PubMed]
  6. Maciel, G.M.; Gallis, R.B.A.; Barbosa, R.L.; Pereira, L.M.; Siquieroli, A.C.S.; Peixoto, J.V.M. Image phenotyping of inbred red lettuce lines with genetic diversity regarding carotenoid levels. Int. J. Appl. Earth Obs. Geoinf. 2019, 81, 154–160. [Google Scholar] [CrossRef]
  7. Dhondt, S.; Wuyts, N.; Inzé, D. Cell to whole-plant phenotyping: The best is yet to come. Trends Plant. Sci. 2013, 18, 428–439. [Google Scholar] [CrossRef] [PubMed]
  8. Moeckel, T.; Dayananda, S.; Nidamanuri, R.R.; Nautiyal, S.; Hanumaiah, N.; Buerkert, A.; Wachendorf, M. Estimation of vegetable crop parameter by multi-temporal UAV-borne images. Remote Sens. 2018, 10, 805. [Google Scholar] [CrossRef]
  9. Herzig, P.; Borrmann, P.; Knauer, U.; Klück, H.-C.; Kilias, D.; Seiffert, U.; Pillen, K.; Maurer, A. Evaluation of RGB and Multispectral Unmanned Aerial Vehicle (UAV) Imagery for High-Throughput Phenotyping and Yield Prediction in Barley Breeding. Remote Sens. 2021, 13, 2670. [Google Scholar] [CrossRef]
  10. Xie, J.; Zhou, Z.; Zhang, H.; Zhang, L.; Li, M. Combining Canopy Coverage and Plant Height from UAV-Based RGB Images to Estimate Spraying Volume on Potato. Sustainability 2022, 14, 6473. [Google Scholar] [CrossRef]
  11. Ballesteros, R.; Ortega, J.F.; Hernandez, D.; Moreno, M.A. Onion biomass monitoring using UAV-based RGB imaging. Precis. Agric. 2018, 19, 840–857. [Google Scholar] [CrossRef]
  12. Ryu, J.H.; Na, S.I.; Cho, J. Inter-comparison of normalized difference vegetation index measured from different footprint sizes in cropland. Remote Sens. 2020, 12, 2980. [Google Scholar] [CrossRef]
  13. Ranđelović, P.; Đorđević, V.; Milić, S.; Balešević-Tubić, S.; Petrović, K.; Miladinović, J.; Đukić, V. Prediction of Soybean Plant Density Using a Machine Learning Model and Vegetation Indices Extracted from RGB Images Taken with a UAV. Agronomy 2020, 10, 1108. [Google Scholar] [CrossRef]
  14. Guo, Y.; Yin, G.; Sun, H.; Wang, H.; Chen, S.; Senthilnath, J.; Fu, Y. Scaling Effects on Chlorophyll Content Estimations with RGB Camera Mounted on a UAV Platform Using Machine-Learning Methods. Sensors 2020, 20, 5130. [Google Scholar] [CrossRef] [PubMed]
  15. Pereira, R.B.; De Carvalho, A.D.F.; Pinheiro, J.B.; Da Silva, G.O.; Vieira, J.V. Resistência de populações de cenoura à queima-das-folhas com diferentes níveis de germoplasma tropical. Hortic. Bras. 2012, 30, 489–493. [Google Scholar] [CrossRef]
  16. Richardson, A.J.; Wiegand, C. Distinguishing Vegetation from Soil Background Information. Photogramm. Eng. Remote Sens. 1977, 43, 1541–1552. [Google Scholar]
  17. Louhaichi, M.; Borman, M.M.; Johnson, D.E. Spatially Located Platform and Aerial Photography for Documentation of Grazing Impacts on Wheat. Geocarto Int. 2001, 16, 65–70. [Google Scholar] [CrossRef]
  18. Escadafal, R.; Belghith, A.; Bem, M.H. Indices spectraux pour la télédétection de la dégradation des milieux naturels en Tunisie aride. In Actes du Sixième Symposium International. Mes. Phys. Signat. Spectrales Télédétection 1994, 17–21. [Google Scholar]
  19. Tucker, C. Red and Photographic Infrared Linear Combinations for Monitoring Vegetation. Remote Sens. Environ. 1979, 8, 127–150. [Google Scholar] [CrossRef]
  20. Mathieu, R.; Pouget, M.; Cervelle, B.; Escadafal, R. Relationships between satellite-based radiometric indices simulated using laboratory reflectance data and typic soil color of an arid environment. Remote Sens Environ 1998, 66, 17–28. [Google Scholar] [CrossRef]
  21. Gitelson, A.A.; Kaufman, Y.J.; Stark, R.; Rundquist, D. Novel algorithms for remote estimation of vegetation fraction. Remote Sens. Environ. 2002, 80, 76–87. [Google Scholar] [CrossRef]
  22. Cruz, C.D. Genes: A software package for analysis in experimental statistics and quantitative genetics. Acta Sci. Agron. 2013, 35, 271–276. [Google Scholar] [CrossRef]
  23. De Carvalho, A.D.F.; Da Silva, G.O.; Pereira, G.E. Direct selection for phenotypic traits in carrot genotypes. Hortic. Bras. 2019, 37, 354–358. [Google Scholar] [CrossRef]
  24. De Carvalho, A.D.F.; Nogueira, M.T.M.; Silva, G.O.; Luz, J.M.Q.; Maciel, G.M.; Rabelo, P.G. Seleção de genótipos de cenoura para caracteres fenotípicos de raiz. Hortic. Bras. 2017, 35, 97–102. [Google Scholar] [CrossRef]
  25. Le Clerc, V.; Marques, S.; Suel, A.; Huet, S.; Hamama, L.; Voisine, L.; Auperpin, E.; Jourdan, M.; Barrot, L.; Prieur, R.; et al. QTL mapping of carrot resistance to leaf blight with connected populations: Stability across years and consequences for breeding. Theor. Appl. Genet. 2015, 128, 2177–2187. [Google Scholar] [CrossRef] [PubMed]
  26. De Carvalho, A.D.F.; Silva, G.O. Divergência genética entre genótipos de cenoura através de caracteres agronômicos. Rev. Agro@mbiente 2017, 11, 137–144. [Google Scholar] [CrossRef]
  27. Janaszek, M.A.; Trajer, J.J. Method of evaluating diversity of carrot roots using a self-organizing map and image data. Comput. Electron. Agric. 2011, 79, 75–81. [Google Scholar] [CrossRef]
  28. Monyr, N.; Agoubi, B.; Berrada, M.; Abdelaziz, A.; El Hmaidi, A. Topological maps of Kohonen Self-Organization (SOM) applied to the study of sediments contaminated with heavy metals. Am. J. Eng. Res. 2016, 5, 99–105. [Google Scholar]
  29. Da Silva, G.O.; Vieira, J.V.; Vilela, M.S. Seleção de caracteres de cenoura cultivada em dois sistemas de produção agroecológicos no Distrito Federal. Rev. Ceres 2009, 56, 595–601. [Google Scholar]
  30. Neupane, K.; Baysal-Gurel, F. Automatic Identification and Monitoring of Plant Diseases Using Unmanned Aerial Vehi-cles: A Review. Remote Sens. 2021, 13, 3841. [Google Scholar] [CrossRef]
  31. Sweet, D.D.; Tirado, S.B.; Springer, N.M.; Hirsch, C.N.; Hirsch, C.D. Opportunities and challenges in phenotyping row crops using drone-based RGB imaging. Plant Phenome J. 2022, 5, e20044. [Google Scholar] [CrossRef]
  32. Lee, D.H.; Jeong, C.H.; Go, S.H.; Park, J.H. Evaluation of applicability of RGB image using support vector machine regression for estimation of leaf chlorophyll content of onion and garlic. Korean J. Remote Sens. 2021, 37, 1669–1683. [Google Scholar] [CrossRef]
  33. Olivoto, T.; Nardino, M. MGIDI: Toward an effective multivariate selection in biological experiments. Bioinformatics 2021, 37, 1383–1389. [Google Scholar] [CrossRef] [PubMed]
Figure 1. Location and visualization of the experiment on the flight of a remotely piloted aircraft. Climograph representing the experimental period in Carandaí, MG, Brazil from November 2019 to March 2020.
Agriculture 14 00710 g001
Figure 2. Flowchart of the image acquisition, processing steps, field data collection, and data analysis in carrot germplasm in the city of Carandaí-MG, Brazil.
Agriculture 14 00710 g002
Figure 3. Groups I, II, II, IV, V and VI of the 60 tropical carrot entries evaluated in the city of Carandaí-MG, Brazil, obtained using Kohonen’s self-organizing map (A). Contribution of agronomic variables to the grouping, where lighter colors indicate greater contribution to group formation (B). BP—bolting percentage (%), DIS—score for severity of leaf blight, SHP—percentage of purple or green shoulder (%), RL—length (cm), RD—root diameter (cm), LW—fresh leaf weight (kg), MRP—percentage of marketable roots (%), URP—percentage of unmarketable roots (%), TYH—estimated total yield (t ha−1), MYH—estimated yield of marketable roots (t ha−1).
Agriculture 14 00710 g003
Figure 4. Histograms of distribution and frequency of pixels found for the visible channels and for vegetation indices in 60 carrot entries in the city of Carandaí-MG, Brazil.
Agriculture 14 00710 g004
Figure 5. Representation of the behavior of the vegetation indices: Visible Atmospherically Resistant Index (VARI), Soil Color Index (SCI), Green Leaf Index (GLI), and Normalized Green Red Difference Index (NGRDI) calculated from orthophoto 1, which contained the leaf portion of the carrot entries (A). The determination of marketable roots area (MRA) (green) and unmarketable roots area (URA) (yellow) in orthophoto 2, obtained by identifying and contouring the marketable and unmarketable roots groups in each plot. Both orthophotos and analyses are from tropical carrot entries, in the city of Carandaí-MG, Brazil (B).
Agriculture 14 00710 g005
Figure 6. Correlation matrix (Pearson’s r) for agronomic characters, vegetation indices, and root areas in carrot entries in the city of Carandaí-MG, Brazil. Significant correlations using Pearson’s test (p < 0.05) are shown in shades of blue (positive) and red (negative). BP—bolting percentage (%), DIS—leaf blight severity score, SHP—percentage of purple or green shoulder (%), RL—average root length (cm), RD—average root diameter (cm), LW—fresh leaf weight (kg), MRP—percentage of marketable roots (%), URP—percentage of unmarketable roots (%), TYH—estimated total yield (t ha−1), MYH—estimated yield of marketable roots (t ha−1), MRA—marketable roots area (m2), URA—unmarketable roots area (m2), TRA—total root area (m2).
Agriculture 14 00710 g006
Figure 7. Ranking of 60 carrot entries in ascending order and selected entries (in red) based on genotype–ideotype distance. The red circle refers to the cutoff point according to selection pressure (A). Boxplots of selected and unselected entries according to agronomic characters: BP—bolting percentage (%), DIS—score for severity of leaf blight, SHP—percentage of purple or green shoulder (%), RL—length (cm), RD—root diameter (cm), LW—fresh leaf weight (kg), MRP—percentage of marketable roots (%), URP—percentage of unmarketable roots (%), TYH—estimated total yield (t ha−1), MYH—estimated yield of marketable roots (t ha−1) (B).
Agriculture 14 00710 g007aAgriculture 14 00710 g007b
Table 1. Vegetation indices tested for phenotyping tropical carrot in the city of Carandaí–MG, Brazil.
Vegetation IndicesEquations ¹References
Brightness Index (BI)√[(R2 + G2 + B2)/3][16]
Green Leaf Index (GLI)(2G − R − B)/(2G + R + B)[17]
Primary Colors Hue Index (HI)(2R − G − B)/(G − B)[18]
Overall Hue Index (HUE)Atan [2(B − G − R)/30.5(G − R)][18]
Normalized Green Red Difference Index (NGRDI)(G − R)(G + R)[19]
Soil Color Index (SCI)(R − G)/(R + G)[20]
Spectral Slope Saturation Index (SI)(R − B)/(R + B)[18]
Visible Atmospherically Resistant Index (VARI)(G − R)/(G + R − B)[21]
areaporcPlot area (cm2)
1 R = red band; G = green band; B = blue band.
Table 2. Summary of the analysis of variance and estimated genetic and phenotypic parameters for 60 tropical carrot entries, in the city of Carandaí–MG, Brazil.
Mean Square
SVDFBPDISSHPRLRDLWMRPURPTYHMYH
Block229.020.62853.4822.330.360.3111.2811.28162.885.35
Genotype5972.99 **0.81 **219.81 **5.69 **0.14 **0.4 **83.27 *83.27 *88.99 **81.52 **
Residual1187.690.3460.471.380.020.0552.5852.589.669.64
Mean 3.722.615.9616.62.651.1682.0417.9623.5319.44
CV 74.5822.4248.737.065.619.698.8440.3713.2115.97
Min 011.5411.81.90.3551.392.657.95.37
Max 37559.2621.33.22.4397.3548.6142.438.43
σ ^ F2 24.330.2773.271.90.050.1327.7627.7629.6627.17
σ ^ E2 2.560.1120.150.460.010.0217.5317.533.223.21
σ ^ G2 21.740.1553.111.440.040.1210.2310.2326.4523.96
h2 89.4655.1172.4875.883.9687.0136.8636.8689.1588.17
CVg 125.4315.2545.667.227.429.423.917.8121.8525.18
CVg/CVe 1.680.680.941.021.321.490.440.441.651.58
**, * Significance at 1% and 5%, respectively; ns, not significant using the F-test; SV: source of variation; DF: degrees of freedom; CV, CVg, and CVe: coefficient of variation overall (%), genetic (%), and experimental (%), respectively; σ ^ F2: phenotypic variance; σ ^ E2: environmental variance; σ ^ G2: genetic variance; h2: heritability. BP—bolting percentage (%), DIS—score for severity of leaf blight, SHP—percentage of purple or green shoulder (%), RL—root length (cm), RD—root diameter (cm), LW—fresh leaf weight (kg), MRP—percentage of marketable roots (%), URP—percentage of unmarketable roots (%), TYH—estimated total yield (t ha−1), MYH—estimated yield of marketable roots (t ha−1).
Disclaimer/Publisher’s Note: The statements, opinions and data contained in all publications are solely those of the individual author(s) and contributor(s) and not of MDPI and/or the editor(s). MDPI and/or the editor(s) disclaim responsibility for any injury to people or property resulting from any ideas, methods, instructions or products referred to in the content.

