
Staged Temperature- and Humidity-Controlled Combined Infrared Hot-Air Drying (TH-IRHAD) of Sea Buckthorn Reduces Drying Time, Energy Consumption, and Browning
Abstract
:1. Introduction
2. Materials and Methods
2.1. Test Materials and Devices
2.2. Test Method
- Test 1: In the first-drying stage, the response surface was used to optimize the drying temperature, medium relative humidity and high humidity holding time. In the second- and third-drying stages, the drying temperature was 75 °C and the medium relative humidity was 10%.
- Test 2: The optimal drying process from test 1 was adopted in the first-drying stage; the response surface was used to optimize the drying temperature, medium relative humidity and high humidity holding time in the second-drying stage; and the drying temperature of 75 °C and medium relative humidity of 10% were adopted in the third-drying stage to dry to the end point.
- Test 3: In the first-drying stage, the optimal drying process from test 1 was adopted, and in second-drying stage, the optimal drying process from test 2 was adopted. Since the preliminary experiment had shown that when the relative humidity of the medium in the drying chamber exceeded 10% in the third-drying stage, the drying time and energy consumption would increase and the quality would decrease, only the single-factor test was used to determine the drying temperature in the third-drying stage.
2.2.1. Determining the Kinetics of Drying Sea Buckthorn
2.2.2. Determination of Physical and Chemical Properties of Sea Buckthorn after Drying
- (1)
- Determination of color and browning degree
- (2)
- Determination of rehydration ratio
- (3)
- Quantification of antioxidant content
- (4)
- All-encompassing assessment technique
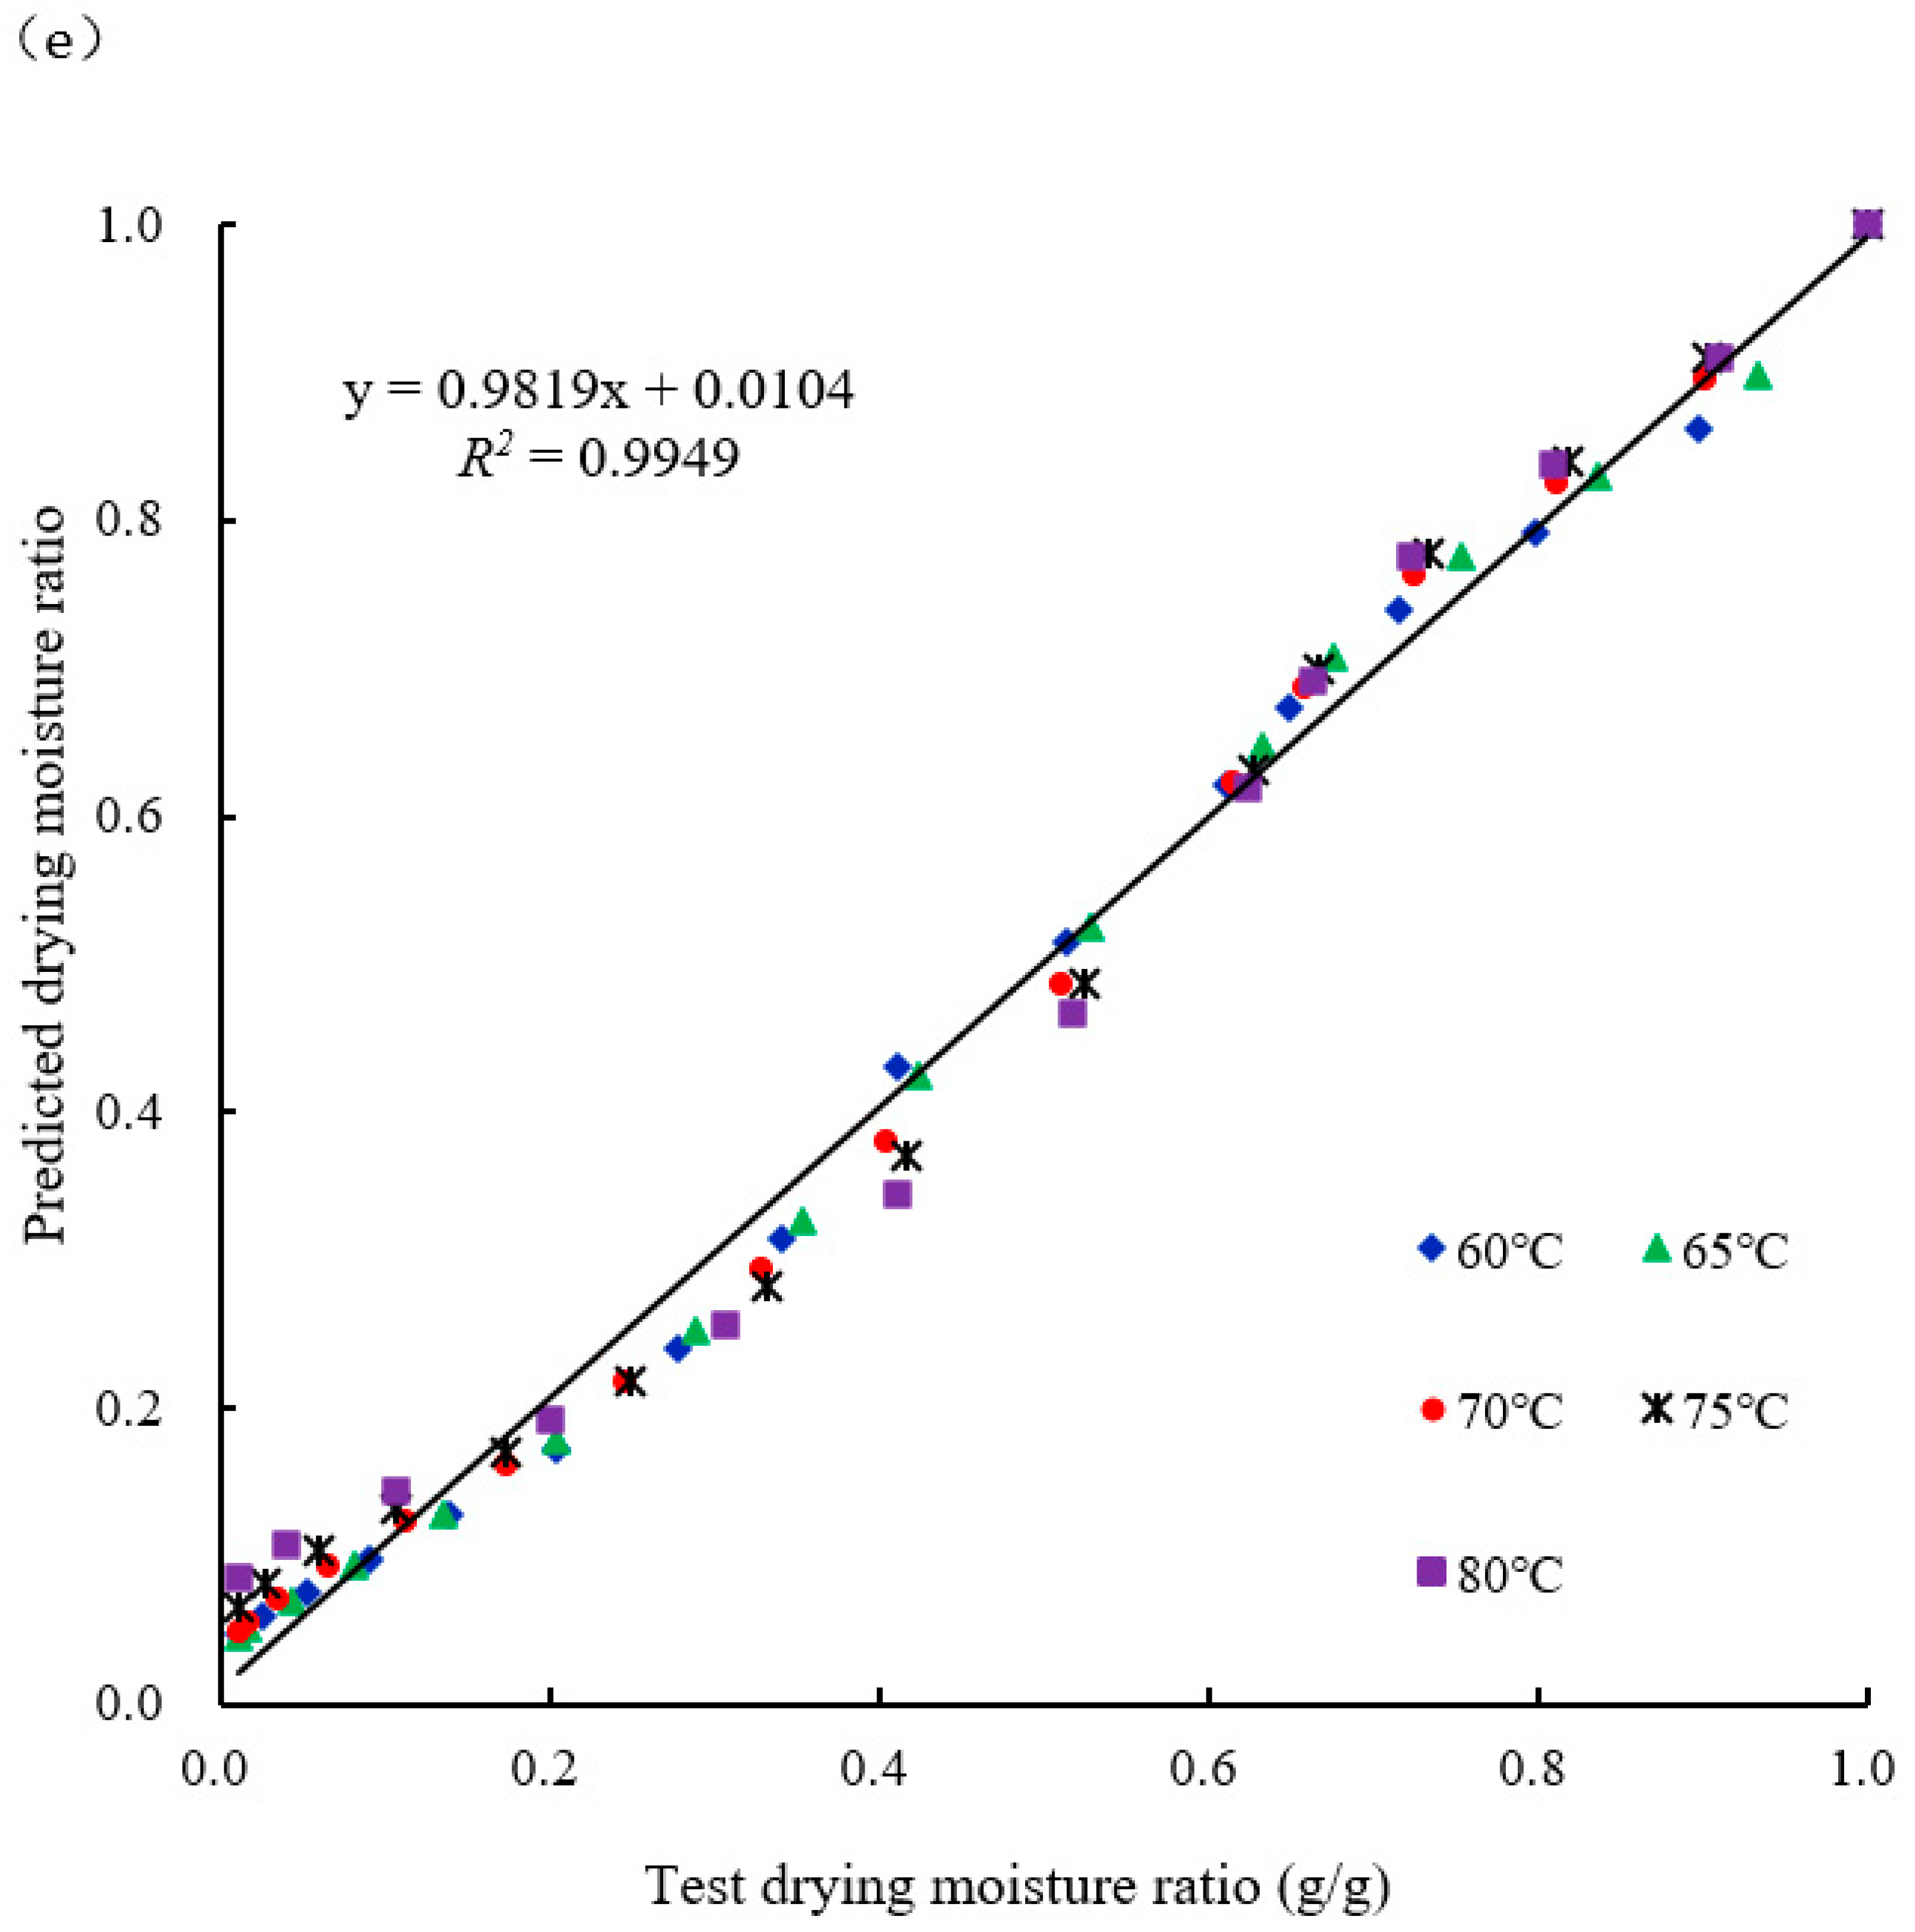
2.2.3. Validation of the Drying Model
2.3. Division of the Drying Process
2.4. Data Analysis Techniques
3. Results
3.1. First-Drying Stage Variables for TH-IRHAD of Sea Buckthorn
3.1.1. Response Surface Optimization for the Initial Drying Stage
3.1.2. Quality Evaluation during the First-Drying Stage
3.1.3. Optimized Parameters for First-Drying Stage
3.2. Second-Drying Stage Variables for TH-IRHAD of Sea Buckthorn
3.2.1. Response Surface Optimization for Second-Drying Stage
3.2.2. Quality Evaluation during Second-Drying Stage
3.2.3. Optimized Parameters for Second-Drying Stage
3.3. Third-Drying Stage Variables for TH-IRHAD of Sea Buckthorn
3.3.1. Response Surface Optimization for the Third-Drying Stage
3.3.2. Quality Evaluation during the Third-Drying Stage
- (1)
- Impact of drying temperature on drying kinetics
- (2)
- Impact of the drying temperature on the moisture activation energy and an effective diffusion coefficient
- (3)
- Mathematical models for various drying temperatures
- (4)
- Effects of drying temperature on energy consumption
- (5)
- Effect of drying temperature on color and browning
- (6)
- Impact of the drying temperature on the rehydration ratio
- (7)
- Effect of drying temperature on antioxidant substances
3.3.3. Optimized Parameters for the Third-Drying Stage
3.4. Sea Buckthorn Quality When Dried at a Constant Temperature with Regulated Humidity
4. Conclusions
Supplementary Materials
Author Contributions
Funding
Institutional Review Board Statement
Informed Consent Statement
Data Availability Statement
Conflicts of Interest
References
- Song, Y.T.; Zhang, G.Y.; Chen, N.; Zhang, J.G.; He, C.Y. Metabolomic and transcriptomic analyses provide insights into the flavonoid biosynthesis in sea buckthorn (Hippophae rhamnoides L.). LWT—Food Sci. Technol. 2023, 187, 115276. [Google Scholar] [CrossRef]
- Chang, X.M.; Sun, L.B.; Yu, X.X.; Liu, Z.Q.; Jia, G.D.; Wang, Y.S.; Zhu, X.H. Windbreak efficiency in controlling wind erosion and particulate matter concentrations from farmlands. Agric. Ecosyst. Environ. 2021, 308, 107269. [Google Scholar] [CrossRef]
- Yu, L.Y.; Diao, S.F.; Zhang, G.Y.; Yu, J.G.; Zhang, T.; Luo, H.M.; Duan, A.G.; Wang, J.P.; He, C.Y.; Zhang, J.G. Genome sequence and population genomics provide insights into chromosomal evolution and phytochemical innovation of Hippophae rhamnoides. Plant Biotechnol. J. 2022, 20, 1257–1273. [Google Scholar] [CrossRef] [PubMed]
- FAO. FaoStatDatabase. Available online: http://www.fao.org/faostat/en/#data/QC.2022 (accessed on 21 December 2022).
- Garcia-llobodanin, L.; Billiris, A. Effect of the drying air conditions on the drying rate and milling quality of a long-grain rice variety. Food Sci. Technol. 2023, 43, e65722. [Google Scholar] [CrossRef]
- Ma, Y.; Yao, J.X.; Zhou, L.; Zhao, M.J.; Wang, W.; Liu, J.K.; Marchioni, E. Comprehensive untargeted lipidomic analysis of sea buckthorn using UHPLC-HR-AM/MS/MS combined with principal component analysis. Food Chem. 2024, 430, 136964. [Google Scholar] [CrossRef]
- Ma, X.Y.; Yang, W.; Kallio, H.; Yang, B.R. Health promoting properties and sensory characteristics of phytochemicals in berries and leaves of sea buckthorn (Hippophaë rhamnoides). Crit. Rev. Food Sci. Nutr. 2021, 62, 3798–3816. [Google Scholar] [CrossRef] [PubMed]
- Wang, B.; Liu, Y.X.; Dong, M.; Zhang, Y.Y.; Huang, X.H.; Qin, L. Flavor enhancement during the drying of scallop (Patinopecten yessoensis) as revealed by integrated metabolomic and lipidomic analysis. Food Chem. 2024, 432, 137218. [Google Scholar] [CrossRef]
- Joardder, M.U.H.; Karim, M.A. Drying kinetics and properties evolution of apple slices under convective and intermittent-MW drying. Therm. Sci. Eng. Prog. 2022, 30, 101279. [Google Scholar] [CrossRef]
- Ju, H.Y.; Zou, Y.Z.; Xiao, H.W.; Zhang, W.P.; Yu, X.L.; Gao, Z.J. Effects of relative humidity on water diffusion and evaporation during hot air drying of carrot. Trans. Chin. Soc. Agric. Eng. 2023, 39, 232–240. Available online: https://kns.cnki.net/2023.39.01.232-240 (accessed on 23 February 2023).
- Curcio, S.; Aversa, M.; Calabrò, V.; Iorio, G. Simulation of food drying: Fem analysis and experimental validation. J. Food Eng. 2008, 87, 541–553. [Google Scholar] [CrossRef]
- Zhang, W.P.; Yang, X.H.; Mujumdar, A.S.; Ju, H.Y.; Xiao, H.W. The influence mechanism and control strategy of relative humidity on hot air drying of fruits and vegetables: A review. Dry. Technol. 2022, 40, 2217–2234. [Google Scholar] [CrossRef]
- Geng, Z.; Li, M.; Zhu, L.; Zhang, X.; Zhu, H.; Yang, X.; Yu, X.; Zhang, Q.; Hu, H. Design and experiment of infrared combined hot-air dryer based on temperature and humidity control on sea buckthorn (Hippophae rhamnoides L.). Foods 2023, 12, 2299. [Google Scholar] [CrossRef] [PubMed]
- Geng, Z.; Torki, M.; Beigi, M.; Kaveh, M.; Yang, X.H. Characteristics and multi-objective optimization of carrot dehydration in a hybrid infrared /hot air dryer. LWT-Food Sci. Technol. 2022, 172, 114229. [Google Scholar] [CrossRef]
- Thao, B.T.T.; Vo, T.T.K.; Tran, T.Y.N.; Le, D.T.; Tran, T.T.; Bach, L.G.; Dao, T.P. Application of mathematical techniques to study the moisture loss kinetics and polyphenol degradation kinetics of mango (Mangifera indica L.) slices during heat pump drying by pilot equipment. LWT-Food Sci. Technol. 2023, 176, 114454. [Google Scholar] [CrossRef]
- Guo, X.J.; Hao, Q.D.; Qiao, X.G.; Li, M.; Qiu, Z.C.; Zheng, Z.J.; Zhang, B. An evaluation of different pretreatment methods of hot-air drying of garlic: Drying characteristics, energy consumption and quality properties. LWT-Food Sci. Technol. 2023, 180, 114685. [Google Scholar] [CrossRef]
- Chang, A.T.; Zheng, X.; Xiao, H.W.; Yao, X.D.; Liu, D.C.; Li, X.Y.; Li, Y.C. Short- and medium-wave infrared drying of Cantaloupe (Cucumis melon L.) slices: Drying kinetics and process parameter optimization. Processes 2022, 10, 114. [Google Scholar] [CrossRef]
- Liu, Z.L.; Xie, L.; Zielinska, M.; Pan, Z.L.; Wang, J.; Deng, L.Z.; Wang, H.; Xiao, H.W. Pulsed vacuum drying enhances drying of blueberry by altering micro-ultrastructure and water status and distribution. LWT-Food Sci. Technol. 2021, 142, 111013. [Google Scholar] [CrossRef]
- Deng, L.Z.; Yang, X.H.; Mujumdar, A.S.; Zhao, J.H.; Wang, D.; Zhang, Q.; Wang, J.; Gao, Z.J.; Xiao, H.W. Red pepper (Capsicum annuum L.) drying: Effects of different drying methods on drying kinetics, physicochemical properties, antioxidant capacity, and microstructure. Dry. Technol. 2018, 36, 893–907. [Google Scholar] [CrossRef]
- Wang, H.; Liu, Z.L.; Vidyarthi, S.K.; Wang, Q.H.; Gao, L.; Li, B.R.; Wei, Q.; Liu, Y.H.; Xiao, H.W. Effect of different drying methods on drying kinetics, physicochemical properties, microstructure, and energy consumption of potato (Solanum tuberosum L.) cubes. Dry. Technol. 2021, 39, 418–431. [Google Scholar] [CrossRef]
- Geng, Z.H.; Zhu, L.C.; Wang, J.; Yu, X.L.; Li, M.Q.; Yang, W.X.; Hu, B.; Zhang, Q.; Yang, X.H. Drying sea buckthorn berries (Hippophae rhamnoides L.): Effects of different drying methods on drying kinetics, physicochemical properties, and microstructure. Front. Nutr. 2023, 10, 1106009. [Google Scholar] [CrossRef]
- Chu, Q.Q.; Li, L.L.; Duan, X.; Zhao, M.Y.; Wang, Z.K.; Wang, Z.; Ren, X.; Li, C.Y.; Ren, G.Y. Effect mechanism of different drying methods on the quality and browning for daylily. LWT-Food Sci. Technol. 2023, 182, 114862. [Google Scholar] [CrossRef]
- Tan, S.D.; Xu, Y.; Zhu, L.C.; Geng, Z.H.; Zhang, Q.; Yang, X.H. Hot air drying of sea buckthorn (Hippophae rhamnoides L.) berries: Effects of different pretreatment methods on drying characteristics and quality attributes. Foods 2022, 11, 3675. [Google Scholar] [CrossRef]
- Lee, S.Y.; Ferdinand, V.; Siow, L.F. Effect of drying methods on yield, physicochemical properties, and total polyphenol content of chamomile extract powder. Front. Pharmacol. 2022, 13, 1003209. [Google Scholar] [CrossRef] [PubMed]
- Liu, Z.L.; Xie, L.; Zielinska, M.; Pan, Z.L.; Deng, L.Z.; Zhang, J.S.; Gao, L.; Wang, S.Y.; Zheng, Z.A.; Xiao, H.W. Improvement of drying efficiency and quality attributes of blueberries using innovative far-infrared radiation heating assisted pulsed vacuum drying (FIR-PVD). Innov. Food Sci. Emerg. Technol. 2022, 77, 102948. [Google Scholar] [CrossRef]
- Liu, Z.L.; Zielinska, M.; Yang, X.H.; Yu, X.L.; Chen, C.; Wang, H.; Wang, J.; Pan, Z.L.; Xiao, H.W. Moisturizing strategy for enhanced convective drying of mushroom slices. Renew. Energy 2021, 172, 728–739. [Google Scholar] [CrossRef]
- Deng, L.Z.; Xiong, C.H.; Pei, Y.P.; Zhu, Z.Q.; Zheng, X.; Zhang, Y.; Yang, X.H.; Liu, Z.L.; Xiao, H.W. Effects of various storage conditions on total phenolic, carotenoids, antioxidant capacity, and color of dried apricots. Food Control. 2022, 136, 108846. [Google Scholar] [CrossRef]
- Wang, J.; Mujumdar, A.S.; Wang, H.; Fang, X.M.; Xiao, H.W.; Raghavan, V. Effect of drying method and cultivar on sensory attributes, textural profiles, and volatile characteristics of grape raisins. Dry. Technol. 2021, 39, 495–506. [Google Scholar] [CrossRef]
- Xie, L.; Zheng, Z.A.; Mujumdar, A.S.; Fang, X.M.; Wang, J.; Zhang, Q.; Ma, Q.; Xiao, H.W.; Liu, Y.H.; Gao, Z.J. Pulsed vacuum drying (PVD) of wolfberry: Drying kinetics and quality attributes. Dry. Technol. 2018, 36, 1501–1514. [Google Scholar] [CrossRef]
- Alfeo, V.; Planeta, D.; Velotto, S.; Palmeri, R.; Todaro, A. Cherry tomato drying: Sun versus convective oven. Horticulturae 2021, 7, 40. [Google Scholar] [CrossRef]
- Jiang, D.L.; Xiao, H.W.; Zielinska, M.; Zhu, G.F.; Bai, T.Y.; Zheng, Z.A. Effect of pulsed vacuum drying of drying kinetics and quality of roots of Panax notoginseng (Burk) F. H. Chen (Araliaceae). Dry. Technol. 2022, 39, 2234–2251. [Google Scholar] [CrossRef]
- Zhang, Y.; Zhu, G.F.; Li, X.Y.; Zhao, Y.; Lei, D.W.; Ding, G.Q.; Ambrose, K.; Liu, Y.H. Combined medium- and short-wave infrared and hot air impingement drying of sponge gourd (Luffa cylindrical) slices. J. Food Eng. 2020, 284, 110043. [Google Scholar] [CrossRef]
- Hu, L.N.; Bi, J.F.; Jin, X.; Qiu, Y.; van der Sman, R.G.M. Study on the rehydration quality improvement of shiitake mushroom by combined drying methods. Foods 2021, 10, 769. [Google Scholar] [CrossRef] [PubMed]
- Geng, Z.H.; Wang, J.; Zhu, L.C.; Yu, X.L.; Zhang, Q.; Li, M.Q.; Hu, B.; Yang, X.H. Metabolomics provide a novel interpretation of the changes in flavonoids during sea buckthorn (Hippophae rhamnoides L.) drying. Food Chem. 2023, 413, 135598. [Google Scholar] [CrossRef] [PubMed]


| AB (Treatment Time/min-Medium Humidity/%) | AC (Drying Temperature/°C-Treatment Time/min) | BC (Medium Humidity/%-Treatment Time/min) | |
|---|---|---|---|
| Drying time/ min |  | 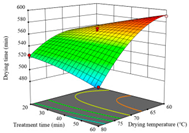 |  |
| SEC/ kW·h·kg−1 |  |  |  |
| NEB/ Abs·g−1 d.m. |  |  | 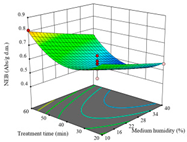 |
| L* |  |  |  |
| Rr/ g·g−1 |  |  |  |
| Vc/ % |  |  |  |
| TFC/ mg RE·g−1 DW |  |  |  |
| TPC/ mg GAE·g−1 DW |  |  | 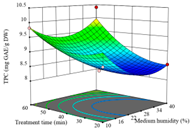 |
| AB (Treatment Time/min-Medium Humidity/%) | AC (Drying Temperature/°C-Treatment Time/min) | BC (Medium Humidity/%-Treatment Time/min) | |
|---|---|---|---|
| Drying time/min | 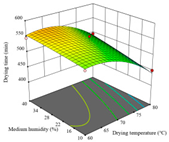 |  |  |
| SEC/kW·h·kg−1 |  |  |  |
| NEB/Abs·g−1 d.m. |  |  |  |
| L* | 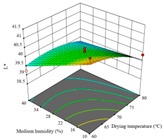 |  |  |
| Rr/g·g−1 | 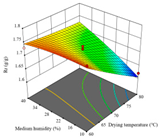 |  |  |
| Vc/% |  |  |  |
| TFC/mg RE·g−1 DW |  |  |  |
| TPC/mg GAE·g−1 DW |  |  |  |
| Model Name and Equation | Drying Temperature | Model Constants | R2 | RMSE | χ2 |
|---|---|---|---|---|---|
| Lewis MR = exp(−kt) | 60 °C | k = 0.00569 | 0.93363 | 0.10734 | 0.00716 |
| 65 °C | k = 0.00572 | 0.97420 | 0.04489 | 0.00299 | |
| 70 °C | k = 0.00661 | 0.98099 | 0.03252 | 0.00217 | |
| 75 °C | k = 0.00681 | 0.98282 | 0.02709 | 0.00193 | |
| 80 °C | k = 0.00740 | 0.97742 | 0.03022 | 0.00252 | |
| Page MR = exp(−ktn) | 60 °C | k = 0.03304; n = 0.65161 | 0.99436 | 0.00912 | 0.00065 |
| 65 °C | k = 0.01839; n = 0.77232 | 0.99489 | 0.00889 | 0.00064 | |
| 70 °C | k = 0.01701; n = 0.81343 | 0.99415 | 0.01000 | 0.00071 | |
| 75 °C | k = 0.01277; n = 0.87616 | 0.98823 | 0.01856 | 0.00143 | |
| 80 °C | k = 0.01170; n = 0.90738 | 0.98041 | 0.02623 | 0.00238 | |
| Modified Page MR = exp[(−kt)n] | 60 °C | k = 0.07355; n = 0.07746 | 0.93363 | 0.10734 | 0.00767 |
| 65 °C | k = 0.07563; n = 0.07563 | 0.97420 | 0.04489 | 0.00321 | |
| 70 °C | k = 0.08131; n = 0.08131 | 0.98099 | 0.03252 | 0.00232 | |
| 75 °C | k = 0.08252; n = 0.08252 | 0.98282 | 0.02709 | 0.00208 | |
| 80 °C | k = 0.08603; n = 0.08603 | 0.97742 | 0.03022 | 0.00275 | |
| Henderson and Pabis MR = aexp(−kt) | 60 °C | k = 0.00419; a = 0.87054 | 0.96652 | 0.05414 | 0.00387 |
| 65 °C | k = 0.00498; a = 0.92320 | 0.98551 | 0.02521 | 0.00180 | |
| 70 °C | k = 0.00590; a = 0.92814 | 0.99070 | 0.01591 | 0.00114 | |
| 75 °C | k = 0.00631; a = 0.94613 | 0.98880 | 0.01766 | 0.00136 | |
| 80 °C | k = 0.00696; a = 0.95721 | 0.98160 | 0.02463 | 0.00224 | |
| Wang and Singh MR = 1 + at + bt2 | 60 °C | a = −0.00288; b = 1.99289 × 10⁻⁶ | 0.79338 | 0.33413 | 0.02387 |
| 65 °C | a = −0.00360; b = 3.19296 × 10⁻⁶ | 0.90666 | 0.16241 | 0.01160 | |
| 70 °C | a = −0.00442; b = 4.90606 × 10⁻⁶ | 0.93401 | 0.11293 | 0.00807 | |
| 75 °C | a = −0.00491; b = 6.28902 × 10⁻⁶ | 0.95859 | 0.06530 | 0.00502 | |
| 80 °C | a = −0.00549; b = 7.93237 × 10⁻⁶ | 0.96113 | 0.05203 | 0.00473 | |
| Approximation of diffusion MR = aexp(−kt) + (1 − a)exp(−kbt) | 60 °C | k = 0.00571; a = −3.55588 × 10⁷; b = 1 | 0.93363 | 0.10734 | 0.00826 |
| 65 °C | k = 0.00572; a = 1; b = 1 | 0.97420 | 0.04489 | 0.00345 | |
| 70 °C | k = 0.00661; a = 1.00023; b = 1.00203 | 0.98099 | 0.03252 | 0.00250 | |
| 75 °C | k = 0.04744; a = 3.12557 × 10¹⁴; b = 1 | 0.51441 | 0.76565 | 0.06380 | |
| 80 °C | k = 0.00740; a = 1; b = 1 | 0.97742 | 0.03022 | 0.00302 | |
| Verma MR = aexp(−kt) + (1 − a)exp(−bt) | 60 °C | k = 0.00378; a = 0.82315; b = 7.47134 | 0.98079 | 0.03106 | 0.00239 |
| 65 °C | k = 0.00472; a = 0.89331; b = 8.00641 | 0.99024 | 0.01698 | 0.00131 | |
| 70 °C | k = 0.00562; a = 0.89833; b = 7.47132 | 0.99499 | 0.00858 | 0.00066 | |
| 75 °C | k = 0.00610; a = 0.92338; b = 7.47130 | 0.99142 | 0.01353 | 0.00113 | |
| 80 °C | k = 0.00676; a = 0.93733; b = 7.64572 | 0.98361 | 0.02194 | 0.00219 | |
| Two-term exponential MR = aexp(−kt) + (1 − a)exp(−kat) | 60 °C | k = 0.02442; a = 0.17796 | 0.96986 | 0.04874 | 0.00348 |
| 65 °C | k = 0.00281; a = 0.99814 | 0.75204 | 0.43146 | 0.03082 | |
| 70 °C | k = 0.00658; a = 0.99762 | 0.98099 | 0.03254 | 0.00232 | |
| 75 °C | k = 0.06519; a = 0.09261 | 0.99167 | 0.01314 | 0.00101 | |
| 80 °C | k = 0.00740; a = 1.00027 | 0.97742 | 0.03022 | 0.00275 | |
| Weibull MR = exp(−(t/α)β) | 60 °C | α = 187.43148; β = 0.65209 | 0.99436 | 0.00912 | 0.00065 |
| 65 °C | α = 176.57656; β = 0.77358 | 0.99489 | 0.00889 | 0.00063 | |
| 70 °C | α = 149.67507; β = 0.815360 | 0.99416 | 0.01000 | 0.00071 | |
| 75 °C | α = 145.14707; β = 0.87854 | 0.98823 | 0.01856 | 0.00143 | |
| 80 °C | α = 134.61968; β = 0.91004 | 0.98041 | 0.02622 | 0.00238 |
| Parameter | Different Drying Processes | ||||
|---|---|---|---|---|---|
| 60 °C-10% | 65 °C-10% | 70 °C-10% | 75 °C-10% | 80 °C-10% | |
| L* | 40.51 ± 0.04 d | 41.37 ± 0.10 b | 41.92 ± 0.04 a | 40.69 ± 0.03 c | 40.09 ± 0.02 e |
| a* | 22.77 ± 0.04 d | 22.89 ± 0.02 c | 23.31 ± 0.07 a,b | 23.37 ± 0.07 a | 23.25 ± 0.01 b |
| b* | 39.84 ± 0.09 c | 40.89 ± 0.19 b | 41.65 ± 0.10 a | 39.94 ± 0.05 c | 39.24 ± 0.03 d |
| ΔE | 24.76 ± 0.07 b | 23.50 ± 0.17 d | 22.50 ± 0.06 e | 24.32 ± 0.02 c | 25.21 ± 0.03 a |
| NEB/(Abs/g DW) | 0.40 ± 0.02 b | 0.35 ± 0.01 c | 0.33 ± 0.01 c | 0.41 ± 0.02 b | 0.48 ± 0.02 a |
Disclaimer/Publisher’s Note: The statements, opinions and data contained in all publications are solely those of the individual author(s) and contributor(s) and not of MDPI and/or the editor(s). MDPI and/or the editor(s) disclaim responsibility for any injury to people or property resulting from any ideas, methods, instructions or products referred to in the content. |
© 2024 by the authors. Licensee MDPI, Basel, Switzerland. This article is an open access article distributed under the terms and conditions of the Creative Commons Attribution (CC BY) license (https://creativecommons.org/licenses/by/4.0/).
Share and Cite
Zhu, L.; Ji, X.; Gu, J.; Zhang, X.; Li, M.; Zhang, Q.; Yang, X.; Geng, Z. Staged Temperature- and Humidity-Controlled Combined Infrared Hot-Air Drying (TH-IRHAD) of Sea Buckthorn Reduces Drying Time, Energy Consumption, and Browning. Agriculture 2024, 14, 743. https://doi.org/10.3390/agriculture14050743
Zhu L, Ji X, Gu J, Zhang X, Li M, Zhang Q, Yang X, Geng Z. Staged Temperature- and Humidity-Controlled Combined Infrared Hot-Air Drying (TH-IRHAD) of Sea Buckthorn Reduces Drying Time, Energy Consumption, and Browning. Agriculture. 2024; 14(5):743. https://doi.org/10.3390/agriculture14050743
Chicago/Turabian StyleZhu, Lichun, Xinyu Ji, Junzhe Gu, Xuetao Zhang, Mengqing Li, Qian Zhang, Xuhai Yang, and Zhihua Geng. 2024. "Staged Temperature- and Humidity-Controlled Combined Infrared Hot-Air Drying (TH-IRHAD) of Sea Buckthorn Reduces Drying Time, Energy Consumption, and Browning" Agriculture 14, no. 5: 743. https://doi.org/10.3390/agriculture14050743