Article

Marine Renewable-Driven Green Hydrogen Production toward a Sustainable Solution and a Low-Carbon Future in Morocco

1
Laboratory for Renewable Energy and Dynamic Systems, FSAC-UH2C, Casablanca 20000, Morocco
2
Laboratory of Inorganic Materials for Sustainable Energy Technology (LIMSET), UM6P, Benguerir 43150, Morocco
3
ENSTA Bretagne, IRDL—UMR CNRS 6027, F-29200 Brest, France
4
Department of Mechanical Engineering, Faculty of Engineering, “Dunarea de Jos” University of Galati, 800008 Galati, Romania
5
National Institute for Fisheries Research, Oceanography Department, Morocco & Intergovernmental Oceanographic Commission of UNESCO (IOC/UNESCO), Casablanca 20180, Morocco
*
Author to whom correspondence should be addressed.
J. Mar. Sci. Eng. 2024, 12(5), 774; https://doi.org/10.3390/jmse12050774
Submission received: 3 April 2024 / Revised: 23 April 2024 / Accepted: 2 May 2024 / Published: 5 May 2024

Abstract

:
Oceanic energy sources, notably offshore wind and wave power, present a significant opportunity to generate green hydrogen through water electrolysis. This approach allows for offshore hydrogen production, which can be efficiently transported through existing pipelines and stored in various forms, offering a versatile solution to tackle the intermittency of renewable energy sources and potentially revolutionize the entire electrical grid infrastructure. This research focusses on assessing the technical and economic feasibility of this method in six strategic coastal regions in Morocco: Laayoune, Agadir, Essaouira, Eljadida, Casablanca and Larache. Our proposed system integrates offshore wind turbines, oscillating water column wave energy converters, and PEM electrolyzers, to meet energy demands while aligning with global sustainability objectives. Significant electricity production estimates are observed across these regions, ranging from 14 MW to 20 MW. Additionally, encouraging annual estimates of hydrogen production, varying between 20 and 40 tonnes for specific locations, showcase the potential of this approach. The system’s performance demonstrates promising efficiency rates, ranging from 13% to 18%, while maintaining competitive production costs. These findings underscore the ability of oceanic energy-driven green hydrogen to diversify Morocco’s energy portfolio, bolster water resilience, and foster sustainable development. Ultimately, this research lays the groundwork for comprehensive energy policies and substantial infrastructure investments, positioning Morocco on a trajectory towards a decarbonized future powered by innovative and clean technologies.

1. Introduction

The energy transition to hydrogen (H2) is crucial for fostering clean, climate-neutral, and robust industrial value chains. The options for hydrogen production can be classified into various categories, identified by colors: green, blue, grey, brown, black, turquoise, yellow, pink, orange, and white. The green hydrogen market is expected to experience substantial growth, driven by soaring demands for sustainable energy sources and increased governmental commitments to environmental sustainability [1]. The significance of hydrogen in shaping a sustainable energy ecosystem is paramount, especially in the realms of industrial decarbonization and transportation. Within the expansive industrial sector, which accounts for 30% of energy-related CO2 emissions, there arises a resounding call for a champion of clean energy [2]. By displacing fossil fuels in steelmaking, chemical production, and heavyweight industries, H2 promises a staggering 95% reduction in greenhouse gas (GHG) emissions, laying the foundation for a sustainable industrial revolution [3]. Furthermore, the intermittent nature of solar and wind power challenges grid stability. Here, hydrogen emerges as a versatile energy storage solution. It absorbs surplus renewable energy, stores, and releases it as required, ensuring grid stability, and optimizes renewable energy usage [4]. Developing a green hydrogen economy presents various challenges, encompassing the attainment of technical, economic, and social feasibility, cost reduction, and the establishment of infrastructure for distribution, disposal, and utilization. Therefore, conducting thorough analyses becomes imperative to evaluate the technical and environmental sustainability of green hydrogen energy systems [5].
The production of green hydrogen from oceanic energy is a technically and environmentally feasible solution for decarbonization. Wave energy is emerging as a promising solution to improve the sustainability of green hydrogen production. It offers a reliable and consistent power source, which can help alleviate the challenges related to the energy demand and supply fluctuations in green hydrogen production. Research suggests that integrating wave energy into the production process can significantly reduce the installed capacity required for green hydrogen production, making the process more sustainable and cost-effective [6]. A recent study conducted by researchers from CorPower Ocean, Instituto Superior Técnico de Lisboa, and a major green steel manufacturer has highlighted the potential of wave energy to mitigate greenhouse gas emissions, particularly in the steel industry. The findings of this research have demonstrated that harnessing wave energy could play a crucial role in the production of green hydrogen, a key component in the manufacture of environmentally friendly steel [7,8]. Companies like Lhyfe are working on offshore hydrogen production, aiming to re-oxygenate the oceans by giving back the oxygen produced as a by-product of green hydrogen production. This approach is part of a larger effort to support the resilience of aquatic environments and decarbonize various high-emission industries [9]. A recent study by Pérez-Vigueras et al. [10] examined the viability of producing green hydrogen from ocean energy sources, concluding that integrating hybrid marine systems with hydrogen production could correct the disparity between energy production and consumption. At the same time, Alves’ [11] conducted a comprehensive case study elucidating the establishment of a demonstrative infrastructure catering to the hydrogen economy on Terceira Island, Portugal. It highlights efforts aimed at harnessing the island’s abundant renewable resources, including wind power, oceanic waves, and geothermal energy, to foster the sustainable production of hydrogen. Other studies, such as that by Serna et al. [12] explored the design of a stand-alone offshore electrolysis plant powered by wave energy, proposing an innovative use of this source to produce hydrogen. Calado et al. [13] assessed the potential of offshore wind energy for green hydrogen production, examining two electrolysis systems, one offshore and the other onshore, integrated into an offshore wind farm. Researchers such as Diamant Ngando Ebba et al. [14] provided an overview of technologies for large-scale hydrogen production using marine renewables, such as wind turbines and tidal turbines, while examining different technologies for water electrolysis, hydrogen carriers based on energy storage units and fuel cells.
The marine energy sector poses significant economic challenges and opportunities for Morocco’s coastal regions. It represents an endless reservoir of energy crucial for ensuring the country’s sustainable development and reducing dependence on oil imports. Morocco boasts extensive oceanographic territories, with a marine coastline stretching 3500 km and sovereign rights extending up to 200 nautical miles, defining its Exclusive Economic Zone (EEZ) [15]. Nachtane et al. [16,17] underscored the substantial potential of marine renewable energy in Morocco, emphasizing its pivotal role in bolstering energy security and promoting sustainability. This article focusses on the analysis of a hydrogen production system that combines offshore wind power, wave power and a PEM electrolyzer. The proposed system comprises an offshore wind turbine and OWC connected to a commercial PEM electrolyzer with seven cells in series, facilitated by an AC/DC converter. The main objective of this assessment is to evaluate the technical effectiveness of a new energy system in various regions of Morocco, integrating wave energy to enhance its robustness. This study focuses on the integration of offshore wind, wave energy, and PEM electrolysis in six specific zones of Morocco, as indicated in Table 1. Meanwhile, in a global context where the transition to sustainable energy sources has become essential, research on green hydrogen production is of paramount importance. By focusing on the case of Morocco and examining the wind and wave potential along with the costs associated with hydrogen production in six key cities, this study provides valuable insights to guide energy policies and promote sustainable development in the country. This research aims to address current gaps in the scientific literature and provide concrete data to support Morocco’s energy transition towards a cleaner and more sustainable future.
The structure of the article is as follows:
Section 1: In this introductory section, we explore the critical importance of the energy transition towards green hydrogen, a crucial step towards durable and resilient industrial value chains. We review various methods of hydrogen production, particularly emphasizing green hydrogen and its potential to reduce greenhouse gas emissions. Additionally, we discuss the essential role of oceanic energy in this global energy transition, underlining the relevance of this specific study in the Moroccan context.
Section 2: This section examines the mathematical principles that enhance our green hydrogen production system, covering key components such as wave and wind energy systems and the proton exchange membrane electrolyzer.
Section 3: In this section, we present the results of our simulations regarding the performance of the green hydrogen production system integrating wave and wind energies. We analyze the empirical data obtained and discuss their significance in evaluating the feasibility and practical efficiency of the system in different regions of Morocco. This section highlights the potential advantages and challenges of this approach, as well as the implications for the country’s energy transition and environmental sustainability goals.

2. Data and Methods

2.1. Description of the Study Area and System

Situated in the Maghreb region of North Africa, Morocco holds a pivotal geographical position at the crossroads of Europe and Africa. The meticulous selection of Laayoune, Agadir, Essaouira, Eljadida, Casablanca, and Larache for renewable marine energy installations stems from a comprehensive evaluation of topography, existing infrastructure, and coastal accessibility. These cities have been chosen as strategic focal points for our research due to their distinctive characteristics and promising attributes. Figure 1 and Table 1 provide the geographical coordinates, highlighting the precision in our location choices. These areas play a crucial role in the pursuit of renewable energy production and environmental sustainability, with a specific focus on their potential for substantial hydrogen production. This investigation endeavors to delve deeply into the unique wind and wave dynamics of select regions, aiming to unravel their complexities. Our focus extends to comprehending the technical hurdles intrinsic to wind-to-hydrogen conversion, alongside evaluating the broader viability of harnessing offshore wind and wave energy for hydrogen synthesis. These urban centers, distinguished by their diverse geographical profiles and strategic importance, serve as focal points for our study towards establishing sustainable and eco-conscious energy modalities within Morocco’s urban framework.
Figure 2 provides a visual representation of our innovative system, seamlessly integrating renewable energy and hydrogen production. The intricate process begins with an offshore wind turbine capturing the kinetic energy of the wind, converting it into mechanical energy, and ultimately transforming it into electrical energy through a connected generator. Simultaneously, the oscillating water column (OWC) system leverages wave energy to compress air, propelling a turbine connected to a generator for additional electricity generation. To optimize the generated electricity from these marine renewable sources, power conditioners are employed, playing a crucial role in stabilizing and aligning variable outputs, ensuring the overall reliability of the system. A water tank stores essential ionized or demineralized water, providing the electrolyzer with the necessary component for its chemical reaction. At the system’s core is the state-of-the-art proton exchange membrane (PEM) electrolyzer, renowned for its efficiency and capacity for on-site hydrogen production. Utilizing an electrolytic membrane, the PEM technology facilitates the separation of water molecules, resulting in the production of hydrogen gas at the cathode and the release of oxygen gas at the anode. This stage is pivotal in our commitment to green hydrogen, utilizing renewable marine energy for the production of a clean and versatile energy carrier. The produced hydrogen is securely stored in a hydrogen storage tank, ensuring a consistent supply for various applications, including energy backup and transportation. Beyond showcasing technological innovation, this integrated system emphasizes a holistic approach to addressing energy, water, and environmental challenges in coastal cities. The collaborative integration of offshore wind and wave parks, power conditioners, PEM electrolyzers, and hydrogen storage exemplifies a sustainable and interconnected solution, laying the foundation for a resilient and green energy future. Furthermore, this energy source holds the potential for electricity and ammonia production, contributing to food production given Morocco’s agricultural and fertilizer production capabilities. This comprehensive system underscores not only a scientific breakthrough but also a strategic alignment with Morocco’s broader sustainability and economic goals. Furthermore, the study relies on data covering the period of 2017–2022, sourced from the puertos website [18]. This integrated system optimizes the benefits of marine energy production by synergistically coupling it with hydrogen production, presenting a comprehensive and sustainable solution for electricity and hydrogen generation across various applications.

2.2. Statistical Wave Models: Coastal Application Analysis

2.2.1. The SIMAR Data System

The SIMAR data system, consisting of time series of wind and wave parameters, is the result of numerical modeling. The data originate from two main sets, SIMAR-44 and WANA, thus offering extensive temporal coverage since 1958 [19,20,21,22]. The first, SIMAR-44, represents an enhancement of data for the Mediterranean region, while the second incorporates wind and wave simulations for the Atlantic domain and the Strait of Gibraltar. The process of generating these data involves the use of various atmospheric and oceanographic models [20]. For wind, the REMO atmospheric model, driven by global NCEP enhancement, is used for the Mediterranean region, while the RCA3.5 model, fueled by ERA-40, is used for the Atlantic and the Strait of Gibraltar [23]. For waves, the WAM model is employed, generating hourly data with a decomposition into wind swell and background swell [24]. The WANA series, although originating from a prediction system, provide diagnostic data based on previous developments, produced by the HIRLAM models for wind and WAM/WaveWatch for waves [21]. It is noteworthy that these data require some caution as the models tend to underestimate extreme phenomena and may have gaps, particularly in the south of the Canary Islands archipelago. Available parameters include average wind speed and direction, as well as significant wave height and period, thus providing valuable information for various maritime and meteorological applications.

2.2.2. Mathematical Analysis of Wave Propagation

The study of wave propagation in the marine environment is supported by fundamental equations. Among these, the dispersion relation holds particular importance. It is represented by the following equation [19]:
T 2 = 2 π λ g tanh ( 2 π h λ )
This equation relates the wave period T to parameters such as gravity g , depth h , and wave length λ . An analysis of this relation reveals that the phase velocity c and group velocity C do not depend on depth in deep waters but are influenced by the frequency of the waves, as shown by the following equation [19]:
C 2 = g λ 2 π tanh ( 2 π h λ )
In intermediate waters, where λ / 25 < h < λ / 4 , the velocity depends both on frequency and depth, decreasing with the latter. However, in very shallow waters, when h < λ / 25 the velocity depends only on depth, as expressed by the equation [19]:
C 2 = g h

2.2.3. Statistical Analysis of Wave Energy

Wave models based on the statistical approach calculate the wave energy density spectrum for each instant t at each point in the domain ( x , y ) , for each frequency f and each direction θ , through the following energy transport equation [19,22]:
d E ( x , y , t , f , θ ) d t = S
In this equation, the right-hand side S represents the energy source terms, which are primarily composed of [19,22]:
S = S i n + S d i s + S n l
where:
  • S i n is the energy generation or input term by the wind.
  • S n l is the energy exchange term between the different spectrum components.
  • S d i s is the energy dissipation term.
The wave spectrum can be considered as a statistical distribution of wave energy, allowing for the calculation of all statistical parameters. The n the order moment will be [19]:
m n = 0 f n E f d f
From the spectrum and moments, we can derive commonly used parameters to define waves, such as significant wave height H m 0 , mean periods T m 02 and T m 01 , peak period T p , mean wave direction θ , etc. H m 0 , T m 02 , T m 01 are expressed by the equation [19]:
H m 0 = 4 m 0   T m 01 = m 0 m 1   T m 02 = m 0 m 2  
The wave action density spectrum, N ( f , θ , x , y , t ) is directly related to the wave energy density spectrum, E ( f , θ , x , y , t ) through the relation [21]
N = F σ
where F is the absolute frequency of the wave (observed in a fixed reference frame), and σ is the relative frequency of the wave (observed in a reference frame moving with the current U .

2.2.4. Mathematical Analysis of Offshore Wind

Wind Power Estimation

The mean specific power accessible within a cross-sectional area A orthogonal to the wind flow at velocity V (m/s) is computed and delineated per unit area through the subsequent expression [25]:
P w i n d = 1 2 ρ V 3 ¯
where ρ is the standard air density, V ¯ is the mean wind speed (m/s).
For heights below 100 m, the estimation of wind speed at any given height h utilizing the standard wind speed at 10 m above ground level, as advocated by the World Meteorological Organization (WMO), is subject to the conditions delineated by Justus. In his recommendation, Justus emphasized the application of Hellman’s exponential law, contingent upon two crucial factors, atmospheric stability and moderate site roughness [26]:
V h = V 10 h 10 α
In the realm of wind dynamics, α symbolizes the roughness factor, a pivotal parameter denoting the wind speed power law index. Traditionally acknowledged as 1/7 or equivalently 0.14, α characterizes surfaces exhibiting minimal roughness, conforming to the well-established one-seventh power law.

Plant Load Factor and Capacity Factor

One crucial parameter in wind energy assessment is the Plant Load Factor (PLF), which plays a pivotal role in estimating the monthly and yearly energy yields of Wind Energy Conversion Systems (WECS). The PLF, delineated as the quotient of the realizable power harnessed from the wind and the rated capacity of the WECS, serves as a fundamental metric in evaluating the operational efficiency and performance of wind energy installations [27]:
P L F = P h P r
The capacity factor C f stands as a pivotal metric delineating the productivity of a wind turbine. Essentially, C f quantifies the ratio of actual energy output, denoted as E o u t , against the hypothetical maximum output achievable under continuous maximum operation throughout a standard one-year timeframe, symbolized as E r = 8760 P r , where P r signifies the rated power of the turbine. This metric provides a succinct gauge of the efficiency and utilization of wind energy conversion systems, aiding in performance assessment and strategic planning within the renewable energy sector.
The capacity factor C f of a wind turbine can be calculated as
C f = E o u t E r

2.3. Wind Speed Frequency Distribution

2.3.1. Weibull Distribution

The Weibull distribution, representing material strength in tension and fatigue, emerges as a versatile model for various physical phenomena, notably in analyzing wind speed frequency distributions crucial for identifying optimal wind turbine sites [28]. Plotting percentage frequency distribution against wind speed reveals a characteristic curve, with the peak denoting the most common wind speed. Characterized by shape k and scale c parameters, the Weibull distribution closely aligns with experimental data. Recent research has proposed four methods for estimating these parameters, acknowledging their significance in accurately describing wind speed distributions:
F v = 1 exp V c k
where F ( v ) is the Weibull cumulative distribution function, V denotes the wind speed (m/s), k is the shape parameter and c is the scale parameter (m/s).

2.3.2. Rayleigh Distribution

It is noteworthy that the Rayleigh distribution can be regarded as a specific instance of the more general Weibull distribution, often employed to model wind speed frequency distributions across various scenarios. In the Rayleigh distribution, the shape parameter, denoted as k , is conventionally assigned a value of 2 ( k = 2 ). Thus, the mathematical expression for the cumulative distribution function of the Rayleigh distribution is derived accordingly [29]:
R v = 1 exp π 4 V V x 2
where R ( v ) is the Rayleigh cumulative distribution function; V x is the long term average wind speed (m/s).

2.4. Steps and Methodology

Table 2 presents the various steps of the data collection and management process from the Puertos website, with a brief description of each step [21].

3. Method

This section describes the mathematical model for each element of the proposed system.

3.1. Wind Turbine Model

The electrical output of the wind turbine is determined using Equation (15), in accordance with the specifications of the IEA Wind 15-MW wind turbine model used in this study [30]. The main technical properties of the offshore wind system are detailed in Table 3. The optimal formula for calculating the power generated by a wind turbine (in Watts) is expressed as follows [31,32]:
P W = 0.5   C p   A   ρ   π   R 2   V 3 A = π   D 2 4
where P represents the performance power output, C p is the coefficient (efficiency factor, %), A the swept area of the wind turbine, ρ is the air density (kg/m³), R is the length of the blade (m), and V signifies the wind (m/s).

3.2. Wave Energy Model

In the Atlantic Ocean, a significant rotational current manifests itself with a motion opposite to that of space. Several buoys have been deployed in this region to collect wave data, including parameters such as wave height and period. This information is of vital importance for estimating wave energy at sea. The wave power is estimated using the following equation [33]:
P = 1 64 π ρ g 2 H s 2 T
where P is the wave power per unit peak length (kW/m), H s is the significant wave height (m), T is the wave period (s), ρ is the seawater density (assumed equal to 1025 kg/m3) and g is the gravitational acceleration (9.81 m/s²).
The final step in the methodology involves determining the power of the wave energy converter on a monthly basis, given the significant intra-annual variability. This calculation is carried out as follows [34]:
P c = P W ƞ T
where W (m) represents the width of the opening in front of each chamber (with W = 4 m), and ƞ T is the total converter efficiency, defined by the following equation [34]:
ƞ T = ƞ p ƞ m ƞ e
where ƞ p is the efficiency of the conversion of wave to pneumatic energy, ƞ m is the efficiency of the conversion of pneumatic to mechanical energy, and ƞ e is the efficiency of the conversion of mechanical to electrical energy.
The consideration involves a turbine generator with a power rating, P r (kW), set at 200 kW. The constraints arise from the fact that the power rating of the turbine generator group, P r (kW), confines the actual power output per chamber, P o c (kW). In this scenario, the subsequent equations come into play [34]:
P o c = P C   if   P C   < P r P o c = P r   if   P C   P r
This implies that if the power achievable for a given wave scenario exceeds the power rating of the turbine generator group, the actual wave power is capped at the rated power. Ultimately, the average monthly power output from each chamber, P o (kW), was computed by weighting the power output of each wave scenario, P o c (kW), by its monthly probability.

3.3. Power Conditioner

The integration of various energy sources in this hybrid system requires a suitable power electronics interface, as both the OWC system and the wind turbine generate alternating current. Consequently, the system presented incorporates a power conditioning unit equipped with a power converter—specifically, an AC/DC converter, as shown in Figure 2. The wind turbine and oscillating water column (OWC) turbine generators are connected to the AC/DC rectifier, establishing a connection with the DC bus. This converter, in turn, interfaces directly with the DC bus to deliver the required current to the electrolyzer. The subsequent equation elucidates the operational principles of the power conditioner model [35]:
P E Z = P W + P c × η A C D C
where P E Z is the electrolyzer power; η A C D C is the efficiency of the AC/DC converter.

3.4. PEM Electrolyzer Technology

Electrolyzation, a well-established and commercially viable technique, offers the capability to produce substantial amounts of hydrogen intermittently, all while maintaining a commitment to a low-carbon footprint. This is contingent on the requirement that the electricity driving the process is sourced from renewable means [36]. Our proposal zeroes in on Proton Exchange Membrane (PEM) electrolyzers due to their safety advantages, particularly when compared to alternative technologies ([37] and related references). Furthermore, PEM electrolyzers have undergone successful testing in marine environments [38]. For an acidic PEM cell, the assumption is that liquid water splitting occurs in accordance with the following half-cell reactions [39]:
Anode :   2 H 2 O O 2 + 4 H + + 4 e
Cathode :   4 H + + 4 e 2 H 2
This delineates the electrochemical processes within the PEM electrolyzer, underlining its pivotal role in the overall hydrogen production system. Protons, which formed as solvated entities at the oxygen-evolving anode of the proton exchange membrane (PEM) cell, undergo migration through the membrane. Their journey concludes at the cathode, where a reduction process transforms them into molecular hydrogen. This succinctly encapsulates the proton’s pivotal role in the intricate electrochemical dance within the PEM electrolyzer, facilitating the production of hydrogen [12]. The hydrogen production rate can be determined using Equation (17) [40,41]. This equation takes into account the power consumption and the efficiency of the electrolyzer. By applying these parameters, the rate of hydrogen production can be accurately calculated:
m H 2 = P E Z × ƞ e l e H H V H 2
The hydrogen production rate ( m H 2 ) is computed using the equation provided, where H H V H 2 represents the higher heating value of hydrogen in joules per kilogram (J/kg).

3.5. System Performance

In this section, we conduct a quantitative analysis of the system’s efficiency using Equations (22) to (24) [40,42]. The main focus is on calculating the efficiencies of key components, including offshore wind turbines, wave energy converters (OWC), and Electrolyzers. These efficiency parameters serve as vital indicators, providing insight into how efficiently each component converts natural resources into electricity and, subsequently, hydrogen. The aim of this analysis is to assess whether certain cities show a more favorable potential for offshore wind or wave energy generation [2]:
η V = P o c × η g e n × η A C D C P v
η W T = P W × η g e n × η A C D C P w i n d
η E Z = m H 2 ˙ × H H V H 2 E l e c t r o l y z e r   i n p u t   p o w e r
In this specific context, P o c represents the power generated by the Ocean Wave Energy Conversion (OWC) system. η A C D C refer to the efficiency of the AC/DC converter, respectively. P W denotes the power generated by offshore wind turbines, while P v represents the available power in waves. The hydrogen production rate is represented by m H 2 ˙ , and H H V H 2 is the higher heating value of hydrogen, equal to 39.4 kWh per kilogramme.

4. Results and Discussions

4.1. Analysis of Wave and Wind Data

We present the results of our simulation of climatic conditions in six distinct Moroccan cities, with the aim of producing compressed hydrogen using offshore turbines and Oscillating Water Column (OWC) turbines. These results are updated every hour over a period of six years. The data collection process for our study was meticulously planned to establish a solid foundation for the analysis of crucial parameters, especially the significant wave height, as illustrated in Figure 3, and the total wind speed, also depicted in Figure 4. These parameters play a crucial role in assessing the wind and wave energy potential of the selected regions. Our data collection approach was methodical and relied on reputable sources, including Puertos del Estado, known for its reliability and accuracy in providing precise monthly data on wind speed, significant wave height, and wave period. This comprehensive approach spanned a complete six-year period, allowing us to thoroughly examine seasonal variations and long-term trends in wind speed, significant wave height, and wave period. The results of this meticulous data collection and analysis ensure the reliability and significance of our conclusions. By consolidating information from reliable sources and extending the analysis over a longer timeframe, our research is fortified with a robust and comprehensive dataset. This approach facilitates a thorough evaluation of the offshore potential and the Ocean Wave Climate (OWC) in the designated regions. As shown in Figure 3, which illustrates the wave in six coastal cities, distinct variations in the wave regimes become evident. Wave datasets provide valuable insights into swell conditions in diverse locations. Analysis of significant wave heights in different Moroccan cities between 2017 and 2022 reveal distinct coastal features for each area. In Larache, annual variations ranged from 2.97 m in 2021 to 3.63 m in 2018, implying relatively moderate conditions. Casablanca showed more significant fluctuations, reaching a peak of 4.11 m in 2018 and a trough of 3.47 m in 2017, highlighting significant coastal dynamics. El Jadida showed varying wave heights, from 3.55 m in 2021 to 4.42 m in 2018, revealing a diversity of oceanic intensity. Essaouira, with wave heights ranging from 3.81 m in 2020 to 4.61 m in 2017, showed significant coastal dynamics, requiring constant adaptation. Agadir stood out as having some of the highest heights, ranging from 4.01 m in 2022 to 4.91 m in 2017, underlining the fact that ocean conditions are often rougher. Finally, Laayoune, with moderate fluctuations from 2.25 m in 2020 to 2.73 m in 2018, reflected fewer pronounced coastal dynamics.
This analysis offered vital insights for coastal planning, maritime safety, and the understanding of ocean trends in each Moroccan city. In-depth analysis, particularly through a wave rose, improves our understanding of dynamic variations in wave climate, offering crucial information for safety and maritime planning. Moving to Figure 4, which illustrates wind roses for six coastal cities, a clear distinction in the wind regimes is evident. These data, presented as wind roses, offer a comprehensive understanding of the local wind climate, crucial for informed decision-making in sectors ranging from renewable energy to infrastructure development and environmental studies. The temporal variability of wind speed further contributes to a nuanced understanding of the intricate dynamics of the local wind climate. For instance, in Agadir, average wind speeds ranged from 11.93 m/s to 22.34 m/s, with directions covering a broad spectrum from N to W. Analysis, particularly through wind roses, revealed dominant directions and sectors with high average speeds, emphasizing the importance of directional analysis, particularly around N, NE, E, and W. In Casablanca, notable variations in speed (7.82 m/s to 20.41 m/s) and direction (N to W) were observed, with specific directions, such as NW, NNW, and WSW, exhibiting high speeds. The representation of temporal variability offers crucial information for wind planning. Similar fluctuations were observed in El Jadida, Essaouira, Laayoune, and Larache, with specific directions showing localized patterns of high speeds, highlighting their significance for energy planning.

4.2. Model Simulation

The system was modeled using MATLAB/Simulink, integrating real meteorological data adapted to Morocco’s climatic conditions, including parameters such as significant wave height, wave period, and wind speed. The power conditioning unit regulated the current required by the PEM electrolyzer to maintain optimal operating conditions. The model equations were solved at each time interval using the “Trust-region dogleg” solver in MATLAB/Simulink to solve the algebraic equations. To avoid algebraic loops, MATLAB’s “memory” block was utilized to estimate the PEM cell voltage from the first iteration. The variable initial values were defined in each subsystem using the MATLAB integration block, thereby breaking the algebraic loop. The solver processed the system of equations illustrated above according to the flowchart shown in Figure 5.

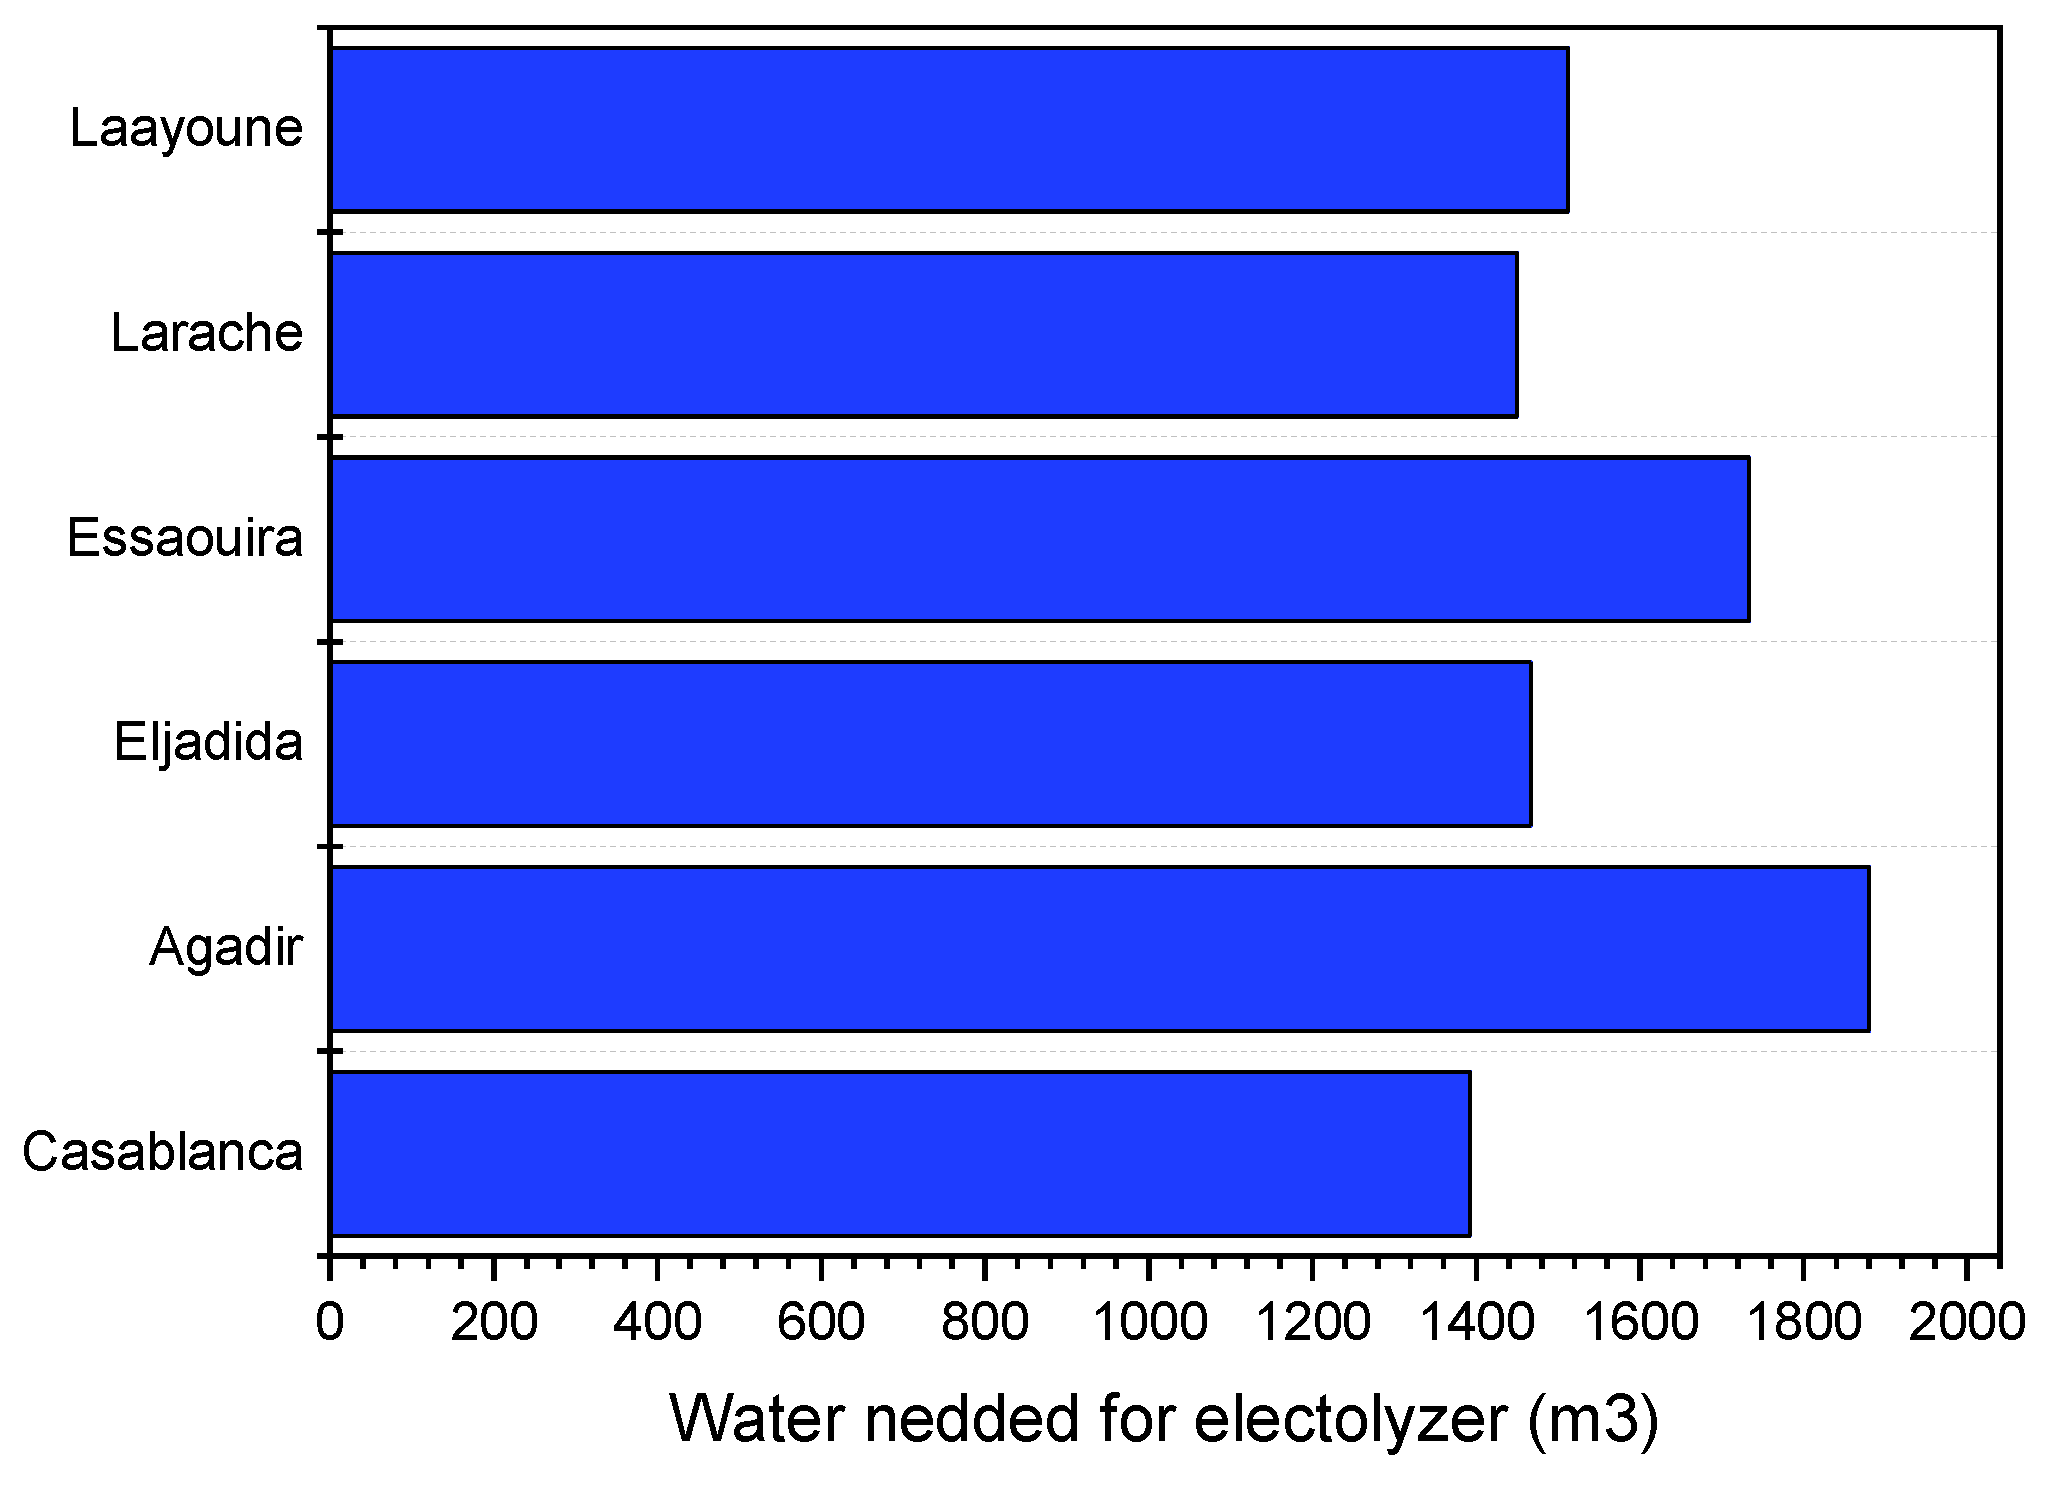
4.3. Electrolyzer Performance and Water Usage Analysis

The efficiency of contemporary electrolyzers exhibited a range between 62% and 89%, contingent upon the applied electrical voltage and the operational parameters chosen by the manufacturer to optimize hydrogen output. These disparities stem from the diverse technological approaches employed and operational settings, with particular emphasis on water input conditions. For instance, industrial electrolyzers typically consume between 4 and 5 kWh of electricity along with approximately one liter of water per cubic normo-meter of hydrogen generated. In essence, the production of one kilogram of hydrogen necessitates an energy input ranging between 44 and 55 kWh, coupled with an intake of 11 L of water. Consequently, our proposed system demanded the water quantities outlined in Figure 6 across the six urban centers under scrutiny.

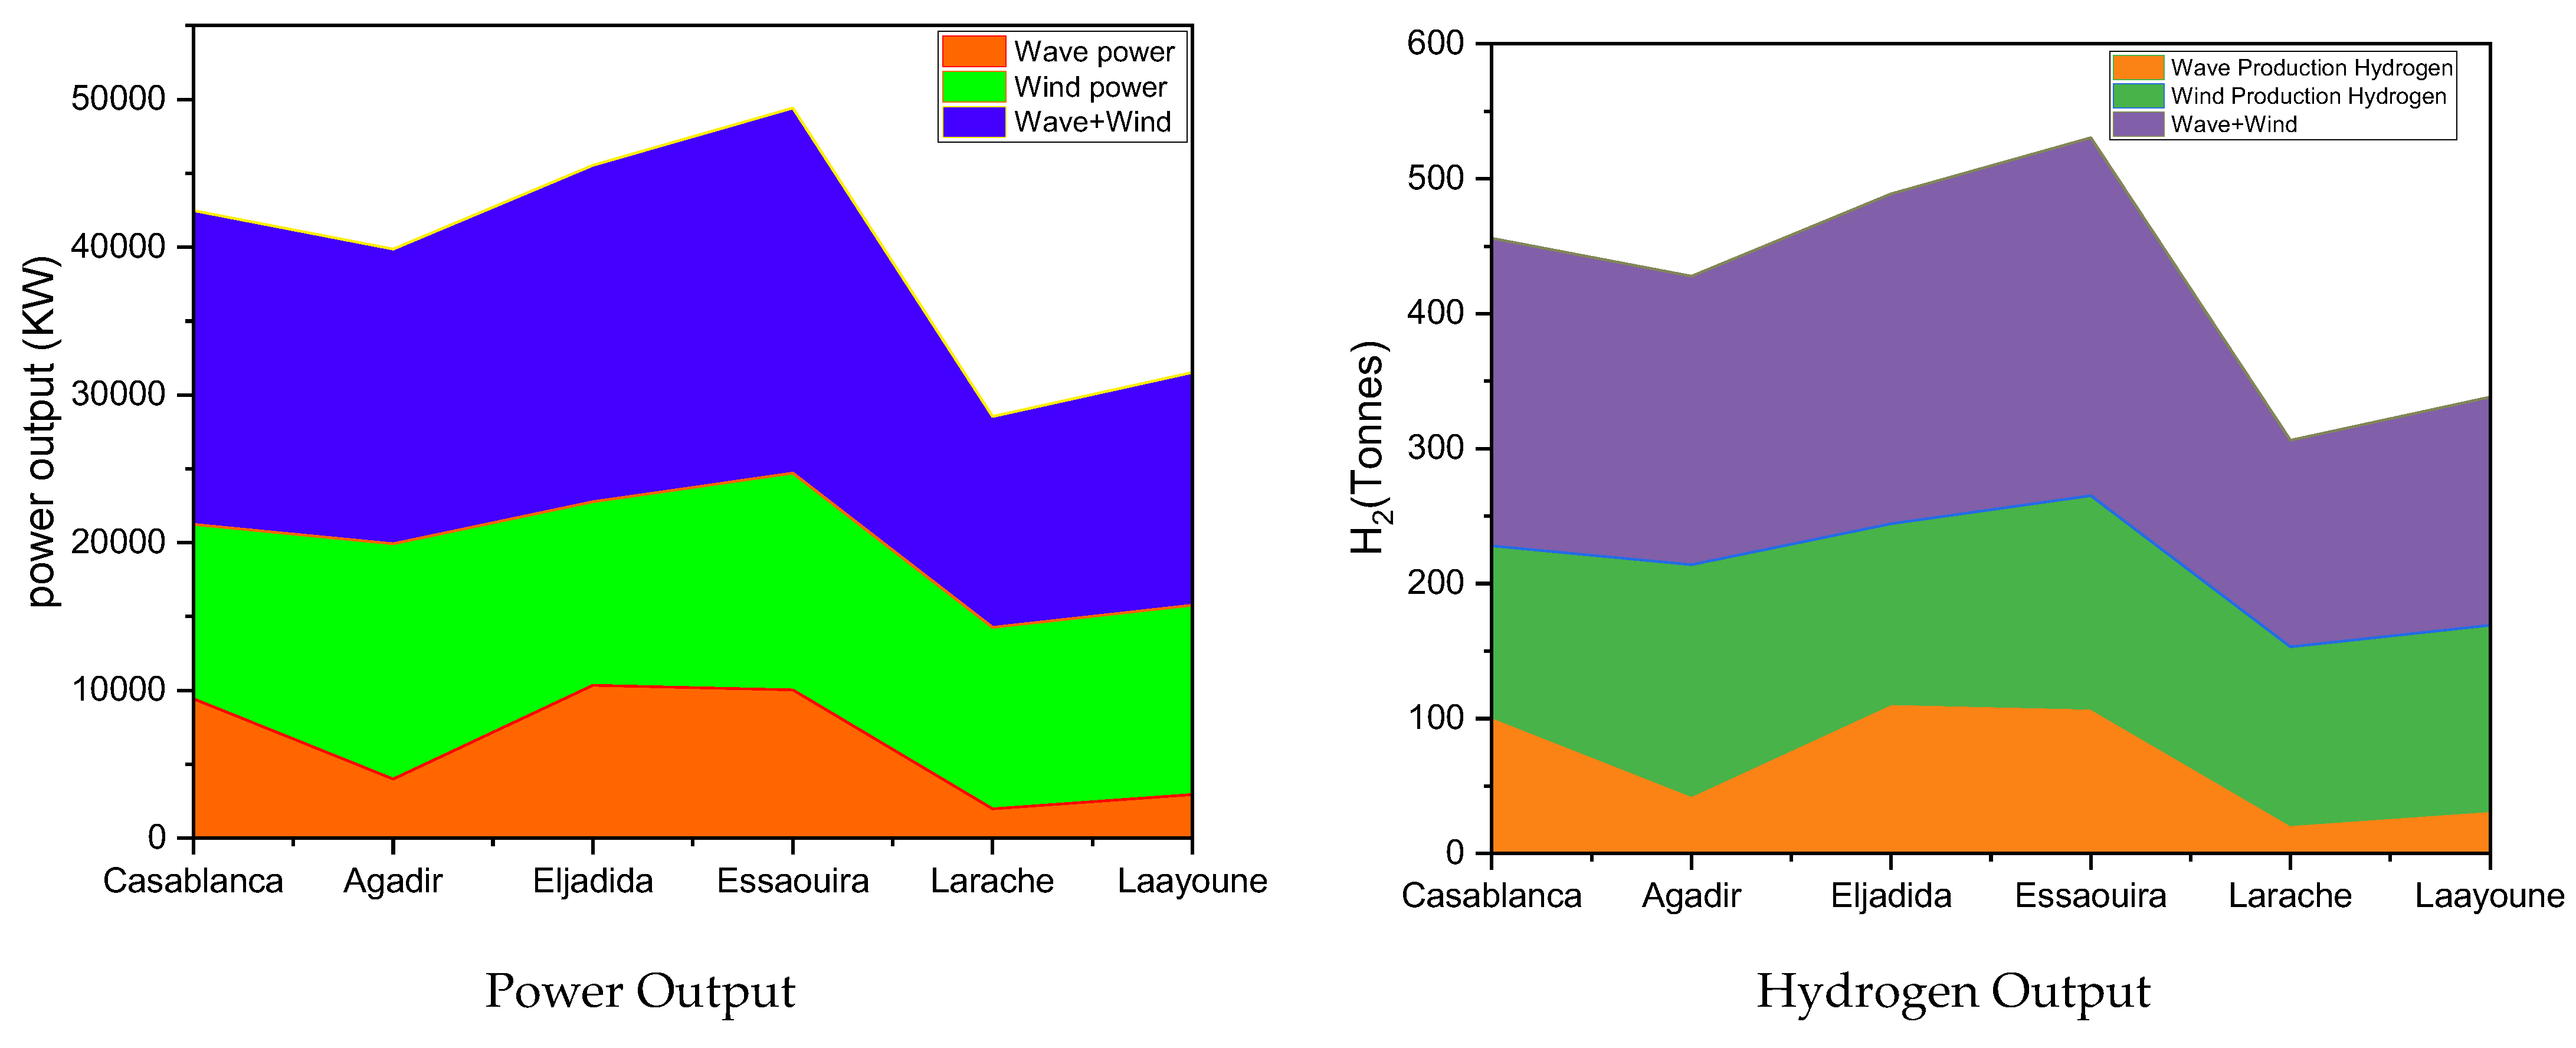
4.4. Power and Hydrogen Output Production

The fundamental objective of this study is to evaluate the efficiency of an offshore wind module and a wave energy module integrating a PEM electrolyzer system dedicated to hydrogen production. These installations were planned in six specific regions of Morocco: Larache, Casablanca, El Jadida, Essaouira, Agadir and Laayoune. Figure 7 and Figure 8 and Table 4 and Table 5 offer an in-depth analysis of seasonal patterns of electricity generation from different renewable energy sources, highlighting hydrogen production as well. These visual representations offer valuable information on fluctuations and long-term trends in offshore wind and wave power generation over a six-year period.
The data provide an overview of wind and wave power generation in several Moroccan cities over a six-year period, from 2017 to 2022. In Casablanca, wave power showed notable fluctuations, with a drop in 2021 followed by a slight recovery in 2022. Agadir has seen a downward trend since 2017, while El Jadida saw continuous growth until 2019, followed by a slight decrease in 2020 and 2021. Essaouira saw a steady downward trend since 2017. Larache saw a decline in 2021, with a recovery in 2022. Laayoune showed notable variations, but with a general upward trend since 2018. Overall, most cities maintained relatively stable power levels, indicating a certain stability in the Moroccan energy sector. Seasonal variations and strategic adjustments over time should be noted. These data provide a crucial basis for energy planning and continued progress in the sector. Interestingly, Essaouira appears to be a consistent leader in terms of wind power capacity, closely followed by Larache and Laayoune. In 2017, Essaouira had the highest wind power output, but Larache took first place in 2018 and 2019. Subsequent annual variations, with a notable increase in Laayoune in 2020 and 2021, underline the changing dynamics of the sector. The year 2022 shows a downward trend in most cities with regard to wind power, suggesting possible influences such as meteorological factors, investments in wind farms, and other renewable energy considerations.
Data on wind and wave H2 power generation in Morocco between 2017 and 2022 reveal distinct trends in each region. In Casablanca, a notable increase in H2 wave energy production was observed from 2017 to 2018, followed by fluctuations and a slight increase in 2022. In contrast, Agadir saw a decline in H2 wave energy production in 2018, followed by a general decrease over the years, indicating potential challenges or changes in local wave energy dynamics. El Jadida recorded a significant increase in wave energy production from 2017 to 2018, but subsequent years showed fluctuations, with a drop in 2019 and another in 2021. Essaouira showed fluctuations, with a decline in 2021, underlining the need for further study of the factors influencing wave energy in this region. Larache, despite relatively low production levels, showed fluctuations, with a decline in 2018 and a slight increase in 2022. Laayoune showed a varied pattern, with an increase in 2018, a decrease in 2020 and an increase in 2022, indicating dynamic influences on wave energy production in the city. Overall, these trends highlight the diverse dynamics of wave H2 power generation in Moroccan cities, with each region facing unique challenges and opportunities in the sustainable exploitation of wave energy. As for H2 wind power in Agadir, the trend was generally stable with slight fluctuations, showing a drop in 2019 and a subsequent increase in 2022. In Casablanca, a fluctuating trend was observed, with a drop from 2017 to 2018 and minimal production in 2022. El Jadida saw growth in wind power production until 2019, followed by slight declines in 2020 and 2021. Essaouira, despite an initially high level of production in 2017, experienced a steady decline, particularly in 2020. Laayoune stood out for its steady upward trend, reaching its highest output in 2022. Larache, for its part, showed fluctuations, with a slight drop in 2018, followed by relatively stable production in subsequent years. These variations highlight the diverse dynamics of H2 wind power generation in Moroccan cities, offering valuable insights into regional trends and potential factors influencing renewable energy production over the six-year period.
In Figure 9, we present a comparative analysis of wind, wave and hydrogen power generation in six Moroccan cities over a given period. The graphical data explicitly highlight the respective contribution of each energy source in locations such as Casablanca, Agadir, El Jadida, Essaouira, Larache and Laayoune. This visualization clearly underlines the predominance of wind power, both in terms of power generated and hydrogen production, while also highlighting city-specific variations.
The data provided in Figure 9 and Table 6 offer a significant insight into the combined production of wind and wave energy, and the associated hydrogen generation, in six Moroccan cities. Casablanca is characterized by a harmonious balance between wave and wind power, resulting in a total output of 21,236.65 kW and the production of 227.927 tonnes of hydrogen. Agadir stands out for its heavy reliance on wind power, with wind production exceeding wave (4008.50 kW) by 15,924.27 kW, and hydrogen production reaching 213.933 tonnes. El Jadida stands out with a combined wave and wind production of 22,770.65 kW, generating 244.391 tonnes of hydrogen. Essaouira posted a high output of 24,709.78 kW, producing 265.203 tonnes of hydrogen. Although Larache has a lower total energy output, its significant contribution to hydrogen production (153.123 tonnes) with a combined output of 14,266.94 kW is noteworthy. Laayoune also plays a key role in sustainable hydrogen generation, with a combined output of 15,762.83 kW and hydrogen production of 169.178 tonnes. A comparison of wave and wind energy production reveals a consistent predominance of wind power, both in terms of generated power and hydrogen production.

5. Performance of the Studied System

The efficiency percentages for six different locations, Casablanca, Larache, Essaouira, Agadir, Eljadida, and Laayoune, were analyzed over the span of six years (Figure 10), from 2017 to 2022. Notably, Larache showcased a remarkable upward trend in efficiency, starting at 34.60% in 2017 and steadily climbing to 53.59% by 2022, indicating consistent improvement over the years. Similarly, Agadir demonstrated a noteworthy increase in efficiency, with figures rising from 31.09% in 2017 to 38.74% in 2022. Conversely, Casablanca, despite experiencing fluctuations, saw a decline in efficiency from 37.49% in 2021 to 34.66% in 2022. Essaouira also displayed some variability in efficiency but exhibited an overall positive trajectory, starting at 26.04% in 2017 and reaching 32.97% by 2022. Eljadida demonstrated marginal improvement, with efficiency inching up from 31.09% in 2017 to 32.94% in 2022. Laayoune’s efficiency fluctuated over the years, starting at 45.23% in 2017, dropping to 40.68% in 2018, then gradually climbing back to 45.17% by 2022. These trends highlight the dynamic nature of efficiency across these locations, with some showing consistent progress while others experienced more variability. Further analysis is required to elucidate the underlying factors contributing to these fluctuations and trends.

6. Techno-Economic Analysis

This study involves integrating data from the hydrogen production system. The analysis considers data for the current year (2022).

Hydrogen Production Cost Calculation

This study conducted a comprehensive techno-economic analysis focusing on the initial installation costs associated with the Ocean Wave Energy Converter (OWC) and offshore wind farm (OWF) in Morocco. Distinct equations tailored to the unique characteristics of each technology were employed to assess these components.
i.
Initial installation cost of OWC in Morocco
Equation (25) was utilized to compute the initial installation cost of the Ocean Wave Energy Converter ( O W C ), accounting for parameters such as the design of the OWC technology, local wave conditions, water depth, and other variables unique to the OWC system:
O W C I i = O W C T c × P
where O W C I i represents the initial installation cost of the O W C , O W C T c is the installation cost per kilowatt (kW) specific to the O W C technology, and P is the total installed capacity of the O W C .
ii.
Initial installation cost of OWF in Morocco
In adapting Equation (26), originally applied to offshore wind farms ( O W F s ), for the context of Morocco, modifications were made to suit the unique attributes of the location. Utilizing the information provided in Table 7, the initial installation expenses of the O W F are computed, considering factors such as the proximity of the wind turbines to the coastline, the depth of the water, and additional parameters pertinent to the OWF setup in Morocco [43]:
O W F I i = O W F T c × P
In this equation, O W F I i stands for the initial installation cost of the offshore wind farm ( O W F ). O W F T c represents the installation cost per kilowatt (kW) tailored to the specific technology used in the O W F . The variable P denotes the total installed capacity of the offshore wind farm.
Factors influencing these installation costs include the design of energy converters, resistance to local maritime conditions, and costs related to anchoring and maintenance, as well as local regulations and project scale. The data necessary for these calculations are extracted from specific tables, adapted to reflect local conditions and characteristics specific to each technology in Morocco. By combining these results, the study provides a comprehensive view of the techno-economic analysis for O W C and O W F installations in Morocco.
In this study, O W F T c represents the cost of installing each kilowatt (kW) for the offshore wind farm, while O W C T c denotes the installation cost per kilowatt (kW) for the wave energy converter. For the Moroccan location, where sea depths range from 30 to 40 m, a fixed value of 2227 EUR/kW for O W C T c is utilized, as indicated in Table 4. Additionally, O W C T c is considered for the wave energy converter, set at 1334.16 EUR/kW [44]. P represents the total installed capacity of both the offshore wind farm ( O W F ) and the wave energy converter (OWC), with O W F having a capacity of 15 MW and O W C having a capacity of 2 MW. O W F I i signifies the installation cost per kilowatt (kW) for the offshore wind farm. Consequently, the anticipated initial installation cost for the O W F facility amounts to 33.4 million euros. O W C I i represents the installation cost per kilowatt (kW) for the wave energy converter. Therefore, the anticipated initial installation cost for the O W C facility is 2.67 million euros.
Following this, the examination proceeds to ascertain the initial installation expenses for the Proton Exchange Membrane Electrolysis unit ( P E M I i ), incorporating the data provided in the sources [43,45], The installation cost for the Proton Exchange Membrane (PEM) electrolysis unit varies from 700 to 1400 EUR/kW. In this analysis, we considered a cautious estimate of 1000 EUR/kW for the PEM unit. Consequently, the total initial investment required for a 16.5 MW PEM electrolysis unit is determined to amount to 16.5 million euros [43].
Table 7. Initial installation costs of offshore wind farms (OWF) based on water depth [43,46].
Sea Depth (m)FoundationTurbineGrid ConnectionInstallationOtherTotal Cost (EUR/kW)
10–20352772133465791800
20–30466772133465851920
30–40625772133605922227
40–509007721336051052514
As a result, the total installation cost for this hydrogen production facility is determined by applying Equation (27) [43]:
( O W F I i + O W C I i + P E M I i + M O ) = H P t c
H P t c represents the installation cost of the hydrogen production facility, while MO denotes the total maintenance and operational cost, equivalent to 5% of the total. Therefore, the installation cost for this green hydrogen production facility is calculated to be 51.57 million euros using Equation (27). Furthermore, the calculation of the cost of hydrogen production per kilogram for a green hydrogen production facility planned for establishment in Morocco utilized data spanning from 2022 to 2050 [43]. Therefore, only the data from the year 2022 was used to ensure relevant and updated results for the context of this study. This computation was performed using Equation (28) [43], which is expressed as follows:
H P t c H G H × P E M l s = G H p c
In this context, H G H represents the hourly production of hydrogen, P E M l s denotes the lifespan of the electrolysis unit, and G H p c signifies the unit cost of green hydrogen (in euros per kilogram). The anticipated lifespan for the electrolysis unit, specifically for PEM technology, was set at 70,000 h for the year 2022, as detailed in Table 8.
Figure 11 illustrates the cost of hydrogen production measured in EUR per kilowatt (EUR/kW) in various cities across Morocco as of the year 2022. These data offers valuable insights into the economic feasibility and regional disparities in hydrogen production within the country. Essaouira emerged as the city with the lowest cost of hydrogen production at 16.78 EUR/kW, suggesting potentially favorable conditions for hydrogen-related initiatives in terms of economic viability. El Jadida and Casablanca follow closely behind, with costs of 17.85 EUR/kW and 18.78 EUR/kW, respectively, indicating similar levels of competitiveness in these regions. Agadir and Laayoune demonstrate slightly higher costs compared to the aforementioned cities, with values of 21 EUR/kW and 23.41 EUR/kW, respectively. Larache, on the other hand, appears to have the highest cost of hydrogen production among the listed cities, standing at 29.04 EUR/kW.
The observed variations in production costs likely arise from a multitude of factors, encompassing variances in regional energy infrastructure, the abundance of renewable energy reservoirs, technological progressions, and economies of scale. Notably, the cost advantage in Essaouira may be ascribed to its geographically advantageous position for harnessing renewable energy sources or the implementation of conducive policies and investments in hydrogen-related technologies. This analysis underscores the necessity of accounting for regional nuances and economic determinants in the strategic formulation and execution of hydrogen production initiatives. Such findings furnish crucial insights for policymakers, investors, and stakeholders engaged in shaping the hydrogen infrastructure landscape within Morocco.

7. Discussion and Future Research Directions

This study provided a critical examination of the integration of offshore wind, wave energy, and PEM electrolyysis within Morocco, marking an initial assessment of marine energy integration aimed at green hydrogen production. This pioneering work explores the technical effectiveness of a novel hybrid energy system, which combines these renewable resources. By assessing the hydrogen production costs across six Moroccan cities, our findings offer vital insights for strategic planning and infrastructure investments in renewable energy sectors.
Specifically, the results from this study highlight the economic viability of harnessing both wind and wave energy for hydrogen production. Essaouira, with the lowest observed production cost of 16.78 EUR/kW, serves as a prime example of cost efficiency in renewable energy utilization. This cost effectiveness positions Essaouira, alongside El Jadida and Casablanca—which also demonstrated competitive costs at 17.85 EUR/kW and 18.78 EUR/kW, respectively—as potential benchmarks for other regions, considering similar sustainable energy systems. In contrast, Larache displayed the highest cost at 29.04 EUR/kW, underscoring the regional economic disparities that could influence broader national energy strategies. The implications of these findings are substantial for Morocco’s energy policy, particularly in promoting hydrogen as a key component of the nation’s transition to sustainable energy sources. By pinpointing regions where hydrogen production costs are minimized, policymakers are equipped to strategically prioritize areas for development. This targeted approach could foster a more equitable distribution of renewable energy infrastructure across the country, contributing to a balanced and sustainable national energy landscape.
Moreover, this initial assessment serves as a foundational step towards a comprehensive national strategy for integrating marine energies in hydrogen production. It not only underscores the potential of renewable energies in reducing the cost of hydrogen production but also highlights the necessity of continued research and development in this area to overcome regional disparities and fully harness Morocco’s renewable energy potential.
Despite the valuable insights provided by this study, several limitations and challenges must be acknowledged, particularly regarding the economic and technical aspects of integrating marine energies for hydrogen production.
Technical Challenges:
  • Variability in renewable energy sources: The inherent variability of wind and wave energy presents significant technical challenges. This variability can lead to fluctuations in energy supply, which directly impacts the efficiency and reliability of hydrogen production. Consistent and predictable energy input is crucial for the stable operation of PEM electrolysis systems. Overcoming this requires advanced forecasting techniques and potentially integrating energy storage solutions to buffer against energy supply fluctuations.
  • Infrastructure and technology maturity: The integration of wave energy conversion technologies with offshore wind farms and electrolysis systems is still at a developmental stage. The technical feasibility of such hybrid systems operating in harsh marine environments poses a significant challenge, requiring durable materials and technologies that can withstand corrosive saltwater, strong currents, and variable weather conditions.
Economic Challenges:
  • Assumption of static economic conditions: The study’s assumption of static economic conditions overlooks potential fluctuations in market prices for technologies, raw materials, and energy. The capital costs associated with developing and deploying advanced renewable technologies, especially in the marine environment, can be substantial. Moreover, the prices of raw materials such as special metals used in electrolyzers can vary significantly, affecting the overall economics of hydrogen production.
  • Cost of developing new technologies: While the study provides a snapshot of current data, the rapidly evolving nature of renewable energy technologies means that initial cost assessments might quickly become outdated. The research and development of more efficient and robust wave energy converters, for instance, require significant investment. Achieving economies of scale and technological advancements could reduce costs, but these are not immediate and involve financial risks and uncertainties.
To address these technical and economic challenges, future research should focus on several areas:
  • Developing advanced forecasting and management systems: To manage the variability in wind and wave energy, advanced predictive models and real-time data management systems are essential. These systems can help optimize the operation of hybrid renewable energy systems and ensure a more stable energy supply for hydrogen production.
  • Pilot and demonstration projects: Implementing pilot projects that integrate wind, wave, and electrolysis technologies will provide valuable real-world data on system performance, durability, and economic viability. These projects can help validate models and assumptions used in studies like this and adapt strategies based on operational experiences.
  • Economic analysis including dynamic scenarios: Future studies should include dynamic economic analyses that account for fluctuations in technology costs, raw materials, and energy prices. Scenario-based planning can help identify robust strategies that can withstand a range of future economic conditions.
  • Long-term impact studies: To truly assess the sustainability and impact of integrating renewable energy for hydrogen production, long-term studies that track environmental, economic, and social impacts are necessary. These studies can provide a more comprehensive view of the benefits and challenges associated with such initiatives.
By tackling these technical and economic hurdles through targeted research and strategic investments, the integration of marine energies for sustainable hydrogen production can be optimized, ultimately contributing to a more resilient and sustainable energy infrastructure.

8. Conclusions

In summary, this research highlighted the potential of an innovative hybrid energy system combining wind energy and wave energy for hydrogen production through water electrolysis. This study specifically focused on six major Moroccan cities with significant potential in offshore renewable energies. The findings emphasize the importance of strategic planning and investments in renewable energy infrastructure, particularly in regions like Essaouira and El Jadida, where hydrogen production costs are comparatively low. The data illustrate the hydrogen production cost measured in euros per kilowatt (EUR/kW) in various cities of Morocco in 2022. Essaouira emerged as the city with the lowest hydrogen production cost at 16.78 EUR/kW, suggesting potentially favorable conditions for hydrogen-related initiatives in terms of economic viability. El Jadida and Casablanca closely followed, with respective costs of 17.85 EUR/kW and 18.78 EUR/kW, indicating similar levels of competitiveness in these regions. Agadir and Laâyoune had slightly higher costs compared to the previously mentioned cities, with values of 21 EUR/kW and 23.41 EUR/kW, respectively. In contrast, Larache appeared to have the highest hydrogen production cost among the listed cities, standing at 29.04 EUR/kW. This analysis also provided significant insights into the combined production of wind energy and wave energy, along with associated hydrogen generation, in the six studied Moroccan cities. Casablanca stands out for a harmonious balance between wave energy and wind energy, while Agadir is characterized by a strong dependence on wind energy. El Jadida, Essaouira, and Laâyoune also play crucial roles in sustainable hydrogen production. In conclusion, this study highlighted the potential of integrating renewable energies for hydrogen production in Morocco, while identifying challenges and opportunities in this field.

Author Contributions

K.T. investigation, writing—original draft, methodology, writing—review & editing, visualization; M.N. investigation, writing—original draft, methodology, writing—review & editing, visualization, conceptualization, supervision, validation; M.R. writing—original draft, methodology; M.T., A.F., K.H., V.M. and D.S., validation, project administration, resources. All authors have read and agreed to the published version of the manuscript.

Funding

This research received no external funding.

Data Availability Statement

No new data were created or analyzed in this study. Data sharing is not applicable to this article.

Conflicts of Interest

The authors declare no conflict of interest.

References

  1. Adeli, K.; Nachtane, M.; Faik, A.; Saifaoui, D.; Boulezhar, A. How Green Hydrogen and Ammonia Are Revolutionizing the Future of Energy Production: A Comprehensive Review of the Latest Developments and Future Prospects. Appl. Sci. 2023, 13, 8711. [Google Scholar] [CrossRef]
  2. Adeli, K.; Nachtane, M.; Faik, A.; Rachid, A.; Tarfaoui, M.; Saifaoui, D. A Deep Learning-Enhanced Framework for Sustainable Hydrogen Production from Solar and Wind Energy in the Moroccan Sahara: Coastal Regions Focus. Energy Convers. Manag. 2024, 302, 118084. [Google Scholar] [CrossRef]
  3. Global Hydrogen Review 2023—Analysis. Available online: https://www.iea.org/reports/global-hydrogen-review-2023 (accessed on 10 February 2024).
  4. Publications Office of the European Union. Hydrogen Roadmap Europe: A Sustainable Pathway for the European Energy Transition. Available online: https://op.europa.eu/en/publication-detail/-/publication/0817d60d-332f-11e9-8d04-01aa75ed71a1/language-en (accessed on 10 February 2024).
  5. Life Cycle Assessment of Hydrogen Energy Systems: A Review of Methodological Choices|Request PDF. Available online: https://www.researchgate.net/publication/304357784_Life_cycle_assessment_of_hydrogen_energy_systems_a_review_of_methodological_choices (accessed on 10 February 2024).
  6. Wave Energy to Reduce Green H2—Matching EU Hourly Rules 2023. Available online: https://corpowerocean.com/wave-energy-to-reduce-green-h2-matching-eu-hourly-rules/ (accessed on 10 January 2024).
  7. Wave Energy Spurs Green Hydrogen Production to Decarbonise Heavy Industry. 2023. Available online: https://corpowerocean.com/wave-energy-spurs-green-hydrogen-production-to-decarbonise-heavy-industry/ (accessed on 22 April 2024).
  8. Hassan, I.A.; Ramadan, H.S.; Saleh, M.A.; Hissel, D. Hydrogen Storage Technologies for Stationary and Mobile Applications: Review, Analysis and Perspectives. Renew. Sustain. Energy Rev. 2021, 149, 111311. [Google Scholar] [CrossRef]
  9. Lhyfe Completes a First Step in Its Work on Re-Oxygenating the Ocean. Lhyfe. Available online: https://www.lhyfe.com/press/lhyfe-completes-a-first-step-in-its-work-on-re-oxygenating-the-oceans-through-offshore-hydrogen-production/ (accessed on 22 April 2024).
  10. Pérez-Vigueras, M.; Sotelo-Boyás, R.; González-Huerta, R.D.G.; Bañuelos-Ruedas, F. Feasibility Analysis of Green Hydrogen Production from Oceanic Energy. Heliyon 2023, 9, e20046. [Google Scholar] [CrossRef]
  11. Alves, M. Hydrogen Energy: Terceira Island Demonstration Facility. CICEQ 2008, 14, 77–95. [Google Scholar] [CrossRef]
  12. Serna, Á.; Tadeo, F. Offshore Hydrogen Production from Wave Energy. Int. J. Hydrogen Energy 2014, 39, 1549–1557. [Google Scholar] [CrossRef]
  13. Calado, G.; Castro, R.; Pires, A.J.; Marques, M.J. Assessment of Hydrogen-Based Solutions Associated to Offshore Wind Farms: The Case of the Iberian Peninsula. Renew. Sustain. Energy Rev. 2024, 192, 114268. [Google Scholar] [CrossRef]
  14. Ngando Ebba, J.D.; Camara, M.B.; Doumbia, M.L.; Dakyo, B.; Song-Manguelle, J. Large-Scale Hydrogen Production Systems Using Marine Renewable Energies: State-of-the-Art. Energies 2024, 17, 130. [Google Scholar] [CrossRef]
  15. Tarfaoui, M.; Nachtane, M.; Amry, Y.; Moumen, A.E. From Renewable to Marine Energies Sources for Sustainable Development and Energy Transition in Morocco: Current Status and Scenario. Preprints 2018, 2018110568. [Google Scholar] [CrossRef]
  16. Nachtane, M. Énergies Marines Renouvelables et étude des Performances des Matériaux Composites: Cas d’une hydrolienne. Phdthesis, ENSTA Bretagne—École Nationale Supérieure de Techniques Avancées Bretagne; Université Hassan II: Casablanca, Maroc, 2019. [Google Scholar]
  17. Nachtane, M.; Tarfaoui, M.; Hilmi, K.; Saifaoui, D.; El Moumen, A. Assessment of Energy Production Potential from Tidal Stream Currents in Morocco. Energies 2018, 11, 1065. [Google Scholar] [CrossRef]
  18. Prediccion de Oleaje, Nivel Del Mar; Boyas y Mareografos|Puertos.Es. Available online: https://www.puertos.es/es-es/oceanografia/Paginas/portus.aspx (accessed on 13 December 2023).
  19. Zamani, A.; Solomatine, D.; Azimian, A.; Heemink, A. Learning from data for wind–wave forecasting. Ocean. Eng. 2008, 35, 953–962. [Google Scholar] [CrossRef]
  20. Rajabi, M.; Ghorbani, H.; Aghdam, K.Y. Prediction of shear wave velocity by extreme learning machine technique from well log data. J. Pet. Geomech. 2022, 4, 35–49. [Google Scholar]
  21. Yu, X.; Shi, S.; Xu, L.; Liu, Y.; Miao, Q.; Sun, M. A novel method for sea surface temperature prediction based on deep learning. Math. Probl. Eng. 2020, 2020, 1–9. [Google Scholar] [CrossRef]
  22. Gómez Lahoz, M.; Carretero Albiach, J.C. Wave Forecasting at the Spanish Coasts. J. Atmos. Ocean Sci. 2005, 10, 389–405. [Google Scholar] [CrossRef]
  23. Juan, N.P.; Rodríguez, J.O.; Valdecantos, V.N. Comparison of the SIMAR-WANA, ERA-5, and Waverys Databases for Maritime Climate Estimations and the Implications of Coastal Protection Structures. J. Waterw. Port Coast. Ocean. Eng. 2024, 150, 04023021. [Google Scholar] [CrossRef]
  24. Bardal, L.M.; Sætran, L.R. Wind gust factors in a coastal wind climate. Energy Procedia 2016, 94, 417–424. [Google Scholar] [CrossRef]
  25. Bataineh, K.M.; Dalalah, D. Assessment of Wind Energy Potential for Selected Areas in Jordan. Renew. Energy 2013, 59, 75–81. [Google Scholar] [CrossRef]
  26. Shata, A.A.; Hanitsch, R. The Potential of Electricity Generation on the East Coast of Red Sea in Egypt. Renew. Energy 2006, 31, 1597–1615. [Google Scholar] [CrossRef]
  27. Yaramasu, V.; Wu, B. Model Predictive Control of Wind Energy Conversion Systems; John Wiley & Sons: Hoboken, NJ, USA, 2016. [Google Scholar]
  28. Guarienti, J.A.; Almeida, A.K.; Neto, A.M.; de Oliveira Ferreira, A.R.; Ottonelli, J.P.; de Almeida, I.K. Performance Analysis of Numerical Methods for Determining Weibull Distribution Parameters Applied to Wind Speed in Mato Grosso Do Sul, Brazil. Sustain. Energy Technol. Assess. 2020, 42, 100854. [Google Scholar] [CrossRef]
  29. Bidaoui, H.; Abbassi, I.E.; Bouardi, A.E.; Darcherif, A. Wind Speed Data Analysis Using Weibull and Rayleigh Distribution Functions, Case Study: Five Cities Northern Morocco. Procedia Manuf. 2019, 32, 786–793. [Google Scholar] [CrossRef]
  30. Gaertner, E.; Rinker, J.; Sethuraman, L.; Zahle, F.; Anderson, B.; Barter, G.E.; Viselli, A. IEA Wind TCP Task 37: Definition of the IEA 15-Megawatt Offshore Reference Wind Turbine (No. NREL/TP-5000-75698); National Renewable Energy Lab. (NREL): Golden, CO, USA, 2020. [Google Scholar]
  31. Başaran, H.H.; Tarhan, İ. Investigation of Offshore Wind Characteristics for the Northwest of Türkiye Region by Using Multi-Criteria Decision-Making Method (MOORA). Results Eng. 2022, 16, 100757. [Google Scholar] [CrossRef]
  32. Akdağ, O. The Operation and Applicability to Hydrogen Fuel Technology of Green Hydrogen Production by Water Electrolysis Using Offshore Wind Power. J. Clean. Prod. 2023, 425, 138863. [Google Scholar] [CrossRef]
  33. Sierra, J.P.; Martín, C.; Mösso, C.; Mestres, M.; Jebbad, R. Wave Energy Potential along the Atlantic Coast of Morocco. Renew. Energy 2016, 96, 20–32. [Google Scholar] [CrossRef]
  34. Carballo, R.; Iglesias, G. A Methodology to Determine the Power Performance of Wave Energy Converters at a Particular Coastal Location. Energy Convers. Manag. 2012, 61, 8–18. [Google Scholar] [CrossRef]
  35. Groenemans, H.; Saur, G.; Mittelsteadt, C.; Lattimer, J.; Xu, H. Techno-Economic Analysis of Offshore Wind PEM Water Electrolysis for H2 Production. Curr. Opin. Chem. Eng. 2022, 37, 100828. [Google Scholar] [CrossRef]
  36. Mansilla, C.; Louyrette, J.; Albou, S.; Bourasseau, C.; Dautremont, S. Economic Competitiveness of Off-Peak Hydrogen Production Today—A European Comparison. Energy 2013, 55, 996–1001. [Google Scholar] [CrossRef]
  37. Siracusano, S.; Baglio, V.; Briguglio, N.; Brunaccini, G.; Di Blasi, A.; Stassi, A.; Ornelas, R.; Trifoni, E.; Antonucci, V.; Aricò, A.S. An Electrochemical Study of a PEM Stack for Water Electrolysis. Int. J. Hydrogen Energy 2012, 37, 1939–1946. [Google Scholar] [CrossRef]
  38. Di Blasi, A.; Andaloro, L.; Siracusano, S.; Briguglio, N.; Brunaccini, G.; Stassi, A.; Aricò, A.S.; Antonucci, V. Evaluation of Materials and Components Degradation of a PEM Electrolyzer for Marine Applications. Int. J. Hydrogen Energy 2013, 38, 7612–7615. [Google Scholar] [CrossRef]
  39. Millet, P.; Dragoe, D.; Grigoriev, S.; Fateev, V.; Etievant, C. GenHyPEM: A Research Program on PEM Water Electrolysis Supported by the European Commission. Int. J. Hydrogen Energy 2009, 34, 4974–4982. [Google Scholar] [CrossRef]
  40. Nasser, M.; Megahed, T.F.; Ookawara, S.; Hassan, H. Techno-Economic Assessment of Clean Hydrogen Production and Storage Using Hybrid Renewable Energy System of PV/Wind under Different Climatic Conditions. Sustain. Energy Technol. Assess. 2022, 52, 102195. [Google Scholar] [CrossRef]
  41. Egeland-Eriksen, T.; Jensen, J.F.; Ulleberg, Ø.; Sartori, S. Simulating Offshore Hydrogen Production via PEM Electrolysis Using Real Power Production Data from a 2.3 MW Floating Offshore Wind Turbine. Int. J. Hydrogen Energy 2023, 48, 28712–28732. [Google Scholar] [CrossRef]
  42. Nasser, M.; Megahed, T.; Ookawara, S.; Hassan, H. Techno-Economic Assessment of Green Hydrogen Production Using Different Configurations of Wind Turbines and PV Panels. JES 2022, 6, 560–572. [Google Scholar] [CrossRef]
  43. Zainal, B.S.; Ker, P.J.; Mohamed, H.; Ong, H.C.; Fattah, I.M.; Rahman, S.A.; Nghiem, L.D.; Mahlia, T.I. Recent advancement and assessment of green hydrogen production technologies. Renew. Sustain. Energy Rev. 2024, 189, 113941. [Google Scholar] [CrossRef]
  44. Astariz, S.; Iglesias, G. The economics of wave energy: A review. Renew. Sustain. Energy Rev. 2015, 45, 397–408. [Google Scholar] [CrossRef]
  45. Ueckerdt, F.; Verpoort, P.C.; Anantharaman, R.; Bauer, C.; Beck, F.; Longden, T.; Roussanaly, S. On the cost competitiveness of blue and green hydrogen. Joule 2024, 8, 104–128. [Google Scholar] [CrossRef]
  46. Europe’s Onshore and Offshore Wind Energy Potential—European Environment Agency. Available online: https://www.eea.europa.eu/publications/europes-onshore-and-offshore-wind-energy-potential (accessed on 6 February 2024).
Figure 1. Map of the Moroccan coast indicating the locations of the six studied cities.
Jmse 12 00774 g001
Figure 2. Diagram illustrating the production of green hydrogen using renewable resources from wind and ocean waves.
Jmse 12 00774 g002
Figure 3. Values of the mean H s (a) and T e (b) at the six cities, respectively.
Jmse 12 00774 g003
Figure 4. Wind rose of the wind speed at six cities, respectively.
Jmse 12 00774 g004aJmse 12 00774 g004b
Figure 5. Flowchart for the MATLAB program.
Jmse 12 00774 g005
Figure 6. Water consumption in six cities.
Jmse 12 00774 g006
Figure 7. Power output per years of six cities.
Jmse 12 00774 g007
Figure 8. Hydrogen output per years of six cities.
Jmse 12 00774 g008
Figure 9. Power and hydrogen generation in six Moroccan cities.
Jmse 12 00774 g009
Figure 10. Annual overall system efficiency.
Jmse 12 00774 g010
Figure 11. Annual costs of hydrogen production for six cities.
Jmse 12 00774 g011
Table 1. Geographical coordinates.
CitiesLongitude (W)Latitude (N)
Larache6°50′35°00′
Casablanca8°50′33°50′
El jadida9°00′33°50′
Essaouira10°50′31°50′
Agadir10°50′30°50′
Laayoune13°50′27°25′
Table 2. The different stages of the data collection and management process from the Puertos website.
1
  • Initialization of the data collection process.
2
  • Accessing the Puertos website and navigation to find specific datasets
3
  • Extraction of wind and wave datasets, and downloading SIMAR-44 and WANA data for the period from 2017 to 2022.
4
  • Data analysis to extract necessary parameters and separation of wind and wave data into distinct categories.
5
  • Quality and integrity check of the data, handling of any inconsistencies.
6
  • Organization of collected data into structured formats and storage in a dedicated database.
7
  • Addition of metadata to identify datasets and inclusion of information such as data source and collection period.
8
  • Integration of collected data into existing systems and ensuring compatibility with analysis tools.
9
  • Documentation of data collection and management procedures, providing information on data structure and format.
Table 3. Technical properties of the offshore wind system [30].
ParameterValueUnits
Power rating (Pr)15MW
Cut-in wind speed (Vcut-in)3m/s
Rated wind speed (Vr)10.59m/s
Cut-out wind speed (Vcut-out)25m/s
Rotor diameter (D)240M
Table 4. Wave power and wind power in different cities.
CityCasablancaAgadirEl JadidaEssaouiraLaracheLaayoune
Wave Power (kW)9439.054008.5010,348.0810,028.801985.692951.09
Wind Power (kW)11,797.6015,924.2712,422.5714,680.9812,281.2512,811.74
Table 5. Hydrogen production from wave and wind power in different cities.
CityCasablancaAgadirEl JadidaEssaouiraLaracheLaayoune
Wave H2 (tonnes)101.3143.02111.06107.6421.3131.67
Wind H2 (tonnes)126.62170.91133.33157.57131.81137.51
Table 6. Total power output and total hydrogen production in different cities.
CityCasablancaAgadirEl JadidaEssaouiraLaracheLaayoune
Total Power (kW)21,236.6519,932.7722,770.6524,709.7814,266.9415,762.83
Total H2 (tonnes)227.93213.93244.39265.20153.12169.18
Table 8. State and future prospects of PEM electrolyzer technology [43].
ParameterRange/Value
Electrical current intensity1–2 A/cm²
Operating temperature50–80 °C
System electric efficiency50–83 kWh/kg (H2)
Stack electric efficiency47–66 kWh/kg (H2)
Voltage limits1.4–2.5V (range)
Pressure at the cell levelBelow 30 bar
Hydrogen purity99.9%
Efficiency of voltage50–68%
System lifetime50,000–80,000 h (range)
Electrode surface area1500 cm²
System capital costUSD 700–1400 per kW (range)
System stack costUSD 400/kW
Disclaimer/Publisher’s Note: The statements, opinions and data contained in all publications are solely those of the individual author(s) and contributor(s) and not of MDPI and/or the editor(s). MDPI and/or the editor(s) disclaim responsibility for any injury to people or property resulting from any ideas, methods, instructions or products referred to in the content.

