Article

Production of Polyphenolic Natural Products by Bract-Derived Tissue Cultures of Three Medicinal Tilia spp.: A Comparative Untargeted Metabolomics Study

1
Department of Botany, Division of Pharmacognosy, University of Debrecen, Egyetem tér 1, 4032 Debrecen, Hungary
2
Healthcare Industry Institute, University of Debrecen, Egyetem tér 1, 4032 Debrecen, Hungary
3
Agricultural and Molecular Research and Service Institute, University of Nyíregyháza, Sóstói út 31/b, 4400 Nyíregyháza, Hungary
4
Doctoral School of Pharmaceutical Sciences, University of Debrecen, Egyetem tér 1, 4032 Debrecen, Hungary
5
Balaton Limnological Research Institute, HUN-REN (Hungarian Research Network), Klebelsberg K. u. 3, 8237 Tihany, Hungary
*
Author to whom correspondence should be addressed.
Plants 2024, 13(10), 1288; https://doi.org/10.3390/plants13101288
Submission received: 27 March 2024 / Revised: 23 April 2024 / Accepted: 30 April 2024 / Published: 7 May 2024
(This article belongs to the Special Issue Plant Tissue Culture and Secondary Metabolites)

Abstract

:
Medicinal plant tissue cultures are potential sources of bioactive compounds. In this study, we report the chemical characterization of the callus cultures of three medicinal Tilia spp. (Tilia cordata, Tilia vulgaris and Tilia tomentosa), along with the comparison to bracts and flowers of the same species. Our aim was to show that calli of Tilia spp. are good alternatives to the calli of T. americana for the production of polyphenols and are better sources of a subset of polyphenolic metabolites, compared to the original organs. Calli were initiated from young bracts and grown on woody plant medium containing 1 mg L−1 2,4-D and 0.1 mg L−1 BAP. For chemical characterization, a quality-controlled untargeted metabolomics approach and the quantification of several bioactive compounds was performed with the use of LC-ESI-MS/MS. While bracts and flowers contained flavonoid glycosides (astragalin, isoquercitrin) as major polyphenols, calli of all species contained catechins, coumarins (fraxin, esculin and scopoletin) and flavane aglyca. T. tomentosa calli contained 5397 µg g DW−1 catechin, 201 µg g DW−1 esculin, 218 µg g DW−1 taxifolin and 273 µg g DW−1 eriodictyol, while calli from other species contained lower amounts. T. cordata and T. tomentosa flowers were rich in isoquercitrin, containing 8134 and 6385 µg g DW−1, respectively. The currently tested species contained many of the bioactive metabolites described from T. americana. The production of catechin was shown to be comparable to the most efficient tissue cultures reported. Flowers and bracts contained flavonoid glycosides, including tiliroside, resembling bioactive fractions of T. americana. In addition, untargeted metabolomics has shown fingerprint-like differences among species, highlighting possible chemotaxonomic and quality control applications, especially for bracts.

1. Introduction

Plant tissue cultures are initiated from young explants of plant tissues and have a variety of possible applications, including micropropagation and conservation of endangered species. Regarding tissue cultures of medicinal plants, one of the most frequently cited applications is their potential use in the production of specialized metabolites. Essentially, plant tissue cultures are generally considered alternative sources of bioactive compounds for pharmaceutical, cosmetic and dietary applications [1].
The first step in establishing tissue cultures typically involves the generation of callus—an undifferentiated mass of cells—using a balanced ratio of auxins and cytokinins [2]. Calli can be initiated from a wide variety of young tissues, although bracts, which are modified leaves associated with reproductive organs, have been infrequently used as explants in previous studies [3,4,5]. Since the hormones required for sustaining stable growth interfere with the biosynthesis and accumulation of specialized metabolites [6,7], comparative studies on tissue cultures and organs of whole plants can yield interesting results. In particular, the chemical pattern of calli can be markedly different from that of the organs of wild plants [8,9,10]. Although the specialized metabolite production of these tissue cultures can be increased via modulation of the medium composition or elicitation [11,12,13], the pattern of metabolites is primarily dictated by the tissue type.
The current study aimed to characterize the specialized metabolites of the tissue cultures of three medicinal Tilia spp. and compare them to the inflorescences gathered from trees growing under natural conditions. The inflorescence of Tilia species, typically harvested with the bracts, is commonly referred to as “lime flower”, “linden flower” or “Tiliae flos” in the phytomedical literature. Its traditional use in Eastern and Mediterranean Europe spans millennia [14,15]. Notably, T. cordata and T. platyphyllos are among the most popular components of herbal teas in Russia [16], reflecting their widespread use across Eurasia as a traditional herbal remedy, as well as a tea substitute or recreational beverage. The genus also includes a plant with promising anxiolytic properties: the Mexican T. americana L. is traditionally used to alleviate insomnia and related conditions. While positive in vivo results for T. tomentosa and T. americana regarding this indication have been reported in the literature [17], clinical trials on extracts of Tilia spp. remain absent.
The bioactive constituents likely responsible for these effects belong to polyphenolics of the phenylpropanoid (shikimate) pathway. The inflorescences contain high amounts of flavonoids (mostly in glycosidic form), catechins ((+)-catechin, (−)-epicatechin, procyanidin oligomers) and other phenylpropanoids (such as coumarins and cinnamic acid derivatives), as well as polysaccharides and essential oil [14,18,19,20,21]. However, chemical characterization of the tissue cultures within this genus remains relatively limited. Only a few reports have provided data on T. americana tissue cultures containing coumarins or flavonoids [22,23].
The aim of this study was the chemical characterization of the tissue cultures of medicinal Tilia species prevalent in the western part of Eurasia. As reference materials, bracts and flowers of the same species were characterized. The primary objectives were to show that (1) calli of Tilia spp. serve as viable alternatives to the more extensively studied tissue cultures of T. americana and (2) calli of Tilia spp. are better sources of a specific subset of polyphenolic metabolites compared to the original organs. The method of choice for chemical characterization was a combination of quality-controlled untargeted metabolomics and quantification of compounds thought to be responsible for the anxiolytic activity of T. americana. Both approaches were carried out using LC-ESI-MS.

2. Results

2.1. Tissue Culture Performance

At the typical density of seven explants per Petri dish (9 cm diameter), the used calli lines of T. vulgaris, T. tomentosa and T. cordata yielded 0.275 ± 0.042 g DW, 0.152 ± 0.053 g DW and 0.238 ± 0.124 g DW biomass at the end of the 28-day culture period.

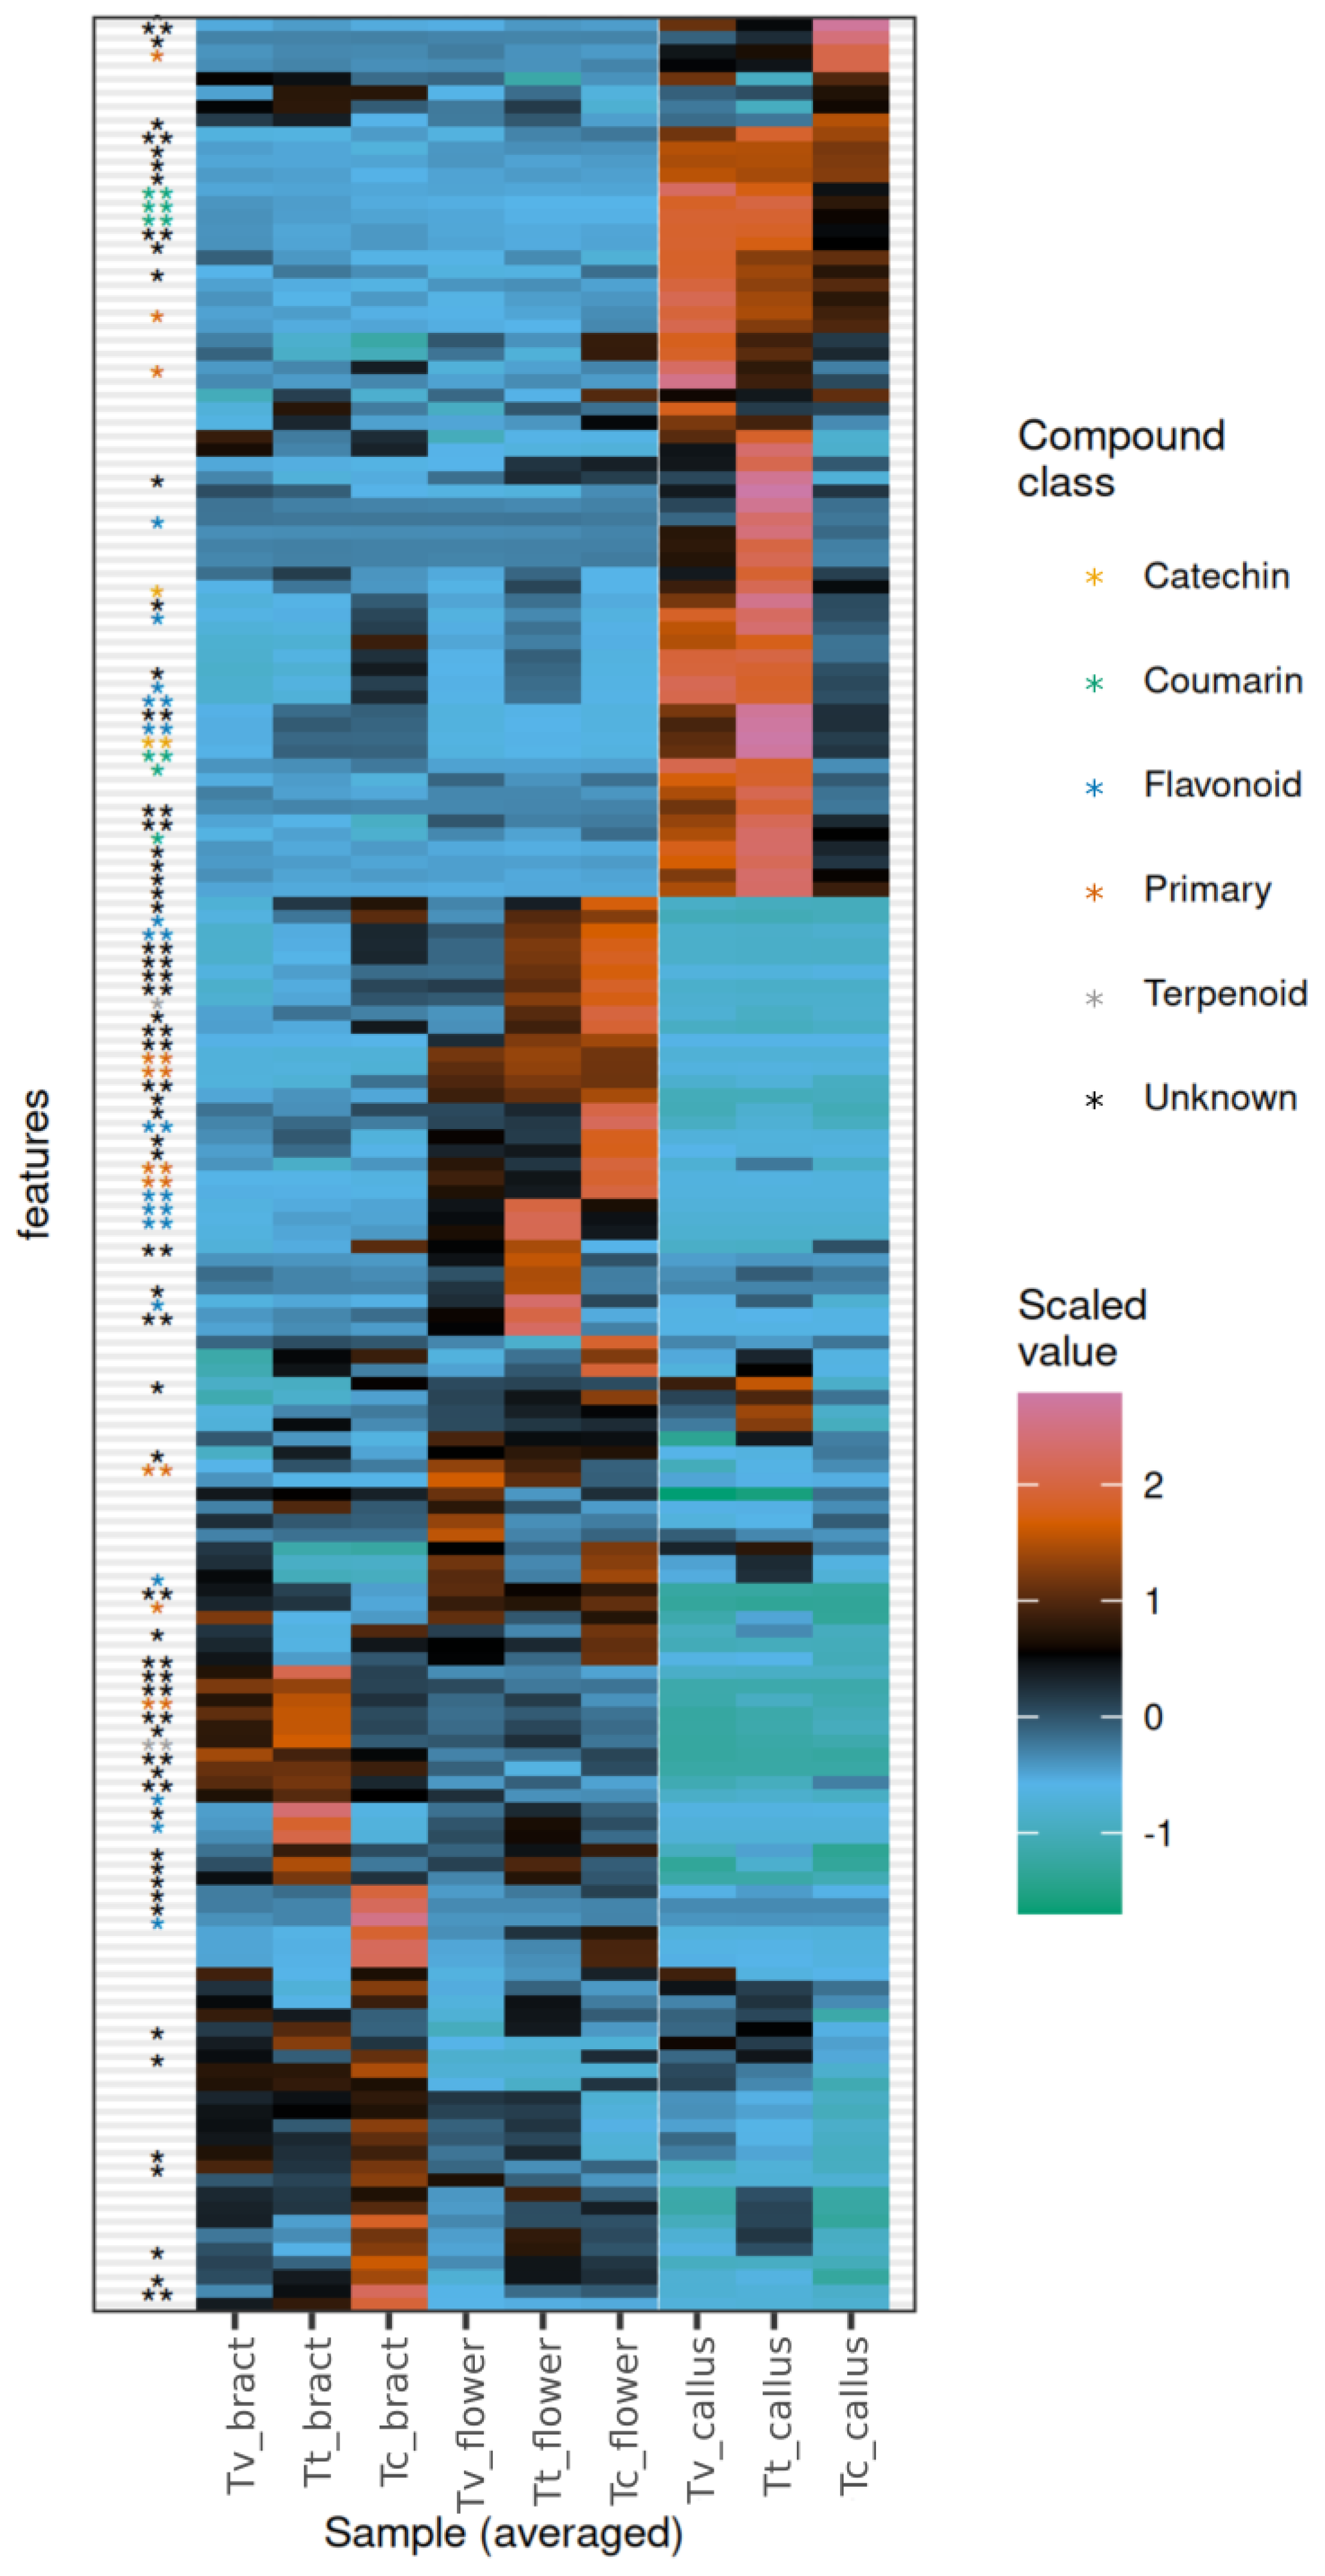
2.2. Specialized Metabolites of Tissue Cultures and Organs of Tilia spp.

A set of specialized metabolites were tentatively identified to level “B” identification (Table 1) [24]. Several of these compounds (marked with Id. level “A” in Table 1) were successfully quantified using authentic standards after calibration and showing proper accuracy (Table S1).
The untargeted and subsequent targeted data-dependent MS/MS analyses resulted in 95 and 50 MS/MS consensus spectra, respectively, of which 39 and 16 were successfully annotated. Altogether, 55 and 68 compounds were annotated with >0.8 probability at the natural product class level and natural product pathway level, respectively (Table S2).

2.3. Chemical Differences between Tissue Types and Tilia Species

The combined positive and negative ion mode datasets from untargeted metabolomics contained 167 features after the application of quality control filters. The differences observed between tissue types surpassed those observed within a single tissue type across species (Figure 1, Figure 2 and Figure S1). This was well supported by the significant differences in the principal components (PCs) between observation groups. PC1–4 together covered 38.54% of the variance of the dataset. PC1 and PC2 were significantly different among tissue types (Scheirer—Ray—Hare test, p = 7.94 × 10⁻⁵ and 0.00004, respectively), but not between species. PC4 was significantly different between species (p = 0.000326). Also, the species–tissue type interaction term was found to be significant for PC3 (p = 0.00274). Regarding individual features, a set of 98 features exhibited significant differences across tissue types (Table S2), with a false discovery rate (FDR) of 0.05. Flowers, bracts and calli exhibited distinct subsets of abundant features irrespective of species (Figure 2). However, upon closer examination, it becomes evident that all tissues from different species display a unique pattern of metabolites. The uniqueness of these patterns is especially apparent in the case of bracts (Figure 2), where several features are exclusive to a single species.

2.4. Coumarins

Coumarins were relatively abundant in T. vulgaris and T. tomentosa calli, while they were present only in low to moderate amounts in other tested plant organs (Figure 3a–c and Figure S2a,b). Esculin was present in 191 and 201 µg g DW−1 in T. vulgaris and T. tomentosa calli, respectively, while bracts and flowers showed amounts ranging only from 16 to 26 µg g DW−1 (Figure 3c). A similar pattern was observed for scopoletin and fraxin (Figure 3a,b), as well as a methyl esculetin derivative (Figure S2b) and a putative scolopetin-O-hexoside (Figure S2a). The calli of T. tomentosa and T. vulgaris contained higher levels of coumarins than the calli of T. cordata (Figure 3a–c and Figure S2a,b). Overall, the six putative coumarins were present at 5.04–19.64-fold higher abundance in calli compared to bracts of the respective species (median values). Five of these compounds exhibited significant differences between organs (padj < 0.05, Kruskal–Wallis test).

2.5. Catechin Derivatives

Catechin derivatives emerged as another characteristic compound group in calli; however, the raw abundance data showed a mixed distribution among sample types. Catechin was an abundant member of this group, with concentrations ranging from 1667 to 5937 µg g DW−1 in the calli of various species (Figure 3e). This is 13.36- to 32.37-fold and 1.58- to 9.61-fold more than the amount found in flowers and bracts of the respective species, respectively. Another compound with an identical MS/MS spectrum (possibly epicatechin) displayed a similar pattern across the dataset, whereas two oligomeric catechins (putative proanthocyanidins) and a putative gallocatechin demonstrated much less variability. In these cases, calli and other tissues showed comparable levels of these compounds (Figure S2c,d).
Differences were also observed among the tested species. While T. tomentosa and T. vulgaris calli were rich in catechin-like compounds, T. cordata calli contained roughly the same amounts as the bracts. Specifically, in T. tomentosa and T. vulgaris, a median 8.67-fold and 11.26-fold higher abundance was shown compared to the bracts, respectively, whereas T. cordata showed a median fold change of only 0.96 (n = 9 putative catechin derivatives from untargeted screening). Gallocatechin was detected only in trace amounts in T. cordata flowers.

2.6. Flavonoid Glycosides

Flavonoid glycosides were present in relatively low amounts in the calli of Tilia spp. (Figure 3d,f–i and Figure S2e), despite these compounds being chief constituents of medicinal Tilia flowers and bracts. In the untargeted metabolomics dataset examined by CANOPUS, nine features appeared as flavonoids with >0.9 probability. The most probable level 5 ClassyFire class for most of these compounds was “flavonoid-O-glycosides”. These compounds behaved similarly: in the flowers of T. cordata, T. tomentosa and T. vulgaris, flavonoid glycosides were detected at 70.81-fold, 42.00-fold and 34.61-fold higher abundances, respectively, compared to calli (median values).
Flowers and bracts contained high amounts of isoquercitrin (=quercetin-3-O-glucoside) and astragalin (=kaempferol-3-O-glucoside), ranging from 1673 to 8134 µg g DW−1 and 1183 to 4400 µg g DW−1, respectively, depending on species (Figure 3d,f). Calli contained 19.41- to 66.08-fold less flavonoids than the flowers of their respective species for the three studied Tilia spp. (median of fold-change compounds, n = 13). Nonetheless, the tested calli still contained 6.07- to 7.20-fold higher levels of quercetin-3-O-glucoside than previously reported for the cell suspensions of T. americana [23].
Tiliroside (Figure 3i), a special phenylpropanoid conjugate of a kaempferol glycoside (kaempferol-3-β-D-(6″-p-coumaroyl-glucopyranoside)), was undetectable in the calli. In our dataset, the comparison of abundances to the similar isoquercitrin (quantified with an authentic standard) suggests that tiliroside is a relatively minor compound, with the exception of T. tomentosa bracts. Another kaempferol glycoside, a kaempferol-O-pentoside, was also biosynthesized in calli. However, only trace amounts were detected compared to flowers (Figure 3g).
Additionally, a luteolin-O-deoxyhexose was found in substantial amounts in T. tomentosa and T. vulgaris flowers, and to a much lesser extent in bracts, but none of the calli biosynthesized comparable amounts (Figure S2e).

2.7. Flavonoid Aglyca

Two flavonol aglyca with a wide distribution among plants are quercetin and kaempferol. These were found to be minor constituents compared to glycosides in all organs and showed no major variability between organs or species (Figure S2f,g). The concentration range for kaempferol and quercetin in natural tissues ranged from 12.84 to 36.03 µg g DW−1 and 16.17–40.79 µg g DW−1, respectively. Calli contained the same orders of magnitude of these compounds, with no significant difference observed between organs.
In contrast, the flavane aglycon eriodictyol and the flavanol aglycon taxifolin exhibited accumulation patterns similar to that of catechin, which also has a saturated C ring. In particular, T. tomentosa and T. vulgaris calli accumulated significant amounts of these compounds, while other tissues did not. Compared to other tissues of the respective species, T. tomentosa calli contained 16.6- to 19.2-fold more eriodictyol and 23.9- to 24.4-fold more taxifolin, while T. vulgaris calli contained 8.54- to 8.56-fold more eriodictyol and 10.0- to 12.8-fold more taxifolin. T. tomentosa calli accumulated most of the above compounds, with flavonoid concentrations ranging from 218 to 273 µg g DW−1.

3. Discussion

3.1. Coumarins from Organs and Tissue Cultures of Tilia spp.

Coumarins have previously been reported in various organs of trees in the genus Tilia. In this study, these compounds were identified based on MS/MS data of the published literature [25,26,27]. Fraxin, for instance, has been documented in the trunks of T. amurensis [32], the bracts of T. platyphyllos [21] and the tissue cultures of T. americana [33]. Similarly, scopoletin has been detected in the flowers of T. cordata, the trunks and bark of T. amurensis [32,34,35] and in tissue cultures of T. americana [33,36].
The current study has shown that 85–201 µg g DW−1 esculin and 22–64 µg g DW−1 scopoletin is present in calli (Figure 3a,c), while bracts and flowers are characterized by lower concentrations. One of our key objectives was to compare the tissue cultures to those of the anxiolytic T. americana. Unfortunately, available data for quantification of bioactives in calli and cell suspension cultures of T. americana were limited to data on scopoletin content [33,36]. Importantly, the amount of scopoletin in the calli of T. tomentosa and T. vulgaris was 2.22-fold and 1.71-fold higher, respectively, than that reported for a copper-elicited T. americana cell suspension [36]. Other coumarins such as esculin were present at more than 6-fold concentrations, indicating that tissue cultures of common medicinal Tilia spp., especially those of T. tomentosa, could serve as better sources of coumarins than tissue cultures of T. americana. It is important to note that the values presented in this study are before further optimization for the production of bioactive compounds.
Several studies have come to a conclusion supporting our findings, namely that some in vitro tissue cultures can generate significantly more coumarins than the intact plants [37,38]. However, when comparing our results to the most efficient coumarin-producing tissue cultures reported in the literature, the productivity of Tilia calli cannot be considered exceptional. For instance, under optimized conditions, calli of Operculina turpethum (L.) Silva Manso were reported to contain 5.3 ± 0.01 mg g−1 DW of coumarin [39]. Similar concentrations of scopoletin were observed in calli of Solanum virginianum L. (syn. Solanum xanthocarpum Schrad) [40,41] and Eclipta prostrata (L.) L. (syn. Eclipta alba (L.) Hassk.) [42]. It is worth noting that cultures with similar biosynthetic capacity have also been documented. For example, calli of Ruta chalepensis L. accumulated psoralen (370.12 ± 10.6 µg g−1 DW), along with lesser amounts of umbelliferone and xanthotoxin [43]. Similarly, the embryogenic calli of Abutilon indicum (L.) Sweet contained 99.20 ± 0.97 and 61.03 ± 0.47 μg g−1 FW scopoletin and scoparone [37].

3.2. Catechin Derivatives from Organs and Tissue Cultures of Tilia spp.

The compounds identified in this study included catechin, which was previously documented in Tilia inflorescences [20]. The high rate of catechin biosynthesis is also present in the original tissue from which calli are initiated: very young bract tissues of Tilia platyphyllos exhibit very high catechin content [21]. Interestingly, although catechins are present in even higher amounts compared to coumarins in Tilia calli, previous characterization of T. americana tissue cultures did not report any catechin-like compounds [23,33,36].
When compared to catechin-producing tissue cultures of other species, a surprising conclusion can be drawn: Tilia calli are among the most efficient in vitro producers of catechin reported to date. In the calli of the current study, 1667–5937 µg g DW−1 catechin was detected, which is significantly higher than the catechin content of most cell suspension cultures and calli reported for a variety of genera [8,44,45,46,47,48]. It must also be noted that the above studies mostly reported optimized production conditions. Only a few comparatively effective tissue cultures were reported: the same order of magnitude was observed for the elicited calli of Thymus daenensis Čelak. (1.99 mg g−1 DW) [49], the elicited calli of Hypericum triquetrifolium Turra (1.26–1.48 mg g DW−1 epicatechin) [50] and the calli of the best-known medicinal plant containing catechins, Camellia sinensis (L.) Kuntze, which contained approximately 4, 8 and 28 mg g DW−1 epicatechin, catechin and epigallocatechin, respectively [51]. Altogether, Tilia calli can be considered competitive alternatives to other calli in the production of catechins.
In contrast to our findings, two studies reported much higher catechin content in organs of wild plants compared to that in tissue cultures: a 4.8- to 18.5-fold advantage was found in Clinacanthus nutans (Burm.f.) Lindau [8], while a striking 11,930-fold difference was found in Hypericum perforatum L. [9]. This contrast highlights the importance of independently testing various genera.

3.3. Flavonoid Glycosides from Organs and Tissue Cultures of Tilia spp.

We detected several flavonoids and their glycosides that have been previously found in various Tilia spp. [20,28,52,53]. Flavonoid glycosides are the chief constituents of the inflorescences of medicinal Tilia spp., exemplified by the high values for individual flavonoids in our dataset (Figure 3d,f). Nevertheless, the overall perspective shows a mostly downregulated flavonoid glycoside biosynthetic pathway in calli (Figure 2, Figure 3d,f–i and Figure S1e) compared to flowers and bracts, with individual flavonoid glycosides being present at a maximum of about 480 µg g DW−1 (Figure 3d,f–i and Table S3). This observation is comparable to data on other tissue cultures capable of producing flavonoid glycosides. For instance, a cell suspension culture of Orostachys cartilaginea Boriss. accumulated 608.8 μg g DW−1 quercetin 3-O-glucoside and 2229.4 μg g DW−1 kaempferol-3-rutinoside under optimal aeration conditions in a bioreactor [54]. Another study reported that adventitious root cultures of Valeriana jatamansi Jones ex Roxb. accumulated 451.85 µg g DW−1 total phenolic compounds, predominantly composed of kaempferol and rutin [55]. Rutin was also described in elicited cell suspension cultures of Momordica charantia L. at a concentration of 352 μg g DW−1 [56].
The downregulation of flavonoid glycoside biosynthesis is supported by data on T. americana [23,33,36]. In another study on cotton [57], where tissue cultures of various stages of differentiation were assessed for flavonoids, an upregulated flavonoid biosynthesis was observed during embryogenesis. Altogether, the level of differentiation may be a key contributor to the downregulated biosynthesis of flavonoid glycosides.
A deeper insight can be obtained from comparative studies in which both tissue cultures and organs of wild plants were examined. These studies have yielded mixed results, underscoring the need for empirical, case-by-case studies. Two contrasting examples shall serve to highlight this variability. In the case of Petroselinum crispum (Mill.) Fuss, cell suspensions accumulated apigenin and kaempferol at 0.01 and 0.02 mg g DW−1, while embryogenic cultures produced 0.32 and 0.2 mg g DW−1 of the same compounds. However, these values were dwarfed by the levels detected in the leaves: 1.8 and 1.0 mg g DW−1, respectively [10]. Conversely, a study on Clinacanthus nutans (Burm.f.) Lindau found comparable levels of luteolin and kaempferol between suspension cells and one of the tested organs [8].
One of the most important flavonoid glycosides in Tilia is tiliroside, since it is thought to contribute to the anxiolytic activity of T. americana extracts [58] and is biosynthesized by only a few genera. Interestingly, studies have yielded conflicting findings regarding the biosynthesis of tiliroside in Tilia tissue cultures. Tiliroside was described in T. americana calli at levels comparable to those found in leaves, but only in calli derived from apical buds; calli from other tested explants contained no tiliroside [23]. Another study on T. americana var. mexicana showed that tiliroside is not produced in in vitro cultures [36]. This finding is reinforced by another report [33], in which preparative purification of the extracts T. americana calli only yielded coumarins, triterpenes and a flavonoid glycoside. This inconsistency in tiliroside biosynthesis in Tilia tissue cultures may be the result of high strain-to-strain variability. Only two reports have documented biosynthesis of tiliroside in tissue cultures from other genera: Calli of Chorisia spp. [59] and Paratecoma peroba (Record) Kuhlm [60]. The former reported values around 0.547 mg g DW−1. Altogether, while Tilia tissue cultures do not seem to be potential sources of tiliroside, further investigation of T. tomentosa bracts is certainly warranted, given their potential as candidates for testing anxiolytic activity.

3.4. Flavonoid Aglyca from Organs and Tissue Cultures of Tilia spp.

Quercetin and kaempferol also likely contribute to the anxiolytic activity of T. americana [58]. However, given their low levels in all organs tested in this study, their significance should not be overestimated. Moreover, several tissue cultures with much higher levels of these compounds have been reported in the literature. For instance, in vitro callus cultures of Lepidium sativum L. were found to contain 22.08 mg g DW−1 quercetin and 7.77 mg g DW−1 kaempferol under optimized conditions in a study testing various light conditions [61]. In another study, 6.19 mg g−1 DW quercetin and 5.48 mg g−1 DW kaempferol were produced by the calli of Ipomoea turbinata Lagasca under optimized conditions with thidiazuron–elicitation [62]. These findings obviously render Tilia calli less competitive as potential industrial producers of widely known flavonoid aglyca.
On the other hand, significantly less data are available on less common flavonoids with a saturated C-ring, such as eriodictyol and taxifolin, which were identified in our dataset. Our measurements indicated that T. tomentosa calli accumulated 273 and 218 µg g DW−1 of these compounds on average, respectively (Figure S2h,i). Concerning taxifolin production, the potency of calli from Tilia spp. were comparable to that of the suspension cultures of Cascabela thevetia (L.) Lippold (syn. Thevetia peruviana K.Schum.) [63] but fell short of the tissue cultures of Larix gmelinii var. olgensis Ostenf. & Syrach (syn. Larix olgensis A. Henry), which produced 4.77 mg g DW−1 taxifolin when treated with the optimal hormone combination [64]. However, there is a gap in the literature when it comes to data on well-proven eriodictyol-producing tissue cultures.

3.5. Unique Patterns in Untargeted Metabolomics Data

In studies using both untargeted metabolomics and quantification for comparative analysis of plant materials, the set of targeted compounds can be significantly increased, as demonstrated by Monti et al. [65]. In our study, despite the high variance between tissue types, discernable differences between organs of the three Tilia species emerged (Figure S1), revealing unique fingerprint-like patterns that could potentially enable source identification (Figure 2). Key differentiating natural products include flavonoids, as well as primary metabolites. The phenomenon was most apparent in bracts.
Potential applications of these unique fingerprints include identification, classification and chemotaxonomic evaluation of plant species, as well as quality control and authentication of industrial raw materials [66]. For example, Afzan et al. [67] effectively separated three chemotypes of Ficus deltoidea Jack varieties using a similar approach. Another study successfully utilized untargeted metabolomics to obtain chemotaxonomic information on three Riccia spp. [68]. The latter study was able to present a clear separation of the three species since chemical differences between species were greater than observed in our study. Moreover, Mannochio-Russo et al. [69] demonstrated the effectiveness of this approach at higher taxonomic levels, namely, across an entire plant family (Malpighiaceae). On the other hand, within-species examinations such as comparison of cultivars may yield a continuous gradient of points rather than distinct clusters [65].
Our data show that various tissue types contain highly distinct chemical patterns, as well as additional patterns that would have been overlooked had our analysis been restricted to compounds for which an authentic standard was available. Essentially, the fingerprints derived from quality-controlled untargeted metabolomics serve as valuable complements to the data on quantified natural products.

4. Materials and Methods

4.1. Chemicals

All reagents used were of at least analytical quality. The standards scopoletin, (+)-catechin, quercetin, kaempferol, taxifolin, eriodictyol, astragalin, isoquercitrin and esculin, as well as methanol, were procured from Merck/Sigma Aldrich (Rahway, NJ, USA). LC-MS grade acetonitrile, water and formic acid were purchased from Fisher Scientific (Geel, Belgium). Vendors for the components of the woody plant medium (WPM), hormones and vitamins are listed in the Supplementary Materials.

4.2. Plant Material

4.2.1. Tissue Samples from Trees

Tilia species were identified based on specific morphological characteristics [70]. Biological replicates were obtained by collecting bract and flower samples from three adjacent trees of Tilia cordata Mill., Tilia vulgaris Hayne and Tilia tomentosa Moench (Malvaceae). The organs were collected from the campus of the University of Debrecen (47.5556 N, 21.6215 E) during the flowering period, 52–54 days after the appearance of the bracts. During sampling, representative samples were collected from several points on the trees.

4.2.2. Tissue Culture Initiation and General Protocols

Young bracts aged 1–4 days from various Tilia spp. obtained from the same site were selected as explants. The bracts were surface sterilized in 3% NaOCl with 0.1% Polysorbate 20 for 3 × 5 min, and then washed with autoclaved bidistilled water and subcultured to pH 5.8 autoclaved woody plant medium (WPM) [71] with 3% sucrose, 1% agar, 1 mg L−1 2,4-D and 0.1 mg L−1 BAP for callus initiation.
Established calli were subcultured to the same medium composition every 28 days. This culture period enabled the harvesting of healthy calli of 1–2.5 cm size (Figure S3). Typically, 100–150 mg fresh weight of tissue was transferred during each subculture per 9 cm Petri dish [13], at a density of 7 explants per dish. To obtain biological replicates, bracts from different trees were used as explants, and two stable, independent lines for each species were selected for chemical characterization. The callus lines were maintained under a photoperiod of 14/10 h (22/18 ± 2 °C in light/darkness). For illumination, white, fluorescent light was used (50 µmol m−2s−1). For chemical analysis, 28-day-old calli were used (Figure S3). The chemical characterization experiments were started after the calli were sufficiently stable. To ensure stability, at least 6 subcultures were carried out before enrolling cultures into this step of the experiments.

4.3. Phytochemical Analysis

4.3.1. Sample Preparation

The drying procedure was carried out according to previous protocols [13,21], with additional details provided in the Supplementary Materials. Subsequently, the dried samples were stored in sealed vials, in darkness, at room temperature until further processing. The dried calli lines, as well as the bract and flower samples used in the study, were deposited in the Department of Botany, University of Debrecen.
Following the homogenization and extraction procedure already described [21], the samples were diluted 10-fold with MeOH and filtered through a 0.22 μm PTFE syringe filter prior to analysis. Process blanks, using identical protocols but without a plant matrix added, were employed as blanks for liquid chromatography–electrospray–mass spectrometry (LC-ESI-MS) measurement [72].

4.3.2. LC-ESI-MS

The instrument and method described by Szűcs et al. [21] for the analysis of Tilia bracts were used with slight modifications. Details are provided in the Supplementary Materials.

4.3.3. Method Performance Assessment

Method performance was assessed through the construction of 4–7-point calibration curves using authentic standards spanning 2–3 orders of magnitude. These curves were used to calculate linearity, lower limit of quantification (LLOQ) and upper limit of quantification (ULOQ). Intraday repeatability was assessed by calculating RSD values from the features of QC samples (a mixture of all MeOH extracts mixed at equal ratio, see below). Accuracy was calculated by spiking a 10-fold diluted pooled QC sample with 25% and 50% of the found concentration (n = 3). The results are shown in Table S1.
To obtain exact concentration data for a set of selected metabolites, the above calibration curves were used. Subsequently, a targeted quantitative assessment was performed in mzMine 2.53 [73], using parameters described in our recent study.

4.3.4. Metabolite Annotation

MS/MS spectra were gathered from both untargeted and targeted measurements. The former was based on an exclusion list containing all features with intensities above 105 (in either ion modes). This list was generated from a blank measurement using an in-house R script with mzR 2.30.0 and Spectra 1.6.0 [74]. The latter was based on a series of inclusion lists generated from features that passed all quality control metrics (see Section 4.3.5). The parameters are shown in Tables S4 and S5. Raw MS/MS spectra were merged into consensus spectra as outlined in [75] and annotated along the Classyfire and natural product class (NPC) hierarchies in SIRIUS 5.6.3 [76,77,78,79]. In parallel, a manual search was carried out based on the existing literature. These references were also used to manually verify SIRIUS suggestions in some instances.
Levels of identification, following the criteria outlined by Alseekh et al. [24], are defined as follows: (A) authentic standard enabled full identification; (B(i)) perfect match with a record in literature data; (B(ii)) MS/MS fragmentation deduced from schemes described in more generic literature and similar compounds in the current sample, with all major peaks explained; (B(iii)) the same as B(ii), but only partially explained spectra, leading to the description of derivatives of a well-defined moiety; (C) SIRIUS/CANOPUS class/superclass suggestions with >0.8 probability.

4.3.5. Quality Controlled, Untargeted Metabolomics

Raw measurement files were converted to mzXML using mscovert and uploaded to XCMSOnline version 2.7.2 (XCMS version 1.47.3) for analysis [80]. Parameters are shown in Table S6. The resulting CSV files were processed in R, as outlined in our previous study [74].
Quality-controlled metabolomics measurements enable the drawing of quantitative conclusions regarding chemical features for which no authentic standards are available [72]. The “intra-study QC” approach described in our recent study [74] was used as a means of quality control. The data from the QC injections were used to filter features according to their linearity and precision and to apply LOESS readjustment of local inhomogeneities of sensitivity. Details are available in the Supplementary Materials.

4.4. Statistics

All statistical evaluations were carried out in R 4.3 [81]. Metabolite-level differences among tissue types were examined using the Kruskal–Wallis test, using the tissue type as the factor, followed by adjusting the p-values for false discovery rate (0.05) with the Benjamini–Yekutieli procedure, as in our recent paper [74]. The overall influence of the factors “tissue type” and “species” were assessed with the non-parametric Scheirer–Ray–Hare procedure. In brief, the scaled dataset was subjected to principal component analysis. Subsequently, PC1–4 were tested for significant differences along the factors “tissue type” and “species”.

5. Conclusions

This study aimed to evaluate the potential of tissue cultures from frequently used medicinal Tilia spp. as sources of polyphenolic bioactive natural products. Our chemical characterization approach utilized a combination of quality-controlled untargeted metabolomics and quantification of a set of important metabolites.
Bracts and flowers from the tested Tilia species contained flavonoid glycosides, including tiliroside, that are thought to be behind the activity of the anxiolytic T. americana, suggesting avenues for investigating similar effects in future research. Notably, metabolomics revealed unique patterns, particularly evident in various bract samples, highlighting the potential for further research in quality control or chemotaxonomy.
More importantly, our quantification results enabled us to conclude that the tested tissue cultures are potential alternative sources of catechins and flavonoid aglyca, and to a certain extent, coumarins, albeit not flavonoid glycosides. The most promising tissue cultures were the calli of T. tomentosa, which demonstrated particular efficiency in producing catechin, eriodictyol and, to some extent, taxifolin and coumarins.

Supplementary Materials

The following supporting information can be downloaded at: https://www.mdpi.com/article/10.3390/plants13101288/s1, Additional results: Figure S1: Concentrations or relative abundances of key bioactive constituents from various organs of Tilia species. Figure S2: Principal component analysis biplot showing separation of various species of different Tilia spp. according to their plant metabolome features. Figure S3: Photos of stable callus cultures of tested Tilia species, at the end of their 28-day culture period, before harvesting. Table S1: Method performance parameters. Abbreviations: LLOQ, lower limit of quantification; RSD, relative standard deviation; ULOQ, upper limit of quantification. Table S2: Additional feature parameters. Table S3: Average concentrations of key bioactive constituents from various organs of Tilia species. Additional methodical information: More details are available for Sections S4.1 and S4.3.1–S4.3.5. Table S4: Data-dependent MS/MS parameters (ddMS) for targeted LC-MS/MS. Table S5: Data-dependent MS/MS parameters (ddMS) for untargeted LC-MS/MS. Table S6: XCMS Online automated peak search parameters. Table S7: Injection order for untargeted metabolomics.

Author Contributions

Z.S. carried out the work with the plant materials and performed the data analysis, manual evaluation of MS/MS data and contributed to the manuscript draft. Z.C. performed the MS analysis. C.M. designed and supervised the work related to the tissue cultures. L.V. contributed to the work on plant materials and data analysis. G.V. provided a critical revision. S.G. designed and supervised the study, evaluated the data (untargeted metabolomics) and wrote the manuscript. All authors have read and agreed to the published version of the manuscript.

Funding

This study was supported by the Hungarian Scientific Research Fund (OTKA) grants 142146 and 146030 of the National Research, Development and Innovation Office, which is greatly appreciated. Sándor Gonda was supported by the János Bolyai Scholarship of the Hungarian Academy of Sciences and by the ÚNKP-23-5 New National Excellence Program of the Ministry for Culture and Innovation from the source of the National Research, Development and Innovation Fund.

Data Availability Statement

Data are available upon request.

Conflicts of Interest

The authors have no relevant financial or non-financial interests to disclose.

References

  1. Chandran, H.; Meena, M.; Barupal, T.; Sharma, K. Plant Tissue Culture as a Perpetual Source for Production of Industrially Important Bioactive Compounds. Biotechnol. Rep. 2020, 26, e00450. [Google Scholar] [CrossRef] [PubMed]
  2. Emmanuel, B.; Ishaku, G.; Andrew, F.; Afolabi, A. Callus Culture for the Production of Therapeutic Compounds. Am. J. Plant Biol. 2019, 4, 76–84. [Google Scholar] [CrossRef]
  3. Abbas, G.M.; Abdel Bar, F.M.; Sallam, A.; Elgamal, R.M.; Lahloub, M.-F.I.; Gohar, A.A. In Vitro Callus Culture of Cynara Cardunculus Subsp. Scolymus: A Biosystem for Production of Caffeoylquinic Acid Derivatives, Sesquiterpene Lactones, and Flavonoids. Plant Biosyst. 2022, 156, 865–874. [Google Scholar] [CrossRef]
  4. Anand, P.; Singh, K.P.; Prasad, K.V.; Kaur, C.; Verma, A.K. Betalain Estimation and Callus Induction in Different Explants of Bougainvillea spp. Indian J. Agric. Sci. 2017, 87, 191–196. [Google Scholar] [CrossRef]
  5. Nandhakumar, N.; Kumar, K.; Sudhakar, D.; Soorianathasundaram, K. Plant Regeneration, Developmental Pattern and Genetic Fidelity of Somatic Embryogenesis Derived Musa spp. J. Genet. Eng. Biotechnol. 2018, 16, 587–598. [Google Scholar] [CrossRef] [PubMed]
  6. Ji, X.-H.; Zhang, R.; Wang, N.; Yang, L.; Chen, X.-S. Transcriptome Profiling Reveals Auxin Suppressed Anthocyanin Biosynthesis in Red-Fleshed Apple Callus (Malus sieversii f. Niedzwetzkyana). Plant Cell Tissue Organ Cult. 2015, 123, 389–404. [Google Scholar] [CrossRef]
  7. Xu, X.; Legay, S.; Berni, R.; Hausman, J.-F.; Guerriero, G. Transcriptomic Changes in Internode Explants of Stinging Nettle during Callogenesis. Int. J. Mol. Sci. 2021, 22, 12319. [Google Scholar] [CrossRef] [PubMed]
  8. Bong, F.J.; Yeou Chear, N.J.; Ramanathan, S.; Mohana-Kumaran, N.; Subramaniam, S.; Chew, B.L. The Development of Callus and Cell Suspension Cultures of Sabah Snake Grass (Clinacanthus nutans) for the Production of Flavonoids and Phenolics. Biocatal. Agric. Biotechnol. 2021, 33, 101977. [Google Scholar] [CrossRef]
  9. Yaman, C.; Önlü, Ş.; Ahmed, H.A.A.; Erenler, R. Comparison of phytochemicals and antioxidant capacity of Hypericum perforatum; wild plant parts and in vitro samples. J. Anim. Plant Sci.-JAPS 2021, 32, 596–603. [Google Scholar] [CrossRef]
  10. Arias-Rodríguez, L.I.; Rodríguez-Mendiola, M.A.; Arias-Castro, C.; Gutiérrez Miceli, F.A.; Reséndez Pérez, D.; Luján Hidalgo, M.C.; Villalobos Maldonado, J.J.; Mancilla Margalli, N.A. Comparison of Apigenin, Quercetin and Kaempferol Accumulation and Total Flavonoid Content in Leaves, Embryogenic Cultures and Cell Suspension Cultures of Parsley (Petroselinum crispum). Phyton-Int. J. Exp. Bot. 2023, 92, 2807–2823. [Google Scholar] [CrossRef]
  11. Adil, M.; Haider Abbasi, B.; ul Haq, I. Red Light Controlled Callus Morphogenetic Patterns and Secondary Metabolites Production in Withania somnifera L. Biotechnol. Rep. 2019, 24, e00380. [Google Scholar] [CrossRef] [PubMed]
  12. Bhaskar, R.; Xavier, L.S.E.; Udayakumaran, G.; Kumar, D.S.; Venkatesh, R.; Nagella, P. Biotic Elicitors: A Boon for the in-Vitro Production of Plant Secondary Metabolites. Plant Cell Tissue Organ Cult. 2022, 149, 7–24. [Google Scholar] [CrossRef]
  13. Gonda, S.; Kiss-Szikszai, A.; Szűcs, Z.; Máthé, C.; Vasas, G. Effects of N Source Concentration and NH4+/NO3− Ratio on Phenylethanoid Glycoside Pattern in Tissue Cultures of Plantago lanceolata L.: A Metabolomics Driven Full-Factorial Experiment with LC–ESI–MS3. Phytochemistry 2014, 106, 44–54. [Google Scholar] [CrossRef] [PubMed]
  14. Sõukand, R.; Quave, C.L.; Pieroni, A.; Pardo-de-Santayana, M.; Tardío, J.; Kalle, R.; Łuczaj, Ł.; Svanberg, I.; Kolosova, V.; Aceituno-Mata, L.; et al. Plants Used for Making Recreational Tea in Europe: A Review Based on Specific Research Sites. J. Ethnobiol. Ethnomed. 2013, 9, 58. [Google Scholar] [CrossRef]
  15. Tsioutsiou, E.E.; Amountzias, V.; Vontzalidou, A.; Dina, E.; Stevanović, Z.D.; Cheilari, A.; Aligiannis, N. Medicinal Plants Used Traditionally for Skin Related Problems in the South Balkan and East Mediterranean Region—A Review. Front. Pharmacol. 2022, 13, 936047. [Google Scholar] [CrossRef] [PubMed]
  16. Shikov, A.N.; Tsitsilin, A.N.; Pozharitskaya, O.N.; Makarov, V.G.; Heinrich, M. Traditional and Current Food Use of Wild Plants Listed in the Russian Pharmacopoeia. Front. Pharmacol. 2017, 8, 306255. [Google Scholar] [CrossRef] [PubMed]
  17. López-Rubalcava, C.; Estrada-Camarena, E. Mexican Medicinal Plants with Anxiolytic or Antidepressant Activity: Focus on Preclinical Research. J. Ethnopharmacol. 2016, 186, 377–391. [Google Scholar] [CrossRef] [PubMed]
  18. Barnes, J.; Anderson, L.A.; Phillipson, J.D.; Newall, C.A. Herbal Medicines; Pharmaceutical Press: London, UK, 2007; Volume 459. [Google Scholar]
  19. Dénes, A.; Papp, N.; Babai, D.; Czúcz, B.; Molnár, Z. Wild Plants Used for Food by Hungarian Ethnic Groups Living in the Carpathian Basin. Acta Soc. Bot. Pol. 2012, 81, 381–396. [Google Scholar] [CrossRef]
  20. Karioti, A.; Chiarabini, L.; Alachkar, A.; Fawaz Chehna, M.; Vincieri, F.F.; Bilia, A.R. HPLC-DAD and HPLC-ESI-MS Analyses of Tiliae Flos and Its Preparations. J. Pharm. Biomed. Anal. 2014, 100, 205–214. [Google Scholar] [CrossRef] [PubMed]
  21. Szűcs, Z.; Cziáky, Z.; Kiss-Szikszai, A.; Sinka, L.; Vasas, G.; Gonda, S. Comparative Metabolomics of Tilia platyphyllos Scop. Bracts during Phenological Development. Phytochemistry 2019, 167, 112084. [Google Scholar] [CrossRef] [PubMed]
  22. Chalupa, V. Somatic Embryogenesis in Linden (Tilia spp.). In Somatic Embryogenesis in Woody Plants: Volume 5; Jain, S.M., Gupta, P.K., Newton, R.J., Eds.; Forestry Sciences; Springer: Dordrecht, The Netherlands, 1999; pp. 31–43. ISBN 978-94-011-4774-3. [Google Scholar]
  23. Flores-Sánchez, K.; Cruz-Sosa, F.; Zamilpa-Alvarez, A.; Nicasio-Torres, P. Active Compounds and Anti-Inflammatory Activity of the Methanolic Extracts of the Leaves and Callus from Tilia americana Var. Mexicana Propagated Plants. Plant Cell Tissue Organ Cult. 2019, 137, 55–64. [Google Scholar] [CrossRef]
  24. Alseekh, S.; Aharoni, A.; Brotman, Y.; Contrepois, K.; D’Auria, J.; Ewald, J.; Ewald, C.J.; Fraser, P.D.; Giavalisco, P.; Hall, R.D.; et al. Mass Spectrometry-Based Metabolomics: A Guide for Annotation, Quantification and Best Reporting Practices. Nat. Methods 2021, 18, 747–756. [Google Scholar] [CrossRef] [PubMed]
  25. Parejo, I.; Jauregui, O.; Sánchez-Rabaneda, F.; Viladomat, F.; Bastida, J.; Codina, C. Separation and Characterization of Phenolic Compounds in Fennel (Foeniculum vulgare) Using Liquid Chromatography-Negative Electrospray Ionization Tandem Mass Spectrometry. J. Agric. Food Chem. 2004, 52, 3679–3687. [Google Scholar] [CrossRef] [PubMed]
  26. Xiao, Y.; Wang, Y.-K.; Xiao, X.-R.; Zhao, Q.; Huang, J.-F.; Zhu, W.-F.; Li, F. Metabolic Profiling of Coumarins by the Combination of UPLC-MS-Based Metabolomics and Multiple Mass Defect Filter. Xenobiotica 2020, 50, 1076–1089. [Google Scholar] [CrossRef] [PubMed]
  27. Sun, C.; Wang, Y.; Sun, S.; Chen, X.; Shi, X.; Fang, H.; Zhang, Y.; Fang, Z. Fragmentation Pathways of Protonated Coumarin by ESI-QE-Orbitrap-MS/MS Coupled with DFT Calculations. J. Mass Spectrom. 2020, 55, e4496. [Google Scholar] [CrossRef]
  28. Vukics, V.; Guttman, A. Structural Characterization of Flavonoid Glycosides by Multi-Stage Mass Spectrometry. Mass Spectrom. Rev. 2010, 29, 1–16. [Google Scholar] [CrossRef] [PubMed]
  29. Yan, M.; Chen, M.; Zhou, F.; Cai, D.; Bai, H.; Wang, P.; Lei, H.; Ma, Q. Separation and Analysis of Flavonoid Chemical Constituents in Flowers of Juglans regia L. by Ultra-High-Performance Liquid Chromatography-Hybrid Quadrupole Time-of-Flight Mass Spectrometry. J. Pharm. Biomed. Anal. 2019, 164, 734–741. [Google Scholar] [CrossRef]
  30. Wan, L.; Gong, G.; Liang, H.; Huang, G. In Situ Analysis of Unsaturated Fatty Acids in Human Serum by Negative-Ion Paper Spray Mass Spectrometry. Anal. Chim. Acta 2019, 1075, 120–127. [Google Scholar] [CrossRef] [PubMed]
  31. Griffiths, W.J. Tandem Mass Spectrometry in the Study of Fatty Acids, Bile Acids, and Steroids. Mass Spectrom. Rev. 2003, 22, 81–152. [Google Scholar] [CrossRef] [PubMed]
  32. Kim, K.H.; Moon, E.; Cha, J.M.; Lee, S.; Yu, J.S.; Kim, C.S.; Kim, S.Y.; Choi, S.U.; Lee, K.R. Antineuroinflammatory and Antiproliferative Activities of Constituents from Tilia amurensis. Chem. Pharm. Bull. 2015, 63, 837–842. [Google Scholar] [CrossRef] [PubMed]
  33. Nicasio-Torres, P.; Zamilpa, A.; González-Cortazar, M.; Herrera-Ruiz, M. Production of Anti-Inflammatory Compounds in Calli and Cells in Suspension of Tilia americana Var. Mexicana. Acta Physiol. Plant. 2022, 44, 64. [Google Scholar] [CrossRef]
  34. Arcos, M.L.B.; Cremaschi, G.; Werner, S.; Coussio, J.; Ferraro, G.; Anesini, C. Tilia Cordata Mill. Extracts and Scopoletin (Isolated Compound): Differential Cell Growth Effects on Lymphocytes. Phytother. Res. 2006, 20, 34–40. [Google Scholar] [CrossRef] [PubMed]
  35. Choi, J.-Y.; Seo, C.-S.; Zheng, M.-S.; Lee, C.-S.; Son, J.-K. Topoisomerase I and II Inhibitory Constituents from the Bark of Tilia amurensis. Arch. Pharm. Res. 2008, 31, 1413–1418. [Google Scholar] [CrossRef] [PubMed]
  36. Cisneros-Torres, D.; Cruz-Sosa, F.; González-Cortazar, M.; Martínez-Trujillo, A.; Nicasio-Torres, P. Enhancing the Production of Scopoletin and Quercetin 3-O-β-d-Glucoside from Cell Suspension Cultures of Tilia americana Var. Mexicana by Modulating the Copper and Nitrate Concentrations. Plant Cell Tissue Organ Cult. 2019, 139, 305–316. [Google Scholar] [CrossRef]
  37. Rao, K.; Chodisetti, B.; Gandi, S.; Giri, A.; Kishor, P.B.K. Regeneration-Based Quantification of Coumarins (Scopoletin and Scoparone) in Abutilon indicum In Vitro Cultures. Appl. Biochem. Biotechnol. 2016, 180, 766–779. [Google Scholar] [CrossRef]
  38. Del Pilar Nicasio-Torres, M.; Pérez-Hernández, J.; González-Cortazar, M.; Meckes-Fischer, M.; Tortoriello, J.; Cruz-Sosa, F. Production of Potential Anti-Inflammatory Compounds in Cell Suspension Cultures of Sphaeralcea angustifolia (Cav.) G. Don. Acta Physiol. Plant. 2016, 38, 209. [Google Scholar] [CrossRef]
  39. Biswal, B.; Jena, B.; Giri, A.K.; Acharya, L. Monochromatic Light Elicited Biomass Accumulation, Antioxidant Activity, and Secondary Metabolite Production in Callus Culture of Operculina turpethum (L.). Plant Cell Tissue Organ Cult. 2022, 149, 123–134. [Google Scholar] [CrossRef]
  40. Usman, H.; Ullah, M.A.; Jan, H.; Siddiquah, A.; Drouet, S.; Anjum, S.; Giglioli-Guviarc’h, N.; Hano, C.; Abbasi, B.H. Interactive Effects of Wide-Spectrum Monochromatic Lights on Phytochemical Production, Antioxidant and Biological Activities of Solanum xanthocarpum Callus Cultures. Molecules 2020, 25, 2201. [Google Scholar] [CrossRef] [PubMed]
  41. Usman, H.; Jan, H.; Zaman, G.; Khanum, M.; Drouet, S.; Garros, L.; Tungmunnithum, D.; Hano, C.; Abbasi, B.H. Comparative Analysis of Various Plant-Growth-Regulator Treatments on Biomass Accumulation, Bioactive Phytochemical Production, and Biological Activity of Solanum virginianum L. Callus Culture Extracts. Cosmetics 2022, 9, 71. [Google Scholar] [CrossRef]
  42. Khurshid, R.; Ullah, M.A.; Tungmunnithum, D.; Drouet, S.; Shah, M.; Zaeem, A.; Hameed, S.; Hano, C.; Abbasi, B.H. Lights Triggered Differential Accumulation of Antioxidant and Antidiabetic Secondary Metabolites in Callus Culture of Eclipta alba L. PLoS ONE 2020, 15, e0233963. [Google Scholar] [CrossRef] [PubMed]
  43. Juneja, K.; Beuerle, T.; Sircar, D. Enhanced Accumulation of Biologically Active Coumarin and Furanocoumarins in Callus Culture and Field-Grown Plants of Ruta chalepensis through LED Light-Treatment. Photochem. Photobiol. 2022, 98, 1100–1109. [Google Scholar] [CrossRef] [PubMed]
  44. Al-Khayri, J.M.; Naik, P.M. Influence of 2iP and 2,4-D Concentrations on Accumulation of Biomass, Phenolics, Flavonoids and Radical Scavenging Activity in Date Palm (Phoenix dactylifera L.) Cell Suspension Culture. Horticulturae 2022, 8, 683. [Google Scholar] [CrossRef]
  45. Bavi, K.; Khavari-Nejad, R.A.; Najafi, F.; Ghanati, F. Phenolics and Terpenoids Change in Response to Yeast Extract and Chitosan Elicitation in Zataria multiflora Cell Suspension Culture. 3 Biotech 2022, 12, 163. [Google Scholar] [CrossRef] [PubMed]
  46. Krasteva, G. Effect of Basal Medium on Growth and Polyphenols Accumulation by Gardenia Jasminoides Ellis Cell Suspension. BIO Web Conf. 2022, 45, 02006. [Google Scholar] [CrossRef]
  47. Kim, J.-H.; Han, J.-E.; Murthy, H.N.; Kim, J.-Y.; Kim, M.-J.; Jeong, T.-K.; Park, S.-Y. Production of Secondary Metabolites from Cell Cultures of Sageretia thea (Osbeck) M.C. Johnst. Using Balloon-Type Bubble Bioreactors. Plants 2023, 12, 1390. [Google Scholar] [CrossRef]
  48. Taghizadeh, M.; Nasibi, F.; Kalantari, K.M.; Benakashani, F. Callogenesis Optimization and Cell Suspension Culture Establishment of Dracocephalum polychaetum Bornm. and Dracocephalum kotschyi Boiss.: An in vitro Approach for Secondary Metabolite Production. S. Afr. J. Bot. 2020, 132, 79–86. [Google Scholar] [CrossRef]
  49. Samadi, S.; Saharkhiz, M.J.; Azizi, M.; Samiei, L.; Ghorbanpour, M. Exploring Potential of Multi-Walled Carbon Nanotubes to Establish Efficient Callogenesis, Elicitation of Phenolic Compounds and Antioxidative Activities in Thyme Plants (Thymus daenensis): An in Vitro Assay. S. Afr. J. Bot. 2023, 157, 602–613. [Google Scholar] [CrossRef]
  50. Azeez, H.; Ibrahim, K.; Pop, R.; Pamfil, D.; Hârţa, M.; Bobiș, O. Changes Induced by Gamma Ray Irradiation on Biomass Production and Secondary Metabolites Accumulation in Hypericum triquetrifolium Turra Callus Cultures. Ind. Crops Prod. 2017, 108, 183–189. [Google Scholar] [CrossRef]
  51. Alagarsamy, K.; Shamala, L.F.; Wei, S. Influence of Media Supplements on Inhibition of Oxidative Browning and Bacterial Endophytes of Camellia sinensis Var. Sinensis. 3 Biotech 2018, 8, 356. [Google Scholar] [CrossRef] [PubMed]
  52. Aguirre-Hernández, E.; González-Trujano, M.E.; Martínez, A.L.; Moreno, J.; Kite, G.; Terrazas, T.; Soto-Hernández, M. HPLC/MS Analysis and Anxiolytic-like Effect of Quercetin and Kaempferol Flavonoids from Tilia americana Var. Mexicana. J. Ethnopharmacol. 2010, 127, 91–97. [Google Scholar] [CrossRef] [PubMed]
  53. Pérez-Ortega, G.; Guevara-Fefer, P.; Chávez, M.; Herrera, J.; Martínez, A.; Martínez, A.L.; González-Trujano, M.E. Sedative and Anxiolytic Efficacy of Tilia americana Var. Mexicana Inflorescences Used Traditionally by Communities of State of Michoacan, Mexico. J. Ethnopharmacol. 2008, 116, 461–468. [Google Scholar] [CrossRef] [PubMed]
  54. Piao, X.-C.; Zhang, W.-B.; Jiang, J.; Jin, Y.-H.; Park, P.-J.; Kim, S.-E.; Lian, M.-L. Cell Suspension Culture of Orostachys cartilaginous in Bioreactor Systems for Bioactive Compound Production and Evaluation of Their Antioxidant Properties. Acta Physiol. Plant. 2017, 39, 70. [Google Scholar] [CrossRef]
  55. Gehlot, A.; Chaudhary, N.; Devi, J.; Joshi, R.; Kumar, D.; Bhushan, S. Induction and Submerged Cultivation of Valeriana jatamansi Adventitious Root Cultures for Production of Valerenic Acids and Its Derivatives. Plant Cell Tissue Organ Cult. 2022, 148, 347–361. [Google Scholar] [CrossRef]
  56. Chung, I.-M.; Rekha, K.; Rajakumar, G.; Thiruvengadam, M. Elicitation of Silver Nanoparticles Enhanced the Secondary Metabolites and Pharmacological Activities in Cell Suspension Cultures of Bitter Gourd. 3 Biotech 2018, 8, 412. [Google Scholar] [CrossRef] [PubMed]
  57. Guo, H.; Guo, H.; Zhang, L.; Tang, Z.; Yu, X.; Wu, J.; Zeng, F. Metabolome and Transcriptome Association Analysis Reveals Dynamic Regulation of Purine Metabolism and Flavonoid Synthesis in Transdifferentiation during Somatic Embryogenesis in Cotton. Int. J. Mol. Sci. 2019, 20, 2070. [Google Scholar] [CrossRef] [PubMed]
  58. Herrera-Ruiz, M.; Román-Ramos, R.; Zamilpa, A.; Tortoriello, J.; Jiménez-Ferrer, J.E. Flavonoids from Tilia americana with Anxiolytic Activity in Plus-Maze Test. J. Ethnopharmacol. 2008, 118, 312–317. [Google Scholar] [CrossRef] [PubMed]
  59. Fahim, J.R.; Hegazi, G.A.E.-M.; Abo El-Fadl, R.E.-S.; Abd Alhady, M.R.A.A.; Desoukey, S.Y.; Ramadan, M.A.; Kamel, M.S. Production of Rhoifolin and Tiliroside from Callus Cultures of Chorisia chodatii and Chorisia speciosa. Phytochem. Lett. 2015, 13, 218–227. [Google Scholar] [CrossRef]
  60. Pinheiro, L.Z.; Ramos, C.C.; Oliveira, D.B.D.; Nunes, C.D.R.; Bernardes, N.R.; Glória, L.L.; Lemos, C.D.O.; Santa-Catarina, C.; Pereira, S.M.D.F. In Vitro Micropropagation and Tiliroside Production in Paratecoma peroba (Record) Kuhlm, an Endemic and Endangered Brazilian Tree. Nat. Prod. Res. 2023. online ahead of print. [Google Scholar] [CrossRef] [PubMed]
  61. Ullah, M.A.; Tungmunnithum, D.; Garros, L.; Hano, C.; Abbasi, B.H. Monochromatic Lights-Induced Trends in Antioxidant and Antidiabetic Polyphenol Accumulation in in Vitro Callus Cultures of Lepidium sativum L. J. Photochem. Photobiol. B 2019, 196, 111505. [Google Scholar] [CrossRef] [PubMed]
  62. Ahmad, W.; Zahir, A.; Nadeem, M.; Zia, M.; Hano, C.; Abbasi, B.H. Thidiazuron-Induced Efficient Biosynthesis of Phenolic Compounds in Callus Culture of Ipomoea turbinata Lagasca and Segura. Vitr. Cell. Dev. Biol. Plant 2019, 55, 710–719. [Google Scholar] [CrossRef]
  63. Arias, J.P.; Mendoza, D.; Arias, M. Agitation Effect on Growth and Metabolic Behavior of Plant Cell Suspension Cultures of Thevetia Peruviana at Bench Scale Reactor. Plant Cell Tissue Organ Cult. 2021, 145, 307–319. [Google Scholar] [CrossRef]
  64. Liu, X.; Zhao, Y.; Chen, X.; Dong, L.; Zheng, Y.; Wu, M.; Ding, Q.; Xu, S.; Ding, C.; Liu, W. Establishment of Callus Induction System, Histological Evaluation and Taxifolin Production of Larch. Plant Cell Tissue Organ Cult. 2021, 147, 467–475. [Google Scholar] [CrossRef]
  65. Monti, M.C.; Frei, P.; Weber, S.; Scheurer, E.; Mercer-Chalmers-Bender, K. Beyond Δ9-Tetrahydrocannabinol and Cannabidiol: Chemical Differentiation of Cannabis Varieties Applying Targeted and Untargeted Analysis. Anal. Bioanal. Chem. 2022, 414, 3847–3862. [Google Scholar] [CrossRef] [PubMed]
  66. Kharbach, M.; Marmouzi, I.; El Jemli, M.; Bouklouze, A.; Vander Heyden, Y. Recent Advances in Untargeted and Targeted Approaches Applied in Herbal-Extracts and Essential-Oils Fingerprinting—A Review. J. Pharm. Biomed. Anal. 2020, 177, 112849. [Google Scholar] [CrossRef] [PubMed]
  67. Afzan, A.; Kasim, N.; Ismail, N.H.; Azmi, N.; Ali, A.M.; Mat, N.; Wolfender, J.-L. Differentiation of Ficus deltoidea Varieties and Chemical Marker Determination by UHPLC-TOFMS Metabolomics for Establishing Quality Control Criteria of This Popular Malaysian Medicinal Herb. Metabolomics 2019, 15, 35. [Google Scholar] [CrossRef] [PubMed]
  68. Peters, K.; Blatt-Janmaat, K.L.; Tkach, N.; van Dam, N.M.; Neumann, S. Untargeted Metabolomics for Integrative Taxonomy: Metabolomics, DNA Marker-Based Sequencing, and Phenotype Bioimaging. Plants 2023, 12, 881. [Google Scholar] [CrossRef] [PubMed]
  69. Mannochio-Russo, H.; de Almeida, R.F.; Nunes, W.D.G.; Bueno, P.C.P.; Caraballo-Rodríguez, A.M.; Bauermeister, A.; Dorrestein, P.C.; Bolzani, V.S. Untargeted Metabolomics Sheds Light on the Diversity of Major Classes of Secondary Metabolites in the Malpighiaceae Botanical Family. Front. Plant Sci. 2022, 13, 854842. [Google Scholar] [CrossRef] [PubMed]
  70. Pigott, D. Lime-Trees and Basswoods: A Biological Monograph of the Genus Tilia; Cambridge University Press: Cambridge, UK, 2012; ISBN 978-1-139-56027-6. [Google Scholar]
  71. Lloyd, G.; McCown, B. Commercially-Feasible Micropropagation of Mountain Laurel, Kalmia latifolia, by Use of Shoot-Tip Culture. Comb. Proc. Int. Plant Propagators Soc. 1980, 30, 421–427. [Google Scholar]
  72. Kirwan, J.A.; Gika, H.; Beger, R.D.; Bearden, D.; Dunn, W.B.; Goodacre, R.; Theodoridis, G.; Witting, M.; Yu, L.-R.; Wilson, I.D.; et al. Quality Assurance and Quality Control Reporting in Untargeted Metabolic Phenotyping: mQACC Recommendations for Analytical Quality Management. Metabolomics 2022, 18, 70. [Google Scholar] [CrossRef] [PubMed]
  73. Pluskal, T.; Castillo, S.; Villar-Briones, A.; Orešič, M. MZmine 2: Modular Framework for Processing, Visualizing, and Analyzing Mass Spectrometry-Based Molecular Profile Data. BMC Bioinform. 2010, 11, 395. [Google Scholar] [CrossRef] [PubMed]
  74. Rainer, J.; Vicini, A.; Salzer, L.; Stanstrup, J.; Badia, J.M.; Neumann, S.; Stravs, M.A.; Verri Hernandes, V.; Gatto, L.; Gibb, S.; et al. A Modular and Expandable Ecosystem for Metabolomics Data Annotation in R. Metabolites 2022, 12, 173. [Google Scholar] [CrossRef] [PubMed]
  75. Gonda, S.; Szűcs, Z.; Plaszkó, T.; Cziáky, Z.; Kiss-Szikszai, A.; Sinka, D.; Bácskay, I.; Vasas, G. Quality-Controlled LC-ESI-MS Food Metabolomics of Fenugreek (Trigonella foenum-Graecum) Sprouts: Insights into Changes in Primary and Specialized Metabolites. Food Res. Int. 2023, 164, 112347. [Google Scholar] [CrossRef] [PubMed]
  76. Djoumbou Feunang, Y.; Eisner, R.; Knox, C.; Chepelev, L.; Hastings, J.; Owen, G.; Fahy, E.; Steinbeck, C.; Subramanian, S.; Bolton, E.; et al. ClassyFire: Automated Chemical Classification with a Comprehensive, Computable Taxonomy. J. Cheminform. 2016, 8, 61. [Google Scholar] [CrossRef] [PubMed]
  77. Dührkop, K.; Fleischauer, M.; Ludwig, M.; Aksenov, A.A.; Melnik, A.V.; Meusel, M.; Dorrestein, P.C.; Rousu, J.; Böcker, S. SIRIUS 4: A Rapid Tool for Turning Tandem Mass Spectra into Metabolite Structure Information. Nat. Methods 2019, 16, 299–302. [Google Scholar] [CrossRef] [PubMed]
  78. Dührkop, K.; Nothias, L.-F.; Fleischauer, M.; Reher, R.; Ludwig, M.; Hoffmann, M.A.; Petras, D.; Gerwick, W.H.; Rousu, J.; Dorrestein, P.C.; et al. Systematic Classification of Unknown Metabolites Using High-Resolution Fragmentation Mass Spectra. Nat. Biotechnol. 2021, 39, 462–471. [Google Scholar] [CrossRef] [PubMed]
  79. Kim, H.W.; Wang, M.; Leber, C.A.; Nothias, L.-F.; Reher, R.; Kang, K.B.; van der Hooft, J.J.J.; Dorrestein, P.C.; Gerwick, W.H.; Cottrell, G.W. NPClassifier: A Deep Neural Network-Based Structural Classification Tool for Natural Products. J. Nat. Prod. 2021, 84, 2795–2807. [Google Scholar] [CrossRef] [PubMed]
  80. Gowda, H.; Ivanisevic, J.; Johnson, C.H.; Kurczy, M.E.; Benton, H.P.; Rinehart, D.; Nguyen, T.; Ray, J.; Kuehl, J.; Arevalo, B.; et al. Interactive XCMS Online: Simplifying Advanced Metabolomic Data Processing and Subsequent Statistical Analyses. Anal. Chem. 2014, 86, 6931–6939. [Google Scholar] [CrossRef]
  81. R Core Team. R: A Language and Environment for Statistical Computing; R Foundation for Statistical Computing: Vienna, Austria, 2024. [Google Scholar]
Figure 1. Principal component analysis biplot showing separation of various organs of different Tilia spp. according to their plant metabolome features. Axes show principal component order, with explained variance. Crosses denote average ± standard deviation for a species−organ pair (solid line, bract; dashed line, callus; long-dashed line, flower). Point shapes denote tissue type: circle, bract; triangle, callus; square: flower. Color denotes different Tilia species: purple, T. cordata; green, T. tomentosa; magenta, T. vulgaris.
Plants 13 01288 g001
Figure 2. Heatmap showing relative abundance of chemical features in organs of Tilia vulgaris, T. tomentosa and T. cordata. The heatmap was generated from autoscaled, combined positive and negative ion mode data obtained through untargeted metabolomics using reverse phase LC-ESI-MS of the extracts of the organs. All features passed quality control filters. Species abbreviations: Tc, Tilia cordata; Tt, Tilia tomentosa, Tv, Tilia vulgaris. The asterisks to the left indicate the statistical significance of the Kruskal–Wallis test between species, after adjustment for false discovery rate: * p < 0.05; ** p < 0.01. The color of the asterisks corresponds to different compound classes, as shown in the legend (according to the annotation in SIRIUS).
Plants 13 01288 g002
Figure 3. Concentrations or relative abundances of key bioactive constituents from various organs of Tilia species. Where an authentic standard was available, µg g DW−1 (dry weight) was given, in other cases, abundance (abbreviated “Abu.”) is shown. Subplots: (a) scopoletin; (b) fraxin ([email protected]); (c) esculin; (d) isoquercitrin; (e) catechin; (f) astragalin; (g) kaempferol-O-pentoside ([email protected]); (h) luteolin-O-deoxyhexose ([email protected]); (i) tiliroside ([email protected]). Species abbreviations on the x axis: Tc, Tilia cordata; Tt, Tilia tomentosa, Tv, Tilia vulgaris. Organs not sharing the same letter are significantly different at p < 0.05 (Dunn’s test, carried out only after significant Kruskal–Wallis tests adjusted for false discovery rate of 0.05).
Plants 13 01288 g003
Table 1. Metabolites from flowers, bracts and calli of Tilia cordata, T. tomentosa and T. vulgaris, putatively identified at least at level B with LC-ESI-MS. Column header abbreviations: m/z (pos./neg.), mass-to-charge ratio of chemical features in positive or negative ion mode; Rt (min), retention time in minutes; m/z diff. ppm (pos/neg), mass-to-charge ratio difference from theoretically calculated value, expressed in ppm, in positive/negative ion mode; Id. level, identification level according to [24], see footer or Section 4.4. for more details; Ref., references.
Namem/z (pos.)m/z (neg.)Rt (min)Formula (M)m/z diff.
ppm (pos.)
m/z diff.
ppm (neg.)
Major MS/MS FragmentsId. LevelRef.
Coumarins and derivatives
Esculin 339.07257.45C15H16O9 +2.6177.0184; 133.0284A
Methylesculetin
derivative
399.09367.67NA NA191.0345 176.0106B(iii)[25,26]
Scopoletin-O-hexoside 353.08777.66C16H18O9 +1.2193.0499; 163.0391B(i)[27]
Fraxin 369.08307.77C16H18O10 +2.2207.0294; 192.0058; 163.0029B(i)[25,26]
Scopoletin193.0493 8.38C10H8O4−4.0 161.0594; 133.0647; 105.0701A
Catechins and derivatives
Gallocatechol 305.06707.52C15H14O7 +2.9261.0760; 219.0650; 179.0340; 167.0339; 139.0387; 125.02303B(ii)[20,28]
Catechin 289.07217.68C15H14O6 +3.1271.0621; 245.0813; 221.0811; 179.0338; 125.0231A
Catechin dimer 577.1357.78C30H26O12 +0.7407.0766; 289.0716; 245.00814; 161.0230; 125.0229B(i)[28,29]
Catechin trimer 865.19907.92C45H38O18 +1.2407.0766; 289.0716; 245.0448; 125.0228B(i)[20,28]
Flavonoid glycosides
Isoquercitrin 463.08878.18C21H20O12 +2.3301.0344; 300.0272; 271.0247; 151.0021A
Quercetin-malonyl-O-
hexoside
549.08908.27C24H22O15 +1.7463.0889; 371.2072; 301.0356; 300.0279; 271.0254; 255.0298; 151.0024B(ii)[20,28]
Astragalin 447.09398.32C21H20O11 +2.6285.0408; 284.0332; 271.0255; 255.0298; 227.0351A
Quercetin-O-pentoside435.0923 8.36C20H18O11−1.0 303.0498; 257.0447; 153.0182B(i)[20,28]
Kaempferol-O-
pentoside
417.08288.41C20H18O10 +1.5285.0392; 255. 0293; 227.0341; 151.0022B(ii)[28,29]
Luteolin-O-deoxy-
hexoside
431.09868.48C21H20O10 +1.8285.0409; 284.0391; 255.0297; 227.0343; 151.0024B(i)[20,28]
Tiliroside595.1461 8.71C30H26O13+1.6 287.0894; 195.0294; 153.0184B(ii)[20,28]
Rhamnetin-O-hexoside 477.10398.74C22H22O12 +1.3315.0512; 301.0364; 271.0243B(i)[20,28]
Flavonoid aglyca
Taxifolin 303.05048.36C15H12O7 −0.3287.0551; 259.0584; 231.0653; 153.01836A
Eriodictyol 287.05598.84C15H12O6 +1.2269.0458; 169.0129; 151.0022; 135.0437A
Quercetin 301.03498.89C15H10O7 +0.2273.0404; 255.1966; 151.002A
Trihydroxy-flavanone273.0761 9.19C15H12O5−0.7 255.06561; 215.0465; 153.01836B(ii)[28,29]
Kaempferol287.0554 9.23C15H10O6−0.4 255.0648; 215.0463; 187.0153; 153.0179A
Fatty acids
Trihydroxy-linoleic acid 327.21809.03C18H32O5 +2.6309.2078; 291.1968; 229.1442; 211.1334; 183.1382; 171.1016B(i)[30]
Linoleic acid derivate 329.23369.2NA NA293.2132; 229.1442; 211.1335; 183.1384; 171.1017B(iii)[30]
1-18:3-lysoPE476.2765 10.35C23H42NO7P−2.5 335.2576; 304.2629; 261.2204B(i)[31]
1-18:2-lysoPE478.2929 10.65C23H44NO7P−1.0 337.2735; 306.2791; 263.2369B(i)[31]
Dehydro-hydroxy-
linoleic acid
293.212610.74C18H30O3 +3.2275.2020 235.1703 183.1381 171.1011B(ii)[30]
1-16:0-lysoPE454.2932 10.94C21H44NO7P−0.4 313.2730; 282.2785; 239.2367; 155.0101B(i)[31]
Hydroxy-linoleic acid 295.228011.05C18H32O3 +2.3277.2174; 195.1386; 183.1386; 171.1016B(ii)[30]
Levels of identification are shown in column “Id. level” and defined according to Alseekh et al. [24] as follows: (A) authentic standard; (B(i)) confident match based on MS/MS; (B(ii)) confident match using in silico MS/MS approaches; (B(iii)) partial match based on MS/MS. For clarity, in the case of each compound, only the polarity chosen for fragmentation was shown, even if it was possible to detect the compound of interest in the other ion mode. Abbreviations: NA, not available.
Disclaimer/Publisher’s Note: The statements, opinions and data contained in all publications are solely those of the individual author(s) and contributor(s) and not of MDPI and/or the editor(s). MDPI and/or the editor(s) disclaim responsibility for any injury to people or property resulting from any ideas, methods, instructions or products referred to in the content.

