Article

Genome-Wide Identification of Members of the Soybean CBL Gene Family and Characterization of the Functional Role of GmCBL1 in Responses to Saline and Alkaline Stress

College of Agriculture, Heilongjiang Bayi Agricultural University, Daqing 163319, China
*
Author to whom correspondence should be addressed.
Plants 2024, 13(10), 1304; https://doi.org/10.3390/plants13101304
Submission received: 6 March 2024 / Revised: 25 April 2024 / Accepted: 4 May 2024 / Published: 9 May 2024
(This article belongs to the Section Plant Genetics, Genomics and Biotechnology)

Abstract

:
Calcium ions function as key messengers in the context of intracellular signal transduction. The ability of plants to respond to biotic and abiotic stressors is highly dependent on the calcineurin B-like protein (CBL) and CBL-interacting protein kinase (CIPK) signaling network. Here, a comprehensive effort was made to identify all members of the soybean CBL gene family, leading to the identification of 15 total genes distributed randomly across nine chromosomes, including 13 segmental duplicates. All the GmCBL gene subfamilies presented with similar gene structures and conserved motifs. Analyses of the expression of these genes in different tissues revealed that the majority of these GmCBLs were predominantly expressed in the roots. Significant GmCBL expression and activity increases were also observed in response to a range of stress-related treatments, including salt stress, alkaline stress, osmotic stress, or exposure to salicylic acid, brassinosteroids, or abscisic acid. Striking increases in GmCBL1 expression were observed in response to alkaline and salt stress. Subsequent analyses revealed that GmCBL1 was capable of enhancing soybean salt and alkali tolerance through the regulation of redox reactions. These results offer new insight into the complex mechanisms through which the soybean CBL gene family regulates the responses of these plants to environmental stressors, highlighting promising targets for efforts aimed at enhancing soybean stress tolerance.

1. Introduction

Soybeans are a key leguminous crop, serving as a major source of edible protein and oil for consumption by humans and use in the production of animal feed throughout the world [1]. Rising levels of soil salinity, however, are adversely impacting global soybean yields [2], threatening soybean cultivation. The enhancement of soybean tolerance for saline–alkaline conditions is vital as a means of improving agricultural productivity on salinized lands.
Salt stress can result from both osmotic disturbances and the ionic toxicity posed by sodium ions (Na+) [3]. Cytoplasmic calcium ion (Ca2+) concentrations rise immediately in response to elevated levels of salinity [4,5]. Calcium functions as a major mediator of signal transduction in plants, governing their growth, development, and ability to respond appropriately to environmental stressors [6,7]. This burst of Ca2+ signaling activity has been demonstrated to be triggered by the binding of extracellular sodium ions to cell-surface-exposed glycosyl inositol phosphoryl ceramides (GIPCs) [8]. Research to date has led to the characterization of four prominent Ca2+ sensors, including calcineurin B-like protein (CBL), calcium-dependent protein kinase (CDPK), calmodulin (CAM), and calmodulin-like protein (CML) [9]. With the exception of the kinase-domain-containing CDPKs, these Ca2+ sensors lack any enzymatic domains, suggesting that they serve as intermediaries in the process of cellular signal transmission to targets downstream [10]. The CBL protein was first identified in Arabidopsis thaliana, and it shares a high degree of similarity with the regulatory subunit of the mammalian calcineurin protein [11,12]. CBLs are composed of a structural domain consisting of four conserved helix–loop–helix motifs (EF−hands) that serve as a site for calcium binding, allowing for the capture of Ca2+ and for interaction with CIPKs (CBL-interacting protein kinases) [13,14]. Canonical EF−hand motifs are generally composed of Asp, Asp, Asp, Thr, Asp, and Glu in the ligand coordinating positions [15]. A serine present within the conserved PFPF motif of CBL has been established as a site of CIPK-mediated CBL phosphorylation [16]. Some CBL proteins contain a site that undergoes N-myristoylation, which is required for the functional role that these plants play in the enhancement of tolerance to salt stress [17].
Together, CBL and CIPK proteins comprise a calcium signaling network that is central to the ability of plants to respond appropriately to abiotic stressors [18,19]. Ten CBLs that interact with twenty-six CIPKs have been identified in A. thaliana to date [20,21]. The first CBL-CIPK network to have been characterized is the salt overly sensitive (SOS) pathway, which entails signaling mediated by a complex of CBL4 (SOS3) and CIPK24 (SOS2). Interactions between SOS3 and SOS2 result in the phosphorylation of SOS1, a Na/H antiporter located at the plasma membrane, activating it and thereby enhancing the export of Na+ [22,23,24]. Research focused on the AtCBL1 gene in A. thaliana has revealed that it is inducible in response to stressors including salt, cold, or drought stress conditions. AtCBL1 overexpression led to the establishment of plants that were better able to resist drought and salt stress, although they were more sensitive to freezing conditions, thereby establishing AtCBL1 as a positive regulator of drought and salt responses, whereas it negatively regulates cold responses [25]. AtCBL1 overexpression can protect against water loss in A. thaliana while promoting the upregulation of a series of early stress-response-related transcription factors and genes important for adapting to stress conditions, thus regulating DREB-type-related transcription factors [26]. AtCBL5 has similarly been found to positively regulate drought and salt stress in plants such that they can better contend with these stressors when it is overexpressed [27]. A. thaliana plants overexpressing ZmCBL9 from Zea mays L. were better able to tolerate osmotic and salt stress. At the molecular level, ZmCBL9 was found to interact with several ZmCIPK proteins, supporting its importance as an abiotic stress response regulator [28]. CBL10 has also been reported to be central to the regulation of stress-related signal transduction in several model plant species, activating appropriate Ca2+ regulatory channels in response to particular stressors. CBL10 can also regulate respiratory burst oxidase homolog protein activity, thereby modulating rapid long-distance signal transmission [29]. The evidence published to date thus highlights the status of CBL proteins as essential regulators of abiotic stress responses in plants, emphasizing their importance in an array of stress-related signaling pathways.
Plants engage in myriad metabolic and growth-related processes over the course of their life cycle, and CBL proteins help appropriately govern and direct the related responses. Ca2+ ions are vital second messengers that control activities including the germination of pollen and tube growth, both of which entail the expression of high levels of AtCBL1 and AtCBL9 expression in A. thaliana. When either of these genes are overexpressed, this reportedly suppresses the rates of pollen germination and tube elongation, particularly when potassium concentrations are elevated [30]. Studies of the apple gene MdCBL5 have indicated that it is strongly expressed in pollen, controlling the Ca2+ ion gradient at the pollen tube apex and thereby governing tube growth activity [31]. CBL2 and CBL3, which localize the vacuolar membrane, can also reportedly influence A. thaliana nutritional growth and reproductive development, with the effect being most pronounced when both of the associate genes are mutated [32]. Indeed, there is strong evidence for the importance of CBL2 and CBL3 in the context of seed development such that embryonic development is markedly disrupted when both are completely absent [33]. Members of the CBL protein family are thus indispensable regulators of plant development.
Despite intensive research characterizing the CBL gene family in model plant species including A. thaliana [21], rice (Oryza sativa) [21], canola (Brassica napus) [34], and grapevine (Vitis vinifera) [35], there have not been any corresponding genome-wide analyses of this gene family in soybean (Glycine max var. Williams 82), even though its genome has been sequenced [36]. The present study was thus developed to address this knowledge gap by assessing the gene structures, expression patterns, evolution, and syntenic relationships of members of the soybean CBL gene family, potentially as pertaining to their biological roles in the context of saline–alkaline stress. To that end, the responses of CBL genes to factors including abiotic stress conditions and hormone treatment were systematically analyzed, with supporting analyses of conserved motifs, collinearity, and patterns of gene expression being conducted. Soybean plants expressing elevated levels of GmCBL1 were also established, and their responses to saline–alkaline stress were evaluated. The overall goal of this study was to determine the regulatory functions that govern the activity of soybean CBL genes and the importance of members of this family in stress adaptation, thereby informing efforts aimed at establishing soybean crops with greater stress resistance.

2. Results

2.1. Identification of the G. max CBL Gene Family

The full-length protein sequences and conserved domains of 10 A. thaliana CBL proteins were selected for use as BLAST queries against the Phyozome database, leading to the identification of 15 putative soybean CBL genes designated as GmCBL1-15 (Table 1). Among the several analyzed plant species, the genome of T. aestivum encoded the highest number of CBL genes, whereas G. max encoded the highest number of CBL genes among the legume family members (Figure S1). High homology was observed between the G. max CBL gene and G. soja CBL gene (Figure S2). GmCBL1GmCBL15 ranged from 639 to 798 base pairs in terms of coding sequence length, with predicted protein lengths ranging from 213 to 266 amino acids. These GmCBLs exhibited isoelectric points from 4.31 to 4.76 and molecular weights between 24.4 and 30.65 kDa (Table 1). None of these GmCBLs presented with notably distinct sequence lengths or molecular weight values as compared to other members of this family. Cell-PLoc-based predictions suggested that the subcellular localization of the proteins encoded by these genes varied substantially, with 5, 1, 1, and 8, respectively, localizing primarily to the nucleus, extracellular matrix, chloroplast, and cytoplasm (Table 1).

2.2. Phylogenetic Analyses and Classification of CBL Genes

To explore the classification of and the evolutionary relationships among the GmCBLs, the full-length protein sequences of these GmCBLs were aligned to homologous CBLs encoded by S. bicolor (SbCBL1-8), A. thaliana (AtCBL1-10), O. sativa (OsCBL1-10), Z. mays (ZmCBL1-9), P. vulgaris (PvCBL1-10), V. unguiculata (VuCBL1-8), T. aestivum (TaCBL1-19), and G. soja (GsCBL1-14), enabling the construction of a phylogenetic tree (Figure 1A). These plant CBLs were classified into nine distinct clades (I–IX), with the GmCBLs being unevenly distributed across these clades. The greatest number were located in clade I, while two GmCBLs each were located in clades IV and VI, and none were located in clades V, VII, VIII, or IX. These patterns of GmCBL distribution emphasize the diversity of this GmCBL gene family. Strikingly, the identified GmCBL isoforms were found to be closely related to homologous genes encoded by G. soja within each of these clusters, consistent with the fact that these species are both members of the same leguminous family (Figure 1A).

2.3. GmCBL Genes Syntenic Relationship, Gene Structure, and Protein Structure Analyses

To gain further insight into the structural characteristics of members of the GmCBL family, the exon–intron patterns and sizes of these genes were next evaluated. Those GmCBL genes in a given cluster presented with a high degree of similarity with respect to their exon–intron structures (Figure 1B), particularly with respect to the exon numbers. For example, the GmCBLs in cluster I all presented with eight exons, and only minimal differences in exon lengths were present among the members of this cluster. Exon numbers were similarly conserved among the GmCBLs in clusters II, III, and VI (n = 8), emphasizing the highly conserved nature of these genes in terms of their sequences and exon–intron organization within each of these phylogenetic groups. To better understand the evolution of this gene family, potential duplication events within the G. max genome were analyzed (Figure 1C), leading to the identification of 13 such duplication events involving 14 GmCBL genes (GmCBL1, GmCBL2, GmCBL3, GmCBL4, GmCBL5, GmCBL6, GmCBL7, GmCBL8, GmCBL9, GmCBL10, GmCBL11, GmCBL12, GmCBL13, and GmCBL15). Duplications thus appear to have played a key role in GmCBL gene family expansion. These 15 GmCBL family proteins were also found to harbor four conserved domains, including the EF−hand_1, EF−hand_5, EF−hand_7, and EF−hand_8 domains (Figure 1D). In addition to contributing to the overall structural diversity of these GmCBLs, these domains may play vital roles in the functional differentiation of members of this family.

2.4. GmCBL Chromosomal Distribution and Motif Analyses

These 15 GmCBL genes were found to be randomly distributed across chromosomes (Chr) throughout the G. max genome (Figure S3). Specifically, GmCBL1, GmCBL4, GmCBL10, GmCBL11, and GmCBL15 were, respectively, encoded on Chr 4, 6, 9, 11, and 18, while GmCBL2 and GmCBL3 were encoded on Chr 5; GmCBL5 and GmCBL6 on Chr 7; GmCBL7, GmCBL8, and GmCBL9 on Chr 8; and GmCBL12, GmCBL13, and GmCBL14 on Chr 17. These genes exhibited some tendency towards clustering, such that they were predominantly located at the tops or bottoms of individual chromosomes. When the MEME tool was used to conduct a motif analysis of conserved motifs across these GmCBL proteins (Table S4 and Figure 2A), 10 conserved motifs ranging from 8 to 50 amino acids in length (motifs 1–10) were identified in various combinations across this GmCBL protein family. The highest numbers of conserved motifs were evident in GmCBL5 and GmCBL8. The majority of the GmCBLs included motifs 1, 2, 3, 4, and 6. Moreover, GmCBLs clustered within the same phylogenetic branch exhibited consistent motif compositions, highlighting the evolutionary and functional similarity within these clusters. The 3D structures of these GmCBL EF−hand_7 domains were composed of three α-helices (α1, α2, and α3) and a β-sheet1 that was roughly parallel to β-sheet2 (Figure 2B). Together, the results of this motif analysis offer new insight into the conserved structural elements that contribute to GmCBL gene family functional diversity.

2.5. Cis-Acting Element Analyses of GmCBL Gene Promoters

To identify potential cis-acting elements involved in the regulation of GmCBL gene transcriptional activity, a 2.0 kb promoter region upstream of the ATG start codon for each of these GmCBLs was analyzed. This approach led to the identification of stress-responsive cis-acting elements upstream of all genes other than GmCBL6 and GmCBL12 (Figure 3). The drought-responsive MBS element was detected upstream of GmCBL7, GmCBL8, GmCBL14, and GmCBL15. The anoxia-inducible ARE element was upstream of GmCBL1, GmCBL2, GmCBL3, GmCBL4, GmCBL7, GmCBL8, GmCBL10, GmCBL11, GmCBL13, and GmCBL15. TC-rich repeats involved in defense and stress responses were upstream of GmCBL1, GmCBL2, GmCBL4, GmCBL5, GmCBL9, GmCBL11, and GmCBL15. A low-temperature-responsive (LTR) element was identified as being upstream of GmCBL3 and GmCBL15. Meristem-expression-related CAT and NON elements were detected upstream of GmCBL1, GmCBL3, GmCBL5, GmCBL11, and GmCBL14. These detailed bioinformatics results emphasize the key roles that these GmCBLs likely play as mediators of plant growth and stress responses, while suggesting that the expression of these genes is carefully regulated in response to particular environmental cues.

2.6. Multiple Sequence Alignment

As a means of probing the conserved regions present within the proteins encoded by these 15 GmCBL genes, multiple sequence alignment of these G. max protein sequences was next performed. Most of these GmCBLs were found to harbor the EF−hand_7 domain, with the exception of GmCBL7 and GmCBL8 (Figure 4A). GmCBL7 was found to harbor the EF−hand_5 domain, while GmCBL8 and GmCBL10 both harbored the EF−hand_5 and EF−hand_7 domains. The EF−hand_8 domain was present in nine of these GmCBLs and was only absent from GmCBL6, GmCBL7, GmCBL11, GmCBL12, GmCBL13, and GmCBL14. The EF−hand_1 domain was unique to GmCBL14, while C-terminal FPSF motifs were present in 11 of these GmCBLs. Notably, the N-terminal MGCXXSK/T motif, which has been established as the myristoylation domain a specialized CBL protein domain [37], was present in GmCBL1, GmCBL2, GmCBL4, GmCBL11, and GmCBL13. These protein sequence analyses offer new insight into the conserved motifs and domains present within these soybean CBL proteins, providing additional information regarding their structural diversity and potential functional roles.

2.7. Tissue-Specific Expression Profiling of GmCBLs

Next, the patterns of GmCBL expression across different tissues were analyzed using high-throughput sequencing data from the Phytozome database, analyzing the expression of these genes in roots, stems, leaves, pods, seeds, and flowers (Figure 4B). These genes were expressed in distinct patterns, with higher relative GmCBL11 and GmCBL3 mRNA levels in flowers, while GmCBL6, GmCBL2, GmCBL1, and GmCBL5 were expressed more robustly in roots, GmCBL10 was highly expressed in seeds, and GmCBL13 was highly expressed in pods. Relative to other members of this gene family, GmCBL13 was expressed at lower levels across these analyzed tissues. Based on their expression patterns across tissues, these GmCBLs were classified into five major expression groups (I–V) (Figure 4B), with this categorization largely aligning with the phylogenetic clades established above. Similar patterns of GmCBL expression were observed within each of these subgroups. Overall, the tissue-specific GmCBL expression patterns emphasize the varied roles that these genes play in the growth and development of soybean plants.

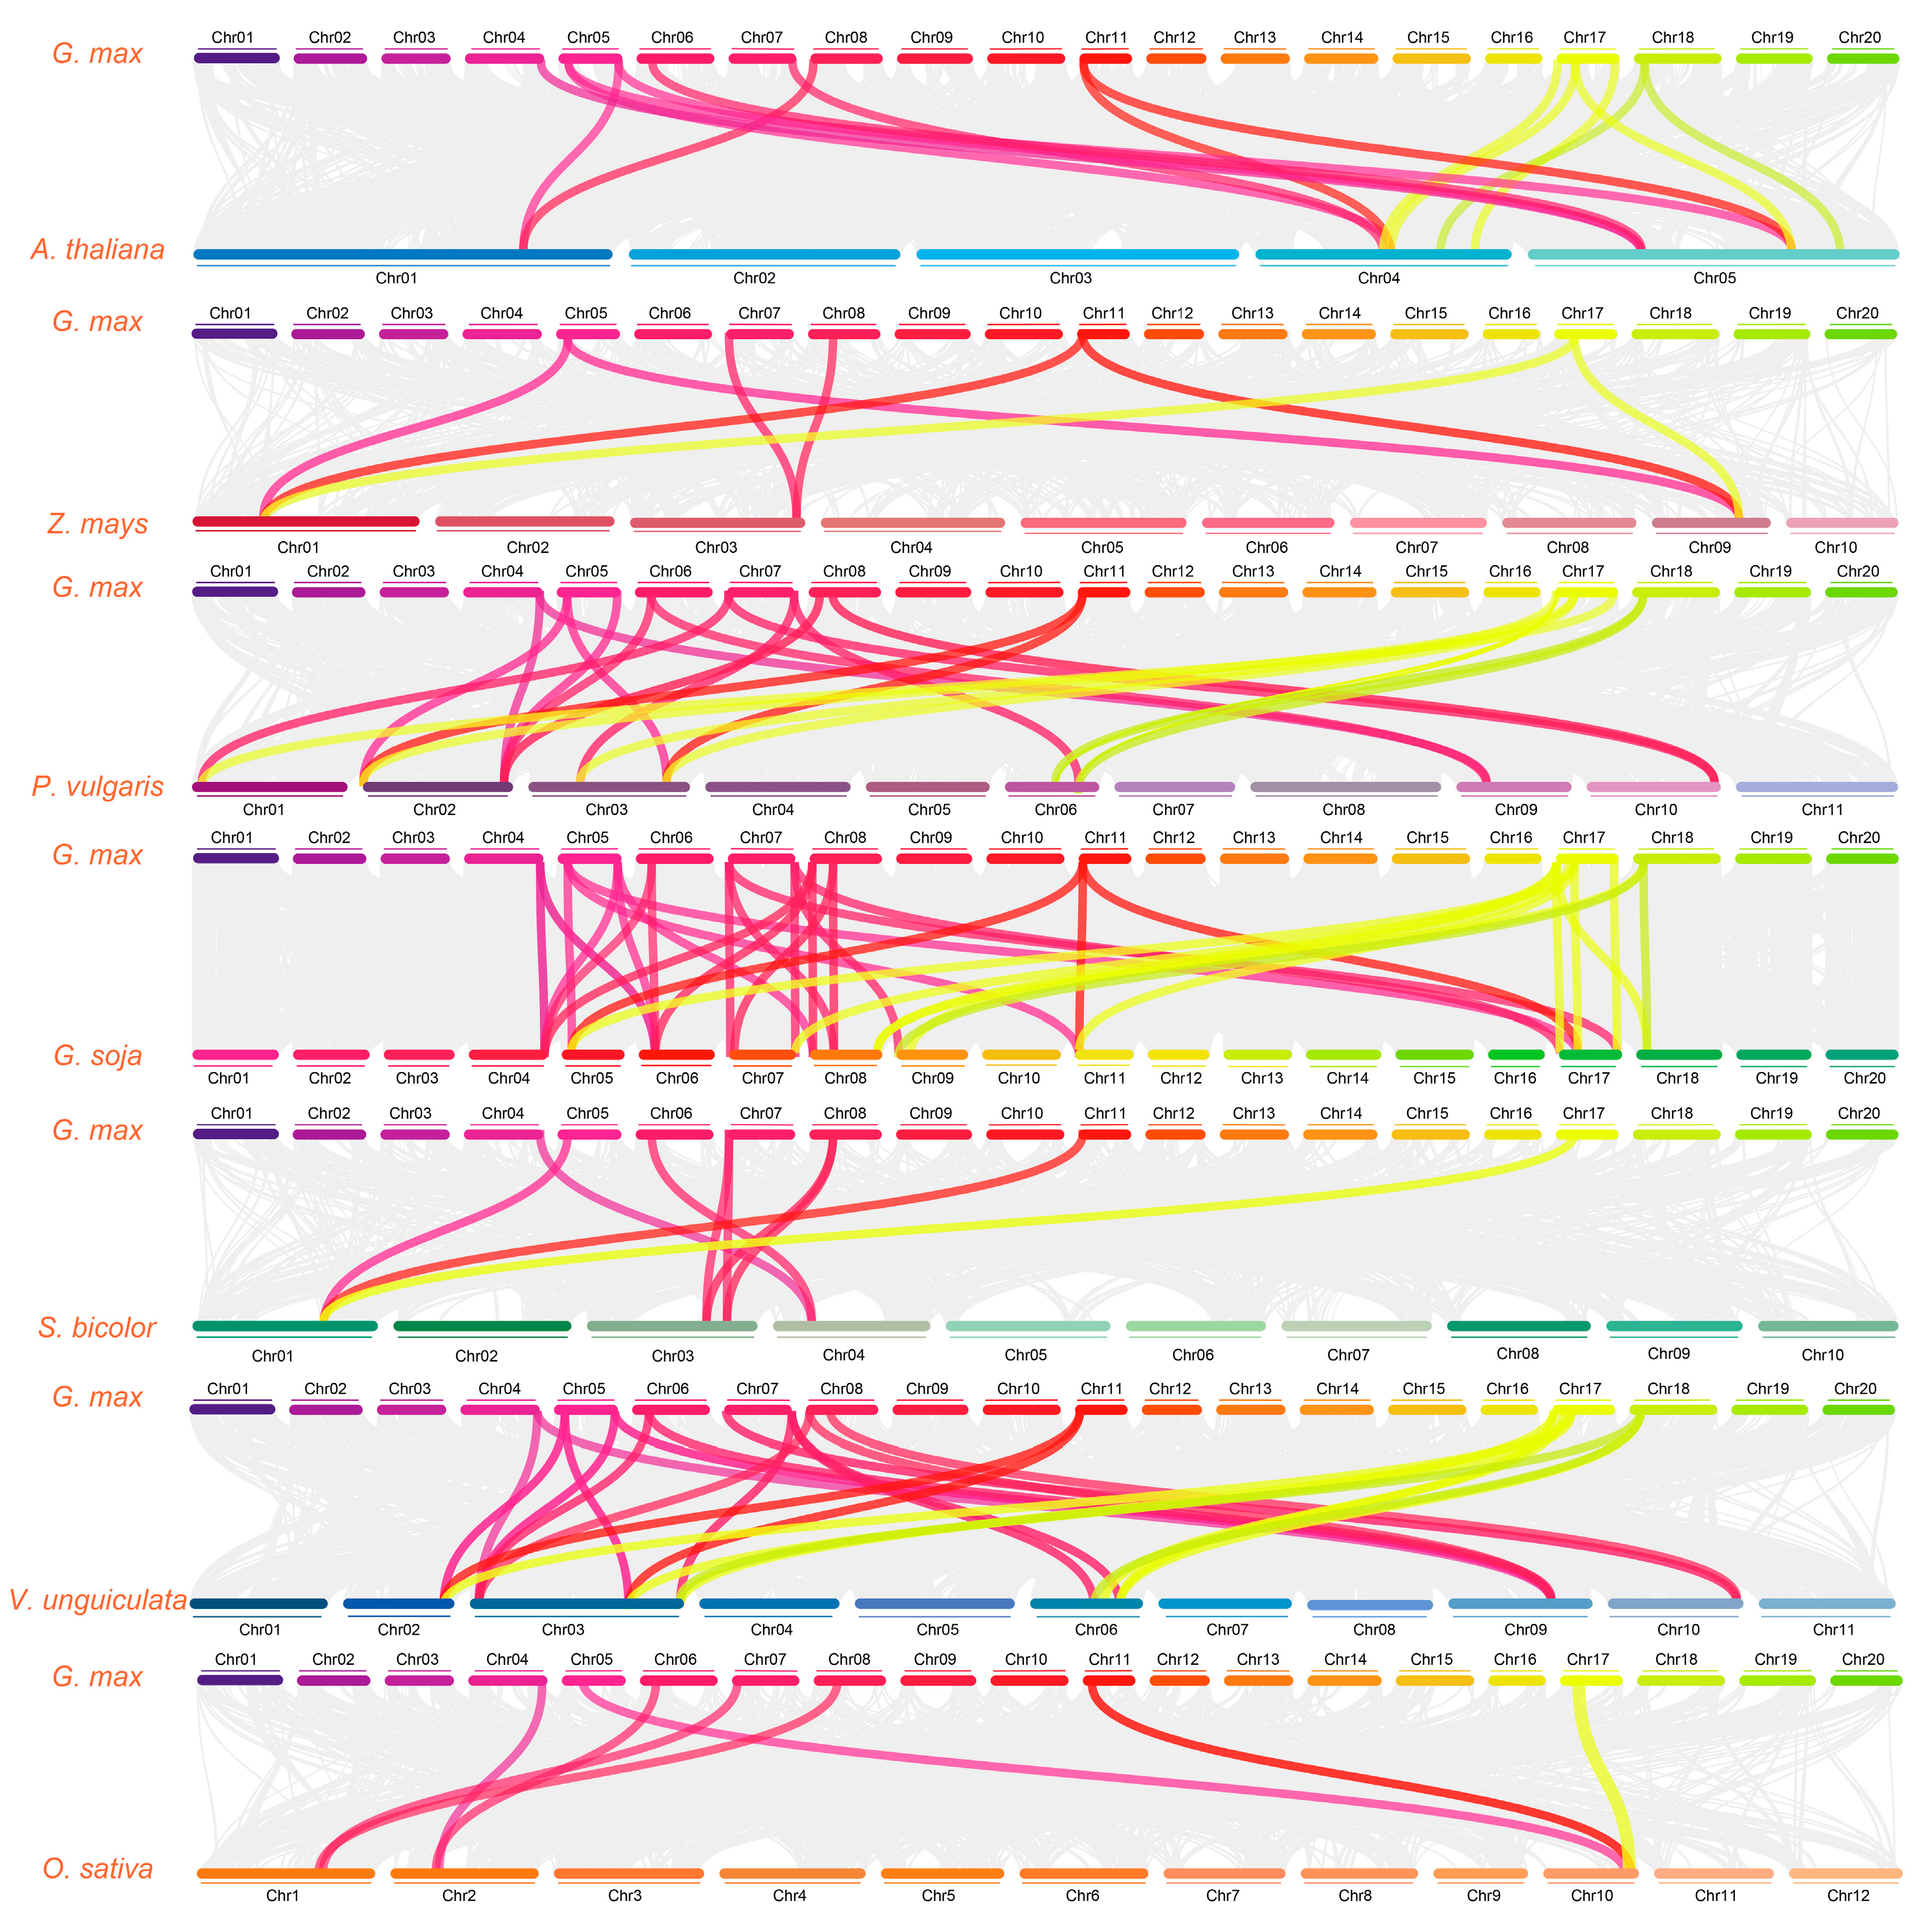
2.8. CBL Gene Synteny Analysis

Collinear relationships among members of the GmCBL gene family and CBL genes encoded by other plants were examined by selecting a diverse range of representative plants including a dicotyledonous plant (A. thaliana), three monocotyledonous plants (Z. mays, S. bicolor, and O. sativa), and three leguminous plants (P. vulgaris, G. soja, and V. unguiculata). A total of 8, 7, 28, 9, 44, 18, and 31 collinear blocks were, respectively, identified in Z. mays, O. sativa, P. vulgaris, S. bicolor, G. soja, A. thaliana, and V. unguiculata. Seven collinear diagrams were established to examine the collinearity between G. max and these representative plants, leading to the identification of homologous gene pairs linked by color-coded lines (Figure 5 and Table S2). Of the 15 GmCBLs identified in this study, 8 did not exhibit collinearity with Z. mays, S. bicolor, or O. sativa, suggesting that these homologous gene pairs may have emerged following the monocot–dicot divergence. Higher numbers of linear collinear genes were observed among leguminous plants, supporting their closer evolutionary relationships as compared to the other groups of plants included in this study.

2.9. Characterization of GmCBL Transcriptional Responses to Abiotic Stress and Hormone Stimulation

Research focused on several model plants has established the essential role that CBL genes play in the regulation of abiotic stress responses [18,38,39]. To test the ability of these GmCBL genes to respond to abiotic stress conditions, changes in the expression of these genes in response to a range of stress conditions, including salt stress (150 mM NaCl), alkaline stress (100 mM NaHCO3), drought stress (200 mM mannitol), and osmotic stress (20% PEG), were assessed (Figure 6). The transcriptional responses of these GmCBLs varied among the groups. Specifically, GmCBL1, GmCBL3, GmCBL5, GmCBL6, GmCBL7, GmCBL8, GmCBL9, GmCBL10, GmCBL11, GmCBL13, and GmCBL14 were expressed at significantly higher levels under salt stress conditions as compared to control conditions, with this effect being most pronounced for GmCBL1. GmCBL1, GmCBL3, GmCBL7, GmCBL8, GmCBL9, GmCBL11, GmCBL12, GmCBL13, and GmCBL14 were significantly upregulated under alkaline stress conditions relative to control conditions, with GmCBL1 again exhibiting robust and rapid upregulation in response to alkaline conditions. Drought stress was associated with a significant upregulation of GmCBL1, GmCBL4, GmCBL6, GmCBL8, GmCBL10, GmCBL11, GmCBL12, and GmCBL14 relative to control conditions, while GmCBL2, GmCBL7, GmCBL10, GmCBL11, GmCBL12, GmCBL13, GmCBL14, and GmCBL15 were significantly upregulated under osmotic stress conditions. CBL gene expression patterns are thus likely associated with the abiotic stress responses engaged by soybean plants, with GmCBL1 in particular holding promise as a potentially vital regulator of saline–alkaline stress responses.
Hormones function as essential chemical messengers in plants that govern diverse processes, including growth and abiotic stress responses [40]. As most of the identified GmCBL genes were predicted to be regulated by hormone-signaling-related cis-acting elements (ABRE, CGTCA, P-box, TATC, TCA, TGA, TGACG, CGTCA) (Figure 3), the transcriptional responses of these genes to hormone treatment (ABA, SA, JA, or BR at 100 μmol L−1) in soybean roots were next evaluated (Figure 7). These genes exhibited a higher degree of variability with respect to how they responded to these different hormone treatments. For instance, GmCBL3, GmCBL7, GmCBL13, GmCBL10, and GmCBL14 exhibited a high degree of JA sensitivity, whereas GmCBL1, GmCBL7, GmCBL10, GmCBL11, and GmCBL13 were highly responsive to ABA. Moreover, GmCBL4, GmCBL5, GmCBL6, GmCBL9, GmCBL10, GmCBL11, GmCBL12, GmCBL14, and GmCBL15 presented with a high degree of BR sensitivity, whereas GmCBL1, GmCBL2, GmCBL3, GmCBL7, GmCBL8, GmCBL13, and GmCBL11 were highly sensitive to SA. The changes in the expression of these different GmCBL genes to particular hormones support the predicted identification of hormone-responsive cis-acting elements within the promoter regions regulating their expression. The correlation analysis of 15 GmCBL genes under different hormone stress and abiotic stress conditions further showed that the highest correlation coefficient between 150 mM NaCl and 100 μmol ABA was 0.52. It is worth noting that there was a negative correlation between 150 mM NaCl and 100 μmol BR (Figure S4).

2.10. GmCBL1 Subcellular Localization and GmCBL1 Overexpression Enhances Soybean Saline–Alkaline Tolerance

Because of the strong and rapid response of the GmCBL1 gene to saline–alkaline stress, the gene was selected for further experiment. The GFP fusion expression vector was constructed to identify the subcellular location of the protein encoded by GmCBL1 and transformed into A. thaliana protoplasts (Figure 8A). Under a confocal microscope, the GFP signal of the control vector could be seen everywhere in the whole protoplast cells, while the GmCBL1-GFP fusion protein signal was located in the cytoplasm (Figure 8B), which was consistent with the predicted results (Table 1). To directly test the functional role of GmCBL1 under conditions of saline–alkaline stress, Agrobacterium rhizogenes transformation was used to establish soybean hairy roots overexpressing GmCBL1 (OHRs), with PCR confirming the identities of 10 positive transgenic plants (Figure S5). To determine how overexpressing GmCBL1 impacts saline–alkaline tolerance in soybean seedlings, 3-week-old CHR and OHR plants were exposed to 0, 75 mM NaCl and 75 mM NaHCO3 for 5 days. The CHR seedlings presented with severe growth inhibition and shrinkage (Figure 9), whereas the GmCBL1-OHR plants exhibited markedly higher levels of saline–alkaline stress resistance, as demonstrated by their longer root length and greater root fresh and dry weight values (Figure 9B–D). To further probe the role that GmCBL1 plays in redox processes, four antioxidant enzyme genes were analyzed, with qPCR analyses being used to probe their expression in GmCBL1-OHR plants under saline–alkaline stress conditions. In this experiment, the antioxidant genes GmSOD1, GmAPX1, GmCAT1, and GmGSH1 were upregulated, as was the GmCPA1 gene encoding a Na+/H+ antiporter.

3. Materials and Methods

3.1. Plant Materials and Treatment Conditions

The DN50 soybean cultivar from the Soybean Breeding Research Center of Northeast Agricultural University (Harbin, Heilongjiang, China) was cultivated in the experimental plantation of Northeast Agricultural University. The effects of abiotic stress conditions on GmCBL expression were assessed using seedlings at the second trifoliolate stage cultivated at 23 ± 2 °C with a 12 h photoperiod. The abiotic stress treatment entailed exposure to solutions of 20% PEG (molecular weight: 6000), 150 mM NaCl, 100 mM NaHCO3, and 200 mmol L−1 mannitol. At 0, 1, 3, 6, 12, and 24 h post treatment, roots were collected from these plants, analyzing untreated roots as a control. Analyses of GmCBL gene expression changes in response to hormone treatment were assessed via the treatment of plants with JA, SA, ABA, or BR at 100 μmol L−1, collecting roots at the same time points as for the abiotic stress treatment. The above experiments were carried out in the indoor greenhouse of Northeast Agricultural University (longitude: 126.727556, dimension: 45.744028).

3.2. Soybean CBL Gene Family Identification

A comprehensive analysis of soybean CBL genes was performed by conducting a BLASTP search against the Phytozome (https://phytozome-next.jgi.doe.gov/, accessed on 10 February 2023) and NCBI (http://www.ncbi.nlm.nih.gov, accessed on 10 February 2023) databases, using CBL sequences from A. thaliana as queries. The retrieved candidate soybean CBLs were genes with an E-value < 10−10 and a >90% sequence identity. The SMART (http://smart.embl.de/, accessed on 10 February 2023) and Pfam (https://www.ebi.ac.uk/interpro/, accessed on 10 February 2023) databases were used for additional validation, confirming that these proteins harbor the essential domains associated with CBL proteins, including PF00036, PF13499, PF13833, and PF13202. Genetic GmCBL characteristics, including coding length, chromosomal location, and protein length, were determined based on the Phytozome database (https://phytozome-next.jgi.doe.gov/, accessed on 20 February 2023). Molecular weights and isoelectric point values for these GmCBLs were determined with the SIB database (https://web.expasy.org/compute_pi/, accessed on 20 February 2023). Predictive CBL protein subcellular localization analyses were performed with the Cell-PLoc tool (http://www.csbio.sjtu.edu.cn/bioinf/Cell-PLoc-2/, accessed on 20 February 2023).

3.3. Evolutionary, Tertiary Structure, Gene Structure, Promoter, Conserved Domain, and Synteny Analyses of GmCBLs

To explore GmCBL evolution, the full-length amino acid sequences of CBL proteins from G. max, Z. mays, A. thaliana, O. sativa, P. vulgaris, G. soja, T. aestivum, V. unguiculata, and S. bicolor underwent ClustalW alignment [41]. MEGA 5.0 was then used to generate an unrooted neighbor-joining phylogenetic tree with 1000 bootstrap replicates [42]. A MEME analysis was used to identify conserved protein motifs in GmCBLs [43]. The Phytozome database was used to determine the genomic locations of GmCBLs, with TBtools being used for visualization [44]. Details pertaining to exon–intron structures were obtained from the G. max GFF file, while the gene structures of GmCBLs were assessed using TBtools [44]. Cis-acting elements within the 2.0 kb promoter region upstream of the ATG start codon for each of these GmCBLs were identified by downloading these promoter sequences from the Phytozome database (https://phytozome-next.jgi.doe.gov//, accessed on 22 February 2023) and then utilizing the PlantCARE database (http://bioinformatics.psb.ugent.be/webtools/plantcare/html//, accessed on 23 February 2023) to predictively identify these cis-acting elements [45,46]. Syntenic blocks among CBL genes from G. max, Z. mays, A. thaliana, O. sativa, G. soja, V. unguiculata, P. vulgaris, and S. bicolor were identified with TBtools [44]. WebLogo (https://weblogo.threeplusone.com//, accessed on 24 February 2023) was used to generate conserved motif logos. The AlphaFold Protein Structure Database (https://alphafold.ebi.ac.uk//, accessed on 4 March 2023) was used to evaluate the GmCBL tertiary structure. Gene IDs and other information pertaining to these CBLs are presented in Table 1 and Supplementary Table S1.

3.4. GmCBL Expression Analyses

Patterns of GmCBL expression in various tissues were analyzed by assessing high-throughput sequencing data available through the Phytozome database (https://phytozome-next.jgi.doe.gov/, accessed on 26 February 2023), with analyzed tissues including the roots, stems, leaves, pods, seeds, and flowers. Data were presented as a hierarchically clustered heatmap generated with TBtools [44], with all expression values having been subjected to log2 transformation and normalization.

3.5. qPCR

Collected samples were homogenized in liquid nitrogen, after which Trizol (Invitrogen, Carlsbad, CA, USA) was used to extract total RNA. Primers specific for the 15 GmCBL genes were generated with the Primer-BLAST tool in Primer 3 Plus (https://www.primer3plus.com/, accessed on 25 March 2023). Three biological replicates per tissue were independently analyzed, with GmACTIN4 serving as a normalization control and the 2−ΔΔCT method being used to quantify gene expression [47]. See Table S3 for further details regarding the utilized primers.

3.6. GmCBL1 Overexpression in Soybean Hairy Roots and Subcellular Localization Assays

Specific primers (Table S3) were used to amplify the GmCBL1 gene from the DN50 soybean cultivar, after which the amplified sequences were integrated into the GFP-tagged pSOY1 vector under the control of the CaMV35S promoter using a high-precision KOD-Plus-Neo polymerase (TOYOBO, Osaka, Japan) [48]. PCR and fluorescence microscopy were used to evaluate the transformation efficiency, selectively removing any non-transgenic hairy roots from seedlings. Transgenic lines exhibiting hairy roots of similar length were selected and treated for 5 days with NaCl (75 mM) or NaHCO3 (75 mM). The fresh root weight and root length were then quantified for these transgenic plants. Over 10 independent hairy root lines were analyzed to ensure these results were reliable, allowing for the comprehensive establishment of how overexpressing GmCBL1 impacts soybean responses to salt stress. A. thaliana mesophyll protoplasts were transfected with Agrobacterium tumefaciens EHA105 strains containing the 35S::GmCBL1-GFP and 35S::GFP constructs and subsequently subjected to subcellular localization analysis after a 3-day incubation period.

3.7. Statistical Analyses

At least three biological replicates were analyzed for all the data, which are presented as means ± standard deviation (SD). The relationship between plant hormone and abiotic stress was analyzed by R-studio (RStudio-2023.12.1) correlation analysis [49]. SPSS 22.0 was used to analyze all the data via Student’s t-tests.

4. Discussion

Through the phylogenetic tree construction of 103 CBL proteins from different plants (Figure 1 and Figure S2), we found the existence of this protein in G. max, Z. mays, A. thaliana, and other plants. This shows that CBL proteins are widely distributed in various higher plants, and according to their distribution in different subfamilies, we can infer that CBL proteins play an important role in the evolution of higher plants. Here, a comprehensive analysis of the soybean genome led to the identification of 15 putative CBL genes (Table 1). These genes were categorized into five phylogenetic branches, suggesting some degree of functional divergence among these related family members over the course of G. max’s evolution (Figure 1A). Comparative analyses of nine species revealed that the numbers of CBL genes varied significantly across the species, with the GmCBL gene family being the largest CBL gene family among the analyzed leguminous plant species (Figure S1). The sizes of the encoded GmCBL proteins were highly conserved, ranging from 24.4 to 30.65 kDa. This aligns well with what has been reported in A. thaliana, with AtCBLs ranging from 24.41 to 29.35 kDa in size (Table 1 and Table S1). The 15 GmCBLs exhibited only limited variations in terms of nucleotide sequence length, isoelectric point, and molecular weight, although they did vary in terms of their localization to particular intracellular compartments, consistent with their potential differential functions (Table 1). Through the study of the gene structure, we found that an intron structure widely exists in GmCBL genes, and different GmCBL genes contain different intron regions (Figure 1B), which may affect the function and expression of genes, thus affecting plant growth and development and environmental stress. Multiple sequence alignment results indicated that 11 of these GmCBLs harbor C-terminal FPSF motifs (Figure 4A). Of note is the fact that the serine residues present in these FPSF motifs can be phosphorylated by CIPKs [16], supporting the potential existence of a CBL-CIPK signaling network in soybean tissues. Soybean plant tolerance has been demonstrated to be strongly dependent on N-myristoylation [17]. Intriguingly, potential N-terminal myristoylated MGCXXSK/T motifs were detected in GmCBL1, GmCBL2, GmCBL4, GmCBL11, and GmCBL13 in this study, consistent with their potential ability to regulate salt tolerance (Figure 4A). The high degree of motif conservation among these GmCBLs further emphasizes their close phylogenetic relationships [50]. All 15 GmCBL genes exhibit conserved motifs 1, 2, 3, 4, and 6, suggesting a potential significant biological function within the protein family. Despite evolutionary divergence among family members, these five motifs remain highly conserved, facilitating similar biological functions across various tissues for the 15 GmCBL genes. (Figure 2A). However, additional research will be essential to clarify the molecular functions of these particular motifs. In contrast, motif 10 was only found to be present in GmCBL5 and GmCBL8, suggesting that it may exert a more unique biological function (Figure 2A). Future studies aimed at elucidating the specific contributions of these motifs to the GmCBL gene family functional diversity are thus warranted.
The CBL gene family has been demonstrated to be characterized by duplication events in many species. Here, 13 such instances of fragment duplication were observed in the GmCBL family (Figure 1C), as compared to 7 fragment duplication events and one tandem repeat event reported in pecan [51]. However, this absence of any apparent tandem repeat events in the GmCBL family is consistent with the CBL gene families reported in pepper [52] and cotton plants [53]. This suggests that fragmental duplication, rather than tandem duplication, is likely the main driver of GmCBL gene expansion. Analyses of interspecific collinearity highlighted pronounced patterns, with the greatest collinearity being detected between the G. soja GsCBL and GmCBL gene families, followed by the V. unguiculata VuCBL gene family (Figure 5). The lowest levels of collinearity were observed when assessing the Z. mays and O. sativa CBL gene families, highlighting the evolutionary divergence of these families of related orthologous genes across species. The higher levels of collinearity between GmCBLs and CBLs encoded by other leguminous plants provide further confirmation of their close phylogenetic relationships. Strikingly, GmCBL2 and GmCBL11 exhibited collinearity with S. bicolor, A. thaliana, O. sativa, Z. mays, P. vulgaris, V. unguiculata, and G. soja (Table S2), suggesting the potential emergence of these genes prior to the evolutionary divergence of these species and underscoring their conservation.
The structures and functions of plant gene promoters are inextricably linked with one another [54]. The promoters of GmCBLs were found to harbor a wide range of cis-acting elements, emphasizing the ability of these genes to respond to diverse internal and external factors (Figure 3). Of note is the fact that these genes were found to harbor many regulatory elements associated with responses to hormones and abiotic stressors, supporting the ability of GmCBLs to be subject to hormone-mediated regulation and to play an active role in abiotic stress responses, as has been reported previously in other species [55,56]. For instance, hormone- and abiotic-stress-responsive elements have been detected upstream of members of the MtCBL and MsCBL gene families, including LTR, ABA, MBS, and ARE elements [57]. The high numbers of elements associated with responses to ABA, SA, GA, MeJA, cold, and drought conditions upstream of GmCBLs suggests the potentially central role that these genes may play as coordinators of hormone signaling and stress responses. GmCBL1 was identified as a target of particular interest, harboring several GA, SA, ABA, MeJA, and stress-response-associated elements. GmCBL1 exhibits homology to SOS3, which is a reported enhancer of plant salt tolerance [58], further bolstering the likelihood that it can respond to a range of hormones and stressors. Meristem expression elements were also found to be enriched upstream of the GmCBL1, GmCBL3, GmCBL5, GmCBL11, and GmCBL14 genes, which were expressed at high levels in mature tissues, indicating that the proteins they may encode may play important functional roles in the plant meristem compartment. This is consistent with interactions between CBL4 and CIPK25 reported previously in the root meristem compartment [59]. Changes in the expression profiles of particular genes over the course of plant growth can yield insight into their functional roles. Interactions between CBL9 and CIPK in A. thaliana, for example, have been found to regulate ABA responses during seed germination [60]. Maize ZmCBLs other than ZmCBL6 have also been identified as regulators of seed germination and early seedling growth [61]. Here, diverse patterns of GmCBL gene expression were observed across tissues, emphasizing the functionally distinct roles that they play in soybean plants (Figure 4B). High GmCBL3 and GmCBL11 expression levels were only detected in flowers, indicating that they may help to control flowering time. GmCBL10 and GmCBL7, in contrast, were specifically highly expressed in seeds, such that they may act as key regulators of seed development. As four GmCBL genes were expressed primarily in roots, they may act to govern root development and signal transduction activity. Similar to the interaction of CBL and CIPK25 in A. thaliana, these GmCBLs likely act in part to control auxin and cytokinin signaling in the context of root meristem development [59].
Recently, a wealth of evidence has emphasized the important role that CBL genes play as regulators of plant abiotic stress responses [62]. For instance, overexpressing CBL4 in pigeon pea has been linked to enhanced salt stress, drought stress, and abnormal temperature resistance [63], while the NtCBL gene in Nicotiana tabacum has been established as a regulator of drought and salt stress responses [64]. Accordingly, the responsivity of GmCBL expression to various abiotic stressors was probed in greater detail. The differential patterns of expression for these 15 GmCBLs in response to salt, drought, and alkaline stress conditions offered support for the roles that these genes play in response to abiotic stressors (Figure 6). Most of these GmCBLs were upregulated in response to salt and alkaline stress, although GmCBL2, GmCBL5, and GmCBL15 were significantly downregulated under these conditions, such that they may serve as negative regulators of these stress responses. As the promoters upstream of these genes harbor multiple stress- and hormone-responsive cis-acting elements, and as many of these genes were upregulated in response to salt and alkaline stress, this suggested that they function as active mediators of resistance to these stressors. Notably, GmCBL1 was rapidly upregulated, beginning within 1 h of exposure to saline–alkaline conditions, suggesting it may act as a particularly robust regulator under these conditions conducive to greater stress tolerance. CBL family members have previously been shown to be highly responsive to myriad hormone signals [18]. Consistently, ABA treatment was associated with a marked upregulation of several of these GmCBLs (Figure 7). The vacuolar-membrane-localized AtCBL2, which exhibits characteristic S-acylation, has been established as an essential regulator of plant cell responses to ABA [18]. GmCBL1 was selected as a representative member of this gene family for further studies aimed at elucidating its intracellular functions under saline–alkaline stress conditions. Overexpressing GmCBL1 markedly enhanced the tolerance of transgenic soybean plants for saline–alkaline stress conditions, as confirmed by increases in root length and root weight (Figure 9). Ca2+ ion signaling within cells has been established as an important regulator of cellular redox status [65]. GmCBL1-OHR plants exhibited significant increases in antioxidant- and redox-related genes, similarly supporting a role for GmCBL1 as a regulator of redox homeostasis. The Na+/H+ transporter complex has also been shown to shape the ability of plants to tolerate saline conditions [66]. Significantly increased GmCPA1 gene expression was observed in the transgenic plants overexpressing GmCBL1, suggesting that this CBL family member may augment tolerance to saline–alkaline stress, at least in part by controlling Na+ accumulation within soybean cells. When soybean is faced with high salt stress, it responds to the challenge by calcium ion signal transmission (Figure 10). GmCBL1 protein plays an important role in this process. It can specifically recognize calcium signals and form a protein complex with CIPK. This complex plays a role in the underground part of soybean and regulates the expression of related proteins. The mechanism of this complex includes two aspects: First, it regulates the clearance of ROS by enhancing the expression of antioxidant enzymes, thereby alleviating salt-induced oxidative stress, reducing cell oxidative damage, and maintaining ROS homeostasis (Figure 9F–I). Secondly, it selectively enhances the expression of Na+/H+ transporters to regulate the homeostasis of Na+ ions in cells (Figure 9E). In summary, these GmCBL genes are inducible in response to both hormones and abiotic stress conditions, and GmCBL1 exhibits a potent and rapid response to saline and alkaline stress conditions.

5. Conclusions

In conclusion, these analyses led to the identification of 15 putative CBL genes encoded in the soybean genome that were grouped into five phylogenetic subfamilies. The observed variability in the patterns of expression of these GmCBL genes, particularly under abiotic stress and hormone treatment conditions, emphasizes the specific and varied regulatory roles of these factors. GmCBL1 was found to exhibit particularly robust transcriptional responses to saline and alkaline stress conditions, suggesting that it may function as an important regulator of saline–alkaline stress tolerance. These results enrich the current understanding of the soybean CBL gene family, yielding new insights into the functional diversity of these proteins with potential implications for their roles as mediators of soybean plant stress tolerance.

Supplementary Materials

The following supporting information can be downloaded at: https://www.mdpi.com/article/10.3390/plants13101304/s1, Figure S1: Numbers of CBL genes in nine plant species; Figure S2: Phylogenetic tree analysis of CBL gene family; Figure S3: Soybean CBL gene chromosomal locations; Figure S4: Correlation analysis of hormone stress and abiotic stress; Figure S5: Identification of GmCBL1 transgenic soybean hair roots; Table S1: Details of 103 identified CBL genes; Table S2: Collinear gene pairs of CBLs in eight species; Table S3: Primers used in this study; Table S4: Motif sequences identified by MEME tool.

Author Contributions

Conceptualization, J.W.; methodology, F.J. and Y.C.; software, Y.C.; validation, D.Z.; formal analysis, F.J.; investigation, F.J., Y.C. and D.Z.; resources, F.J.; data curation, F.J.; writing—original draft preparation, F.J.; writing—review and editing, F.J.; visualization, F.J.; supervision, J.W.; project administration, J.W. All authors have read and agreed to the published version of the manuscript.

Funding

This research received no external funding.

Data Availability Statement

Data are contained within the article and Supplementary Materials.

Conflicts of Interest

There are no conflicts of interests for the authors.

References

  1. Pagano, M.; Miransari, M. The Importance of Soybean Production Worldwide; Academic Press: New York, NY, USA, 2016; pp. 1–26. [Google Scholar]
  2. Cao, D.; Li, Y.; Liu, B.; Kong, F.; Tran, L.-S.P. Adaptive Mechanisms of Soybean Grown on Salt-Affected Soils. Land. Degrad. Dev. 2018, 29, 1054–1064. [Google Scholar] [CrossRef]
  3. Joshi, S.; Nath, J.; Singh, A.K.; Pareek, A.; Joshi, R. Ion transporters and their regulatory signal transduction mechanisms for salinity tolerance in plants. Physiol. Plant. 2022, 174, e13702. [Google Scholar] [CrossRef]
  4. Choi, W.-G.; Toyota, M.; Kim, S.-H.; Hilleary, R.; Gilroy, S. Salt stress-induced Ca2+ waves are associated with rapid, long-distance root-to-shoot signaling in plants. Proc. Natl. Acad. Sci. USA 2014, 111, 6497–6502. [Google Scholar] [CrossRef]
  5. Knight, H.; Trewavas, A.J.; Knight, M.R. Calcium signalling in Arabidopsis thaliana responding to drought and salinity. Plant J. 1997, 12, 1067–1078. [Google Scholar] [CrossRef]
  6. Lecourieux, D.; Ranjeva, R.; Pugin, A. Calcium in plant defence-signalling pathways. New Phytol. 2006, 171, 249–269. [Google Scholar] [CrossRef]
  7. Hepler, P.K. Calcium: A Central Regulator of Plant Growth and Development. Plant Cell 2005, 17, 2142–2155. [Google Scholar] [CrossRef]
  8. Jiang, Z.; Zhou, X.; Tao, M. Plant cell-surface GIPC sphingolipids sense salt to trigger Ca(2+) influx. Nature 2019, 572, 341–346. [Google Scholar] [CrossRef]
  9. Aldon, D.; Mbengue, M.; Mazars, C.; Galaud, J.-P. Calcium Signalling in Plant Biotic Interactions. Int. J. Mol. Sci. 2018, 19, 665. [Google Scholar] [CrossRef]
  10. Zhu, K.; Chen, F.; Liu, J.; Chen, X.; Hewezi, T.; Cheng, Z.-M. Evolution of an intron-poor cluster of the CIPK gene family and expression in response to drought stress in soybean. Sci. Rep. 2016, 6, 28225. [Google Scholar] [CrossRef]
  11. Shi, J.; Kim, K.N.; Ritz, O.; Albrecht, V.; Gupta, R.; Harter, K.; Luan, S.; Kudla, J. Novel protein kinases associated with calcineurin B-like calcium sensors in Arabidopsis. Plant Cell 1999, 11, 2393–2405. [Google Scholar]
  12. Kudla, J.; Xu, Q.; Harter, K.; Gruissem, W.; Luan, S. Genes for calcineurin B-like proteins in Arabidopsis are differentially regulated by stress signals. Proc. Natl. Acad. Sci. USA 1999, 96, 4718–4723. [Google Scholar] [CrossRef]
  13. Nagae, M.; Nozawa, A.; Koizumi, N.; Sano, H.; Hashimoto, H.; Sato, M.; Shimizu, T. The crystal structure of the novel calcium-binding protein AtCBL2 from Arabidopsis thaliana. J. Biol. Chem. 2003, 278, 42240–42246. [Google Scholar] [CrossRef] [PubMed]
  14. Xiang, Y.; Huang, Y.; Xiong, L. Characterization of Stress-Responsive CIPK Genes in Rice for Stress Tolerance Improvement. Plant Physiol. 2007, 144, 1416–1428. [Google Scholar] [CrossRef]
  15. Gifford, J.L.; Walsh, M.P.; Vogel, H.J. Structures and metal-ion-binding properties of the Ca2+-binding helix-loop-helix EF-hand motifs. Biochem. J. 2007, 405, 199–221. [Google Scholar] [CrossRef]
  16. Du, W.; Lin, H.; Chen, S.; Wu, Y.; Zhang, J.; Fuglsang, A.T.; Palmgren, M.G.; Wu, W.; Guo, Y. Phosphorylation of SOS3-Like Calcium-Binding Proteins by Their Interacting SOS2-Like Protein Kinases Is a Common Regulatory Mechanism in Arabidopsis. Plant Physiol. 2011, 156, 2235–2243. [Google Scholar] [CrossRef] [PubMed]
  17. Ishitani, M.; Liu, J.; Halfter, U.; Kim, C.-S.; Shi, W.; Zhu, J.-K. SOS3 Function in Plant Salt Tolerance Requires N-Myristoylation and Calcium Binding. Plant Cell 2000, 12, 1667–1677. [Google Scholar] [CrossRef]
  18. Ma, X.; Li, Q.-H.; Yu, Y.-N.; Qiao, Y.-M.; Haq, S.u.; Gong, Z.-H. The CBL–CIPK Pathway in Plant Response to Stress Signals. Int. J. Mol. Sci. 2020, 21, 5668. [Google Scholar] [CrossRef] [PubMed]
  19. Luan, S. The CBL-CIPK network in plant calcium signaling. Trends Plant Sci. 2009, 14, 37–42. [Google Scholar] [CrossRef]
  20. Albrecht, V.; Ritz, O.; Linder, S.; Harter, K.; Kudla, J. The NAF domain defines a novel protein-protein interaction module conserved in Ca2+-regulated kinases. EMBO J. 2001, 20, 1051–1063. [Google Scholar] [CrossRef] [PubMed]
  21. Kolukisaoglu, U.N.; Weinl, S.; Blazevic, D.; Batistic, O.; Kudla, J.R. Calcium Sensors and Their Interacting Protein Kinases: Genomics of the Arabidopsis and Rice CBL-CIPK Signaling Networks. Plant Physiol. 2004, 134, 43–58. [Google Scholar] [CrossRef]
  22. Qiu, Q.S.; Guo, Y.; Dietrich, M.A.; Schumaker, K.S.; Zhu, J.K. Regulation of SOS1, a plasma membrane Na+/H+ exchanger in Arabidopsis thaliana, by SOS2 and SOS3. Proc. Natl. Acad. Sci. USA 2002, 99, 8436–8441. [Google Scholar] [CrossRef]
  23. Halfter, U.; Ishitani, M.; Zhu, J.K. The Arabidopsis SOS2 protein kinase physically interacts with and is activated by the calcium-binding protein SOS3. Proc. Natl. Acad. Sci. USA 2000, 97, 3735–3740. [Google Scholar] [CrossRef]
  24. Quintero, F.J.; Ohta, M.; Shi, H.; Zhu, J.K.; Pardo, J.M. Reconstitution in yeast of the Arabidopsis SOS signaling pathway for Na+ homeostasis. Proc. Natl. Acad. Sci. USA 2002, 99, 9061–9066. [Google Scholar] [CrossRef]
  25. Cheong, Y.H.; Kim, K.-N.; Pandey, G.K.; Gupta, R.; Grant, J.J.; Luan, S. CBL1, a Calcium Sensor That Differentially Regulates Salt, Drought, and Cold Responses in Arabidopsis. Plant Cell 2003, 15, 1833–1845. [Google Scholar] [CrossRef] [PubMed]
  26. Albrecht, V.; Weinl, S.; Blazevic, D.; D’Angelo, C.; Batistic, O.; Kolukisaoglu, Ü.; Bock, R.; Schulz, B.; Harter, K.; Kudla, J. The calcium sensor CBL1 integrates plant responses to abiotic stresses. Plant J. 2003, 36, 457–470. [Google Scholar] [CrossRef]
  27. Cheong, Y.H.; Sung, S.J.; Kim, B.-G.; Pandey, G.K.; Cho, J.-S.; Kim, K.-N.; Luan, S. Constitutive overexpression of the calcium sensor CBL5 confers osmotic or drought stress tolerance in Arabidopsis. Mol. Cells 2010, 29, 159–165. [Google Scholar] [CrossRef]
  28. Zhang, F.; Li, L.; Jiao, Z.; Chen, Y.; Liu, H.; Chen, X.; Fu, J.; Wang, G.; Zheng, J. Characterization of the calcineurin B-Like (CBL) gene family in maize and functional analysis of ZmCBL9 under abscisic acid and abiotic stress treatments. Plant Sci. 2016, 253, 118–129. [Google Scholar] [CrossRef] [PubMed]
  29. Plasencia, F.A.; Estrada, Y.; Flores, F.B.; Ortíz-Atienza, A.; Lozano, R.; Egea, I. The Ca2+ Sensor Calcineurin B–Like Protein 10 in Plants: Emerging New Crucial Roles for Plant Abiotic Stress Tolerance. Front. Plant Sci. 2021, 11, 599944. [Google Scholar] [CrossRef]
  30. Mähs, A.; Steinhorst, L.; Han, J.P.; Shen, L.K.; Wang, Y.; Kudla, J. The calcineurin B-like Ca2+ sensors CBL1 and CBL9 function in pollen germination and pollen tube growth in Arabidopsis. Mol. Plant 2013, 6, 1149–1162. [Google Scholar] [CrossRef]
  31. Gu, Z.; Meng, D.; Yang, Q.; Yuan, H.; Wang, A.; Li, W.; Chen, Q.; Zhang, Y.; Wang, D.; Li, T. A CBL gene, MdCBL5, controls the calcium signal and influences pollen tube growth in apple. Tree Genet. Genomes 2015, 11, 27. [Google Scholar] [CrossRef]
  32. Tang, R.-J.; Liu, H.; Yang, Y.; Yang, L.; Gao, X.-S.; Garcia, V.J.; Luan, S.; Zhang, H.-X. Tonoplast calcium sensors CBL2 and CBL3 control plant growth and ion homeostasis through regulating V-ATPase activity in Arabidopsis. Cell Res. 2012, 22, 1650–1665. [Google Scholar] [CrossRef]
  33. Eckert, C.; Offenborn, J.N.; Heinz, T.; Armarego-Marriott, T.; Schültke, S.; Zhang, C.; Hillmer, S.; Heilmann, M.; Schumacher, K.; Bock, R.; et al. The vacuolar calcium sensors CBL2 and CBL3 affect seed size and embryonic development in Arabidopsis thaliana. Plant J. 2014, 78, 146–156. [Google Scholar] [CrossRef] [PubMed]
  34. Zhang, H.; Yang, B.; Liu, W.-Z.; Li, H.; Wang, L.; Wang, B.; Deng, M.; Liang, W.; Deyholos, M.K.; Jiang, Y.-Q. Identification and characterization of CBL and CIPK gene families in canola (Brassica napus L.). BMC Plant Biol. 2014, 14, 8. [Google Scholar] [CrossRef] [PubMed]
  35. Xi, Y.; Liu, J.; Dong, C.; Cheng, Z.-M. The CBL and CIPK Gene Family in Grapevine (Vitis vinifera): Genome-Wide Analysis and Expression Profiles in Response to Various Abiotic Stresses. Front. Plant Sci. 2017, 8, 978. [Google Scholar] [CrossRef]
  36. Schmutz, J.; Cannon, S.B.; Schlueter, J.; Ma, J.; Mitros, T.; Nelson, W.; Hyten, D.L.; Song, Q.; Thelen, J.J.; Cheng, J.; et al. Genome sequence of the palaeopolyploid soybean. Nature 2010, 463, 178–183. [Google Scholar] [CrossRef]
  37. Li, R.; Zhang, J.; Wei, J.; Wang, H.; Wang, Y.; Ma, R. Functions and Mechanisms of the Cbl–Cipk Signaling System in Plant Response to Abiotic Stress. Prog. Nat. Sci. 2009, 19, 667–676. [Google Scholar] [CrossRef]
  38. Chen, L.; Wang, Q.-Q.; Zhou, L.; Ren, F.; Li, D.-D.; Li, X.-B. Arabidopsis Cbl-Interacting Protein Kinase (Cipk6) Is Involved in Plant Response to Salt/Osmotic Stress and Aba. Mol. Biol. Rep. 2013, 40, 4759–4767. [Google Scholar] [CrossRef]
  39. Sánchez-Barrena, M.J.; Martínez-Ripoll, M.; Albert, A. Structural Biology of a Major Signaling Network That Regulates Plant Abiotic Stress: The Cbl-Cipk Mediated Pathway. Int. J. Mol. Sci. 2013, 14, 5734–5749. [Google Scholar] [CrossRef]
  40. Waadt, R.; Seller, C.A.; Hsu, P.-K.; Takahashi, Y.; Munemasa, S.; Schroeder, J.I. Plant Hormone Regulation of Abiotic Stress Responses. Nat. Rev. Mol. Cell Biol. 2022, 23, 680–694. [Google Scholar] [CrossRef]
  41. Thompson, J.D.; Gibson, T.J.; Higgins, D.G. Multiple Sequence Alignment Using Clustalw and Clustalx. Curr. Protoc. Bioinform. 2002, 2–3. [Google Scholar] [CrossRef]
  42. Edgar, R.C. Muscle: Multiple Sequence Alignment with High Accuracy and High Throughput. Nucleic Acids Res. 2004, 32, 1792–1797. [Google Scholar] [CrossRef] [PubMed]
  43. Bailey, T.L.; Boden, M.; Buske, F.A.; Frith, M.; Grant, C.E.; Clementi, L.; Ren, J.; Li, W.W.; Noble, W.S. Meme Suite: Tools for Motif Discovery and Searching. Nucleic Acids Res. 2009, 37, W202–W208. [Google Scholar] [CrossRef] [PubMed]
  44. Chen, C.; Chen, H.; Zhang, Y.; Thomas, H.R.; Frank, M.H.; He, Y.; Xia, R. Tbtools: An Integrative Toolkit Developed for Interactive Analyses of Big Biological Data. Mol. Plant 2020, 13, 1194–1202. [Google Scholar] [CrossRef]
  45. Zhang, B.; Liu, Z.; Zhou, R.; Cheng, P.; Li, H.; Wang, Z.; Liu, Y.; Li, M.; Zhao, Z.; Hu, Z.; et al. Genome-Wide Analysis of Soybean Dnaja-Family Genes and Functional Characterization of Gmdnaja6 Responses to Saline and Alkaline Stress. Crop J. 2023, 11, 1230–1241. [Google Scholar] [CrossRef]
  46. Li, M.; Hou, L.; Liu, S.; Zhang, C.; Yang, W.; Pang, X.; Li, Y. Genome-Wide Identification and Expression Analysis of Nac Transcription Factors in Ziziphus jujuba Mill. Reveal Their Putative Regulatory Effects on Tissue Senescence and Abiotic Stress Responses. Ind. Crops Prod. 2021, 173, 114093. [Google Scholar] [CrossRef]
  47. Livak, K.J.; Schmittgen, T.D. Analysis of Relative Gene Expression Data Using Real-Time Quantitative Pcr and the 2−Δδct Method. Methods 2001, 25, 402–408. [Google Scholar] [CrossRef]
  48. Tóth, K.; Batek, J.; Stacey, G. Generation of Soybean (Glycine max) Transient Transgenic Roots. Curr. Protoc. Plant Biol. 2016, 1, 1–13. [Google Scholar] [CrossRef] [PubMed]
  49. Ginestet, C. Ggplot2: Elegant Graphics for Data Analysis. J. R. Stat. Soc. Ser. A Stat. Soc. 2011, 174, 245–246. [Google Scholar] [CrossRef]
  50. Zhang, S.; Xu, R.; Gao, Z.; Chen, C.; Jiang, Z.; Shu, H. A Genome-Wide Analysis of the Expansin Genes in Malus × domestica. Mol. Genet. Genom. 2014, 289, 225–236. [Google Scholar] [CrossRef] [PubMed]
  51. Zhu, K.; Fan, P.; Liu, H.; Tan, P.; Ma, W.; Mo, Z.; Zhao, J.; Chu, G.; Peng, F. Insight into the Cbl and Cipk Gene Families in Pecan (Carya illinoinensis): Identification, Evolution and Expression Patterns in Drought Response. BMC Plant Biol. 2022, 22, 221. [Google Scholar] [CrossRef]
  52. Ma, X.; Gai, W.-X.; Qiao, Y.-M.; Ali, M.; Wei, A.-M.; Luo, D.-X.; Li, Q.-H.; Gong, Z.-H. Identification of CBL and CIPK gene families and functional characterization of CaCIPK1 under Phytophthora capsici in pepper (Capsicum annuum L.). BMC Genom. 2019, 20, 775. [Google Scholar] [CrossRef] [PubMed]
  53. Lu, T.; Zhang, G.; Sun, L.; Wang, J.; Hao, F. Genome-wide identification of CBL family and expression analysis of CBLs in response to potassium deficiency in cotton. PeerJ 2017, 5, e3653. [Google Scholar] [CrossRef]
  54. Villao-Uzho, L.; Chávez-Navarrete, T.; Pacheco-Coello, R.; Sánchez-Timm, E.; Santos-Ordóñez, E. Plant Promoters: Their Identification, Characterization, and Role in Gene Regulation. Genes 2023, 14, 1226. [Google Scholar] [CrossRef] [PubMed]
  55. Sun, T.; Wang, Y.; Wang, M.; Li, T.; Zhou, Y.; Wang, X.; Wei, S.; He, G.; Yang, G. Identification and comprehensive analyses of the CBL and CIPK gene families in wheat (Triticum aestivum L.). BMC Plant Biol. 2015, 15, 269. [Google Scholar] [CrossRef]
  56. Jiang, M.; Zhao, C.; Zhao, M.; Li, Y.; Wen, G. Phylogeny and Evolution of Calcineurin B-Like (CBL) Gene Family in Grass and Functional Analyses of Rice CBLs. J. Plant Biol. 2020, 63, 117–130. [Google Scholar] [CrossRef]
  57. Du, W.; Yang, J.; Ma, L.; Su, Q.; Pang, Y. Identification and Characterization of Abiotic Stress Responsive CBL-CIPK Family Genes in Medicago. Int. J. Mol. Sci. 2021, 22, 4634. [Google Scholar] [CrossRef] [PubMed]
  58. Yan, J.; Yang, L.; Liu, Y.; Zhao, Y.; Han, T.; Miao, X.; Zhang, A. Calcineurin B-like protein 5 (SiCBL5) in Setaria italica enhances salt tolerance by regulating Na+ homeostasis. Crop J. 2022, 10, 234–242. [Google Scholar] [CrossRef]
  59. Kumar Meena, M.; Kumar Vishwakarma, N.; Tripathi, V.; Chattopadhyay, D. CBL-interacting protein kinase 25 contributes to root meristem development. J. Exp. Bot. 2018, 70, 133–147. [Google Scholar] [CrossRef]
  60. Pandey, G.K.; Grant, J.J.; Cheong, Y.H.; Kim, B.G.; Li, G.; Luan, S. Calcineurin-B-like protein CBL9 interacts with target kinase CIPK3 in the regulation of ABA response in seed germination. Mol. Plant 2008, 1, 238–248. [Google Scholar] [CrossRef]
  61. Wang, C.; Yuan, Z.; Li, S.; Wang, W.; Xue, R.; Tai, F. Characterization of eight CBL genes expressions in maize early seeding development. Acta Physiol. Plant. 2014, 36, 3307–3314. [Google Scholar] [CrossRef]
  62. Ketehouli, T.; Idrice Carther, K.F.; Noman, M.; Wang, F.-W.; Li, X.-W.; Li, H.-Y. Adaptation of Plants to Salt Stress: Characterization of Na+ and K+ Transporters and Role of CBL Gene Family in Regulating Salt Stress Response. Agronomy 2019, 9, 687. [Google Scholar] [CrossRef]
  63. Song, Z.; Dong, B.; Yang, Q.; Niu, L.; Li, H.; Cao, H.; Amin, R.; Meng, D.; Yujie, F. Screening of CBL genes in pigeon pea with focus on the functional analysis of CBL4 in abiotic stress tolerance and flavonoid biosynthesis. Environ. Exp. Bot. 2020, 177, 104102. [Google Scholar] [CrossRef]
  64. Mao, J.; Yuan, G.; Han, K.; Xiang, H.; Zeng, W.; Visser, R.G.F.; Bai, Y.; van der Linden, C.G.; Liu, H.; Wang, Q. Genome-wide identification of CBL family genes in Nicotiana tabacum and the functional analysis of NtCBL4A-1 under salt stress. Environ. Exp. Bot. 2023, 209, 105311. [Google Scholar] [CrossRef]
  65. Steinhorst, L.; Kudla, J. Calcium and Reactive Oxygen Species Rule the Waves of Signaling. Plant Physiol. 2013, 163, 471–485. [Google Scholar] [CrossRef]
  66. Shi, H.; Lee, B.-h.; Wu, S.-J.; Zhu, J.-K. Overexpression of a plasma membrane Na+/H+ antiporter gene improves salt tolerance in Arabidopsis thaliana. Nat. Biotechnol. 2003, 21, 81–85. [Google Scholar] [CrossRef]
Figure 1. Phylogenetic, syntenic, exon–intron structure, and protein domain analyses of the GmCBL gene family. (A) CBL proteins from G. max, A. thaliana, G. soja, T. aestivum, V. unguiculata, Z. mays, O. sativa, P. vulgaris, and S. bicolor were used to establish a phylogenetic tree, with different colors corresponding to individual species, highlighting a range of taxonomic characteristics. (B) GmCBL gene family exon–intron organization, revealing GmCBL gene clusters with similar exon–intron structures. Green boxes, orange boxes, and pink lines are used to represent UTRs, exons, and introns, respectively. (C) Analyses of GmCBL gene family collinearity, with gray lines denoting collinear genomic blocks, while colored lines denote repetitive gene pair fragments. Color gradients extending from pink (high-density) to blue (low-density) represent log2 expression values, and chromosomes are represented by colored boxes. (D) Conserved domain analyses of G. max proteins, with blue, pink, purple, and green boxes, respectively, corresponding to EF-hand_1, EF-hand_5, EF-hand_7, and EF-hand_8 domains, all of which afford a high degree of structural diversity to these GmCBL proteins.
Plants 13 01304 g001
Figure 2. Conserved motif analyses of 3D structural models of GmCBL proteins. (A) Conserved motifs present within members of the GmCBL family are highlighted using numbered and colored boxes representing distinct motifs. (B) Three-dimensional structural models of the EF−hand_7 domain complexed with double-helical DNA generated with AlphaFold2 and a corresponding EF−hand_7 sequence logo generated using WebLogo.
Plants 13 01304 g002
Figure 3. Cis-acting element analysis of GmCBLs. Predicted cis-acting elements were identified within the 2.0 kb promoter region upstream from the start codon for each of the identified GmCBL genes, with boxes of different colors being used to represent the relative positions of these elements.
Plants 13 01304 g003
Figure 4. GmCBL domain alignment and expression pattern analyses. (A) GmCBL gene conserved domains, including the EF−hand_1, EF−hand_5, EF−hand_7, and EF−hand_8 domains, were identified through alignment. Pink and black lines, respectively, indicate the myristoylation site and the FPSF motif. (B) GmCBL gene expression patterns were analyzed in a range of soybean tissues in the Phytozome database, with TBtools having been used to establish an expression heatmap. The color scale represents log2 expression levels, with pink and blue, respectively, corresponding to high- and low-abundance transcripts.
Plants 13 01304 g004
Figure 5. Synteny analyses GmCBL genes and CBL genes from seven other plant species. Gray background lines denote collinear genomic blocks within the genomes of G. max and other plant species, while different colors indicate syntenic GmCBL gene pairs.
Plants 13 01304 g005
Figure 6. GmCBL expression profiling under abiotic stress conditions. GmCBL expression patterns were assessed in the roots of soybean plants treated with 150 mmol L−1 NaCl, 200 mmol L−1 mannitol, 20% PEG,100 mmol L−1 NaHCO3, or water for 0, 1, 3, 6, 12, or 24 h, analyzing the expression of these genes in the absence of stress as a reference control. The 2−∆∆CT method was employed for relative quantification, analyzing three replicates per tissue. Different letters represent significant differences (p < 0.05, Duncan’s test).
Plants 13 01304 g006
Figure 7. GmCBL expression profiling in response to hormone stimulation. The patterns of GmCBL gene expression in the roots of soybean plants that had been exposed to SA, BR, ABA, or JA (100 μmol L−1) or water as a control treatment were assessed at 0, 1, 3, 6, 12, or 24 h post stimulation, analyzing the expression of these genes in the absence of stress as a reference control. The 2−∆∆CT method was employed for relative quantification, analyzing three replicates per tissue. Different letters indicate significant differences between treatments at the p < 0.05 level (Duncan’s test).
Plants 13 01304 g007
Figure 8. Subcellular localization analysis of transient expression of GmCBL1-GFP fusion protein in A. thaliana protoplast. (A) A schematic overview of the utilized pSOY1-GmCBL1 vector, with arrows indicating expression elements and horizontal lines representing vector restriction sites. Orange represents promoter, purple represents insertion gene, green represents fluorescent protein, blue represents bar gene, gray represents antibiotics, and black represents terminator. (B) The subcellular localization of GmCBL1 in A. thaliana protoplasts was analyzed, and the confocal image represents the subcellular localization of GFP and GmCBL1-GFP. Scale bar = 10 μm.
Plants 13 01304 g008
Figure 9. Overexpressing GmCBL1 increases the resistance of transgenic soybean plants to saline–alkaline conditions. (A) Soybean plants with GmCBL1-overexpressing hairy roots (OHR) or control hairy roots (CHR) were treated with NaCl (0 or 75 mM) and NaHCO3 (75 mM) for 5 days, and their performance was evaluated. Agrobacterium rhizogenes was used to establish OHR plants, and over 10 hairy root lines were analyzed. (B) Root length. (C) Fresh weight of root. (D) Dry weight of root. (EI) Expression of redox-related genes (GmAPX1, GmCAT1, GmGSH1, and GmSOD1) and Na+/H+ antiporter gene (GmCPA1) in OHR and CHR plants was assessed 12 h after exposure to salt and alkali stress, analyzing three biological replicates per tissue. ** p < 0.01 vs. CHR plants; Student’s t-test. Data are means ± SD.
Plants 13 01304 g009
Figure 10. The model of GmCBL1 gene involved in the regulation of ROS level under saline–alkaline stress. When soybean root cells are exposed to saline–alkaline stress, calcium channel proteins situated on the cell membrane are activated, leading to the influx of calcium ions into the cytoplasm. This influx results in an elevation of calcium concentration within the cytoplasm and subsequently initiates calcium signal transduction pathways. The calcium ions interact with the GmCBL1 protein, leading to the activation of the CBL-CIPK signal pathway, which in turn triggers the antioxidant defense system. Soybean plants are able to mitigate the effects of saline–alkaline stress by upregulating the expression of antioxidant enzymes, thereby reducing oxidative damage. Arrows are employed to denote the direction of change.
Plants 13 01304 g010
Table 1. Basic characteristics of the 15 identified soybean CBL genes.
Gene NameGene IDGene LocationORF Length (bp)Protein LengthIsoelectric PointMolecular Weight (kDa)Subcellular Localization
GmCBL1Glyma.04G235900Chr4
50399334…50405613
6722244.425.68Cytoplasmic
GmCBL2Glyma.05G066800Chr5
6731396…6740875
6422144.4924.22Nuclear
GmCBL3Glyma.05G217700Chr5
39770219…39774659
6932314.5926.1Nuclear
GmCBL4Glyma.06G128700Chr6
10581579…10588773
6722244.4225.55Cytoplasmic
GmCBL5Glyma.07G010800Chr7
824696…827823
7922644.7630.44Cytoplasmic
GmCBL6Glyma.07G269200Chr7
44230392…44236986
6812274.3925.78Extracellular matrix
GmCBL7Glyma.08G023700Chr8
1884590…1887532
7082364.5326.73Nuclear
GmCBL8Glyma.08G194000Chr8
15628395…15631841
7982664.7630.65Cytoplasmic
GmCBL9Glyma.08G332800Chr8
44992808…44997458
6812274.4526.04Cytoplasmic
GmCBL10Glyma.09G016000Chr9
1233158…1239867
6812274.6425.93Nuclear
GmCBL11Glyma.11G038900Chr11
2773817…2777295
6392134.3124.40Nuclear
GmCBL12Glyma.17G004400Chr17
434853…441609
6812274.4025.80Cytoplasmic
GmCBL13Glyma.17G149000Chr17
12354772…12359193
6602204.7225.24Cytoplasmic
GmCBL14Glyma.17G229500Chr17
38443770…38448625
7772594.4429.26Chloroplast
GmCBL15Glyma.18G074200Chr18
7033194…7037977
6812274.5026.07Cytoplasmic
Disclaimer/Publisher’s Note: The statements, opinions and data contained in all publications are solely those of the individual author(s) and contributor(s) and not of MDPI and/or the editor(s). MDPI and/or the editor(s) disclaim responsibility for any injury to people or property resulting from any ideas, methods, instructions or products referred to in the content.

