Experimental Investigation of Phase Equilibria in the Al–Mo–Hf Ternary System at 400 °C and 600 °C

School of Material Science and Engineering, Central South University, Changsha 410083, China
*
Authors to whom correspondence should be addressed.
Processes 2024, 12(5), 969; https://doi.org/10.3390/pr12050969
Submission received: 2 April 2024
/
Revised: 27 April 2024
/
Accepted: 7 May 2024
/
Published: 10 May 2024
(This article belongs to the Section Materials Processes)
Abstract
:This study investigates the phase equilibria of the Al-Mo-Hf ternary system at 400 °C and 600 °C using X-ray diffraction (XRD) and electron probe microanalysis (EPMA/WDS) techniques. Seven three-phase and five two-phase regions were identified at 400 °C, while eight three-phase and four two-phase regions were identified at 600 °C. Despite variations in the solid solubility ranges of certain compounds, the distribution of phase zones in the isothermal cross-section remained consistent at both temperatures. Using the experimental results and logical deductions, isothermal cross-sections were constructed for the Al-Mo-Hf ternary system at 600 °C and 400 °C.
1. Introduction
Aluminum and its alloys have numerous advantages, including high strength, low density, and favorable hot working properties. This makes them widely used in the aerospace, electronics, electrical engineering, machinery manufacturing, and transportation fields, among others [1,2,3,4].
The properties of aluminum alloys can be enhanced through the addition of other elements, which can occur through mechanisms such as fine-grain strengthening, solid-solution strengthening, and second-phase strengthening. Studies [5,6,7] have shown that elements from the fourth transition group, such as Ti, Zr, and Hf, exhibit slow diffusion in Al alloys. This is significant in the development of Al-based high-temperature alloys with excellent thermal stability. For example, in Al-Zr alloys, the Al3Zr phase precipitates from a supersaturated solid solution during aging, which shares structural and property similarities with the γ′ (AlNi3) phase found in nickel-based high-temperature alloys. The γ′ phase is characterized by an ordered L12 structure [8,9,10]. Hafnium (Hf) and zirconium (Zr) share numerous similarities. However, Hf exhibits higher solubility in aluminum (Al) compared to Zr. The formation of L12-structured Al3Hf can inhibit grain boundary and subgranular boundary migration, or serve as a nucleating agent to refine grains. This effectively enhances the strength of aluminum alloys [11,12,13]. Molybdenum (Mo) can be involved in synthesizing intermediate phases enriched with transition metal elements. This offers low diffusivity and solid solubility in Al, contributing to better thermal stability. Studies [14,15,16] have shown that the tensile strength and elongation of aluminum alloys are influenced by Mo content, with properties improving with appropriate Mo additions.
Phase diagrams are useful visual representations of the relationship between phases in thermodynamic equilibria. They provide theoretical guidance for material development and design [17,18]. However, comprehensive phase diagrams for the Al-Mo-Hf system are currently scarce. Obtaining accurate and comprehensive isothermal cross-sections of the Al-Mo-Hf system is therefore of paramount importance for the study of aluminum alloys.
During initial studies of the Al-Hf binary system, researchers [19,20,21] identified several binary compounds, including AlHf2, Al2Hf3, Al3Hf4, AlHf, Al3Hf2, Al2Hf, and Al3Hf. The crystal structure and cell parameters of these compounds were also determined. In 1975, Kaufma et al. [22] conducted calculations on the Al-Hf binary system, yielding phase diagrams that differed somewhat from the experimental ones. In 1998, Murray et al. [23] summarized previous research on the Al-Hf binary system, resulting in a more accurate phase diagram. Wang et al. [24] conducted a re-evaluation of the thermodynamics of the Al-Hf binary system, producing calculations that closely aligned with experimental data. In 2006, Okama [25] synthesized the findings of Murray [23] and Wang [24] to revise the Al-Hf phase diagrams. In 2016, ZH Jia et al. [26] recapitulated the Al-Hf binary system, and Figure 1 depicts the binary phase diagram determined by ZH Jia et al. [26].
In 1961, Taylor et al. [27] investigated two crystal structures of the HfMo2 compound and determined the Mo-Hf binary system. Subsequently, Rudy [28], Garg [29], and Brewer L. et al. [30] conducted experimental studies on the phase equilibrium of the Mo-Hf system. Their results were consistent with the fundamental characteristics described by Taylor et al. [27], except for some phase equilibrium details on the Hf-rich side. Massalski et al. [31] summarized previous findings and obtained a comprehensive Mo-Hf binary phase diagram. In 2002, Shao et al. [32] evaluated the equilibrium data of the Mo-Hf system using the CALPHAD method and obtained complete thermodynamic data for this system. Later, Zhao et al. [33] found that the thermodynamic data by Shao et al. [32] did not fully align with the experimental data. The crystal structure information for each phase of the Mo-Hf system was calculated using first-principles methods. The phase diagram they obtained aligns well with the experimental data. Figure 2 displays the Mo-Hf binary phase diagram as determined by Zhao et al. [33].
Since 1922, numerous researchers [34] have studied the Al-Mo binary system. Koch [35] and Mondolfo [36] determined the solid solubility of Mo in Al, while Yamaguchi et al. [37] investigated the liquid phase composition at the Al-rich end at 1000 °C. It was not until 1959 that Spernerd et al. [38] conducted a study on alloys with Mo content ranging from 20 to 95 at.%, yielding the first comprehensive Al-Mo phase diagram. Due to inconsistencies at the Al-rich end of the Al-Mo system, Schuster et al. [39] re-examined various compounds between Al and Al8Mo3 in 1991. In 2000, Okomata [40] updated the Al-Mo phase diagram based on the results of Schuster et al. [39], and Eumann [41] further refined the Al-Mo binary system in 2006 by analyzing the microstructure of nine Al-Mo alloys heat-treated and quenched between 600 °C and 1200 °C. In 2010, Cupid et al. [42] conducted thermodynamic calculations on the Al-Mo system, reassessing the Al-Mo binary phase diagram. Peng et al. [43] adjusted the parameters of some intermetallic compounds based on the thermodynamic data obtained by Cupid et al. [42], setting the second derivative of Gibbs free energy to be positive as a constraint. They also considered the experimental data from Schuster et al. [39] and Eumann [41] to re-optimize the Al-Mo binary system, resulting in a calculated phase diagram that aligns well with the experimental data. Figure 3 depicts the Al-Mo binary phase diagram obtained by Peng et al. [43] (Table 1).
2. Materials and Methods
The determination of experimental phase diagrams involves dynamic and static methods. In this study, the static equilibrium alloy method was employed. This method entails placing alloy samples with varying compositions under pre-set temperature gradients for annealing, allowing the samples to reach equilibrium at each temperature. Subsequent rapid quenching preserves the high-temperature phases for further phase analysis to determine phase equilibrium relationships. To ensure comprehensive phase diagram information, a temperature difference of at least 200 °C between the two isothermal sections is recommended. In annealed samples, the presence of a liquid phase should be avoided, as it can affect the determination of the equilibrium structure. Considering that the melting point of aluminum is 660.32 °C, and the melting points of its compounds might be lower, the maximum annealing temperature should not exceed 600 °C. Therefore, temperatures of 400 °C and 600 °C were chosen for the two isothermal sections of the Al-Mo-Hf ternary system.
For sample preparation, granular high-purity Al (99.99 wt.%), Mo (99.99 wt.%), and Hf (99.99 wt.%) with diameters of 3 mm and lengths of 3.5 mm were selected. Considering Al’s low density, initial sample sizes ranging from 8 to 12 g were designed based on Al content. Samples were melted using a vacuum non-consumable arc furnace with vacuum pressure maintained at −0.05 MPa using mechanical and molecular pumps along with argon gas flushing to prevent alloy oxidation. A titanium sponge was placed on a water-cooled copper crucible as an oxygen scavenger before each melting process to minimize oxidation. Given the significantly different melting points of Al (660 °C), Mo (2610 °C), and Hf (2233 °C), the electric current was gradually increased during melting to prevent alloy splashing. Additionally, to ensure uniform sample composition after melting, each sample was melted at least six times. The alloy samples were annealed in several quartz tubes. The samples in the same quartz tube were separated by quartz granules to prevent them contacting each other when annealing, and sealed after multiple vacuum and argon flushing cycles to prevent oxidation during annealing.
The two sets of samples were annealed for 180 and 240 days at 600 °C and 400 °C, respectively, to achieve the equilibrium states. Subsequently, the quartz tubes were shattered in ice water and quenched. Standard metallographic samples were prepared by grinding, polishing, and ultrasonic cleaning before EPMA and XRD analysis.
EPMA (JAXA-8800R, JEOL, 15 kV, 1 × 10⁻⁸ A, Tokyo, Japan) was utilized for the quantitative analysis of phase composition in equilibrium structures, while XRD (Rigaku d-max/2550 VB, Cu K, 40 kV, 250 mA, Tokyo, Japan) was employed for the crystal structure analysis of typical alloy compositions. The scanning range was set from 10° to 90° at a speed of 5°/min.
3. Results and Discussion
3.1. Phase Equilibrium at 400 °C
In this study, we investigated the isothermal cross-section of the Al-Mo-Hf ternary system at 400 °C by selecting 22 representative alloys for EPMA and XRD analyses. Each alloy underwent annealing at 400 °C for 240 days. We determined the final phase composition data by selecting and averaging 3–5 positional compositions for each phase. Table 2 presents a summary of the experimental results obtained from these 22 samples with varying compositions.
Based on the experimental findings, we established the isothermal cross-section of the Al-Mo-Hf system at 400 °C. We will discuss the representative alloys within the different phase regions. The microstructure analysis of alloy sample A1 (Al90Hf5Mo5) revealed three distinct phases, as depicted in Figure 4a. Subsequent XRD analysis (Figure 4b) identified the black phase as Al, the light gray phase as Al12Mo, and the white phase as Al3Hf. Similarly, Figure 4c,d illustrate the microstructures of alloy sample A2 (Al85Hf5Mo1) alongside the EPMA and XRD results. In this case, the black phase corresponds to Al12Mo, the light gray phase to Al5Mo, and the white phase to Al3Hf. Consequently, we deduced the existence of two three-phase regions comprising Al + Al12Mo + Al3Hf and Al12Mo + Al5Mo + Al3Hf. Furthermore, based on alloy samples A1 and A2, we determined the maximum solid solubility of Mo in Al3Hf at 400 °C to be 1.23 at.%, and the maximum solid solubility of Hf in Al12Mo to be 0.14 at.%. These two ternary phase regions agree well with the marginal binary systems proposed by ZH Jia [26] and Peng et al. [43], further validating the accuracy of our experimental results.
Figure 5 shows the BSE images and XRD results of alloy samples A3 (Al45Hf10Mo45) and A12 (Al25Hf15Mo60). The A3 alloy sample shows a three-phase equilibrium with the white phase identified as AlMoHf, the light gray phase as AlMo3, and the black phase as Al8Mo3. In contrast, the microstructure of the A12 alloy sample consists of AlMo3 and AlMoHf phases.
Figure 6 shows the BSE image results of alloy samples A9 (Al55Hf2Mo25) and A10 (Al53Hf20Mo27). According to the EPMA results, a two-phase region of Al8Mo3 + AlMoHf is observed. In addition, the compositional range of Al in Al8Mo3 extends from 70.81 at.% to 71.98 at.%, with the maximum solid solubility of Hf in Al8Mo3 determined to be 2.64 at.%. In the Al-Mo binary phase diagram proposed by Peng et al. [43], the Al8Mo3 phase has nearly zero solubility at 400 °C. Our experimental results are slightly higher than those of Peng et al. The discrepancy may be attributed to the solid solution of Hf affecting the solubility of Al.
Figure 7 shows the BSE images and XRD results of alloy samples A5 (Al35Hf55Mo10) and A8 (Al40Hf55Mo5). In the A5 alloy sample, the black phase corresponds to AlMoHf, the white phase to AlHf2, and the gray phase to Al2Hf3. Conversely, the A8 alloy sample shows a two-phase microstructure consisting of AlMoHf and Al2Hf3. At 400 °C, the composition range of Hf in Al2Hf3 is from 58.62 at.% to 59.31 at.%, while the maximum solid solubility of Mo in AlHf2 and Al2Hf3 is 0.73 at.% and 1.14 at.%, respectively.
Figure 8 shows the BSE images and XRD results of alloy specimens A6 (Al45Hf50Mo5) and A7 (Al53Hf42Mo5). Both alloy specimens A6 and A7 exhibit a three-phase equilibrium. Specifically, A6 consists of AlMoHf, AlHf, and Al3Hf4 phases, while A7 consists of AlMoHf, AlHf, and Al3Hf2 phases. At 400 °C, the composition of Hf in AlHf ranges from 48.93 to 49.01 at.%, and the maximum solid solubility of Mo in Al3Hf4, AlHf, and Al3Hf2 is 1.32 at.%, 1.11 at.%, and 0.88 at.%, respectively. The results of the Al-Hf marginal binary system determined in this experiment align well with those of ZH Jia et al. [26].
Figure 9 shows the BSE images and XRD results of alloy samples A4 (Al15Hf25Mo60) and A13 (Al20Hf35Mo45). In the A4 sample, the black phase represents the AlMo3 phase, the gray phase represents the AlMoHf phase, and the white phase represents the HfMo2 phase. Conversely, in sample A13, the dark gray phase represents the AlMoHf phase and the light gray phase represents the HfMo2 phase. At 400 °C, the composition range of Mo in HfMo2 is from 61.79 at.% to 68.15 at.%, while the maximum solid solubility of Al in HfMo2 is 2.12 at.%. The solubility range of Mo is greater than that determined by Zhao et al. [33]. This discrepancy is primarily attributable to the HfMo2 phase in the Al-Mo-Hf ternary system, which solubilizes a small amount of Al, resulting in lattice distortion in the HfMo2 phase. Consequently, the solubility of Mo in the HfMo2 phase is altered.
Figure 10 shows the BSE images and XRD results of alloy samples A15 (Al15Hf3Mo82) and A18 (Al1Hf4Mo95). Sample A15 consists of two phases, AlMo3 and Mo, while sample A18 has a single-phase Mo microstructure. The analysis of the AlMo3 phase in samples A3, A4, A11, A12, and A15 shows that the compositional range of Mo in AlMo3 at 400 °C is from 73.87 at.% to 74.97 at.%. Furthermore, the maximum solid solubility of Hf in AlMo3 is 5.39 at.% and the maximum solid solubility of Al in Mo is 3.47 at.%. The solubility of Hf in the AlMo3 phase is relatively high, which may lead to changes in the properties of the AlMo3 phase. The solubility of Al in Mo is also slightly higher than the results reported by Peng et al. [43], which may be attributed to the solubilization of Hf.
Figure 11 shows the BSE images and XRD results of alloy samples A17 (Al30Hf35Mo35) and A19 (Al8Hf87Mo5). Sample A17 has a single-phase AlMoHf microstructure, while sample A19 has a single-phase Hf microstructure. Samples A19 to A22 all exhibit a single-phase Hf microstructure with the maximum solid solubility of Al being 13.87 at.% and the maximum solid solubility of Mo being 9.48 at.%. By analyzing alloy samples containing AlMoHf phases such as A3 to A14, A16, and A17, the solid solubility of AlMoHf ranges from Al27.32Mo35.79Hf36.89 to Al44.66Mo24.16Hf31.18.
The isothermal cross-section of the Al-Mo-Hf system at 400 °C was established based on experimental findings, as illustrated in Figure 12. Seventeen ternary regions were highlighted in green, with seven of them being experimentally confirmed: Al + Al12Mo + Al3Hf, Al12Mo + Al5Mo + Al3Hf, AlMoHf + AlMo3 + Al8Mo3, AlMo3 + AlMoHf + HfMo2, Al2Hf3 + AlMoHf + AlHf2, Al3Hf4 + AlMoHf + AlHf, and AlMoHf + AlHf + Al3Hf2. Additionally, the experiment identified five binary regions shaded in light red: AlMoHf + Al8Mo3, AlMo3 + AlMoHf, AlMoHf + HfMo2, Al2Hf3 + AlMoHf, and Al + AlMo3. In Figure 12, red triangles represent the compositions of alloy samples, while green circles and blue squares indicate phase boundaries, and green-dashed lines delineate extrapolated phase regions. Furthermore, measurements were conducted to determine the solid solubility of AlMoHf, AlMo3, Al8Mo3, HfMo2, Hf, and Mo.
3.2. Phase Equilibrium at 600 °C
To ascertain the isothermal cross-section of the Al-Mo-Hf ternary system at 600 °C, EPMA and XRD analyses were conducted on 21 alloy samples. The experimental findings from annealing the 21 samples with varying compositions at 600 °C for 180 days are summarized in Table 3.
Figure 13 shows the BSE images and XRD results of the B1 (Al90Hf5Mo5) alloy specimen and the B2 (Al85Hf5Mo10) alloy specimen. It is evident that alloy B1 exhibits a ternary phase comprising Al, Al12Mo, and Al3Hf, while alloy B2 demonstrates a ternary phase composed of Al12Mo, Al5Mo, and Al3Hf. Furthermore, comparison with the A1 and A2 alloy samples at 400 °C reveals an increase in Mo’s maximum solid solubility in Al3Hf at 600 °C from 1.23 at.% to 2.58 at.%.
Figure 14 shows the BSE images and XRD results of alloy samples B3 (Al45Hf10Mo45) and B6 (Al40Hf55Mo05). Alloy sample B3 has a three-phase equilibrium structure, with the white phase identified as AlMoHf, the light gray phase as AlMo3, and the dark gray phase as Al8Mo3. In contrast, sample B6 is a three-phase equilibrium alloy consisting of Al3Hf4, AlMoHf, and Al2Hf3.
Figure 15a,b show the BSE images and XRD results of the B11 (Al25Hf15Mo60) alloy specimens. It is clear that alloy B11 is composed of two phases: AlMoHf and AlMo3. Figure 15c,d display the BSE images of samples B12 and B13, respectively, revealing the presence of two phases, AlMoHf and HfMo2, according to the EPMA results. Figure 16 displays the BSE images and XRD results of alloy samples B16 (Al30Hf35Mo35), B17 (Al2Hf4Mo94), and B20 (Al4Hf90Mo6), which represent single phases of AlMoHf, Mo, and Hf, respectively.
From the EPMA results of samples B3 and B9, the composition range of Al in Al8Mo3 is determined to be between 70.45 at.% and 71.04 at.%, with the maximum solid solubility of Hf in Al8Mo3 recorded as 3.42 at.%. Subsequently, analysis based on the EPMA results of samples B3, B4, B10, B11, and B14 reveals that the composition range of Mo in AlMo3 spans from 72.06 at.% to 75.93 at.%, with the maximum solid solubility of Hf in AlMo3 reaching 8.59 at.%. Further examination of samples B4, B12, and B13 indicates that the composition of Mo in HfMo2 ranges from 61.44 at.% to 68.32 at.%, while the maximum solid solubility of Al in HfMo2 is 3.92 at.%. In the single-phase Mo alloy, the maximum solid solubility of Al is 4.01 at.%, whereas in the single-phase Hf alloy it is 18.24 at.%, and for Mo, the maximum solid solubility is 9.3 at.%. The solid solubility interval of the ternary compound AlMoHf at 600 °C ranges from Al25.23Mo36.88Hf37.89 to Al45.29Mo22.79Hf31.92. The solubility ranges of each phase at 600 °C are slightly higher than those at 400 °C.
Figure 17 shows the isothermal cross-section of the Al-Mo-Hf ternary system at 600 °C. There are no significant differences compared to the cross-section at 400 °C, except for variations in the solubility of certain solid phases. Experimental measurements were conducted to determine eight ternary regions: Al + Al12Mo + Al3Hf, Al12Mo + Al5Mo + Al3Hf, AlMoHf + AlMo3 + Al8Mo3, AlMo3 + AlMoHf + HfMo2, Al2Hf3 + AlMoHf + AlHf2, Al3Hf4 + AlMoHf + Al2Hf3, Al3Hf4 + AlMoHf + AlHf, and AlMoHf + AlHf + Al3Hf. Additionally, four binary regions were identified: AlMoHf + Al8Mo3, AlMo3 + AlMoHf, AlMoHf + HfMo2, and Al + AlMo3.
4. Conclusions
Currently, there is no reported ternary phase diagram information for the Al-Mo-Hf system. In this study, the phase equilibria of the Al-Mo-Hf ternary system at 400 °C and 600 °C were investigated using the equilibrium alloy method, complemented by EPMA and XRD analyses. Isothermal sections of the Al-Mo-Hf phase diagram were determined at these temperatures. The following conclusions were drawn from the analysis:
- At 400 °C, seven three-phase regions and five two-phase regions were identified, while at 600 °C, eight three-phase regions and four two-phase regions were observed. The distribution of phase zones in the isothermal sections at both temperatures was largely consistent, with some variations in the solid solubility ranges of certain compounds.
- The solid solubility range of the ternary compound AlMoHf was determined to be from Al27.32Mo35.79Hf36.89 to Al44.66Mo24.16Hf31.18 at 400 °C, and from Al25.23Mo36.88Hf37.89 to Al45.29Mo22.79Hf31.92 at 600 °C. Meanwhile the phases Al3Hf, Al3Hf2, AlHf, Al3Hf4, AlHf2, Al12Mo, Al5Mo, AlMo3, Al8Mo3, HfMo2, Hf, and Mo were determined in two isothermal sections, and the corresponding solid solubilities were determined.
- Partial solid solubility ranges of some binary compounds were also determined during the study, with the solid solubility regions of each compound increasing as the annealing temperature rose.
Author Contributions
Conceptualization, B.L. and L.L.; methodology, B.L.; software, B.L.; validation, Z.Y.; formal analysis, B.L.; investigation, B.L. and Z.Y.; resources, B.L. and Z.Y.; data curation, B.L.; writing—original draft preparation, B.L.; writing—review and editing, B.L.; visualization, L.L.; supervision, L.Z.; project administration, L.L.; funding acquisition, L.L. and L.Z. All authors have read and agreed to the published version of the manuscript.
Funding
The financial support by the National Natural Science Foundation of China (Grant Nos. 52071339, 52261003, 51871248) and the Natural Science Foundation of Hunan Province, China (Grant No. 2020JJ4739), are greatly acknowledged.
Data Availability Statement
The data presented in this study are available on request from the corresponding author.
Conflicts of Interest
The authors declare that they have no known competing financial interests or personal relationships that may appear to influence the work reported in this paper.
References
- Kong, Y.; Jia, Z.; Liu, Z.; Liu, M.; Roven, H.J.; Liu, Q. Effect of Zr and Er on the microstructure, mechanical and electrical properties of Al-0.4 Fe alloy. J. Alloys Compd. 2021, 857, 157611. [Google Scholar] [CrossRef]
- Atas, M.S. The relationship between reinforcement ratio and e-beam irradiation in Y2O3 reinforced Al6061 Alloys: A crystallographic assessment. Nucl. Instrum. Methods Phys. Res. Sect. B Beam Interact. Mater. At. 2024, 548, 165252. [Google Scholar] [CrossRef]
- Deng, Z.; Hu, Q.; Tian, Y.; Xue, R.; Zhang, L.; Liu, L. Experimental investigation and thermodynamic assessment of the Al–Ag–Sc system. J. Alloys Compd. 2023, 934, 167980. [Google Scholar] [CrossRef]
- Yildirim, M.; Atas, M.S.; Akdeniz, M.V.; Mekhrabov, A.O. Effect of Y Addition on the Structural Properties and Oxidation Behavior of Fe60Al40−nYn Alloys (n = 1, 3, and 5 at.%). Mater. High Temp. 2022, 39, 220–230. [Google Scholar] [CrossRef]
- Knipling, K.E.; Dunand, D.C.; Seidman, D.N. Criteria for developing castable, creep-resistant aluminum-based alloys—A review. Int. J. Mater. Res. 2022, 97, 246–265. [Google Scholar] [CrossRef]
- Wu, D.; Hao, M.; Zhang, T.; Wang, Z.; Wang, J.; Rao, G.; Zhang, L.; Ding, C.; Zhou, K.; Liu, L. Heterostructures enhance simultaneously strength and ductility of a commercial titanium alloy. Acta Mater. 2023, 257, 119182. [Google Scholar] [CrossRef]
- Xue, R.-H.; Wang, D.; Tian, Y.-Y.; Deng, Z.-X.; Liu, L.-B.; Zhang, L.-G. Effect of Sn on elastic modulus and magnetic susceptibility of Zr-16Nb-x Ti (x = 4 wt%, 6 wt%) alloys. J. Cent. South Univ. 2023, 30, 412–418. [Google Scholar] [CrossRef]
- Knipling, K.E.; Dunand, D.C.; Seidman, D.N. Precipitation evolution in Al–Zr and Al–Zr–Ti alloys during aging at 450–600 °C. Acta Mater. 2008, 56, 1182–1195. [Google Scholar] [CrossRef]
- Friedel, J. Dislocations: An introduction. Dislocations Solids 1979, 1, 1–32. [Google Scholar]
- Liu, W.; Liu, Z.; Luo, W.; Zuo, D.; Liu, H.; Zhang, R.; Wang, Q. Effect of Zr addition on coarse Laves phase stimulated nucleation of recrystallization in FeCrAl alloy. Mater. Sci. Eng. A 2022, 840, 142964. [Google Scholar] [CrossRef]
- Hallem, H.; Lefebvre, W.; Forbord, B.; Danoix, F.; Marthinsen, K. The formation of Al3 (ScxZryHf1−x−y)-dispersoids in aluminium alloys. Mater. Sci. Eng. A 2006, 421, 154–160. [Google Scholar] [CrossRef]
- Li, H.-Y.; Li, D.-W.; Zhu, Z.-X.; Chen, B.-A.; Xin, C.; Yang, C.-L.; Zhang, H.-Y.; Wei, K. Grain refinement mechanism of as-cast aluminum by hafnium. Trans. Nonferrous Met. Soc. China 2016, 26, 3059–3069. [Google Scholar] [CrossRef]
- Wu, H.; Wen, S.; Gao, K.; Huang, H.; Wang, W.; Nie, Z. Effect of Er additions on the precipitation strengthening of Al–Hf alloys. Scr. Mater. 2014, 87, 5–8. [Google Scholar] [CrossRef]
- Farkoosh, A.; Chen, X.G.; Pekguleryuz, M. Dispersoid strengthening of a high temperature Al–Si–Cu–Mg alloy via Mo addition. Mater. Sci. Eng. A 2015, 620, 181–189. [Google Scholar] [CrossRef]
- Zamani, M.; Toschi, S.; Morri, A.; Ceschini, L.; Seifeddine, S. Effect of Mo Addition on Room and High Temperature Tensile Behavior of Al-Si-Cu-Mg Alloy in As-Cast and Heat-Treated Conditions. Adv. Mater. Res. 2019, 1155, 71–79. [Google Scholar] [CrossRef]
- Atas, M.S.; Yildirim, M. Effect of Nd Addition on the Microstructure and Cyclic Oxidation Behavior of NiAl–Cr (Mo) Eutectic Alloys. Int. J. Met. 2023, 18, 1192–1203. [Google Scholar] [CrossRef]
- Chen, T.; Yuan, Y.; Wang, J.; Wu, J.; Wang, B.; Chen, X.; Moelans, N.; Wang, J.; Pan, F. Features and classification of solid solution behavior of ternary Mg alloys. J. Magnes. Alloys 2024. [Google Scholar] [CrossRef]
- Chen, T.; Gao, Q.; Yuan, Y.; Li, T.; Xi, Q.; Liu, T.; Tang, A.; Watson, A.; Pan, F. Coupling physics in machine learning to investigate the solution behavior of binary Mg alloys. J. Magnes. Alloys 2022, 10, 2817–2832. [Google Scholar] [CrossRef]
- Rath, B.; Mohanty, G.; Mondolfo, L. The aluminium-rich end of the aluminium-hafnium equilibrium diagram. J. Inst. Met. 1961, 89. [Google Scholar]
- Nowotny, H.; Schob, O.; Benesovsky, F. Die Kristallstruktur von Zr2Al und Hf2Al. Monatshefte Chem. Verwandte Teile Anderer Wiss. 1961, 92, 1300–1303. [Google Scholar] [CrossRef]
- Edshammar, L.-E. Crystal structure investigations on the Zr-Al and Hf-Al systems. Acta Chem. Scand. 1962, 16. [Google Scholar] [CrossRef]
- Kaufman, L.; Nesor, H. Calculation of the Ni-Al-W, Ni-Al-Hf and Ni-Cr-Hf systems. Can. Metall. Q. 1975, 14, 221–232. [Google Scholar] [CrossRef]
- Murray, J.; McAlister, A.; Kahan, D. The Al-Hf (aluminum-hafnium) system. J. Phase Equilibria Diffus. 1998, 19, 376. [Google Scholar] [CrossRef]
- Wang, T.; Jin, Z.; Zhao, J.-C. Thermodynamic assessment of the Al-Hf binary system. J. Phase Equilibria 2002, 23, 416. [Google Scholar] [CrossRef]
- Okamoto, H. Al-Hf (aluminum-hafnium). J. Phase Equilibria Diffus. 2006, 27, 538–539. [Google Scholar] [CrossRef]
- Jia, Z.-H.; Huang, H.-L.; Wang, X.-L.; Xing, Y.; Liu, Q. Hafnium in aluminum alloys: A review. Acta Metall. Sin. (Engl. Lett.) 2016, 29, 105–119. [Google Scholar] [CrossRef]
- Taylor, A.; Doyle, N.; Kagle, B. The constitution diagram of the molybdenum-hafnium binary system. J. Less Common Met. 1961, 3, 265–280. [Google Scholar] [CrossRef]
- Rudy, E. Compendium of Phase Diagram Data; Air Force Materials Laboratory, Metals and Ceramics Division: Dayton, OH, USA, 1969. [Google Scholar]
- Garg, S.; Ackermann, R. The high temperature phase diagrams for zirconium-molybdenum and hafnium-molybdenum. Metall. Trans. A 1977, 8, 239–244. [Google Scholar] [CrossRef]
- Brewer, L.; Lamoreaux, R.H.; Ferro, R.; Marazza, R.; Girgis, K. Molybdenum: Physico-Chemical Properties of Its Compounds and Alloys; International Atomic Energy Agency: Vienna, Austria, 1980. [Google Scholar]
- Massalski, T.B.; Okamoto, H.; Subramanian, P.; Kacprzak, L.; Scott, W.W. Binary Alloy Phase Diagrams; American Society for Metals: Materials Park, OH, USA, 1986; Volume 1. [Google Scholar]
- Shao, G. Thermodynamic assessment of the Hf–Mo and Hf–W systems. Intermetallics 2002, 10, 429–434. [Google Scholar] [CrossRef]
- Zhao, R.; Wang, J.; Yuan, H.; Hu, B.; Du, Y.; Tan, Z. Thermodynamic reassessment of the Mo–Hf and Mo–Zr systems supported by first-principles calculations. Calphad 2020, 69, 101766. [Google Scholar] [CrossRef]
- Reimann, H. Al–Mo Alloys. Z. Metallkd. 1922, 14, 119–123. [Google Scholar]
- Roentgen, P.; Koch, W. The influence of heavy metals on Al alloys. Z. Met. 1930, 25, 182–185. [Google Scholar]
- Mondolfo, L. The Al–Mo System. In Metallography of Aluminium Alloys; John Wiley & Sons: Hoboken, NJ, USA, 1943; pp. 30–31. [Google Scholar]
- Yamaguchi, K.; Simizu, K. The equilibrium diagram of the Al–Mo system. Nippon. Kinzoku Gakkai-Shi 1940, 4, 390–392. [Google Scholar]
- Sperner, F. Das Zweistoffsystem Aluminium-Molybdän. Int. J. Mater. Res. 1959, 50, 588–591. [Google Scholar] [CrossRef]
- Schuster, J.C.; Ipser, H. The AI-Ali8Mo3 section of the binary system aluminum-molybdenum. Metall. Trans. A 1991, 22, 1729–1736. [Google Scholar] [CrossRef]
- Okamoto, H. Desk Handbook: Phase Diagrams for Binary Alloys; ASM International: Almere, The Netherlands, 2000. [Google Scholar]
- Eumann, M.; Sauthoff, G.; Palm, M. Re-evaluation of phase equilibria in the Al–Mo system. Int. J. Mater. Res. 2006, 97, 1502–1511. [Google Scholar] [CrossRef]
- Cupid, D.M.; Fabrichnaya, O.; Ebrahimi, F.; Seifert, H.J. Thermodynamic assessment of the Al–Mo system and of the Ti–Al–Mo system from 0 to 20 at.% Ti. Intermetallics 2010, 18, 1185–1196. [Google Scholar] [CrossRef]
- Peng, J.; Franke, P.; Manara, D.; Watkins, T.; Konings, R.J.; Seifert, H.J. Experimental investigation and thermodynamic re-assessment of the Al–Mo–Ni system. J. Alloys Compd. 2016, 674, 305–314. [Google Scholar] [CrossRef]
- Trojko, R.; Blažina, Ž.; Ban, Z. The effect of silicon, aluminium and germanium on the stabilization of the C14 polymorph of HfMo2. J. Less Common Met. 1983, 92, 67–74. [Google Scholar]
- Okamoto, H. Al-Mo (Aluminum-Molybdenum). J. Phase Equilibria Diffus. 2010, 31, 492–493. [Google Scholar]
- Grin, Y.N.; Ellner, M.; Peters, K.; Schuster, J. The crystal structures of Mo4Al17 and Mo5Al22. Z. Krist.-Cryst. Mater. 1995, 210, 96–99. [Google Scholar] [CrossRef]
- Leake, J. The refinement of the crystal structure of the intermetallic phase Al4Mo. Acta Crystallogr. 1964, 17, 918–924. [Google Scholar] [CrossRef]
- Forsyth, J.; Gran, G. The structure of the intermetallic phase γ (Mo–Al)–Mo3Al8. Acta Crystallogr. 1962, 15, 100–104. [Google Scholar] [CrossRef]
- Rexer, J. The phase equilibria in the aluminum-molybdenum system at temperatures above 1400 °C. Z. Met. 1971, 62, 844–848. [Google Scholar]
- Wood, E.; Compton, V.B.; Matthias, B.; Corenzwit, E. β-Wolfram structure of compounds between transition elements and aluminum, gallium and antimony. Acta Crystallogr. 1958, 11, 604–606. [Google Scholar] [CrossRef]
Figure 1.
Al-Hf binary phase diagram [26].
Figure 1.
Al-Hf binary phase diagram [26].

Figure 2.
Mo-Hf binary phase diagram [33].
Figure 2.
Mo-Hf binary phase diagram [33].

Figure 3.
Al-Mo binary phase diagram [43].
Figure 3.
Al-Mo binary phase diagram [43].

Figure 4.
(a) BSE image of A1; (b) XRD pattern of A1; (c) BSE image of A2; (d) XRD pattern of A2.

Figure 5.
(a) BSE image of A3; (b) XRD pattern of A3; (c) BSE image of A12; (d) XRD pattern of A12.
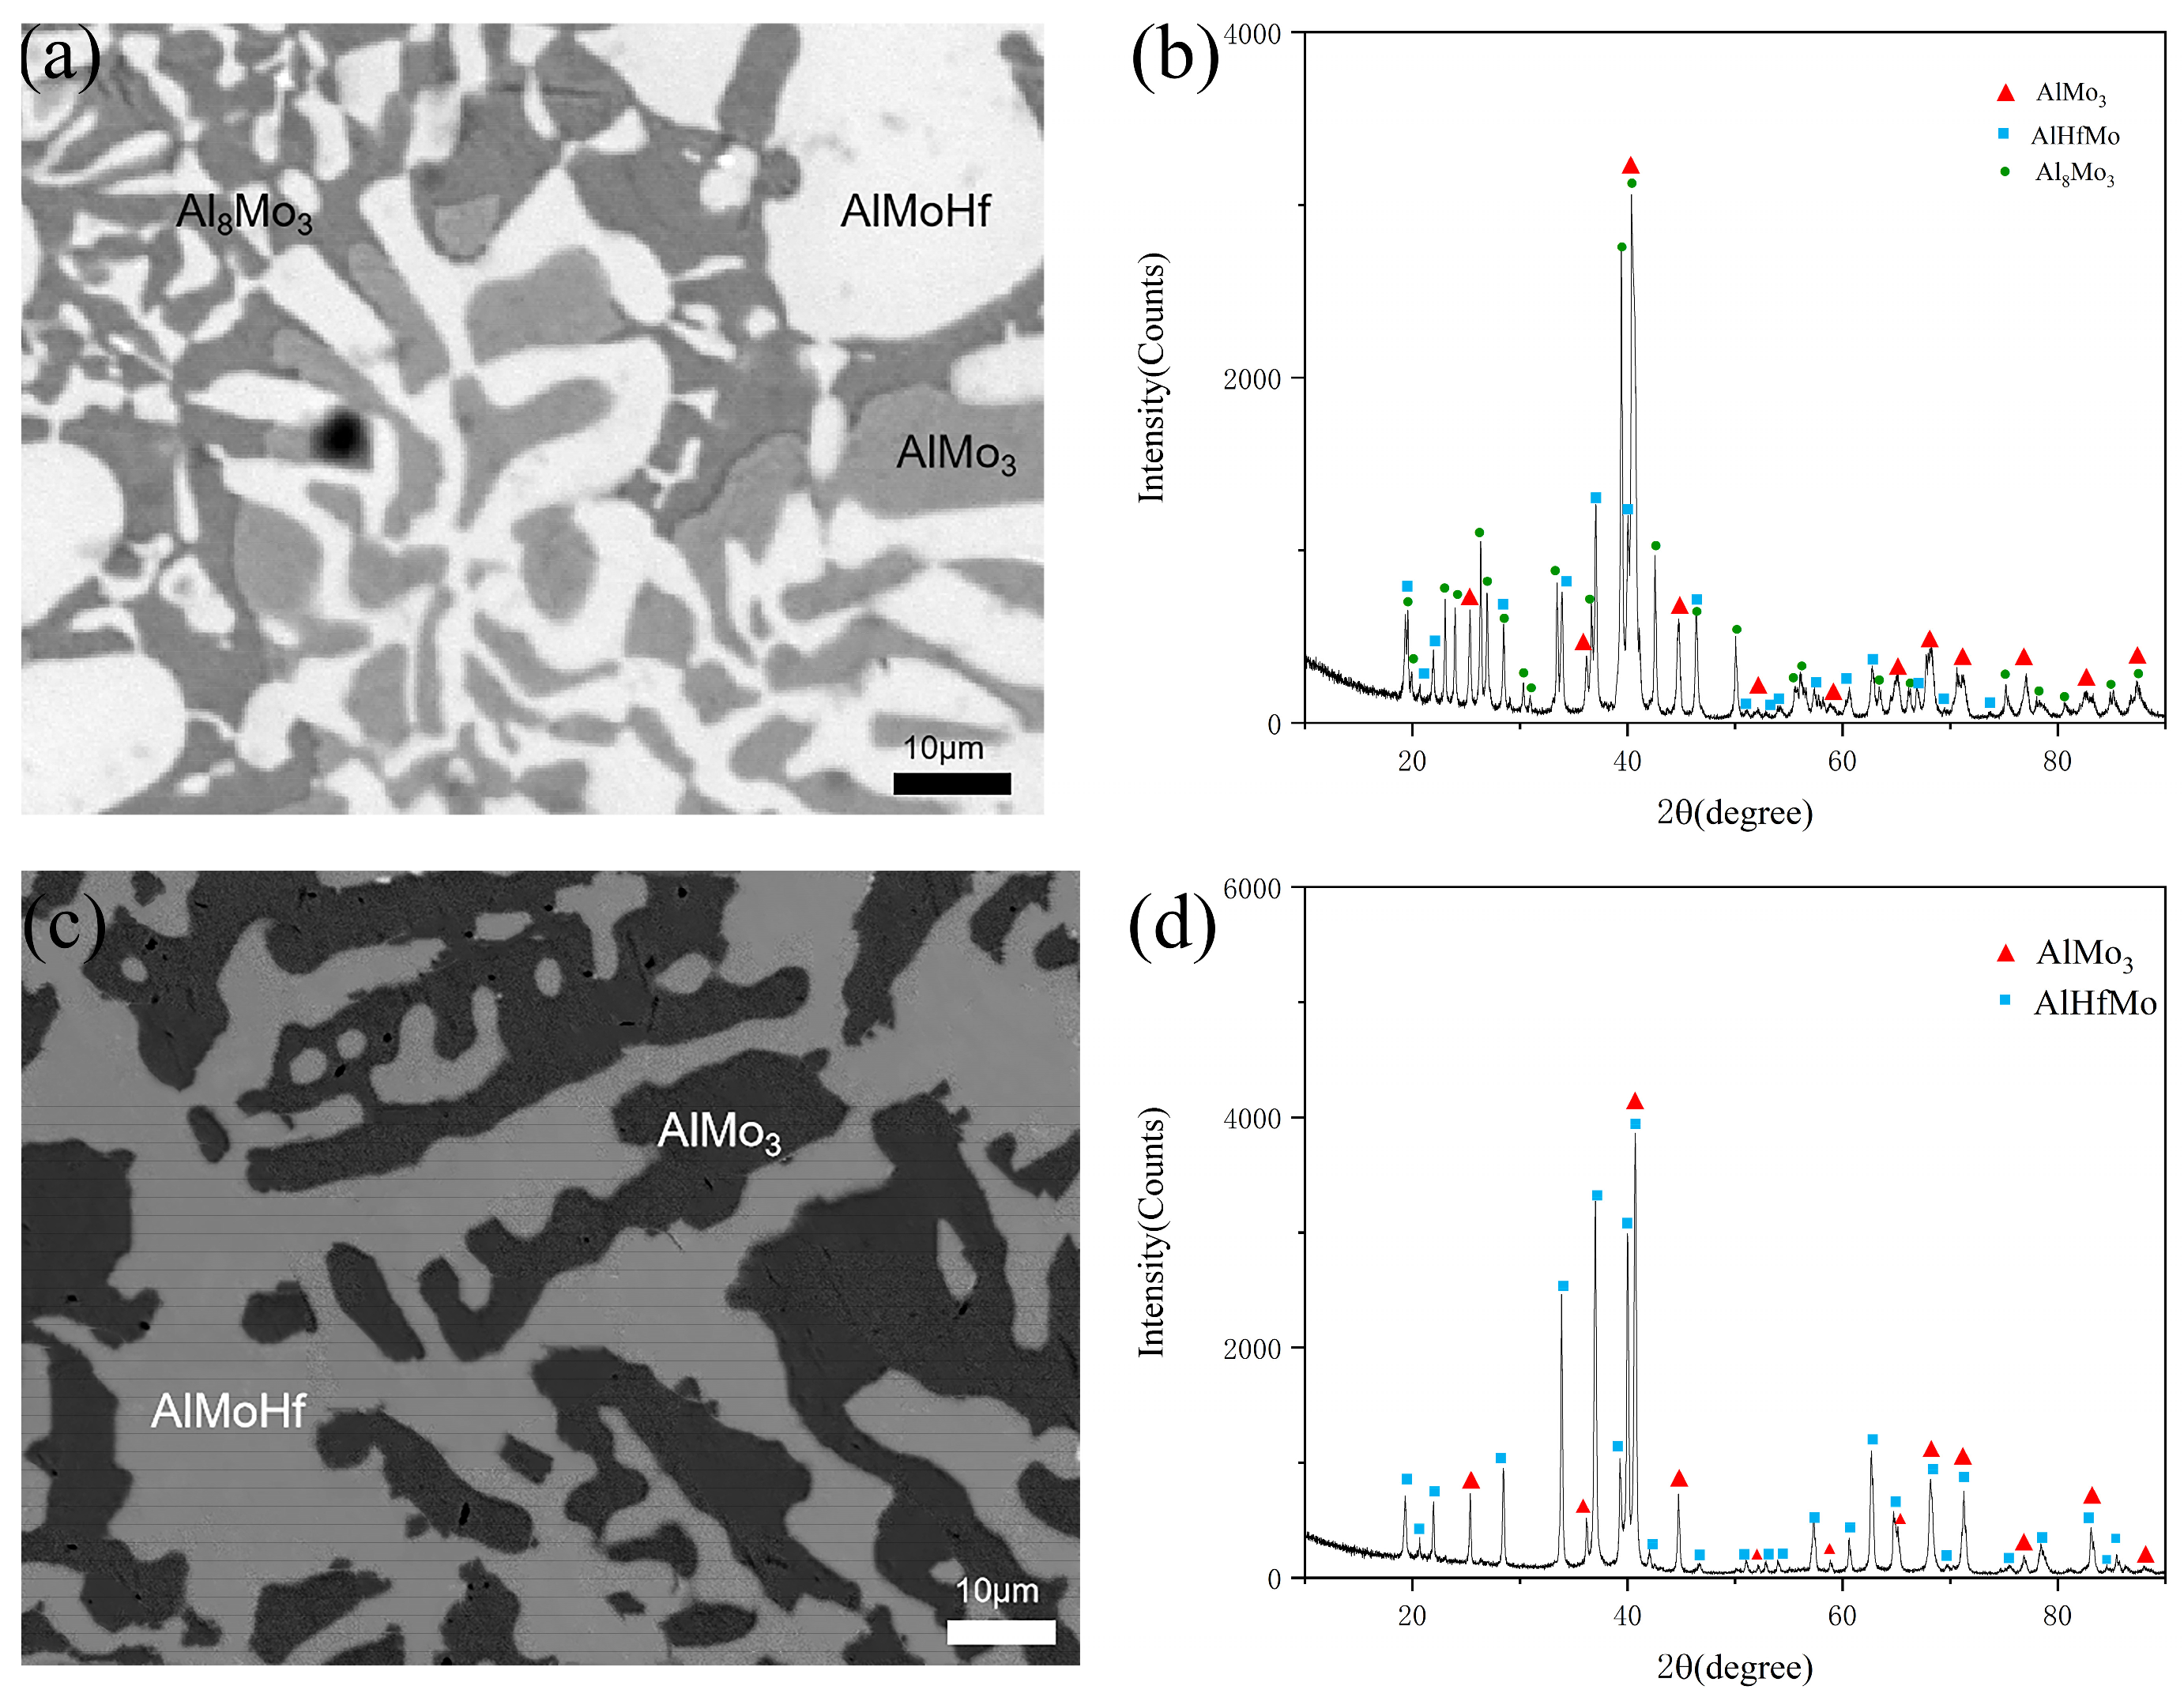
Figure 6.
(a) BSE image of A9; (b) BSE image of A10.

Figure 7.
(a) BSE image of A5; (b) XRD pattern of A5; (c) BSE image of A8; (d) XRD pattern of A8.

Figure 8.
(a) BSE image of A6; (b) XRD pattern of A6; (c) BSE image of A7; (d) XRD pattern of A7.

Figure 9.
(a) BSE image of A4; (b) XRD pattern of A4; (c) BSE image of A13; (d) XRD pattern of A13.

Figure 10.
(a) BSE image of A15; (b) XRD pattern of A15; (c) BSE image of A18; (d) XRD pattern of A18.
Figure 10.
(a) BSE image of A15; (b) XRD pattern of A15; (c) BSE image of A18; (d) XRD pattern of A18.
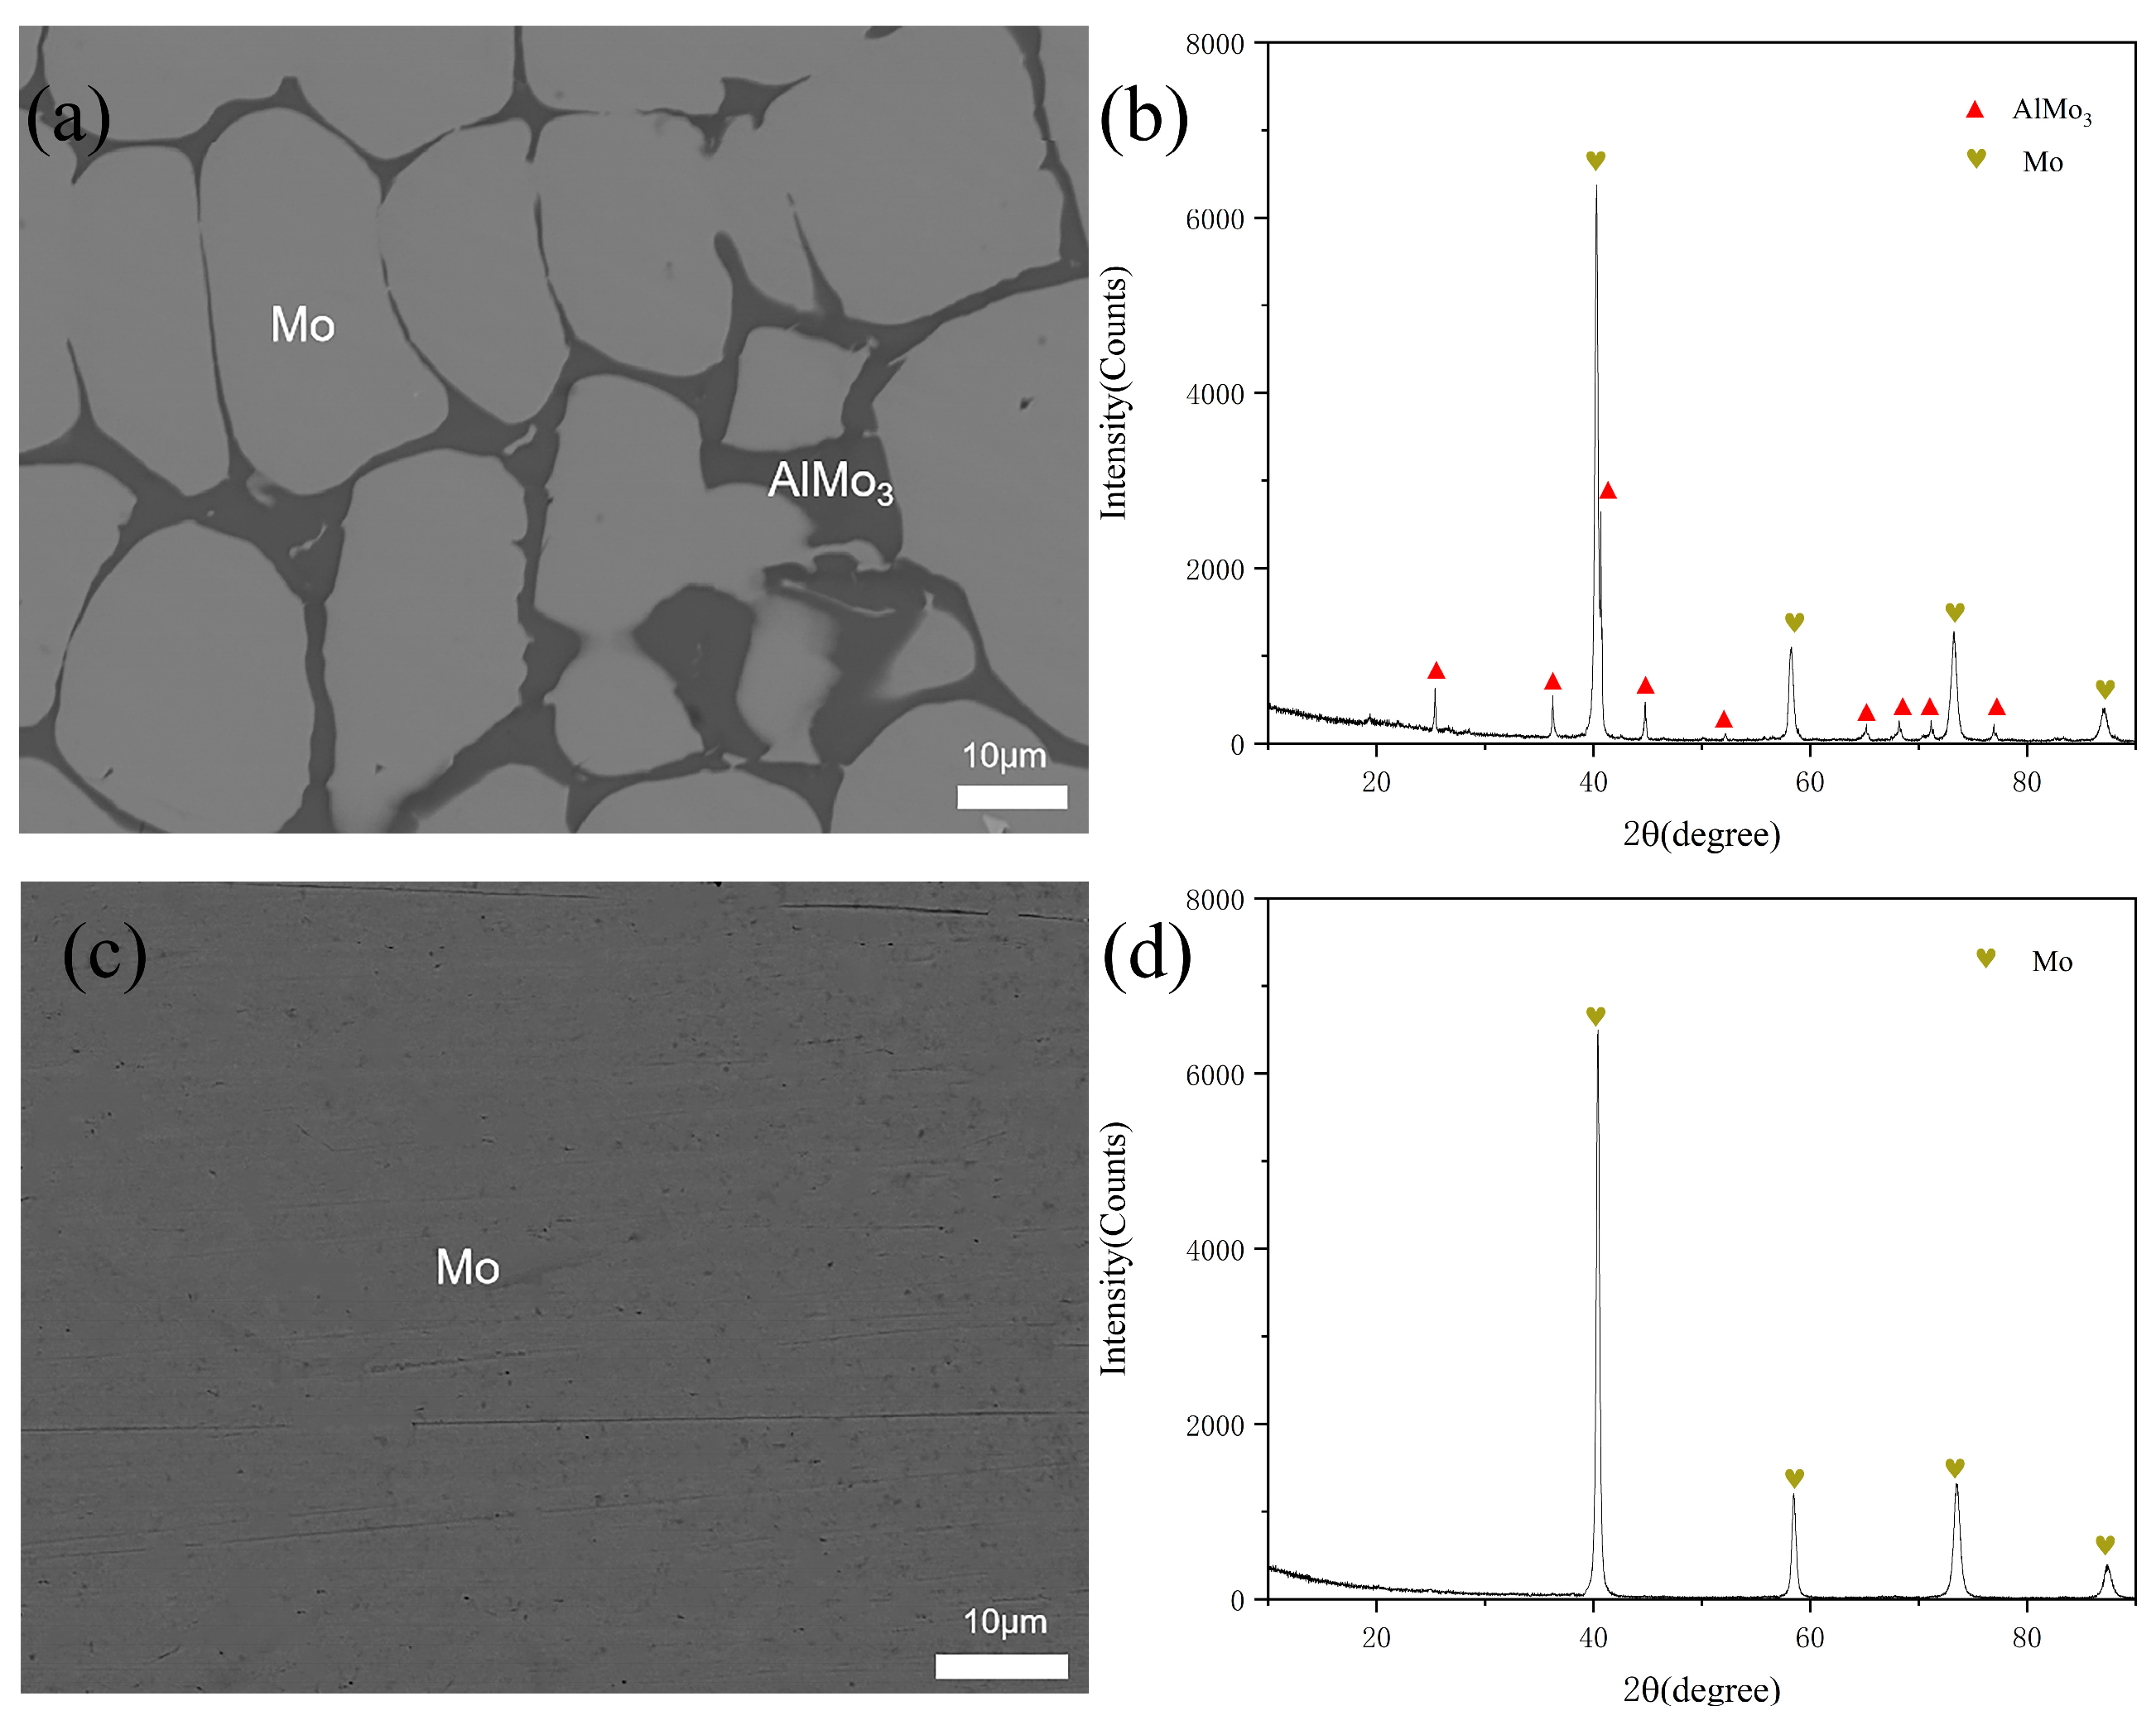
Figure 11.
(a) BSE image of A19; (b) XRD pattern of A19; (c) BSE image of A17; (d) XRD pattern of A17.
Figure 11.
(a) BSE image of A19; (b) XRD pattern of A19; (c) BSE image of A17; (d) XRD pattern of A17.

Figure 12.
Isothermal section of Al–Mo–Hf ternary system at 400 °C determined in this work.

Figure 13.
(a) BSE image of B1; (b) XRD pattern of B1; (c) BSE image of B2; (d) XRD pattern of B2.

Figure 14.
(a) BSE image of B3; (b) XRD pattern of B3; (c) BSE image of B6; (d) XRD pattern of B6.

Figure 15.
(a) BSE image of B11; (b) XRD pattern of B11; (c) BSE image of B12; (d) BSE image of B1.

Figure 16.
(a) BSE image of B16; (b) XRD pattern of B16; (c) BSE image of B17; (d) XRD pattern of B17; (e) BSE image of B20; (f) XRD pattern of B20.
Figure 16.
(a) BSE image of B16; (b) XRD pattern of B16; (c) BSE image of B17; (d) XRD pattern of B17; (e) BSE image of B20; (f) XRD pattern of B20.

Figure 17.
Isothermal section of Al–Mo–Hf ternary system at 600 °C determined in this work.


Table 1.
Crystal structures and lattice constants of binary compounds in the Al-Mo-Hf system.
| Phase | Pearson Symbol | Prototype | Space Group | Lattice Parameters [nm] | Ref. | ||
|---|---|---|---|---|---|---|---|
| a | b | c | |||||
| αAl3Hf | tI8 | A13Ti | I4/mmm | 0.3982 | … | 1.7155 | [26] |
| βAl3Hf | tI16 | A13Zr | I4/mmm | 0.3893 | … | 0.8925 | [26] |
| Al2Hf | hP12 | MgZn2 | P63/mmc | 0.6776 | … | 0.5372 | [26] |
| Al3Hf2 | oF40 | Al3Zr2 | Fdd2 | 0.5522 | 0.9523 | 1.3763 | [26] |
| AlHf | oC8 | CrB | Cmcm | 0.3253 | 1.0822 | 0.4280 | [26] |
| Al3Hf4 | hP7 | Al3Zr4 | P6 | 0.5343 | … | 0.5422 | [26] |
| Al2Hf3 | tP20 | Al2Zr3 | P42/mnm | 0.7535 | … | 0.6906 | [26] |
| AlHf2 | tI12 | Al2Cu | I4/mcm | 0.6776 | … | 0.5372 | [26] |
| αHfMo2 | cF24 | MgCu2 | Fd3m | 0.7.557 | … | … | [44] |
| βHfMo2 | hP24 | MgNi2 | P63/mmc | 0.5.366 | … | 1.7408 | [44] |
| Al12Mo | cI26 | Al12W | Im | 0.7573 | … | … | [39] |
| αAl5Mo | hP36 | ... | Rc | 0.495.1 | … | 2.623 | [39] |
| βAl5Mo | hP12 | Al5W | P6322 | 0.4912 | … | 0.886 | [39] |
| Al63M37 | ... | ... | … | … | … | … | [45] |
| Al22Mo5 | oF216 | ... | Fdd2 | 7.382 | 0.916 | 4.932 | [46] |
| Al17Mo4 | mC84 | ... | C2 | 0.9158 | 0.49323 | 2.8935 | [46] |
| Al4Mo | mC30 | Al4W | Cm | 0.5255 | 1.7768 | 0.5225 | [47] |
| Al3Mo | mC32 | ... | C2/m | 1.6396 | 0.3594 | 0.8386 | [39] |
| Al8Mo3 | mC22 | ... | Cm | 0.9207 | 0.3641 | 1.0065 | [48] |
| AlMo | cP2 | CsCl | Pmm | 0.3098 | … | … | [49] |
| AlMo3 | cP8 | Cr3Si | Pmn | 0.4950 | … | … | [50] |
Table 2.
Compositional phases and their compositions of Al-Mo-Hf alloy samples annealed at 400 °C for 240 days.
Table 2.
Compositional phases and their compositions of Al-Mo-Hf alloy samples annealed at 400 °C for 240 days.
| Alloy | Nominal Composition (at.%) | Experimental Results (at.%) | Phase | ||||
|---|---|---|---|---|---|---|---|
| Number | Al | Hf | Mo | Al | Hf | Mo | |
| A1 | 90 | 5 | 5 | 91.96 | 0.14 | 7.9 | Al12Mo |
| 99.78 | 0.09 | 0.13 | Al | ||||
| 75.19 | 23.71 | 1.1 | Al3Hf | ||||
| A2 | 85 | 5 | 10 | 83.37 | 0.08 | 16.55 | Al5Mo |
| 74.46 | 24.31 | 1.23 | Al3Hf | ||||
| 92.06 | 0.16 | 7.78 | Al12Mo | ||||
| A3 | 45 | 10 | 45 | 24.68 | 0.53 | 74.79 | AlMo3 |
| 40.34 | 31.41 | 28.25 | AlMoHf | ||||
| 70.55 | 0.55 | 28.9 | Al8Mo3 | ||||
| A4 | 15 | 25 | 60 | 20.13 | 5.39 | 74.48 | AlMo3 |
| 30.04 | 33.04 | 36.92 | AlMoHf | ||||
| 0.76 | 31.09 | 68.15 | HfMo2 | ||||
| A5 | 35 | 55 | 10 | 39.87 | 59.31 | 0.82 | Al2Hf3 |
| 35.4 | 36.58 | 28.02 | AlMoHf | ||||
| 33.43 | 65.84 | 0.73 | AlHf2 | ||||
| A6 | 45 | 50 | 5 | 42.41 | 56.27 | 1.32 | Al3Hf4 |
| 39.28 | 35.88 | 24.84 | AlMoHf | ||||
| 49.88 | 49.01 | 1.11 | AlHf | ||||
| A7 | 53 | 42 | 5 | 41.03 | 35.32 | 23.65 | AlMoHf |
| 50.01 | 48.93 | 1.06 | AlHf | ||||
| 59.71 | 39.41 | 0.88 | Al3Hf2 | ||||
| A8 | 40 | 55 | 5 | 40.24 | 58.62 | 1.14 | Al2Hf3 |
| 37.7 | 37.22 | 25.08 | AlMoHf | ||||
| A9 | 55 | 20 | 25 | 71.98 | 2.64 | 25.38 | Al8Mo3 |
| 44.66 | 31.18 | 24.16 | AlMoHf | ||||
| A10 | 53 | 20 | 27 | 43.26 | 30.08 | 26.66 | AlMoHf |
| 70.81 | 1.51 | 27.68 | Al8Mo3 | ||||
| A11 | 28 | 12 | 60 | 21.18 | 3.85 | 74.97 | AlMo3 |
| 31.69 | 31.24 | 37.07 | AlMoHf | ||||
| A12 | 25 | 15 | 60 | 24.03 | 2.1 | 73.87 | AlMo3 |
| 37.19 | 30.91 | 31.9 | AlMoHf | ||||
| A13 | 20 | 35 | 45 | 2.12 | 34.02 | 63.86 | HfMo2 |
| 27.79 | 34.94 | 37.27 | AlMoHf | ||||
| A14 | 15 | 37 | 48 | 1.17 | 37.04 | 61.79 | HfMo2 |
| 27.32 | 36.89 | 35.79 | AlMoHf | ||||
| A15 | 15 | 3 | 82 | 23.88 | 1.53 | 74.59 | AlMo3 |
| 3.47 | 3.45 | 93.08 | Mo | ||||
| A16 | 42 | 32 | 26 | 41.78 | 32.39 | 25.83 | AlMoHf |
| A17 | 30 | 35 | 35 | 30.83 | 34.71 | 34.46 | AlMoHf |
| A18 | 1 | 4 | 95 | 0.75 | 3.78 | 95.47 | (Mo) |
| A19 | 8 | 87 | 5 | 8.09 | 86.78 | 5.13 | (Hf) |
| A20 | 13 | 86 | 1 | 12.86 | 86.13 | 1.01 | (Hf) |
| A21 | 14 | 81 | 5 | 13.87 | 81.23 | 4.9 | (Hf) |
| A22 | 10 | 80 | 10 | 10.01 | 80.51 | 9.48 | (Hf) |
Table 3.
Compositional phases and their compositions of Al-Mo-Hf alloy samples annealed at 600 °C for 180 days.
Table 3.
Compositional phases and their compositions of Al-Mo-Hf alloy samples annealed at 600 °C for 180 days.
| Alloy | Nominal Composition (at.%) | Experimental Results (at.%) | Phase | ||||
|---|---|---|---|---|---|---|---|
| Number | Al | Hf | Mo | Al | Hf | Mo | |
| B1 | 90 | 5 | 5 | 42.38 | 55.94 | 1.68 | Al12Mo |
| 39.14 | 37.36 | 23.5 | Al | ||||
| 49.7 | 48.57 | 1.73 | Al3Hf | ||||
| B2 | 85 | 10 | 5 | 41.55 | 35.88 | 22.57 | Al5Mo |
| 49.87 | 48.46 | 1.67 | Al3Hf | ||||
| 59.44 | 39.27 | 1.29 | Al12Mo | ||||
| B3 | 45 | 10 | 45 | 70.45 | 3.42 | 26.13 | AlMo3 |
| 45.29 | 31.92 | 22.79 | AlMoHf | ||||
| 22.43 | 5.41 | 72.16 | Al8Mo3 | ||||
| B4 | 15 | 25 | 60 | 29.85 | 31.95 | 38.2 | AlMo3 |
| 24.36 | 3.58 | 72.06 | AlMoHf | ||||
| 39.15 | 30.41 | 30.44 | HfMo2 | ||||
| B5 | 35 | 55 | 10 | 3.92 | 32.68 | 63.4 | Al2Hf3 |
| 26.23 | 35.38 | 38.39 | AlMoHf | ||||
| 2.62 | 35.94 | 61.44 | AlHf2 | ||||
| B6 | 40 | 55 | 5 | 25.23 | 37.89 | 36.88 | Al3Hf4 |
| 4.01 | 4.29 | 91.7 | Al2Hf3 | ||||
| 22.59 | 1.48 | 75.93 | AlMoHf | ||||
| B7 | 45 | 50 | 5 | 42.38 | 55.94 | 1.68 | Al3Hf4 |
| 39.14 | 37.36 | 23.5 | AlMoHf | ||||
| 49.7 | 48.57 | 1.73 | AlHf | ||||
| B8 | 53 | 42 | 5 | 41.55 | 35.88 | 22.57 | AlMoHf |
| 49.87 | 48.46 | 1.67 | AlHf | ||||
| 59.44 | 39.27 | 1.29 | Al3Hf2 | ||||
| B9 | 55 | 20 | 25 | 70.45 | 3.42 | 26.13 | Al8Mo3 |
| 45.29 | 31.92 | 22.79 | AlMoHf | ||||
| B10 | 28 | 12 | 60 | 22.43 | 5.41 | 72.16 | AlMo3 |
| 29.85 | 31.95 | 38.2 | AlMoHf | ||||
| B11 | 25 | 15 | 60 | 24.36 | 3.58 | 72.06 | AlMo3 |
| 39.15 | 30.41 | 30.44 | AlMoHf | ||||
| B12 | 20 | 35 | 45 | 3.92 | 32.68 | 63.4 | HfMo2 |
| 26.23 | 35.38 | 38.39 | AlMoHf | ||||
| B13 | 15 | 37 | 48 | 2.62 | 35.94 | 61.44 | HfMo2 |
| 25.23 | 37.89 | 36.88 | AlMoHf | ||||
| B14 | 15 | 3 | 82 | 4.01 | 4.29 | 91.7 | (Mo) |
| 22.59 | 1.48 | 75.93 | AlMo3 | ||||
| B15 | 42 | 33 | 25 | 41.13 | 33.49 | 25.38 | AlMoHf |
| B16 | 30 | 35 | 35 | 30.03 | 35.94 | 34.03 | AlMoHf |
| B17 | 2 | 4 | 94 | 1.69 | 3.81 | 94.5 | (Mo) |
| B18 | 18 | 77 | 5 | 18.24 | 76.91 | 4.85 | (Hf) |
| B19 | 13 | 82 | 5 | 13.01 | 82.33 | 4.66 | (Hf) |
| B20 | 4 | 90 | 6 | 3.31 | 90.5 | 6.19 | (Hf) |
| B21 | 10 | 81 | 9 | 10.16 | 80.81 | 9.3 | (Hf) |
Disclaimer/Publisher’s Note: The statements, opinions and data contained in all publications are solely those of the individual author(s) and contributor(s) and not of MDPI and/or the editor(s). MDPI and/or the editor(s) disclaim responsibility for any injury to people or property resulting from any ideas, methods, instructions or products referred to in the content. |
© 2024 by the authors. Licensee MDPI, Basel, Switzerland. This article is an open access article distributed under the terms and conditions of the Creative Commons Attribution (CC BY) license (https://creativecommons.org/licenses/by/4.0/).
Share and Cite
MDPI and ACS Style
Liu, B.; Yu, Z.; Liu, L.; Zhang, L. Experimental Investigation of Phase Equilibria in the Al–Mo–Hf Ternary System at 400 °C and 600 °C. Processes 2024, 12, 969. https://doi.org/10.3390/pr12050969
AMA Style
Liu B, Yu Z, Liu L, Zhang L. Experimental Investigation of Phase Equilibria in the Al–Mo–Hf Ternary System at 400 °C and 600 °C. Processes. 2024; 12(5):969. https://doi.org/10.3390/pr12050969
Chicago/Turabian StyleLiu, Boliang, Zhiqiang Yu, Libin Liu, and Ligang Zhang. 2024. "Experimental Investigation of Phase Equilibria in the Al–Mo–Hf Ternary System at 400 °C and 600 °C" Processes 12, no. 5: 969. https://doi.org/10.3390/pr12050969
Note that from the first issue of 2016, this journal uses article numbers instead of page numbers. See further details here.