Article

Functional Optical Coherence Tomography of Rat Cortical Neurovascular Activation during Monopulse Electrical Stimulation with the Microelectrode Array

1
Research Centre of Laser Fusion, China Academy of Engineering Physics, Mianyang 621900, China
2
State Key Lab of Modern Optical Instrumentation, College of Optical Science and Engineering, Zhejiang University, Hangzhou 310027, China
*
Author to whom correspondence should be addressed.
Photonics 2024, 11(5), 420; https://doi.org/10.3390/photonics11050420
Submission received: 1 March 2024 / Revised: 22 April 2024 / Accepted: 24 April 2024 / Published: 30 April 2024
(This article belongs to the Section Biophotonics and Biomedical Optics)

Abstract

:
This paper presents a study to evoke rat cortical functional activities, including hemodynamic and neural tissue signal changes, by monopulse electrical stimulation with a microelectrode array using functional optical coherence tomography (fOCT). Based on the principal component analysis and fuzzy clustering method (PCA-FCM), the hemodynamic response of different size blood vessels in rat cortex are analyzed, showing that the hemodynamic response of the superficial large blood vessels is more concentrated. In the regions of neural tissue where blood vessels are removed, positive significant pixels (the intensity of the pixel for five consecutive frames is greater than the average value plus triple standard deviation) and negative significant pixels (the intensity of the pixel for five consecutive frames is less than the average value minus triple standard deviation) exist, and the averaged intensity signal responds rapidly with an onset time of ~20.8 ms. Furthermore, the hemodynamic response was delayed by ~3.5 s from the neural tissue response. fOCT can provide a label-free, large-scale and depth-resolved map of cortical neurovascular activation, which is a promising technology to monitor cortical small-scale neurovascular activities.

1. Introduction

The electrical stimulation of microelectrode arrays is a brain function mapping method, depicting important areas of cerebral cortex related to language, motor and sensory functions, and guiding epilepsy surgery [1,2]. As a therapeutic tool in the clinic, it is able to control epileptic seizures [3,4,5], relieve neuropathic pain [6], promote stroke recovery [7] and provide sensory feedback for bidirectional brain–computer interfaces [8,9,10]. Compared with other invasive stimulation methods, such as the single electrode, microelectrode arrays can cover a larger cortical area with lower invasiveness and excellent stability. Furthermore, the implantation technology is relatively simple, which has advantages in clinical research.
The proximity of electrodes to cortical tissue has strict restrictions on the amount of charge required for safe transporting. It is necessary to optimize the parameters of direct electrical stimulation in the cortex by monitoring and characterizing brain functional signals, including neural activities and hemodynamic changes. Electrophysiological recording is the gold standard to monitor neural activities. However, it only provides the approximate position of activated neural cells, and often faces interference from electrical stimulation signals. Two-photon imaging can be densely sampled in X, Y and Z axes, and achieve cell-level resolution. However, it has a limited field of view and requires virus injection or gene transfection to label samples [11]. Voltage-sensitive dye (VSD) staining can monitor population neural activities and provide large-scale imaging with high temporal resolution (1~10 ms). However, in large animals, the correlation between VSD staining and photodynamic damage increases the difficulty of generalization [12,13]. Optical intrinsic signal imaging (OISI) based on hemodynamic signals can provide large-scale imaging, which can be used to study brain function without adding exogenous substances but lacks depth-resolved signals [14]. None of them is non-contact (no need to insert or apply any materials), large-scale (mm to cm scale) and depth-resolved (different depth signals can be distinguished), as well as applicable in large animal models and capable of simultaneously analyzing the characteristics of cortical neurovascular activation signals.
Optical coherence tomography (OCT) is used to overcome these limitations. OCT is a non-contact, non-invasive and depth-resolved optical imaging technology. The functional OCT (fOCT)-combined intensity structure and angiograms are able to obtain neural tissue and hemodynamics signals simultaneously. Many research groups have used fOCT to study biological function signals under stimulation, and the details are shown in Table 1. However, fOCT was not used to analyze the neurovascular coupling signals via direct monopulse electrical stimulation with the microelectrode array.
In this paper, a microelectrode array was laid on the rat cortex to stimulate with a single positive and negative balanced pulse with a small current, avoiding epileptic seizures, and the single-pulse electrical stimulation had no superposition effect [20]. This study is an attempt to evoke brain functional activities via monopulse microelectrical stimulation. The blood oxygen signals were collected by OISI, and the depth-resolved brain functional signals, including neural tissue and hemodynamics signals, were obtained by fOCT. A complex decorrelation algorithm was used to calculate the hemodynamic changes, and a quantitative analysis of blood vessels based on PCA-FCM proves that the hemodynamic response amplitude of the superficial large blood vessels in rat cortex is larger upon direct electrical stimulation. Then, the blood vessel mask is used to remove the influence of blood flow, and the significant-intensity pixels are extracted by an adaptive algorithm, improving the signal-to-noise ratio (SNR) and achieving the rapid response signals of neural tissue.

2. Materials and Methods

2.1. Animal Preparation

Male Sprague-Dawley rats (n = 4; 300–500 g) were anesthetized with propofol (1.5 mL/100 g). The toe-pinch test was used to ensure the animal was in an adequate state of anesthesia. The animal was placed in a stereotactic frame and a craniotomy and durotomy were performed to expose the motor cortex (AP + 0.5, ML + 3.5, anterior–posterior [AP], medial–lateral [ML]). Mannitol (1.0 mL, 20% concentration) was given to prevent potential brain edema. The electrode array was then placed in the cerebral cortex of the motor area. Warm (~37 °C) 1.5% agar in saline was used to stabilize the cortex and a glass coverslip was placed on the agar to create an optical imaging window (~5 × 5 mm2). Dental cement was used to seal the cranial window to the skull. Finally, a skull nail was attached to the rat’s skull, indicating that the distal end was grounded. All animal experimental procedures used in this study were approved by the Animal Care and Use Committee of Zhejiang University.

2.2. OISI-OCT System and Data Acquisition

The OISI and OCT systems were used to image simultaneously. A schematic diagram of the co-registered OISI-OCT system is illustrated in Figure 1. The OCT is a custom-designed spectral domain OCT system. The OCT light source was a broadband super luminescent diode (Thorlabs, Newton, NJ, USA, SLD1325) with a center wavelength of 1325 nm and a full width at half maximum bandwidth (FWHM, Δλ) of 100 nm. The theoretical axial resolution is ~7.7 μm and the transverse resolution is ~15.2 μm in air. The output light was delivered into a 2 × 2 fiber coupler and split into the reference and sample arms, respectively. The detector was a high-speed line-scan InGaAs camera (Sensors Unlimited Inc., Princeton, NJ, USA, SU1024-LDH2, 92 kHz line-scan rate, 1024 active pixels). The output of the camera was put into a custom-designed program in PC1. In the OCT sample arm, a scanning lens (Thorlabs, LSM03) with an effective focal length of 36 mm was used to collimate the detected light in the sample and an x–y galvanometer was adopted for 3D volume scanning. Prior to the scanning lens, a dichroic mirror (Semrock, FF700-SDi01) was employed to separate the light paths for co-registered OCT and OISI. In OISI system, 540 nm green LED illumination was employed to acquire the cortex vessels’ distribution map and 632 nm red LED illumination was used to observe changes in blood oxygen concentration. The reflected light from the cortex was transmitted through the scanning lens, a dichroic mirror and a tube lens focus on a CCD camera (Photonfocus, MV1-D1312-160, 1312 × 1082 pixels). The co-registered OISI-OCT had a field of view (FOV) of ~2.5 × 2.5 mm in the x–y plane. OCT offered a max imaging range of 3 mm in the depth (z) direction. The OCT and OISI system were synchronized by an external trigger. Electrode (NeuroNexus, E32-300-20-50) on the rat cortex was connected to the stimulator (PlexStim Electrical Stimulator 2.0). The current values of stimulus waveforms were first defined in a text file in PC3 and then loaded into the stimulator via the software interface.
In this study, the volumetric OCT dataset (z-x-y) was acquired with a raster scanning protocol. In the fast-scan (x) direction, 300 A-lines formed a B-frame. A total of 1500 B-frames were acquired at equal intervals in the slow-scan (y) direction. To record the time course of electrical stimulation responses, OCT was then switched to the M-mode scanning protocol (i.e., enabling the slow-scanner for repeated B-scans). In this study, the OCT B-frame rate was set to be 240 frames per second (fps), and the OISI frame rate was set to be 4 fps.

2.3. Data Analysis

The cortical neurovascular signals were extracted by fOCT, including the changes in intensity in the neural tissue area and decorrelation in the blood vessel area during electrical stimulation. Figure 2 is the image preprocessing stage. Firstly, the decorrelation map D was calculated with a spatio-temporal kernel:
D = 1 1 T 1 M m = 1 M t = 1 T 1 X ( m ,   t ) · X * ( m , t + 1 ) 1 T M m = 1 M t = 1 T X ( m , t ) · X * ( m , t )
where m is the spatial index denoting ( z , x ) , z is the depth direction and x is the transverse direction. M is the spatial kernel size; here, the spatial kernel of 5 × 3 ( z × x ) is used.   t is the temporal index and T is the number of repeated B-frames; here, T = 2 means adjacent frames. X ( m , t ) is the OCT complex signal and means the complex conjugate. Then, an intensity threshold (the mean noise level adds its triple-standard deviation) was used as a mask to remove the low-SNR regions at the bottom [21], because the deep static tissue signals are susceptible to noise and present a high decorrelation value close to the true dynamic blood flow signals. Finally, according to the boundary detection results of the OCT structure, the angiogram was flattened, which was convenient for depth-resolved analysis. The changes in the hemodynamic responses were obtained by calculating the decorrelation of all pixels in regions of interest (ROI), averaging the number of pixels, and finally subtracting and dividing by the averaged decorrelation of the period before stimulation.
Then, the principal component analysis–fuzzy clustering method (PCA-FCM) was used to classify the hemodynamic response under stimulation [16]. The decorrelation curves of the blood flow filtered in ROIs were reduced in dimension by the PCA algorithm, and the high-dimensional data were expressed as low-dimensional features composed of several principal components by linear transformation, where the decorrelation change was expressed by the first five principal components, and its cumulative contribution rate is 95%. Then, the extracted features were used as the input of FCM, and the hemodynamic responses were classified. All hemodynamic response signals were filtered by MATLAB 2017b tool CVX (a MATLAB-based modeling system for convex optimization), reducing the influence of high-frequency noise and external disturbance and facilitating the analysis of hemodynamic responses.
Combined with the angiogram mask, which was binarized using the Otsu method, the blood vessel pixels in the OCT structure map were set to zero to eliminate the influence of blood flow as much as possible. The remaining tissue parts were flattened according to the boundary detection results of the OCT structure. Then, compared with the intensity signals before stimulation (tpre), the relative changes in OCT scattering signals after stimulation (tstim, tpost) were calculated. I ( z , x , t ) is the OCT intensity signal. The OCT intensity signals in the blank time before stimulation tpre are averaged to obtain the baseline I B a s e l i n e before stimulation:
I B a s e l i n e = 1 n i = 1 n I z , x , t i
where n is the number of collected frames corresponding to the tpre time period.
dR/R0 is used to represent the relative change in the OCT intensity signal collected in real time compared with the OCT intensity signal’s baseline:
d R / R 0 ( z , x , t ) = I z , x , t I B a s e l i n e I B a s e l i n e
For the signals collected by OISI, the relative changes are calculated by the same algorithm.
In order to improve the calculation efficiency, the signals are screened according to an adaptive algorithm [22]. If the intensity of the pixel at z , x , t i for five consecutive frames is greater than the average value plus 3 σ ( z , x ) , the pixel is defined as a positive significant pixel:
I p o s i t i v e z , x , t i : t i + 4 > 1 N i = 1 N I z , x , t i + 3 σ ( z , x )
where N represents the number of frames collected in the tpre, tstim and tpost periods, and σ ( z , x ) represents the standard deviation of all pixels at ( z , x ) .
Similarly, if the intensity of a pixel at ( z , x , t i ) for five consecutive frames is less than the average value minus 3 σ ( z , x ) , then the pixel is defined as a negative significant pixel, which is represented as follows:
I n e g a t i v e z , x , t i : t i + 4 < 1 N i = 1 N I z , x , t i 3 σ ( z , x )
The positive and negative significant pixels are screened out and a mask is generated, which is applied to the fOCT signals. Figure 3 shows a results pipeline of fOCT signals to obtain significant changes in neural tissue.

3. Results

3.1. OISI Hemodynamic Response

The OISI results (see Figure 4) show the changes in blood oxygen in the rat motor cortex under monopulse electrical stimulation. Figure 4A shows a CCD image of the rat cortex, where the electrode array covers the motor cortex region and the yellow circle’s position is the stimulating positive electrode. Under 632 nm red illumination, the OISI system captured the images of the electrical stimulation process in the ~5 × 5 mm2 cranial window region. Then, the relative reflectivity changes image is calculated by the method mentioned above, and Figure 4B shows the images at selected time points. The ROI relative change signals (−dR/R0) over time in the activation region were plotted as shown in Figure 4C. It can be seen that the relative reflectivity in the activation ROI changes at the beginning of stimulation, reaches its peak at ~2.5 s after stimulation, and then recovers slowly. Under 632 nm red illumination, the changes in relative reflectivity can represent the change in blood oxygen signal and indirectly reflect the activation of neurons. Based on the OISI images, collecting OCT cross-sectional scattering signals can provide depth-resolved local neurovascular signals under electrical stimulation.

3.2. fOCT Depth-Resolved Hemodynamic Response

Figure 5 shows the fOCT depth-resolved hemodynamic response under monopulse electrical stimulation. Figure 5A is an enface projection of angiograms, and the red circle area is the position of the positive stimulation electrode. Figure 5B is a flattened cross-sectional angiogram showing the distribution of blood vessels at different depths, and the acquisition site is the red dotted line in Figure 5A. The relative change in the averaged decorrelation of all blood vessels is shown in Figure 5C, indicating the change in blood flow velocity or flux rate. After electrical stimulation, the hemodynamic signal changes slowly, and reaches its peak at ~2.5 s, with a response trend corresponding to the OISI signal. Figure 5D analyzes the relative changes in decorrelation in ROIs 1 to 10 (red box in Figure 5B). It can be seen from the cross-sectional angiogram that the large blood vessels are mostly distributed in the superficial layer, while the small blood vessels are mostly distributed in the middle and lower layers. The blood flow signal of the selected blood vessels increases after stimulation, and the decorrelation dynamic range of the superficial blood vessels (ROIs 1 to 5) is generally larger than that of the middle and lower layers (ROIs 6 to 10).
Sixty-two blood vessels in the rat cortex under electrical stimulation were quantitatively analyzed. The blood vessels were divided into two classes, and the tail shadows of all blood vessels were manually removed during classification. The classification results are shown in Figure 6A, with sizes of 10~106 μm (class 1, n = 16, median ~45 μm) and 10~54 μm (class 2, n = 46, median ~26 μm), respectively, and the statistical results are shown by the box line diagram (see Figure 6B). The decorrelation relative change of 2 blood vessels classes is shown in Figure 6C. The decorrelation relative change of large blood vessels (class 1) is larger, while that of small blood vessels (class 2) is not obvious. Figure 6D shows the depth-resolved decorrelation map (the average of decorrelation relative change at the same depth). The position with a large response is indicated by the red arrow, which is concentrated in the cortex’s superficial layer.

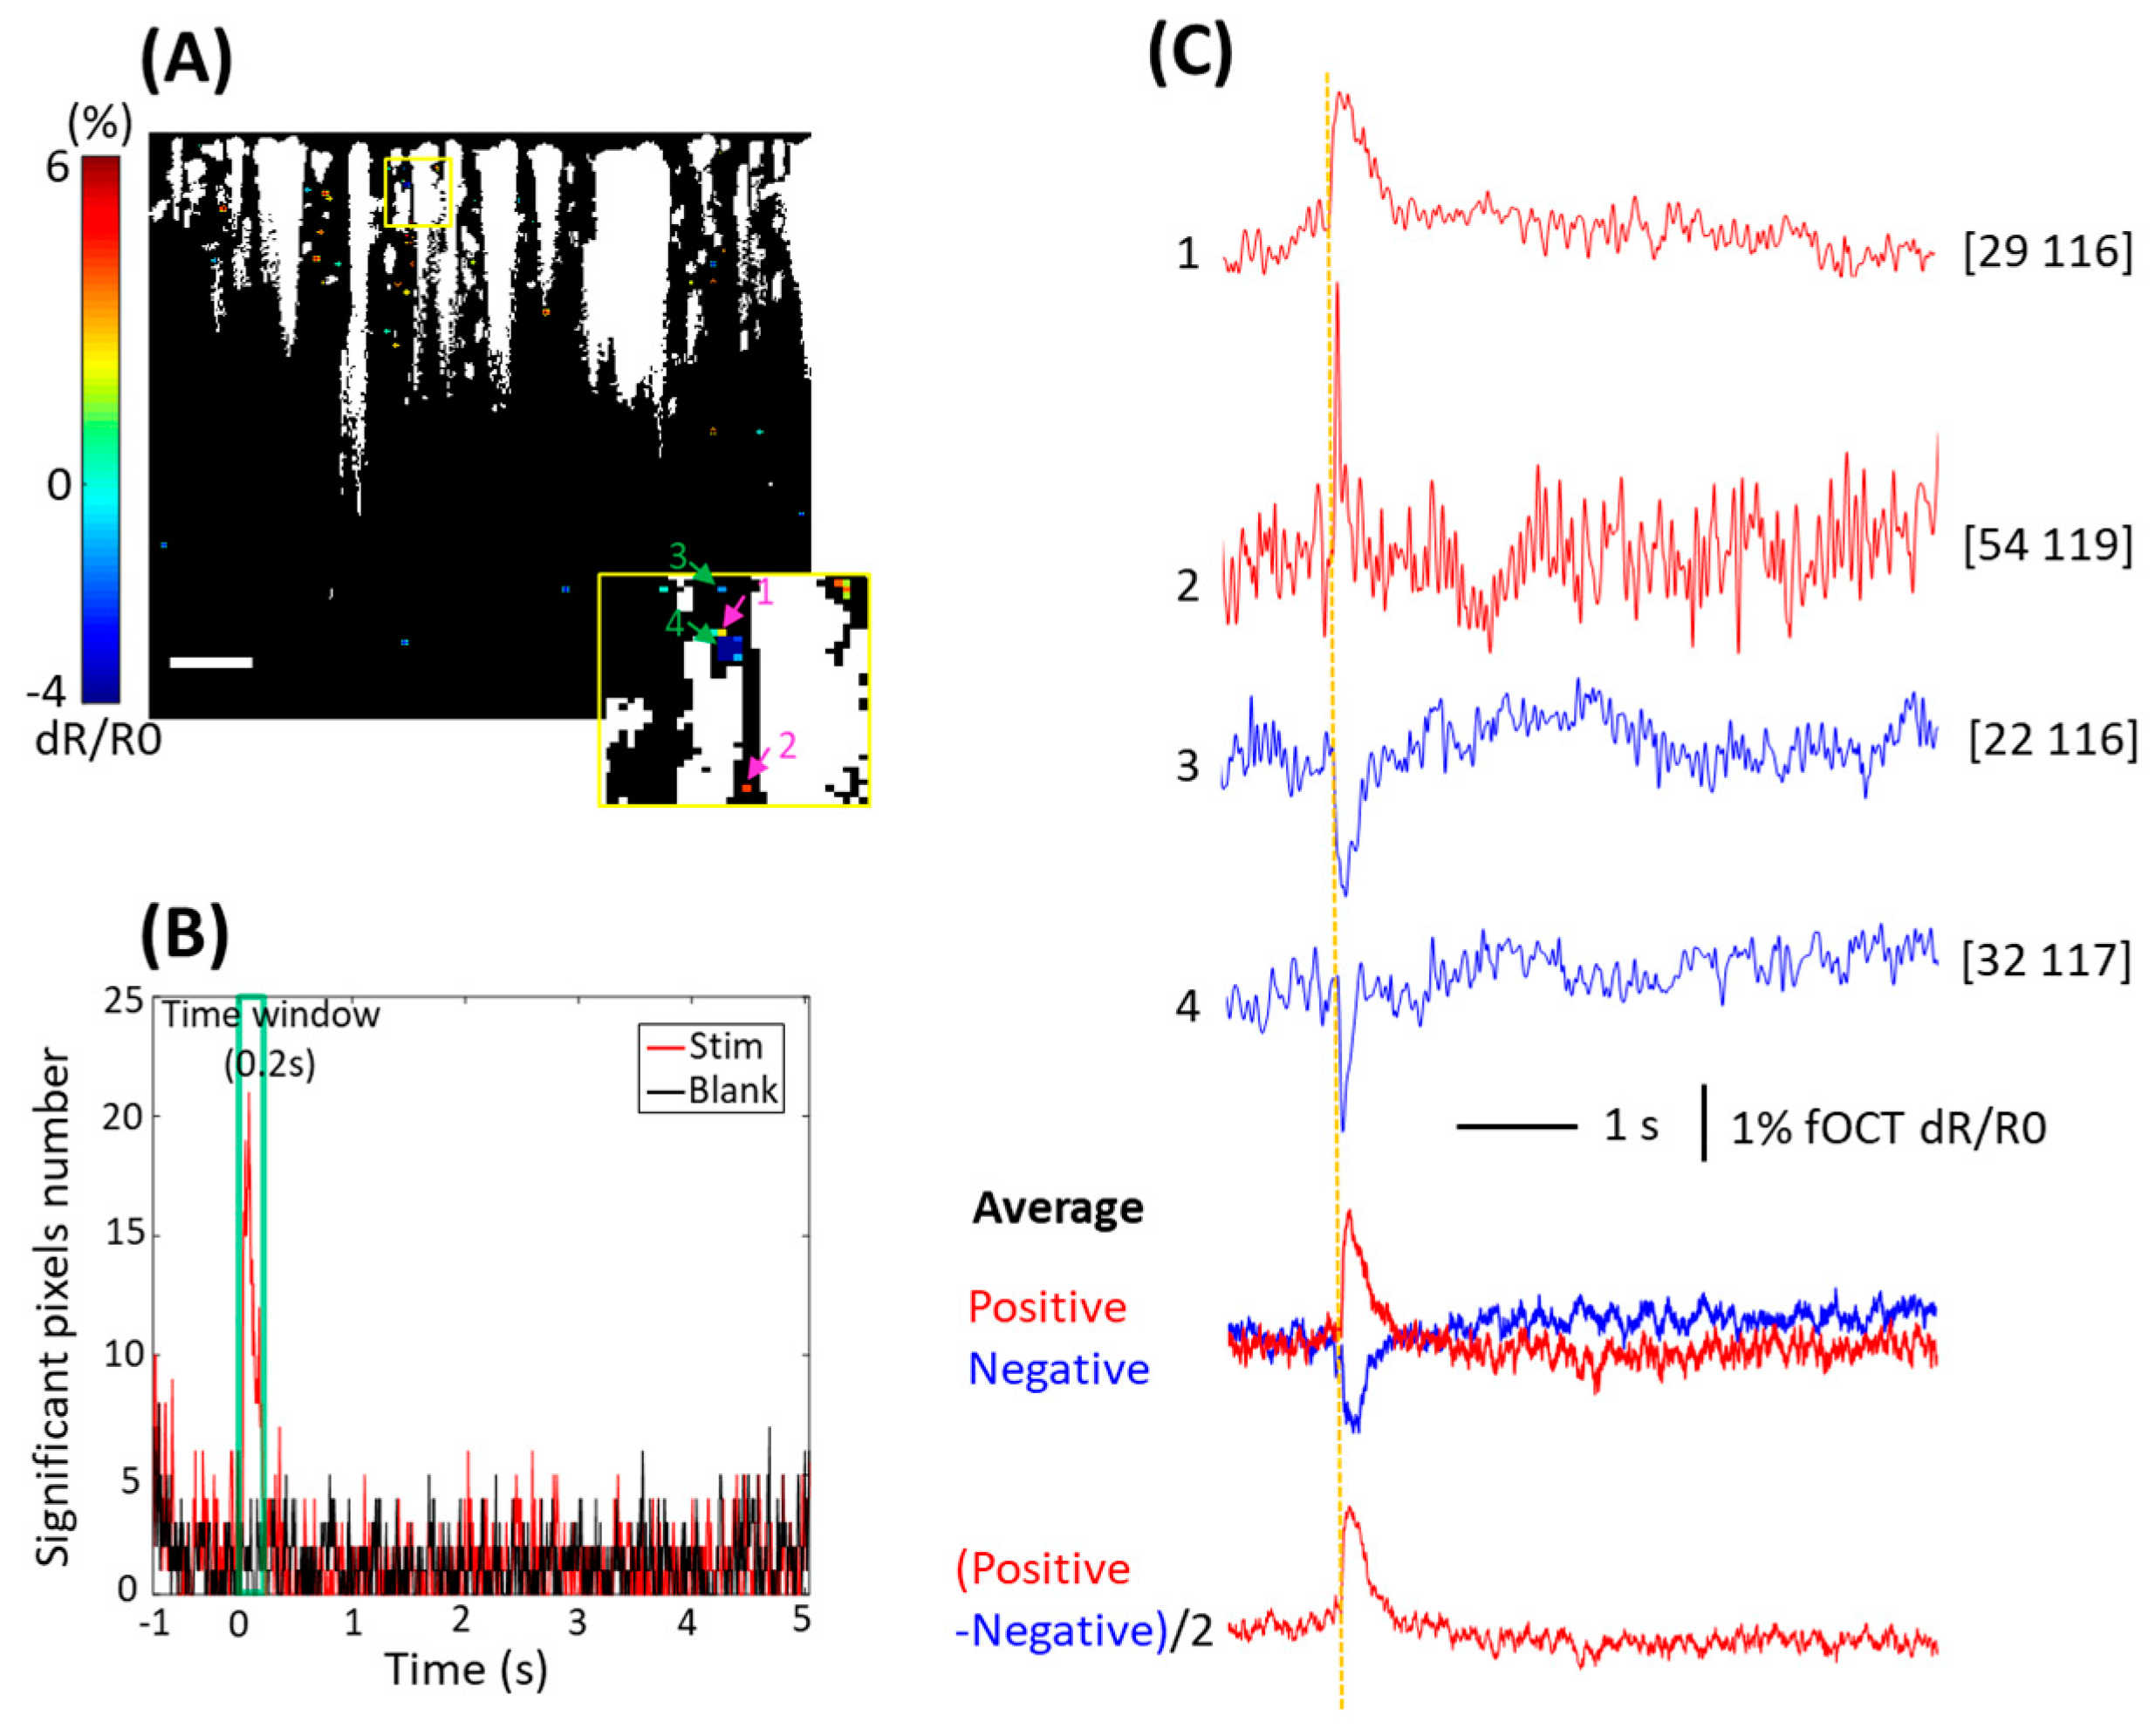
3.3. fOCT Depth-Resolved Neural Tissue Response

Figure 7 shows the fOCT depth-resolved neural tissue response under monopulse electrical stimulation. Figure 7A is a flattened, cross-sectional, neural tissue, significant pixels map, which from the significant pixels in the 0 to 0.2 s time window in Figure 7B superimposed. The statistical results of the significant pixels in the stimulation and blank conditions screened by the adaptive algorithm are shown in Figure 7B. Compared with the blank group, the number of significant pixels in the stimulation group obviously changes from 0 to 0.2 s, which may be due the neural activities evoked by stimulation. The period from 0 to 0.2 s is selected as the time window to analyze the significant pixels that appear. As shown in Figure 7C, the relative changes in the intensity of dR/R0 were obtained from pixels 1 to 4 in Figure 7A, labeled by pink arrows and green arrows. As shown in Figure 7C, the relative changes in dR/R0 intensity show different patterns, showing the rising positive response and falling negative response, and their durations are also different. All positive and negative significant pixels were averaged separately, and the amplitude of positive response was slightly larger than that of the negative response. The final significant response of the nerve tissue was obtained by combining positive and negative response signals, and the averaged response signal onset time was 20.8 ms.

3.4. fOCT Neurovascular Coupling

Neural tissue and hemodynamic response can be obtained by fOCT simultaneously, and there is a neurovascular coupling mechanism. In order to study that, we spliced the relative changes in neural tissue intensity (see Figure 8A) and hemodynamic decorrelation (see Figure 8B) of 10 trails according to the acquisition time, with an interval of 25 s recovery time. A cross-correlation analysis was performed on both of the above, and the correlation results are shown in Figure 8C. The peak appears at 3.53 s, indicating the hemodynamic response delays the neural tissue response by 3.53 s. This delay time is consistent with the previous intracellular calcium signal and fMRI BOLD signal obtained by cross-correlation analysis [23].

4. Discussion

The method described in this paper is beneficial for studying cortical neurovascular activation stimulated under a monopulse with the microelectrode array, analyzing relative changes in neural tissue intensity and hemodynamic decorrelation simultaneously. The fOCT results showed that the cortical neurovascular activation evoked by electrical stimulation corresponds excellently with the results of OISI, providing a quantitative analysis of neurovascular signals.
There have been many studies on brain functional signals in the past [15,24,25,26]. In the mechanism of neurovascular coupling, the consensus is that neural activities regulate vascular response, which occurs more rapidly. The neural signals recorded by two-photon imaging and electrophysiology change rapidly in the order of ms (from a few ms to hundreds of ms) [26,27]. From our electrical stimulation results, the relative changes in neural tissue intensity are rapid, at ~20.8 ms, and the relative changes in hemodynamic decorrelation are slower than that, which accords with this theory. The relative changes in neural tissue intensity may originate from the action potentials produced by activated neurons by electrical stimulation. The propagation and superposition of the action potentials of neurons lead to changes in scattering light intensity [19,28]. It is also possible that the rearrangement of the membrane proteins of neurons happens during electrical stimulation, resulting in changes in scattered light intensity [29]. Previous studies have suggested that neural activities cause the dilation of arteries in the soft membrane and cortex [30]. When the cortex is stimulated and the neural activities are vigorous, the blood vessel volume may change. In our study, a neural tissue response occurs more rapidly than the hemodynamic response; thus, it is supposed that the activity characteristics of neural tissue lead to changes in scattering intensity.
The relative changes in fOCT hemodynamic decorrelation correspond well with the blood oxygen changes in OISI. According to the results of the single blood vessel response and clustering classification, most of the blood vessels with a large response are distributed in the cortex’s superficial layer. This situation may be due to the electrodes directly stimulating the motor cortex, the current diffusing from top to bottom, and the position near the electrodes first being affected by the current. After the neurons are activated, the oxygen consumption increases, the blood flow transports oxygen for compensation, and the velocity of most blood vessels in the surface increases. However, there are a few small blood vessels in the middle and lower layers, which may be the rapid response of capillaries near the stimulation electrode. This specific physiological process needs further study in the future. From the depth-resolved distribution map of blood flow signals, some blood flow signals are slowed down, and there may be rapid oxygen consumption in superficial neural activities and untimely blood oxygen delivery in the middle and lower layers.
Compared with the electrophysiological recording, two-photon imaging, VSD and OISI, fOCT has the advantages of being non-contact, large-scale, depth-resolved and applicable in large animal models, as well as simultaneously analyzing the characteristics of cortical neurovascular activation signals. At present, the main challenge of fOCT in detecting neurovascular coupling is its limited resolution; thus, it cannot accurately confirm the activated individual neuron and can only acquire the response of the neurons cluster. However, in terms of its rapid neural tissue response, it is still most likely to come from neuron activation, and the limitations of fOCT will not impact the accuracy or reliability of the results. In the future, the resolution of the system can be increased, for example, through optical coherence microscopy (OCM), which sacrifices the FOV and achieves cell-level resolution with a higher numerical aperture (NA) objective and a narrower bandwidth light source [29], thus determining the signal source more clearly. Transparent electrodes can also be used for further experiments with an unobstructed field of view, and the cortical functional signals that occur under electrical stimulation can be directly collected [13], meaning that the response may be occur more quickly. In addition, in future experiments, it is possible to record the action potential of neurons synchronously with the electrophysiology and detect oxygenation changes in blood vessels synchronously with the photoplethysmogram (PPG) [31] to further explain the fOCT signals. At present, we only conducted a preliminary exploration of neurovascular signals under the monopulse electrical stimulation to avoid the accumulation effect. In the future, different research parameters (e.g., frequency, duration, or intensity) will be developed to study neurovascular coupling under multi-factor influences. Furthermore, an animal model of epilepsy disease will be built to study the long-term effects of electrical stimulation on animal brain function signals and to verify the safety of the long-term implantation of microelectrode arrays in vivo.

5. Conclusions

In summary, we used fOCT to obtain the neurovascular coupling signals caused by monopulse direct electrical stimulation with the microelectrode array in rat cortex. The hemodynamic response was obtained by the intensity threshold combined with a decorrelation analysis. The hemodynamic response of different size blood vessels was analyzed quantitatively based on PCA-FCM, showing that the hemodynamic response of the superficial large blood vessels was more concentrated by direct electrical stimulation. The adaptive algorithm improved the SNR of relative changes in neural tissue intensity. By analyzing the significant pixels of relative intensity changes, it was found that there are positive and negative patterns, and the averaged intensity signal responds rapidly. fOCT is a promising technology in cortical neurovascular research.

Author Contributions

Writing—original draft, data curation, investigation, resources, L.Y.; writing—review and editing, supervision, validation, formal analysis, J.H.; writing—review and editing, formal analysis, T.L.; software, visualization, formal analysis, H.G.; formal analysis, C.L., K.Y., H.Y. and L.H.; supervision, formal analysis, X.J.; supervision, resources, validation, formal analysis, C.W.; supervision, formal analysis, Q.Z. All authors have read and agreed to the published version of the manuscript.

Funding

This research was funded by the Dean’s Fund of China Academy of Engineering Physics (YZJJZL2024140), Zhejiang Provincial Natural Science Foundation of China (LR19F050002), the National Natural Science Foundation of China (62075189).

Institutional Review Board Statement

The animal study protocol was approved by the Animal Care and Use Committee of Zhejiang University.

Informed Consent Statement

Not applicable.

Data Availability Statement

Data will be made available on request.

Conflicts of Interest

The authors declare no conflicts of interest.

References

  1. Berger, M.S.; Kincaid, J.; Ojemann, G.A.; Lettich, E. Brain Mapping Techniques to Maximize Resection, Safety, and Seizure Control in Children with Brain Tumors. Neurosurgery 1989, 25, 786–792. [Google Scholar] [CrossRef] [PubMed]
  2. Berger, M.S.; Ojemann, G.A. Intraoperative Brain Mapping Techniques in Neuro-Oncology. Stereotact. Funct. Neurosurg. 1992, 58, 153–161. [Google Scholar] [CrossRef] [PubMed]
  3. Heck, C.N.; King-Stephens, D.; Massey, A.D.; Nair, D.R.; Jobst, B.C.; Barkley, G.L.; Salanova, V.; Cole, A.J.; Smith, M.C.; Gwinn, R.P.; et al. Two-year seizure reduction in adults with medically intractable partial onset epilepsy treated with responsive neurostimulation: Final results of the RNS System Pivotal trial. Epilepsia 2014, 55, 432–441. [Google Scholar] [CrossRef] [PubMed]
  4. Morrell, M.J. Responsive cortical stimulation for the treatment of medically intractable partial epilepsy. Neurology 2011, 77, 1295–1304. [Google Scholar] [CrossRef] [PubMed]
  5. Lee, B.; Zubair, M.N.; Marquez, Y.D.; Lee, D.M.; Kalayjian, L.A.; Heck, C.N.; Liu, C.Y. A Single-Center Experience with the NeuroPace RNS System: A Review of Techniques and Potential Problems. World Neurosurg. 2015, 84, 719–726. [Google Scholar] [CrossRef] [PubMed]
  6. Munari, C.; Kahane, P.; Tassi, L.; Francione, S.; Hoffmann, D.; Russo, G.L.; Benabid, A.L. Intracerebral Low Frequency Electrical Stimulation: A New Tool for the Definition of the “Epileptogenic Area”? In Advances in Stereotactic and Functional Neurosurgery 10; Springer: Vienna, Austria, 1993; pp. 181–185. [Google Scholar]
  7. Balossier, A.; Etard, O.; Descat, C.; Vivien, D.; Emery, E. Epidural Cortical Stimulation as a Treatment for Poststroke Aphasia:A Systematic Review of the Literature and Underlying Neurophysiological Mechanisms. Neurorehabilit. Neural Repair 2016, 30, 120–130. [Google Scholar] [CrossRef] [PubMed]
  8. Caldwell, D.J.; Ojemann, J.G.; Rao, R.P.N. Direct Electrical Stimulation in Electrocorticographic Brain-Computer Interfaces: Enabling Technologies for Input to Cortex. Front. Neurosci. 2019, 13, 804. [Google Scholar] [CrossRef]
  9. Hiremath, S.V.; Tyler-Kabara, E.C.; Wheeler, J.J.; Moran, D.W.; Gaunt, R.A.; Collinger, J.L.; Foldes, S.T.; Weber, D.J.; Chen, W.; Boninger, M.L.; et al. Human perception of electrical stimulation on the surface of somatosensory cortex. PLoS ONE 2017, 12, e0176020. [Google Scholar] [CrossRef]
  10. Kirin, S.C.; Yanagisawa, T.; Oshino, S.; Edakawa, K.; Tanaka, M.; Kishima, H.; Nishimura, Y. Somatosensation Evoked by Cortical Surface Stimulation of the Human Primary Somatosensory Cortex. Front. Neurosci. 2019, 13, 1019. [Google Scholar] [CrossRef]
  11. Histed, M.H.; Bonin, V.; Reid, R.C. Direct activation of sparse, distributed populations of cortical neurons by electrical microstimulation. Neuron 2009, 63, 508–522. [Google Scholar] [CrossRef]
  12. Tanaka, Y.; Nomoto, T.; Shiki, T.; Sakata, Y.; Shimada, Y.; Hayashida, Y.; Yagi, T. Focal activation of neuronal circuits induced by microstimulation in the visual cortex. J. Neural Eng. 2019, 16, 036007. [Google Scholar] [CrossRef] [PubMed]
  13. Kunori, N.; Takashima, I. A transparent epidural electrode array for use in conjunction with optical imaging. J. Neurosci. Methods 2015, 251, 130–137. [Google Scholar] [CrossRef] [PubMed]
  14. Chernov, M.M.; Chen, G.; Torre-Healy, L.A.; Friedman, R.M.; Roe, A.W. Microelectrode array stimulation combined with intrinsic optical imaging: A novel tool for functional brain mapping. J. Neurosci. Methods 2016, 263, 7–14. [Google Scholar] [CrossRef] [PubMed]
  15. Chen, Y.; Aguirre, A.D.; Ruvinskaya, L.; Devor, A.; Boas, D.A.; Fujimoto, J.G. Optical coherence tomography (OCT) reveals depth-resolved dynamics during functional brain activation. J. Neurosci. Methods 2009, 178, 162–173. [Google Scholar] [CrossRef] [PubMed]
  16. Kuo, W.C.; Kuo, Y.M.; Syu, J.P.; Wang, H.L.; Lai, C.M.; Chen, J.W.; Lo, Y.C.; Chen, Y.Y. The use of intensity-based Doppler variance method for single vessel response to functional neurovascular activation. J. Biophotonics 2018, 11, e201800017. [Google Scholar] [CrossRef] [PubMed]
  17. Tang, P.; Li, Y.; Rakymzhan, A.; Xie, Z.; Wang, R.K. Measurement and visualization of stimulus-evoked tissue dynamics in mouse barrel cortex using phase-sensitive optical coherence tomography. Biomed. Opt. Express 2020, 11, 699–710. [Google Scholar] [CrossRef] [PubMed]
  18. Lazebnik, M.; Marks, D.L.; Potgieter, K.; Gillette, R.; Boppart, S.A. Functional optical coherence tomography for detecting neural activity through scattering changes. Opt. Lett. 2003, 28, 1218–1220. [Google Scholar] [CrossRef]
  19. Akkin, T.; Landowne, D.; Sivaprakasam, A. Detection of neural action potentials using optical coherence tomography: Intensity and phase measurements with and without dyes. Front. Neuroenerg. 2010, 2, 1487. [Google Scholar] [CrossRef]
  20. Merrill, D.R.; Bikson, M.; Jefferys, J.G.R. Electrical stimulation of excitable tissue: Design of efficacious and safe protocols. J. Neurosci. Methods 2005, 141, 171–198. [Google Scholar] [CrossRef]
  21. Enfield, J.; Jonathan, E.; Leahy, M. In vivo imaging of the microcirculation of the volar forearm using correlation mapping optical coherence tomography (cmOCT). Biomed. Opt. Express 2011, 2, 1184–1193. [Google Scholar] [CrossRef]
  22. Zhang, Q.; Lu, R.; Wang, B.; Messinger, J.D.; Curcio, C.A.; Yao, X. Functional Optical Coherence Tomography Enables In Vivo Physiological Assessment of Retinal Rod and Cone Photoreceptors. Sci. Rep. 2015, 5, 9595. [Google Scholar] [CrossRef] [PubMed]
  23. He, Y.; Wang, M.; Chen, X.; Pohmann, R.; Polimeni, J.R.; Scheffler, K.; Rosen, B.R.; Kleinfeld, D.; Yu, X. Ultra-Slow Single-Vessel BOLD and CBV-Based fMRI Spatiotemporal Dynamics and Their Correlation with Neuronal Intracellular Calcium Signals. Neuron 2018, 97, 925–939.e5. [Google Scholar] [CrossRef] [PubMed]
  24. Hall, C.N.; Reynell, C.; Gesslein, B.; Hamilton, N.B.; Mishra, A.; Sutherland, B.A.; O’Farrell, F.M.; Buchan, A.M.; Lauritzen, M.; Attwell, D. Capillary pericytes regulate cerebral blood flow in health and disease. Nature 2014, 508, 55–60. [Google Scholar] [CrossRef]
  25. Tian, P.; Teng, I.C.; May, L.D.; Kurz, R.; Lu, K.; Scadeng, M.; Hillman, E.M.; De Crespigny, A.J.; D’Arceuil, H.E.; Mandeville, J.B.; et al. Cortical depth-specific microvascular dilation underlies laminar differences in blood oxygenation level-dependent functional MRI signal. Proc. Natl. Acad. Sci. USA 2010, 107, 15246–15251. [Google Scholar] [CrossRef] [PubMed]
  26. Baird-Daniel, E.; Daniel, A.G.S.; Wenzel, M.; Li, D.; Liou, J.Y.; Laffont, P.; Zhao, M.; Yuste, R.; Ma, H.; Schwartz, T.H. Glial Calcium Waves are Triggered by Seizure Activity and Not Essential for Initiating Ictal Onset or Neurovascular Coupling. Cereb. Cortex 2017, 27, 3318–3330. [Google Scholar] [CrossRef] [PubMed]
  27. Shafeghat, N.; Heidarinejad, M.; Murata, N.; Nakamura, H.; Inoue, T. Optical detection of neuron connectivity by random access two-photon microscopy. J. Neurosci. Methods 2016, 263, 48–56. [Google Scholar] [CrossRef]
  28. Schei, J.L.; McCluskey, M.D.; Foust, A.J.; Yao, X.C.; Rector, D.M. Action potential propagation imaged with high temporal resolution near-infrared video microscopy and polarized light. Neuroimage 2008, 40, 1034–1043. [Google Scholar] [CrossRef]
  29. Graf, B.W.; Ralston, T.S.; Ko, H.J.; Boppart, S.A. Detecting intrinsic scattering changes correlated to neuron action potentials using OCT coherence imaging. Opt. Express 2009, 17, 13447–13457. [Google Scholar] [CrossRef]
  30. Gao, Y.R.; Greene, S.E.; Drew, P.J. Mechanical restriction of intracortical vessel dilation by brain tissue sculpts the hemodynamic response. Neuroimage 2015, 115, 162–176. [Google Scholar] [CrossRef]
  31. Park, J.; Seok, H.S.; Kim, S.-S.; Shin, H. Photoplethysmogram Analysis and Applications: An Integrative Review. Front. Physiol. 2022, 12, 808451. [Google Scholar] [CrossRef]
Figure 1. Schematic of co-registered OISI-OCT system and monopulse electrical stimulation. C: collimator; D: detector; DC: dispersion compensator; PC: personal computer; FPC: fiber polarization controller; FL: Fourier lens; TL: tube lens; SL: scanning lens; SLD: super luminescent diode; DM: dichroic mirror; S: stimulator. Each trial of electrical stimulation was composed of a 1 s pre-stimulus, 0.001 s stimulation and 5.25 s post-stimulus. Electrical pulse parameters were as follows: 0.5 mA; pulse width = 500 μs; biphasic monopulse. A total of 20 trials were applied; 10 trials were in the electrical stimulation group and the other 10 trials were in the control group.
Photonics 11 00420 g001
Figure 2. Hemodynamic image preprocessing stage. Intensity threshold was used to generate blood vessels mask to remove decorrelation artifacts caused by noise. According to the boundary detection of the OCT structure, the decorrelation angiogram is flattened.
Photonics 11 00420 g002
Figure 3. Results pipeline of neural tissue response signals’ preprocessing. The binarized angiogram mask sets the blood vessel pixels in the OCT structure to zero. Based on the boundary detection results of the structure, the neural tissue part is flattened. The significant pixels are extracted via the 3 sigma principle and applied to the fOCT signals as a mask to obtain the final significant signals.
Photonics 11 00420 g003
Figure 4. OISI changes in the blood oxygen of the rat cortex under monopulse electrical stimulation. (A) CCD image of the rat cortex. The purple area indicates the distal cranial nail. The yellow circle is the positive electrode of stimulation. (B) Time course images of the relative reflectivity changes show the relative changes in blood oxygen under electrical stimulation. (C) Time courses from ROI in (B). The electrical stimulation time is marked by the orange dotted line. Scale bar = 1 mm.
Photonics 11 00420 g004
Figure 5. fOCT depth-resolved hemodynamic response of the rat cortex under monopulse electrical stimulation. (A) Enface projection of angiograms. The red circle indicates the stimulation of the positive electrode. (B) Flattened cross-sectional angiogram, whose acquisition site is the red dotted line in Figure 5A. The red box indicates the ROI of a single blood vessel. (C) Time course of averaged decorrelation relative change in all blood vessels. (D) Time course of decorrelation relative change in ROIs 1 to 10 in Figure 5B. The electrical stimulation time is marked by the orange dotted line. Scale bar = 0.3 mm.
Photonics 11 00420 g005
Figure 6. Classification results of the hemodynamic response of the rat cortex under monopulse electrical stimulation. (A) Two blood vessel classes obtained by PCA-FCM, and the first two PCs of the PCA are drawn in the feature space of the decorrelation. (B) Size statistics of two blood vessel classes. (C) Time courses of averaged decorrelation relative changes in two blood vessel classes. Orange dotted line marks electrical stimulation time. The data are expressed as mean ± SD. (D) Depth-resolved decorrelation map. The red arrow indicates the concentrated position of the region with a large response.
Photonics 11 00420 g006
Figure 7. fOCT depth-resolved neural tissue response of rat cortex under monopulse electrical stimulation. (A) Flattened cross-sectional neural tissue significant pixels map. (B) Statistics of the number of significant pixels in stimulation and blank conditions. The green box indicates the 0 to 0.2 s time window. (C) Single positive, negative and averaged response signals of significant pixels in neural tissue. The orange dotted line indicates the electrical stimulation time. Scale bar = 0.3 mm.
Photonics 11 00420 g007
Figure 8. Neurovascular coupling in the rat cortex under monopulse electrical stimulation. (A) Relative changes in the neural tissue intensity of 10 spliced trails. (B) Relative changes in the hemodynamic decorrelation of 10 spliced trails. The orange dotted lines in Figure 8A,B indicate the electrical stimulation time. (C) Cross-correlation between the relative changes in neural tissue intensity and the hemodynamic decorrelation. The dashed green line indicates the delay time of the two signals.
Photonics 11 00420 g008
Table 1. fOCT-related research.
GroupYearStimulationTechniquesResponse Results
Yu Chen et al. [15]2009Rat; forepaw electrical stimulationfOCT, OISIReflectivity changes in fOCT correlate well with OISI, and the fOCT-layer-specific response indicates a time delay of −1.5 s to 3.5 s in both the onset and
peak with respect to the stimulation pattern.
Wen-Chuan Kuo et al. [16]2018Rat; forepaw electrical stimulationfOCTResponse time of small, middle and large vessels to achieve a 5% change in vascular dilation after stimulation is 1.5 s, 2 s and 5.5 s, respectively.
Peijun Tang et al. [17]2020Mouse; whisker stimulationPhase-sensitive OCT (PhS-OCT), OISIThe activated neural tissue region in PhS-OCT is consistent with that in OISI.
Mariya Lazebnik et al. [18]2003Nerve fibers from the abdominal ganglion of the sea slug; electrical stimulationfOCTOptical scattering signal changes in neural tissue are a result of propagating action potentials.
Taner Akkin et al. [19]2010Squid giant axon; electrical stimulationfOCTThe back-scattered intensity changes coincides with the arrival of neural action potentials.
Disclaimer/Publisher’s Note: The statements, opinions and data contained in all publications are solely those of the individual author(s) and contributor(s) and not of MDPI and/or the editor(s). MDPI and/or the editor(s) disclaim responsibility for any injury to people or property resulting from any ideas, methods, instructions or products referred to in the content.

