

Do Pores Exist?—Foundational Issues in Pore Structural Characterisation
Department of Chemical and Environmental Engineering, University of Nottingham, University Park, Nottingham NG7 2RD, UK
Foundations 2024, 4(2), 225-248; https://doi.org/10.3390/foundations4020015
Submission received: 24 January 2024
/
Revised: 26 March 2024
/
Accepted: 14 May 2024
/
Published: 20 May 2024
(This article belongs to the Section Chemical Sciences)
Abstract
:This work reviews a range of fundamental theoretical considerations in pore structural characterisation. The pore concept is essential for providing a better understanding of physical processes arising within porous media than purely phenomenological approaches. The notion of a pore structure is found to be independently valid and invariant during theory change concerning said physical processes, even for structural models obtained via indirect methods. While imaging methods provide a more direct characterisation of porous solids, there is often a surfeit of information beyond that which can be wielded with current computing power to predict processes sufficiently accurately. Unfortunately, the pore network model extraction methods cannot decide in advance the level of simplification necessary to obtain the optimum minimal idealisation for a given physical process. Pore network models can be obtained with differing geometrical and topological properties, but similar mass transfer rates, for reasons that are often not clear. In contrast, the ‘pore-sifting’ strategy aims to explicitly identify the key feature of the void space that controls a mass transport process of interest.
1. Introduction
Many important industrial processes make use of porous solids, such as heterogeneous catalysts or gas separation membranes [1]. Many natural environmental processes important to resource or geohazard management occur within porous solids, such as water percolation through reservoir rocks. The pore structural characterisation of such materials is thus key to understanding, and, thereby, predicting and controlling the physical processes that arise within the void space, such as mass transport [1]. The main aim of pore structural characterisation is to create an abstract representation of the void space of a real porous material that retains the key geometrical and topological properties such that accurate simulations of physical processes remain tractable within current computing power limitations. However, this aim necessitates confrontation with several key issues, namely the following:
- Is the conceptualisation of a ‘pore’ a necessity?
- If so, how does one define a ‘pore’?
- How isomorphic with the real material does the abstract model need to be in order to be successful in the above aim?
It is the purpose of this work to survey and discuss these key issues for pore structural characterisation. In this work, it will be seen that the wider philosophical debate on realism in science is useful to frame and structure the analysis of core issues of fundamental importance in the structural characterisation of porous media, and vice versa. Key debates over realism versus anti-realism in the philosophy of science in general are analogous to current issues in pore structural characterisation, and, thus, as will be seen, the former can be used as a framework for the discussion of the latter. It will also be seen that an issue that has existed since the inception of pore structure characterisation, namely how to define what is meant by a single ‘pore’, has come to the fore with the advent of imaging-based approaches of all modalities, with the need to derive useful information from them without being swamped by large 3D data sets. The development of ever more powerful imaging systems with ever higher resolutions has meant the sheer size of these data sets has ballooned. This has led to the image-based workflows in structural characterisation coming up against limitations in the capacity of current computing power to even manipulate the vast imaging-derived data sets to deliver accurate predictions for physical processes taking place within the void space. The various approaches adopted for addressing this issue will be surveyed and discussed.
This work will discuss the over-arching, fundamental issues in pore structural characterisation in general, rather than the details of physical theory and experimental methods, as applied to particular materials, except where these are relevant to the said higher-level issues. Hence, a basic knowledge of the core relevant theory and experimental techniques, and their associated terminology and concepts, is assumed here. Therefore, readers requiring more detail on the physical theory and experimental protocols associated with particular characterisation methods, such as the various imaging modalities themselves and common indirect methods like gas sorption and mercury porosimetry, are referred to the relevant textbooks [1,2,3,4]. However, a summary of the relative advantages and disadvantages of the main pore characterisation methods is included in Table 1.
2. Are Pores Real?
2.1. Can Pores Be Observed?
An entirely phenomenological approach, treating porous materials, such as rocks, as macroscopic continua, characterised by empirically derived, global parameters, such as permeability, can be used to simply describe certain physical processes taking place within porous media [1,5]. However, such a phenomenological approach is limited in its ability to supply a fundamental understanding of the physical process and predict why the global characteristic parameters take the values they do. The basic concept of pores offers the potential to develop a much deeper theoretical understanding of the causes of phenomena involving porous materials to, for example, enable the intelligent design of new industrial products and processes utilising such porous media.
However, even the very existence of mesoporosity or microporosity has been implicitly challenged. The void spaces of porous materials are an interesting example to consider in the realism/anti-realism debate over so-called ‘unobservables’ [6]. The entities and concepts that usually feature in this debate tend to be sub-atomic particles or microbiological systems, but, here, it is suggested that porous media offer particularly relevant cases pertinent to this fundamental debate that have been neglected. Micropores and mesopores are what philosophers of science call ‘unobservables’, which are entities that cannot be directly observed with the natural senses, but, rather, require some sort of instrumentation to detect [6]. The so-called anti-realists have suggested that such unobservables do not necessarily exist, but, rather, are merely a way of speaking to link together observables like changes in the position of needles for pressure gauges and balance readouts on adsorption equipment. However, while theoretical entities, such as electrons, are clearly unobservable to naked human senses, the distinction between observable and unobservable is not always clear. Maxwell proposed a sequence that he suggested was problematic for those wishing to make a distinction between observables and unobservables [7]. That sequence is as follows: looking at something with the naked eye, looking at something through a window, looking at something through a strong pair of spectacles, looking at something through binoculars, looking at something through a low-powered microscope, and looking at something through a high-powered microscope. Maxwell suggested there is no clear boundary in this sequence, where the transition from observable to unobservable arises, and, hence, the anti-realist attempt to classify entities as unobservable fails [7]. Further, Churchland suggested that making the distinction between observable and unobservable based only upon the natural capabilities of the human senses was arbitrary, since one could envisage a race of aliens with sense organs similar to electron microscopes on earth, rather than eyes sensitive to optical wavelengths as humans have, who could see entities well beyond the capabilities of human eyes [8]. Such a race of aliens with eyes similar to SEM would readily be able to see mesopores, since these are clearly visible in such micrographs on Earth (see Figure 1a) [9].
Van Fraassen has responded that, while the distinction between observable and unobservable may be vague, it is still valid and usable to make the anti-realist case that unobservables do not necessarily exist, since one can present clear-cut examples of observables, like chairs, and unobservables, like electrons [6,11]. Van Fraassen also suggested that the distinction between observable and unobservable can be made based upon specifically taking ‘observation’ as meaning that observation was obtained unaided both conceptually and instrumentally (i.e., no instruments and no conceptual foreknowledge) [6,11]. Hence, van Fraassen would allow entities seen with telescopes, binoculars and spectacles to count as observable, but not those observed via microscopes (and the like), such as small pores. Van Fraassen claims microscopes (and the like) only allow detection, which means that something has been noted which also requires interpretation or explanation. This interpretative element means the detection needs inferential reasoning to conclude that it is this or that kind of entity, for example, that it is a spherical-shaped mesopore.
However, entities such as porous materials with void spaces with a proper continuum of features ranging in size from hundreds of microns, visible to the human eye, down to mesopores, only visible with electron microscopes, present a clear challenge to this argument. Many porous materials, such as some carbonate rocks, can possess void spaces with fractal geometry, which exhibit the property of self-similarity over length scales that range from well within the observable range but also down to the unobservable range [1,12]. The difference between this sequence and that proposed by Maxwell [7] is that there is a mathematical fractal-scaling law describing the incidence of pores at different length scales that extends well below the (vague) unobservable boundary. One can then ask why one should make a distinction about why the fractal scaling law should not also apply below the observable limit, as this cutoff does not feature anywhere in the mathematics. There is, thus, no distinction in making predictions about the nature of observable, large macropores in similar rocks yet to be cored, and unobservable nanopores in the rocks known to possess a fractal-scaling law that extends to unobservable mesoporosity. It is the same problem of induction, based upon observed regularities, in both cases. Hence, the issue of whether mesopores and micropores actually exist is no different to using the concept of (macro)porosity to explain the, say, capillarity behaviour of previously unencountered rocks with potentially observable pores.
2.2. Manipulation of Pores
The development of so-called pore ‘templating’ or ‘nano-casting’ techniques to actively design and control the development of mesoporosity of particular, desired geometries and sizes (as seen in Figure 2) is also relevant to the realism/anti-realism debate [13,14,15]. The proposal of ‘entity realism’ (or ‘experimental realism’) suggests that, if an unobservable theoretical entity can be actively created and manipulated to produce predicted observable consequences, such as electrons generated within a cathode ray tube causing a phosphor screen to glow, then they must be real [16]. The observable success of such an active manipulation is a sufficient reason to consider some (previously) theoretical entity as real. Hence, similarly, nano-templating or nano-casting techniques allow mesopores of controlled sizes and geometries to be created and effect the capillary condensation of gas (and, thus, sample weight gain is observable via a balance) at a particular pressure (given as a reading observable on a gauge), and, thence, cause the said mesopores to be considered as real [17,18,19]. The success of this manipulation of both pores and electrons (and also other distinct theoretical unobservable entities) suggests a broader, inductive, entity realism-based argument for their existence.
2.3. Structural Reality of Pores
It has been proposed that theoretical entities cannot be real, since, when theory change occurs, very different, incommensurable, new entities replace the old ones [6,11]. The pore structural representation provided by indirect characterisation methods is a theoretical entity that is supposedly consistent with the characterisation data. For porous media, this may mean the pore structural model for the material will change with new data. In response, it has been suggested that (at least some of) the underlying mathematical structure of the old theory is retained following the change to the new theory, and, thereby, some characteristics of the previous theoretical entity are retained [20]. This means that theoretical entities possess what is known as a ‘structural’ reality.
Pore size distributions from gas sorption require a model of the adsorption–desorption process [1]. It is typically assumed that, initially, at low pressure, a multi-layer film builds up on the pore surface. This was classically accounted for using a so-called universal t-layer equation, such as those of Halsey, Harkins–Jura, or Broekhoff–de Boer (BdB) [1]. Once the pressure rises to a high enough level, the whole pore fills via capillary condensation, with the critical pressure classically obtained from the Kelvin equation (or Cohan equations) [1]. More recently, density-functional theory (DFT) has been used to predict condensation in order to more accurately describe the density distribution of adsorbate within small pores than the Kelvin equation [1]. The desorption of the condensate requires that the pressure be decreased back below a critical value for it to become unstable within the pore in question, and that the liquid condensate has a free meniscus with an adjoining vapour phase into which it can desorb [1]. The desorption pressure may be lower than the corresponding adsorption critical pressure, and the system, thence, exhibits hysteresis.
Examples of the structural realism concept arise in theory change in the field of porous media. The presence of the phenomenon of hysteresis in gas/vapour sorption experiments, giving rise to H2-type hysteresis loops, is taken to imply the occurrence of pore-blocking on desorption, and, thereby, the presence of so-called ink-bottle cylindrical pores, where narrower pore necks guard the only entrance(s) to larger pore bodies, thereby preventing desorption at the critical pressure from the large pore body [1,2,3,4]. It was proposed that the measurement of the same NMR relaxation time for condensed water phase, within the ink-bottle pores of a disordered mesoporous silica, at the same saturation level, on both the adsorption and desorption branches of the hysteresis region of an isotherm, meant that the theory of pore-blocking must be wrong and/or there were no ink-bottle-type pores present [21]. This is because the pore-blocking theory implies that vapour should condense in the pore necks and bodies at different pressures, but evaporate from both at the same pressure [1]. Hence, the configuration of condensate ganglia should be different on the adsorption and desorption branches at the same amount adsorbed [21]. According to the two-fraction, fast-exchange model of relaxation, the particular (average) NMR relaxation time measured for an adsorbed condensate depends upon its overall configuration, particularly the smallest characteristic size of ganglia (as determined by the pore size it lies within) [22].
However, the NMR results could be alternatively explained by also incorporating the theory of advanced condensation [1,23]. The advanced condensation effect means that pore bodies will fill at the same pressure as co-axial, immediate-neighbour pore necks, provided the pressure required to fill the pore body via a hemispherical meniscus is below that needed to fill the pore neck via a cylindrical sleeve meniscus, according to, say, the Cohan equations [1]. Hence, if both the pore-blocking and advanced condensation effects occur then the configuration of the adsorbed ganglia is the same for both the adsorption and desorption branches of the hysteresis loop, thereby meaning the measured NMR relaxation times would also be the same [24]. It is noted that the theory change to include the advanced condensation effect means that the suggestion of an ink-bottle pore geometry (of the mathematical model of representation) for the disordered mesoporous silica is still preserved. The presence of the pore-blocking and advanced condensation effects have been detected using scattering and magnetic resonance imaging techniques, respectively, which allow for the spatial resolution of the vapour sorption processes [24,25,26].
The theoretical pore structures obtained using indirect characterisation methods, such as gas sorption, for particular samples may differ in whether they require the existence of specific pores, and, thus, making a choice between them amounts to the assertion of the existence of particular pores or not. This will be discussed as follows. Separate measurements of the pore size distribution for the same disordered material sample are often obtained via two different indirect methods, such as gas sorption and mercury porosimetry, and subsequently compared. However, due to the plethora of adjustable parameters available in the typical analysis of these data, any apparent discrepancies can be easily dismissed on an ad hoc basis. For example, the Washburn equation, commonly used to interpret mercury porosimetry, requires an appropriate value of the mercury contact angle for a given sample, but this is often only vaguely known in advance. Hence, any discrepancy with a gas adsorption pore size distribution can be easily dismissed due to an incorrect contact angle. However, the availability of model, controlled-pore-size materials, such as controlled-pore glasses (CPGs), has permitted the proper calibration of mercury contact angles, even inside nanoporosity and for both intrusion and extrusion, using independent electron microscopy data [27,28]. This has meant that direct confrontation between gas adsorption and mercury porosimetry data is less easily avoided. The development of the fully integrated, serial gas sorption and mercury porosimetry method has enabled the comparison of sizes from these different techniques for the same pores, even when these are situated amidst a disordered, inter-connected network [29]. The particular sorption data for a small sub-set of (test) pores where mercury becomes entrapped can be extracted by subtracting the sorption isotherms obtained after mercury entrapment from those obtained beforehand [29]. Further, the development of mercury thermoporometry on the entrapped mercury has enabled the full triangulation of pore sizes obtained from three different structural characterisation methods [30]. A comparison of the modal pore sizes obtained from calibrated mercury intrusion and thermoporometry, with that obtained from conventional analyses (Barrett–Joyner–Halenda (BJH) and NLDFT) of the nitrogen adsorption isotherm, for disordered mesoporous silica showed that the latter tended to over-estimate the pore size [29].
The aforementioned discrepancy in pore sizes between mercury porosimetry and thermoporometry, on the one hand, and gas sorption, on the other, suggested that capillary condensation arose at an unexpectedly (from the underlying pore geometry and characteristic size) high relative pressure. Two alternative theories have been proposed for this discrepancy. First, it may be that, while the single-pore capillary condensation theory (e.g., Cohan equations, BdB, or NLDFT) is still correct, the multi-layer build-up has been suppressed in some way in the particular pores isolated by the serial experiment, relative to the rest of the void space and/or relative to that usually envisaged for such materials as incorporated into the so-called ‘universal’ t-layer curves [29]. This theory sites the discrepancy in the (poor) wetting properties of the silica test pore walls. Alternatively, it may be that, since the void space is an inter-connected network, the pore-to-pore co-operative adsorption effect known as (network) delayed condensation may be operating [9]. The latter implies that capillary condensation in the test pores is delayed (to higher relative pressure than expected) due to the lower pore potential along the axis of these pores due to the existence of (the gaps at) junctions with side-arm pores along its length, compared with a pore of the same size and underlying (cylindrical, say) geometry but with completely solid walls. The second theory posits the existence of additional pores compared with the first [9]. The existence of this set of additional pores was preferred after comparing the findings from serial adsorption and mercury porosimetry experiments conducted, in turn, with each of two different adsorbates, namely nitrogen and argon, on the same sample [9]. This is because argon fails to wet the new pore wall created when the side-arm pores are filled with entrapped mercury following porosimetry, while nitrogen does, and, thereby, then perceives a solid wall rather than something with wetting properties more like the original gap. While both theories retain the presence of the test pore, and thus have some underlying structural similarity, the difference in the behavior of the argon and nitrogen after mercury is entrapped is best explained by also invoking the presence of the additional pores/connections. The limitations on the resolution and contrast currently possible with tomography methods makes the study of sorption behavior of individual mesopores within the extensive, complex network of macroscopic samples impossible at present.
Theories for pore structure characterisation are often extrapolated to domains in which they do not apply, or are insufficient. Nanocasting and templating techniques have provided model materials with supposedly known geometry with which to test theories of gas adsorption-based characterisation methods [17,18]. However, it has also been found that these supposedly ordered model materials are often more complex in structure than first envisaged, such as possessing surface corrugations in supposed straight, isolated cylindrical pores, or microporous walls [19]. Further, conclusions drawn based upon simplified geometries and topologies for the model templated materials do not necessarily carry over to much more complex disordered, inter-connected networks, and new effects entirely may arise for the latter [1,9]. It is thus necessary to independently, explicitly demonstrate the presence, and measure the extent, of network-specific effects, such as pore-to-pore co-operative effects like advanced condensation or delayed condensation, within disordered materials [1,9]. The single pore hysteresis effects emphasised by NLDFT-based methods of PSD determination [17,18] tend to be non-existent (as pores are too long) in, or only a minor contribution, if any, to, hysteresis within disordered porous materials [1,9], and thus are insufficient for full characterisation. Further, network modelling alone, without the prior active, independent detection of co-operative adsorption effects, has too much of a plethora of potential, empirically adjustable parameters with which to match experimental (boundary and scanning) isotherms to be considered a rigorous demonstration of a comprehensive understanding of gas sorption in such materials.
3. The Problem of the Definition of a ‘Pore’
3.1. The Identification of Pores
Even if ‘pores’ may be considered observable, the definition of what is meant by a single ‘pore’ is still problematic [1]. While individual pores are easily distinguished if they are isolated and disconnected from other holes in the solid, they are much harder to define objectively and meaningfully when they comprise just some contiguous part of a whole, fully connected, void space. For example, it is easy to discern individual, isolated pores in the disconnected void space of a foam-type material (see Figure 1b). However, it is less clear that the concept of an individual pore has any meaning for the connected void spaces of many materials, such as rocks. The idea that a void space consists of multiple, individually identifiable entities called ‘pores’ arises from the fact that, for many porous media, nitrogen adsorption or mercury intrusion occur over a wide range of applied pressures, rather than the single pressure expected in the case of a single pore size, even allowing for deviations of the shape of openings from Euclidean ideals. The distribution of these observed pressures thus presents a basis upon which to compare different materials with each other, though pressure is generally converted to pore size [1,2,3,4,5].
3.2. Scattering Methods
However, it is possible to avoid the problem of defining a single pore. Some pore characterisation methods, such as scattering methods (e.g., small angle X-ray scattering (SAXS)), provide statistical descriptors that characterise the void space of a disordered porous medium as a whole, in the sense that they do not embody individual pores, but implicitly contain the typical spatial variability in the distribution of voids (as will be seen below) [1]. These include the two-point, density–density correlation function, related to the second moment of the phase function of the porous medium. For an isotropic, homogeneous medium, a one-dimensional version of such a function shows how the probability that a location, at a distance r from any given point, is occupied by the same phase as that point varies with the distance between the two. This function can be used to reconstruct a model porous medium, possessing the same correlation function as has been originally measured, via a method such as Gaussian random fields or simulated annealing [31,32]. Such a model would possess random heterogeneities in the spatial distribution of solid and porosity phases, but the same characteristic correlation length as the original material, which is the typical distance which must be traversed in any given direction to reach the first instance of the opposite phase to the starting point. Their statistical nature means that different reconstructions with different spatial distributions of void space can all have the same two-point correlation function [1]. Reasons for this include that a model reconstructed from only a two-point correlation function would not necessarily possess exactly the same topological properties as the original, real porous material, since a three-point function (related to the third moment of the phase function) is required to encode the necessary information about the void space. Hence, to improve the accuracy of the model reconstruction of the original void space, ever more moments of the phase function are required. However, most studies only use the two-point correlation function and simply assume similarity between the result and the original void space [31,32]. This sometimes works. Overall, this approach means that the identification of individual pores is not needed.
3.3. Imaging Methods
Modern tomographic techniques, such as micro-focus X-ray imaging or 3D transmission electron microscopy (3D-TEM), can provide full 3D reconstructions of the void space of a porous medium. For many types of materials, it is possible to resolve the pore space itself. For a certain type of bimodal-pore-sized, alumina, catalyst support pellets, Yamada et al. [34] used electron tomography (3D-TEM) to image a sample volume of 304 nm × 304 nm × 53 nm at a resolution of 7 nm to characterise the mesoporosity (modal pore size ~14 nm), and synchrotron X-ray nano-CT for a sample volume of characteristic dimension, 203 μm, at a resolution of 35 nm to map the macroporosity (modal pore size ~461 nm). Strictly speaking, these reconstructions of the void space are often still models, rather than being full representations, since they will miss void space features below the resolution limit of the imaging modality [35]. Further, the ubiquitous presence of noise in the raw image data means that these images often need processing, such as passing through filters [36]. A key step in the reconstruction of the void space is the segmentation procedure whereby void space is distinguished from the skeletal solid. Different algorithms for this process can give rise to different results for the finished void space representation, so the presence of noise often means there is not a unique solution that all segmentation algorithms zero in upon [36].
Once a 3D rendering of the void space has been obtained from the imaging data, then simulations of physical processes, such as diffusion, flow and reaction, can be performed. For example, for single or multiphase flows the following methods are often used: (1) the Lattice Boltzmann method [37,38,39,40,41]; (2) the finite element, finite volume and volume of fluid methods [42,43]; (3) smoothed particle hydro-dynamics [44,45,46]; (4) the finite-difference and Laplace Stokes equation solvers [47,48]; (5) level sets [43,49]; and (6) the phase-field method [50,51]. However, even for laminar flow, all these methods are computationally expensive, which limits the size of the image-based lattice that can be studied to a volume of, typically, up to ~7003 voxels [52]. Further, the run time required, even with high-power computing resources, can be several weeks because of the requirement for an as large as possible overall lattice size to capture the representative elemental volume (REV) of a porous medium. The REV is the size of the region of the sample above which the volume-averaged characteristic parameters, such as porosity, become constant with increasing length scale. For many heterogeneous porous materials, such as rocks, the REV is so large that feasible computation is not possible in a reasonable time. The correlation length can also exceed the macroscopic size of the porous object [53].
3.4. Extraction of Simplified Models
In order to proceed with using the void space reconstruction from imaging data, for the simulation of complex physical processes therein, it is thus often necessary to reduce the degree of complexity of the model until it becomes tractable with existing computing power. This process is known as Galilean idealisation [54]. For 3D image data sets, a common approach is known as ‘pore network extraction’, whereby the 3D void space is converted into a pore network model [12,52,55,56,57]. Pore network models come in a number of variants [1]. These include pore bond networks where the void space is represented by a lattice of elementary pores, such as cylindrical tubes, and pore neck–body networks where the lattice consists of larger pore bodies located at the nodes, joined by through elements, like cylinders, lying along the bonds of the lattice, called necks or throats. Where pore necks have zero length, they are often called windows [1].
However, it is not always clear how far to proceed with Galilean idealisation in order to ensure that sufficient complexity is retained to enable the accurate simulation of a particular physical process [52,55,56,57]. The ideal simplified model extraction methodology would preserve the topology of the pore space, but, at the same time, sufficiently simplify the void space geometry to facilitate fast computations without loss in accuracy [58]. A number of algorithms have been developed to extract simpler pore network models (PNMs) from more complex imaging data sets. Various PNM extraction methods have been proposed. A summary overview is provided in Table 1 in the work of Rabbani et al. [59]. The three main types of methods that work with 3D binary (divided into void and solid), voxelised images are as follows: (1) medial/median axis (MA)-based methods, also called skeletonisation or pore-thinning/burning [60,61,62,63], (2) the maximal inscribed ball/sphere (MIB) method [64,65,66] and (3) watershed-based methods [67,68,69,70]. There are also a number of variants and hybrids (e.g., [12,58,71]) that use one of these three basic methods, or their combinations. A schematic of one example of the extraction process using a hybrid MIB-watershed algorithm is shown in Figure 3. Each method has its own relative advantages and disadvantages. In particular, watershed-based methods are best able to determine throat cross-sections, while MIB methods are best at deriving pore body size distributions. Baychev et al. [57] observed that the MIB method tends to produce smaller pores in general, and also, in many cases, interprets a void space region as a throat, whereas the watershed method interprets the same void space region as a pore. Further, these authors suggested that both these algorithms tend to overestimate the numbers of pores, with the MIB method being the worst of the two, where the actual number is already known independently for model test systems. The MIB method can even introduce connections not actually present in the real structure [57]. Ultimately, some PNMs may even retain the use of free adjustable parameters to empirically correct for discrepancies between simulation predictions and experiments, which blurs any distinction with purely phenomenological approaches [12].
Several studies have suggested that current PNMs do not provide the necessary accuracy comparable to direct voxel-based simulations [58,72], due to the insufficient preservation of the initial geometry/topology [57]. For example, as the imaging resolution limit is reached, the extraction algorithms tend to obtain smaller numbers of pores than actually exist, which can have a big effect on representational statistics [12]. Further, Gerke et al. highlighted that many current extraction methods cannot deal explicitly with pores connected by more than one throat [52]. Houston et al. [56] found that the different types of algorithms give rise to different PSDs even for the same known test model. The definition of pore morphology affects network topology and discretisation, leading to variant PNM structures being extracted for the same real material [55]. The topology of a particular extracted network can be compared with the original image data and alternative PNMs obtained via other algorithms, using parameters such as the Euler number. Gerke et al. found that pure MIB and watershed algorithms, and their own hybrid algorithm, all obtained networks with very different Euler numbers, suggesting that the topology of the original lattice was modified by at least some algorithms [52]. However, the characteristic properties of two-phase flow obtained from simulations in the various PNMs were found to be very similar, despite the difference in topology, and also differences in pore and neck size distributions [52]. This suggests that the underlying structural similarities between the models, that ultimately dictate the similar flow properties, have not been explicitly identified by the characterisation parameters used in this work. However, in contrast, Ams et al. [73] demonstrated that different network topologies induced different relative permeabilities. Hence, the exact nature and level of Galilean idealisation necessary in PNM extraction is not known in advance. This conclusion is similar to that reached by other researchers [12]. However, the approach described above, involving the coarsening of more complex imaging data to achieve a more tractable model, is only one strategy for obtaining an adequate (i.e., predictive for the process of interest) model. An alternative, older, strategy will be described in Section 4 below.
3.5. The Pore Size Distribution
As can be seen from Figure 3, the PNM extraction process naturally leads to the association of characteristic dimensions with features of the void space, and the potential to have distributions of these dimensions. This is useful because the raw forms of the holistic, 3D statistical reconstructions of porous media obtained from scattering, or 3D imaging, are not very directly informative, except in a vague, subjective way. In order to understand differences in behavior arising for the same physical process but within different porous media, it is necessary to compare the void spaces of the latter in some objective way. This requires the abstraction of statistical descriptors that can meaningfully characterise important aspects of the void space. Here, ‘meaningfully characterise’ means adequately describing an identifiable entity that can form an independent part of a causal chain for the phenomenon of interest, such that, if it were missing, the phenomenon would not occur as before. Then, for example, a comparison of the frequencies of such entities (e.g., volumes of pores of particular sizes) allows for meaningful distinctions to be made between different porous media.
While it is known that pore size distributions (typically weighted by volume or number) obtained from image analysis and more indirect methods, like mercury porosimetry, are often very different, this was previously attributed to various known phenomena such that mercury porosimetry can only probe externally accessible porosity (and, therefore, misses out isolated, disconnected voids), and the size distribution is skewed towards smaller pores by the so-called pore-shielding, or pore-shadowing, effect, which are not issues for imaging methods [74]. However, recently, attention has been drawn to the more fundamental issue that there are actually two distinctive forms that the distribution of frequencies of pores can take for fully-interconnected void spaces, and mercury porosimetry and image analysis are each archetypal examples of the methods that lead to these two different forms [75]. The image analysis methods discussed above (as in Figure 3) are based on partitioning the void space up into individual elements with clear boundaries, leading to a discrete distribution of pore sizes. In contrast, more indirect pore structure characterisation methods, such as mercury porosimetry, gas sorption and thermoporometry, obtain a continuous spectrum of pore sizes. The difference between discrete and continuous pore size distributions is shown schematically in Figure 4. Many of the indirect methods for obtaining a continuous PSD involve the utilisation of a physical phase transition (e.g., gas sorption) or fluid–fluid displacement process (e.g., mercury porosimetry) wherein a meniscus between phases advances into the porous medium gradually as the relevant control variable (e.g., vapour or hydrostatic pressure) is changed [1,2,3,4,5]. This meniscus marks the boundary of pores of sizes accessible by the value of the control value reached, and the volume of the phase behind it indicates the volume of those pores. Since the meniscus can advance incrementally as the control variable is changed, the PSD thereby obtained is a continuous spectrum of sizes, particularly if the void space geometry intruded is, say, of conical form (or an analogue), as shown in Figure 4. In one of the conical arms of the structure in the ‘3D pore size map’ in Figure 4, there are no clear partitions between ‘pores’ of different size consisting of thin cross-sectional slices of the cone. In contrast, the partitions between individual pore bodies and necks in the extracted PNM shown at the bottom of Figure 3 are relatively much less ambiguous, although they are not completely unambiguous since they are still somewhat extraction algorithm-dependent, as mentioned above.
The existence of the two possible, distinguishable forms for the PSD begs the question of which is the ‘correct’ PSD. In answer, it could be said that both forms are somewhat abstract, derivative constructions of the whole, real void space. However, one or another may be better suited for distinguishing between porous materials of a particular character (such as discrete PSDs for foams), and/or for making predictions concerning particular physical processes occurring within the porous material (such as continuous for capillary ingress).
4. Virtual Pores
As mentioned above, it is not clear in advance how far the similitude between a mathematical model of a porous medium and the latter’s real void space needs to be in order to ensure suitable accuracy for predictions of physical processes using said model. This means that the optimisation of the simplification process involved in PNM extraction can only be achieved by a posteriori trial and error. The target optimal models of the void space structure having just the degree of complexity necessary to include the particular causal factors which give rise to the phenomenon of interest are denoted as minimalist idealisation models [54]. Before the advent of more direct imaging methods of pore structural characterisation, the indirect methods, like gas sorption, necessitated the use of a model of interpretation [1,2,3,4,5]. The simplest version was the parallel pore bundle model, often consisting of an array of isolated regular cylindrical pores, similar to a ‘wine-rack’ type structure. More sophisticated pore bond network models were introduced to include some inter-connectivity between pores, known to exist in disordered materials from electron microscopy data [1]. The first such models, like the 2D square grid applied to the interpretation of mercury intrusion by Androutsopoulos and Mann [76], were abstract, apart from the attempt to represent the full pore size distribution of the real material across the pore bonds of the model. Ever more statistical descriptors, derived from measurements of porous materials, such as pore connectivity, can be incorporated into the model, and more experimental data can be used to constrain the structural model [77]. Further increments in pore structural complexity included adding surface roughness, incorporated, via fractal models, into Euclidean pore bond geometries [78].
Mann and co-workers developed additional stages for the increasing complexification of basic pore bond networks using low melting point alloy (LMPA) intrusion to complement mercury porosimetry, especially to remove the pore-shielding effect in the latter [79,80,81,82]. This approach involved simulating, on the PNM, the serial sectioning and imaging of the porous material to obtain so-called ‘virtual reality sections’ (VRS), in addition to liquid metal (mercury of LMPA) intrusion [79,80,81]. Examples comparing the predictions of the imaging results with simulations for a macroporous alumina catalyst pellet are given in Figure 5 and Figure 6. The form of the images could be more quantitatively compared by considering such parameters as the numbers, size distribution and overall area of intruded elements in the images. Such comparisons could be used to de-shield the initial mercury porosimetry intrusion PSD by adjusting the shape (roughness) of the individual pores, the overall PSD and the spatial disposition of different sizes used for the bonds in the network model until both the shape of the intrusion curve and the image characteristics matched between the experiment and simulation. Later developments incorporated a comparison of the PNM simulations with 3D X-ray tomography images of LMPA-intruded samples [82]. Hence, this approach ultimately uses similar experimental data sets, to build up the complexity of the PNM until the same target requisite minimal idealisation state is achieved, to the coarsening down approach of the PNM extraction algorithms discussed above.
Also, similar to the PNM extraction approach, the ultimate validation of the structural model does not necessarily come from structural characterisation data, but from the more complex physical process of interest taking place therein. For example, besides the PSD, Rieckmann and Keil [83] obtained the mesopore connectivity of a bidisperse, meso-/macro-porous silica–alumina support for a palladium catalyst, using the percolation analysis proposed by Seaton [84]. These researchers [83] then used these particular void space descriptors to construct a structural model consisting of a three-dimensional, random, cubic network of interconnected cylindrical pores. They then simulated the coupled diffusion and reaction processes involved in the selective hydrogenation of 1,2-dichloropropane to propane and hydrochloric acid in a single-pellet reactor on this structural model. While the original process simulation was unsuccessful in replicating the experiment, it was found that retaining the same structural model but augmenting the process model by the incorporation of an adjustable surface diffusivity led to much better agreement between the simulation predictions and experiment [83].
The building up strategy may be more (computationally) efficient, (theoretically) elegant and (more broadly) informative than the coarsening down strategy. If the model is built up in discrete stages of increasing, but pre-defined, complexity, it can be more apparent when the minimalist idealisation for a given physical process has been achieved, and, more importantly, why this has arisen. The minimalist idealisation achieved by this route can possess an elegant simplicity that might be missed by the overkill of the PNM extraction process. For example, a combination of multi-modal imaging techniques, including both low- and high-resolution computerised X-ray tomography (CXT) and FIB-SEM, showed (see Figure 7) that a macroscopic (5 mm diameter and length), cylindrical, fresh (unreduced) methanol synthesis catalyst pellet possessed structural heterogeneities over a very wide range of length scales, from the size of the whole pellet down to the nanopore scale [85]. This level of heterogeneity across the macroscopic dimensions of a whole pellet, with the astronomical number of ~1014 pores, would render it unfeasible to use the ‘brute force’ approach of constructing a single image-derived void space model. It is also not immediately obvious from the images which pore feature(s) will dominate mass transfer, and other physical, processes occurring within the pellet.
The structural heterogeneities, as observed in Figure 7, were found to affect the pattern of mercury intrusion and entrapment in the pellet during porosimetry, as observed via CXT images obtained thereafter and shown in Figure 8 [85]. For the SD feed pellets, the macroscopic heterogeneities led to the pattern of mercury intrusion and entrapment having a ‘shrinking core’ form, but where some obvious round SD feed particles were left completely unintruded (dark) behind the (bright white) advancing mercury intrusion front.
However, despite the high level of complexity of the methanol synthesis pellet structure, it was found that a simple random pore bond network could predict, from serial nitrogen overcondensation and (sorption) data, the changes in the mass transport coefficient from the linear driving force model for kinetic nitrogen gas uptake following mercury entrapment, as shown schematically in Figure 9 [85]. The mass transfer coefficient was proportional to the ratio of the porosity to the tortuosity of the pellet. A percolation theory-based analysis of the nitrogen sorption hysteresis loops was used to obtain the pore connectivity and lattice size (L) of the random PNM [86]. Given that tortuosity is a measure of the extension of the path length of the diffusional flux beyond that of the straight-line distance across the porous medium, then the relative change in tortuosity can be related to the relative change in effective network size, as measured by apparent lattice size. Hence, the change in the measured tortuosity, τ, for mass uptake into the modified pellet void space, relative to that for the original empty pellet (denoted by the subscript 0), can be related to the change in the apparent size of the percolation model lattice size (L − L0) following mercury entrapment via the following relation [85]:
where w is the pellet feed particle size and S/V is the external surface area-to-volume ratio of the finished pellet; the ratio of the geometry factors for the feed particles and whole pellet is denoted as γ, which would be equal to unity if the feed particles and pellet had the same geometrical shape. As can be seen from Figure 9, the experimental findings for SD methanol synthesis pellets, and also for similar pellets made with a differently sized roll-compacted (RC) feed, were found to be consistent with Equation (1).
This work was also able to show that a relatively simple, abstract model could capture the key structural aspect of a complex real material determining mass transport processes within the void space [85]. The data shown in Figure 9 suggested that the apparent lattice size of the PNM appeared to increase following mercury entrapment. This is because the lattice size of a random PNM is related to a particular aspect of the originating gas sorption data. The roundedness of the knee in the gas desorption isotherm is considered to be the physical manifestation of the lattice-size effect on the percolation accessibility function for model random bond networks. A more rounded desorption knee implies a higher prevalence of surface clusters of larger pores, relative to interior, bulk pores, as is present in smaller random pore bond network models. The CXT images in Figure 8 show the presence of surface clusters of larger pores in the real pellet, as these become filled with entrapped mercury at lower intrusion pressures. In the model structures, as the lattice size increases, the overall surface area-to-volume ratio of the lattice decreases, and the relative proportion of surface clusters to interior pores decreases. This results in the percolation knee for lattice models becoming sharper. In the real material, the loss of the surface clusters, due to filling with mercury, makes the (accessible to nitrogen) surface area of the pellet decline, such that the apparent S/V ratio decreases too. This also causes the desorption knee to sharpen, as access to the interior of the pellet for the nitrogen becomes more restricted due to the partial mercury barrier. Hence, the apparent lattice size (from a percolation analysis of the gas sorption data) of the real pellet also appears to increase. The apparent lattice size of the model for pellets partially filled with mercury increases with entrapment level. Obviously, the real pellet does not actually expand, so the model lattice size is an abstract parameter that is a proxy measure of the loss of the surface clusters of larger pores. However, the loss of these surface clusters of larger pores impacts the kinetics of mass transport as well as the evaporation of condensate in desorption, since diffusing molecules are forced to take detours around the blocked surface clusters to access the deeper interior. Hence, the same abstract proxy measure of the prevalence of remaining surface clusters relates to both the shapes of the gas sorption hysteresis loops and kinetic gas uptake curves, and can, thus, act as an intermediate, instrumental relation between them, as shown schematically in Figure 9. In contrast, previously, Rouquerol et al. [4] suggested that the physical significance of the lattice size parameter L, from the percolation analysis, is ‘difficult to understand’.
Despite the abstract nature of the underlying structure, as required for a successful scientific theory, the model implicit in Equation (1) was also found to be able to generate novel predictions for the evolution of fresh pellets following the reduction of the copper catalyst and the sintering of the catalyst due to use on-stream in the methanol synthesis process in a reactor [87]. It was found that the universal plot of the form in Figure 9 was able to predict a change from 1300 to 190 μm in the key length scale parameter w, and thus ‘sift-out’ the structural feature controlling mass transport in methanol catalyst pellets formed with RC feed particles. This prediction was confirmed by CXT images that showed that, following catalyst reduction and sintering, a new set of pores had, indeed, opened up in the pellet over the shorter length scale predicted by the plot of the gas sorption data to Equation (1) [87]. In principle, this procedure could also have been performed in reverse, whereupon this new information from the CXT could have been fed into the value of w for the plot of Equation (1) to predict the changes in mass transport rates resulting from changes to the pore structure.
The underlying PNM used in this previous work [85,87] is, as demonstrated by its unrealistic apparent ‘growth’, rather abstract (i.e., a ‘mathematical fiction’). The pores in the PNM do not correspond to individual pore elements of the type seen at the bottom of Figure 3. However, the CXT data (in Figure 8) suggest that the abstract, individual bonds in the model lattice have some correspondence with the physical void space within and/or surrounding individual pellet feed particles (such as the SD particles in Figure 7) [85,87]. Nevertheless, the representation of the void space is of a more simplified, statistical nature, where only the minimally necessary features have been ‘sifted’ out from the overall, background structural complexity. The PNM may be a mapping of the structural features most critical for controlling mass transport, which are of a characteristic length scale, ~w.
5. Conclusions
While the phenomenological approach has no need for the concept of a ‘pore’, it fails to provide any understanding or explanation for the rate of a given physical process within a porous material. It has been shown that pores are a valid concept and can provide an explanation for phenomena that arise within porous materials. Even pore structural models obtained via indirect characterisation methods can remain invariant and independently valid despite changes to theories concerning physical processes occurring within them. It has also been seen that any PNM extraction method does not specify a priori, or discover during its operation, what level of simplification is necessary to achieve the minimalist idealisation necessary to accurately predict a given physical process of interest. In contrast, the ‘pore-sifting’ strategy attempts to actively, explicitly identify the void space feature and length scale that control mass transport.
Funding
This research was funded by the University of Nottingham.
Conflicts of Interest
The author declares no conflict of interest.
References
- Rigby, S.P. Structural Characterisation of Natural and Industrial Porous Materials: A Manual; Springer International Publishing: Cham, Switzerland, 2020. [Google Scholar]
- Gregg, S.J.; Sing, K.S.W. Adsorption, Surface Area and Porosity, 2nd ed.; Academic Press: London, UK, 1982. [Google Scholar]
- Lowell, S.; Shields, J.E. Powder Surface Area and Porosity; Springer: Dordrecht, The Netherlands, 2011. [Google Scholar]
- Rouquerol, F.; Rouquerol, J.; Sing, K. Adsorption by Powders and Porous Solids: Principles, Methodology and Applications; Academic Press: London, UK, 1999. [Google Scholar]
- Dullien, F.A.L. Porous Media: Fluid Transport and Pore Structure, 2nd ed.; Academic Press: San Diego, CA, USA, 1992. [Google Scholar]
- Monton, B.; Mohler, C. Constructive Empiricism. Available online: https://plato.stanford.edu/entries/constructive-empiricism/ (accessed on 19 January 2024).
- Maxwell, G. The Ontological Status of Theoretical Entities. In Scientific Explanation, Space, and Time; Feigl, H., Maxwell, G., Eds.; Minnesota Studies in the Philosophy of Science 3; University of Minnesota Press: Minneapolis, MN, USA, 1962; pp. 181–192. [Google Scholar]
- Churchland, P. The Ontological Status of Observables: In Praise of the Superempirical Virtues. In Images of Science: Essays on Realism and Empiricism (with a reply from Bas C. van Fraassen); Churchland, P., Hooker, C., Eds.; University of Chicago Press: Chicago, IL, USA, 1985; pp. 35–47. [Google Scholar]
- Rigby, S.P.; Hasan, M.; Hitchcock, I.; Fletcher, R.S. Detection of the delayed condensation effect and determination of its impact on the accuracy of gas adsorption pore size distributions. Colloids Surf. A 2017, 517, 33–44. [Google Scholar] [CrossRef]
- Nepryahin, A.; Fletcher, R.; Holt, E.M.; Rigby, S.P. Techniques for direct experimental evaluation of structure–transport relationships in disordered porous solids. Adsorption 2016, 22, 993–1000. [Google Scholar] [CrossRef] [PubMed]
- van Fraassen, B. The Scientific Image; Oxford University Press: Oxford, UK, 1980. [Google Scholar]
- Raeini, A.Q.; Bijeljic, B.; Blunt, M.J. Generalized network modeling: Network extraction as a coarse-scale discretization of the void space of porous media. Phys. Rev. E 2017, 96, 013312. [Google Scholar] [CrossRef] [PubMed]
- Kresge, C.T.; Leonowicz, M.E.; Roth, W.J.; Vartuli, W.C.; Beck, J.S. Ordered mesoporous molecular sieves synthesised by a liquid-crystal template mechanism. Nature 1992, 359, 710–712. [Google Scholar] [CrossRef]
- Zhao, D.; Huo, Q.; Feng, J.; Chmelka, B.F.; Stucky, C.D. Nonionic triblock and star diblock copolymer and oligomeric surfactant syntheses of highly ordered, hydrothermally stable, mesoporous silica structures. J. Am. Chem. Soc. 1998, 120, 6024–6036. [Google Scholar] [CrossRef]
- Velev, O.D.; Jede, T.A.; Lobo, R.F.; Lenhoff, A.M. Porous silica via colloidal crystallization. Nature 1997, 389, 447–448. [Google Scholar] [CrossRef]
- Hacking, I. Experimentation and Scientific Realism. Philos. Top. 1982, 13, 71–87. [Google Scholar] [CrossRef]
- Neimark, A.V.; Ravikovitch, P.I. Capillary Condensation in MMS and Pore Structure Characterization. Micropor Mesopor Mater. 2001, 44, 697–707. [Google Scholar] [CrossRef]
- Ravikovitch, P.I.; O’Domhnaill, S.C.; Neimark, A.V.; Schuth, F.; Unger, K.K. Capillary Hysteresis in Nanopores: Theoretical and Experimental Studies of Nitrogen Adsorption on MCM-41. Langmuir 1995, 11, 4765–4772. [Google Scholar] [CrossRef]
- Impéror-Clerc, M.; Davidson, P.; Davidson, A. Existence of a microporous corona around the mesopores of silica-based SBA-15 materials templated by triblock copolymers. J. Am. Chem. Soc. 2000, 122, 11925–11933. [Google Scholar] [CrossRef]
- Ladyman, J. Structural Realism, Stanford Encyclopedia of Philosophy. Available online: https://plato.stanford.edu/entries/structural-realism/ (accessed on 19 January 2024).
- Porion, P.; Faugère; Levitz, P.; Van Damme, H.; Raoof, A.; Guilbaud, J.P.; Chevoir, F. A NMR investigation of adsorption/desorption hysteresis in porous silica gels. Magn. Reson. Imaging 1998, 16, 679–682. [Google Scholar] [CrossRef] [PubMed]
- Brownstein, K.R.; Tarr, C.E. Spin-lattice relaxation in a system governed by diffusion. J. Magn. Reson. 1977, 26, 17–25. [Google Scholar] [CrossRef]
- de Boer, J.H. The shapes of capillaries. In The Structure and Properties of Porous Solids; Everett, D.H., Stone, F.S., Eds.; Butterworths Scientific Publications: London, UK, 1958; p. 68. [Google Scholar]
- Hitchcock, I.; Chudek, J.A.; Holt, E.M.; Lowe, J.P.; Rigby, S.P. NMR Studies of Cooperative Effects in Adsorption. Langmuir 2010, 26, 18061–18070. [Google Scholar] [CrossRef]
- Page, J.H.; Liu, J.; Abeles, B.; Deckman, H.W.; Weitz, D.A. Pore-space correlations in capillary condensation in Vycor. Phys. Rev. Lett. 1993, 71, 1216. [Google Scholar] [CrossRef] [PubMed]
- Page, J.H.; Liu, J.; Abeles, B.; Herbolzheimer, E.; Deckman, H.W.; Weitz, D.A. Adsorption and desorption of a wetting fluid in Vycor studied by acoustic and optical techniques. Phys. Rev. E 1995, 52, 2763. [Google Scholar] [CrossRef] [PubMed]
- Liabastre, A.A.; Orr, C. Evaluation of pore structure by mercury penetration. J. Colloid. Interface Sci. 1978, 64, 1–18. [Google Scholar] [CrossRef]
- Wardlaw, N.C.; McKellar, M. Mercury porosimetry and the interpretation of pore geometry in sedimentary rocks and artificial models. Powder Technol. 1981, 29, 127–143. [Google Scholar] [CrossRef]
- Rigby, S.P.; Chigada, P.I.; Perkins, E.L.; Watt-Smith, M.J.; Lowe, J.P.; Edler, K.J. Fundamental studies of gas sorption within mesopores situated amidst an inter-connected, irregular network. Adsorption 2008, 14, 289–307. [Google Scholar] [CrossRef]
- Mousa, S.; Baron, K.; Fletcher, R.S.; Rigby, S.P. Triangulation of pore structural characterisation of disordered mesoporous silica using novel hybrid methods involving dual-probe porosimetries. Colloids Surf. A 2022, 653, 130026. [Google Scholar] [CrossRef]
- Pellenq, R.J.M.; Rousseau, B.; Levitz, P. A Grand Canonical Monte Carlo study of argon adsorption/condensation in mesoporous silica glasses. Phys. Chem. Chem. Phys. 2001, 3, 1207–1212. [Google Scholar] [CrossRef]
- Manwart, C.; Torquato, S.; Hilfer, R. Stochastic reconstruction of sandstones. Phys. Rev. E 2000, 62, 893–899. [Google Scholar] [CrossRef] [PubMed]
- Štěpánek, F.; Šoóš, M.; Rajniak, P. Characterisation of porous media by the virtual capillary condensation method. Colloids Surf. A 2007, 300, 11–20. [Google Scholar] [CrossRef]
- Yamada, H.; Tagawa, T.; Nagao, S.; Kato, S. Investigation of gas diffusion phenomena in porous catalyst support pellets based on microstructure. Catal. Today 2021, 375, 30–35. [Google Scholar] [CrossRef]
- Jivkov, A.P.; Xiong, Q. A network model for diffusion in media with partially resolvable pore space characteristics. Trans. Porous Media 2014, 105, 83–104. [Google Scholar] [CrossRef]
- Arif, M.; Mahmoud, Y.; Zhang, S.; Iglauer, S. X-ray tomography imaging of shale microstructures: A review in the context of multiscale correlative imaging. Int. J. Coal Geol. 2020, 233, 103641. [Google Scholar] [CrossRef]
- Khirevich, S.; Ginzburg, I.; Tallarek, U. Coarse-and fine-grid numerical behavior of MRT/TRT lattice-Boltzmann schemes in regular and random sphere packings. J. Comput. Phys. 2015, 281, 708–742. [Google Scholar] [CrossRef]
- Dashtian, H.; Bakhshian, S.; Hajirezaie, S.; Nicot, J.P.; Hosseini, S.A. Convection-diffusion-reaction of CO2-enriched brine in porous media: A pore-scale study. Comput. Geosci. 2019, 125, 19–29. [Google Scholar] [CrossRef]
- Bakhshian, S.; Hosseini, S.A.; Shokri, H. Pore-scale characteristics of multiphase flow in heterogeneous porous media using the lattice Boltzmann method. Sci. Rep. 2019, 9, 3377. [Google Scholar] [CrossRef]
- Hao, L.; Cheng, P. Pore-scale simulations on relative permeabilities of porous media by lattice Boltzmann method. Int. J. Heat. Mass. Transf. 2010, 53, 1908–1913. [Google Scholar] [CrossRef]
- Zhang, M.Z.; Xu, K.M.; He, Y.J.; Jivkov, A.P. Pore-scale modelling of 3D moisture distribution and critical saturation in cementitious materials. Constr. Build. Mater. 2014, 64, 222–230. [Google Scholar] [CrossRef]
- Raeini, A.Q.; Blunt, M.J.; Bijeljic, B. Modelling two-phase flow in porous media at the pore scale using the volume-of-fluid method. J. Comput. Phys. 2012, 231, 5653–5668. [Google Scholar] [CrossRef]
- Bilger, C.; Aboukhedr, M.; Vogiatzaki, K.; Cant, R.S. Evaluation of two-phase flow solvers using level set and volume of fluid methods. J. Comput. Phys. 2017, 345, 665–686. [Google Scholar] [CrossRef]
- Holmes, D.W.; Williams, J.R.; Tilke, P.; Leonardi, C.R. Characterizing flow in oil reservoir rock using SPH: Absolute permeability. Comput. Particle Mech. 2016, 3, 141–154. [Google Scholar] [CrossRef]
- Tartakovsky, A.M.; Meakin, P.; Scheibe, T.D.; West, R.M.E. Simulations of reactive transport and precipitation with smoothed particle hydrodynamics. J. Comput. Phys. 2007, 222, 654–672. [Google Scholar] [CrossRef]
- Tartakovsky, A.M.; Meakin, P. Pore scale modeling of immiscible and miscible fluid flows using smoothed particle hydrodynamics. Adv. Water Resour. 2006, 29, 1464–1478. [Google Scholar] [CrossRef]
- Shabro, V.; Torres-Verdín, C.; Javadpour, F.; Sepehrnoori, K. Finite-difference approximation for fluid-flow simulation and calculation of permeability in porous media. Transp. Porous Media 2012, 94, 775–793. [Google Scholar] [CrossRef]
- Oren, P.E.; Bakke, S.; Held, R. Direct pore-scale computation of material and transport properties for North Sea reservoir rocks. Water Resour. Res. 2007, 43, W12S04. [Google Scholar] [CrossRef]
- Verma, R.; Icardi, M.; Prodanović, M. Effect of wettability on two-phase quasi-static displacement: Validation of two pore scale modeling approaches. J. Contam. Hydrol. 2018, 212, 115–133. [Google Scholar] [CrossRef] [PubMed]
- Demianov, A.; Dinariev, O.; Evseev, N. Density functional modelling in multiphase compositional hydrodynamics. Can. J. Chem. Eng. 2011, 89, 206–226. [Google Scholar] [CrossRef]
- Rokhforouz, M.R.; Akhlaghi Amiri, H.A. Phase-field simulation of counter-current spontaneous imbibition in a fractured heterogeneous porous medium. Phys. Fluids 2017, 29, 062104. [Google Scholar] [CrossRef]
- Gerke, K.M.; Sizonenko, T.O.; Karsanina, M.V.; Lavrukhin, E.V.; Abashkin, V.V.; Korost, D.V. Improving watershed-based pore-network extraction method using maximum inscribed ball pore-body positioning. Adv. Water Resour. 2020, 140, 103576. [Google Scholar] [CrossRef]
- Nepryahin, A.; Fletcher, R.; Holt, E.M.; Rigby, S.P. Structure-transport relationships in disordered solids using integrated rate of gas sorption and mercury porosimetry. Chem. Eng. Sci. 2016, 152, 663–673. [Google Scholar] [CrossRef]
- Weisberg, M. Simulation and Similarity: Using Models to Understand the World; Oxford University Press: Oxford, UK, 2013. [Google Scholar]
- Xiong, Q.; Baychev, T.G.; Jivkov, A.P. Review of pore network modelling of porous media: Experimental characterisations, network constructions and applications to reactive transport. J. Contam. Hydrol. 2016, 192, 101–117. [Google Scholar] [CrossRef] [PubMed]
- Houston, A.N.; Otten, W.; Falconer, R.; Monga, O.; Baveye, P.C.; Hapca, S.M. Quantification of the pore size distribution of soils: Assessment of existing software using tomographic and synthetic 3D images. Geoderma 2017, 299, 73–82. [Google Scholar] [CrossRef]
- Baychev, T.G.; Jivkov, A.P.; Rabbani, A.; Raeini, A.Q.; Xiong, Q.; Lowe, T.; Withers, P.J. Reliability of Algorithms Interpreting Topological and Geometric Properties of Porous Media for Pore Network Modelling. Transp. Porous Med. 2019, 128, 271–301. [Google Scholar] [CrossRef]
- Miao, X.; Gerke, K.M.; Sizonenko, T.O. A new way to parameterize hydraulic conductances of pore elements: A step forward to create pore-networks without pore shape simplifications. Adv. Water Resour. 2017, 105, 162–172. [Google Scholar] [CrossRef]
- Rabbani, A.; Babaei, M. Hybrid pore-network and lattice-Boltzmann permeability modelling accelerated by machine learning. Adv. Water Resour. 2019, 126, 116–128. [Google Scholar] [CrossRef]
- Baldwin, C.A.; Sederman, A.J.; Mantle, M.D.; Alexander, P.; Gladden, L.F. Determination and characterization of the structure of a pore space from 3D volume images. J. Colloid. Interface Sci. 1996, 181, 79–92. [Google Scholar] [CrossRef]
- Lindquist, W.B.; Venkatarangan, A.; Dunsmuir, J.; Wong, T.F. Pore and throat size distributions measured from synchrotron X-ray tomographic images of Fontainebleau sandstones. J. Geophys. Res. Solid. Earth 2000, 105, 21509–21527. [Google Scholar] [CrossRef]
- Prodanović, M.; Lindquist, W.B.; Seright, R.S. 3D image-based characterization of fluid displacement in a Berea core. Adv. Water Resour. 2007, 30, 214–226. [Google Scholar] [CrossRef]
- Jiang, Z.; Wu, K.; Couples, G.; Van Dijke, M.; Sorbie, K.; Ma, J. Efficient extraction of networks from three-dimensional porous media. Water Resour. Res. 2007, 43, W12S03. [Google Scholar] [CrossRef]
- Silin, D.; Patzek, T. Pore space morphology analysis using maximal inscribed spheres. Physica A Stat. Mech. Appl. 2006, 371, 336–360. [Google Scholar] [CrossRef]
- Dong, H.; Blunt, M.J. Pore-network extraction from micro-computerized-tomography images. Phys. Rev. E 2009, 80, 036307. [Google Scholar]
- Arand, F.; Hesser, J. Accurate and efficient maximal ball algorithm for pore network extraction. Comput. Geosci. 2017, 101, 28–37. [Google Scholar] [CrossRef]
- Sheppard, A.P.; Sok, R.M.; Averdunk, H. Improved pore network extraction methods. In Proceedings of the International Symposium of the Society of Core Analysts, Toronto, ON, Canada, 21–25 August 2005; p. 2125. [Google Scholar]
- Rabbani, A.; Jamshidi, S.; Salehi, S. An automated simple algorithm for realistic pore network extraction from micro-tomography images. J. Petrol. Sci. Eng. 2014, 123, 164–171. [Google Scholar] [CrossRef]
- Gostick, J.T. Versatile and efficient pore network extraction method using marker-based watershed segmentation. Phys. Rev. E 2017, 96, 023307. [Google Scholar] [CrossRef] [PubMed]
- Bakhshian, S.; Hosseini, S. Pore–scale analysis of supercritical CO2–brine immiscible displacement under fractional–wettability conditions. Adv. Water Resour. 2019, 126, 96–107. [Google Scholar] [CrossRef]
- Yi, Z.; Lin, M.; Jiang, W.; Zhang, Z.; Li, H.; Gao, J. Pore network extraction from pore space images of various porous media systems. Water Resour. Res. 2017, 53, 3424–3445. [Google Scholar] [CrossRef]
- Bondino, I.; Hamon, G.; Kallel, W.; Kac, D. Relative permeabilities from simulation in 3D rock models and equivalent pore networks: Critical review and way forward. Petrophysics 2013, 54, 538–546. [Google Scholar]
- Ams, C.H.; Knackstedt, M.A.; Val Pinczewski, W.; Martys, N.S. Virtual permeametry on microtomographic images. J. Pet. Sci. Eng. 2004, 45, 41–46. [Google Scholar]
- Diamond, S. Mercury porosimetry—An inappropriate method for the measurement of pore size distributions in cement-based materials. Cem. Concr. Res. 2000, 30, 1517–1525. [Google Scholar] [CrossRef]
- Münch, B.; Holzer, L. Contradicting geometrical concepts in pore size analysis attained with electron microscopy and mercury intrusion. J. Am. Ceram. Soc. 2008, 91, 4059–4067. [Google Scholar] [CrossRef]
- Androutsopoulos, G.P.; Mann, R. Evaluation of mercury porosimeter experiments using a network pore structure model. Chem. Eng. Sci. 1979, 34, 1203–1212. [Google Scholar] [CrossRef]
- Portsmouth, R.L.; Gladden, L.F. Determination of pore connectivity by mercury porosimetry. Chem. Eng. Sci. 1991, 46, 3023–3036. [Google Scholar] [CrossRef]
- Malek, K.; Coppens, M.-O. Knudsen self- and Fickian diffusion in rough nanoporous media. J. Chem. Phys. 2003, 119, 2801–2811. [Google Scholar] [CrossRef]
- Mann, R.; Allamy, A.; Holt, A. Visualised porosimetery for pore structure characterisation of nickel/alumina reforming catalysts. Chem. Eng. Res. Des. 1995, 73, 147–153. [Google Scholar]
- Ruffino, L.; Mann, R.; Oldham, R.J.; Rigby, S.; Allen, S. Using low melting point alloy intrusion to quantify pore structure: Studies on an alumina catalyst support. Stud. Surf. Sci. Catal. 2001, 133, 155–162. [Google Scholar]
- Allamy, A.; Mann, R.; Holt, A. Modelling of catalyst particle skin effects using a 3-D pore network model and quantitative microscopy. Chem. Eng. Sci. 2003, 58, 1989–2000. [Google Scholar] [CrossRef]
- Ruffino, L.; Mann, R.; Oldman, R.; Stitt, E.H.; Boller, E.; Cloetens, P.; DiMichiel, M.; Merino, J. Using x-ray microtomography for characterisation of catalyst particle pore structure. Can. J. Chem. Eng. 2005, 83, 132–139. [Google Scholar] [CrossRef]
- Rieckmann, C.; Keil, F.J. Simulation and experiment of multicomponent diffusion and reaction in three-dimensional networks. Chem. Eng. Sci. 1999, 54, 3485–3493. [Google Scholar] [CrossRef]
- Seaton, N.A. Determination of the connectivity of porous solids from nitrogen sorption measurements. Chem. Eng. Sci. 1991, 46, 1895–1909. [Google Scholar] [CrossRef]
- Mousa, S.; Novak, V.; Fletcher, R.S.; Garcia, M.; Mcleod, N.; Corfield, M.; Rigby, S.P. Integration of multi-scale porosimetry and multi-modal imaging in the study of structure-transport relationships in porous catalyst pellets. Chem. Eng. J. 2023, 452, 139122. [Google Scholar] [CrossRef]
- Rigby, S.P.; Watt-Smith, M.J.; Fletcher, R.S. Simultaneous determination of the pore-length distribution and pore connectivity for porous catalyst supports using integrated nitrogen sorption and mercury porosimetry. J. Catal. 2004, 227, 68–76. [Google Scholar] [CrossRef]
- Mousa, S.; Novak, V.; Fletcher, R.S.; Kelly, G.; Garcia, M.; Mcleod, N.; Parmenter, C.; Rigby, S.P. Evolution of the pore structure-transport relationship during catalyst reduction and sintering studied by integrated multi-scale porosimetry and multi-modal imaging. Chem. Eng. Sci. 2023, 277, 118880. [Google Scholar] [CrossRef]
Figure 1.
(a) FIB-SEM (focused ion beam-scanning electron microscope (SEM)) image of mesoporous silica. Reprinted with permission from Ref. [9]. 2017, Elsevier. (b) SEM image of a ceramic foam structure [1,10]. Reprinted with permission from Ref. [1]. 2020, Springer.

Figure 2.
TEM image of templated SBA-15 silica with controlled pore structure, including cylindrical pore geometry and uniform size. Reprinted with permission from Ref. [1]. 2020, Springer.
Figure 2.
TEM image of templated SBA-15 silica with controlled pore structure, including cylindrical pore geometry and uniform size. Reprinted with permission from Ref. [1]. 2020, Springer.

Figure 3.
The general scheme of a pore network extraction framework, combining the MIB and watershed methods, with all major parts of the algorithm illustrated (partially in 2D for visibility and clarity). The red circles in (2) indicate identified pore bodies. Reprinted with permission from Ref. [52]. 2020, Elsevier.

Figure 4.
Illustration of the two different concepts of the “continuous pore size distribution (PSD)” and the “discrete PSD”. The star-like prism displayed to the upper left represents a model pore of rather simple geometry. In the case of 2D analysis, the radius of its coextensive circle is considered as the only pore size yielded by the “discrete PSD”. In the case of the “continuous PSD” definition, the single pore object is resolved into its entire size spectrum, as indicated by the colour spectrum. It is important to note that, for a simplified pore structure without pore necks (such as the presented star-like prism), the “ink-bottle effect” disappears and the results from the “continuous PSD” and from Mercury Intrusion Porosimetry are to give identical results. Reprinted with permission from Ref. [75]. 2008, John Wiley and Sons.
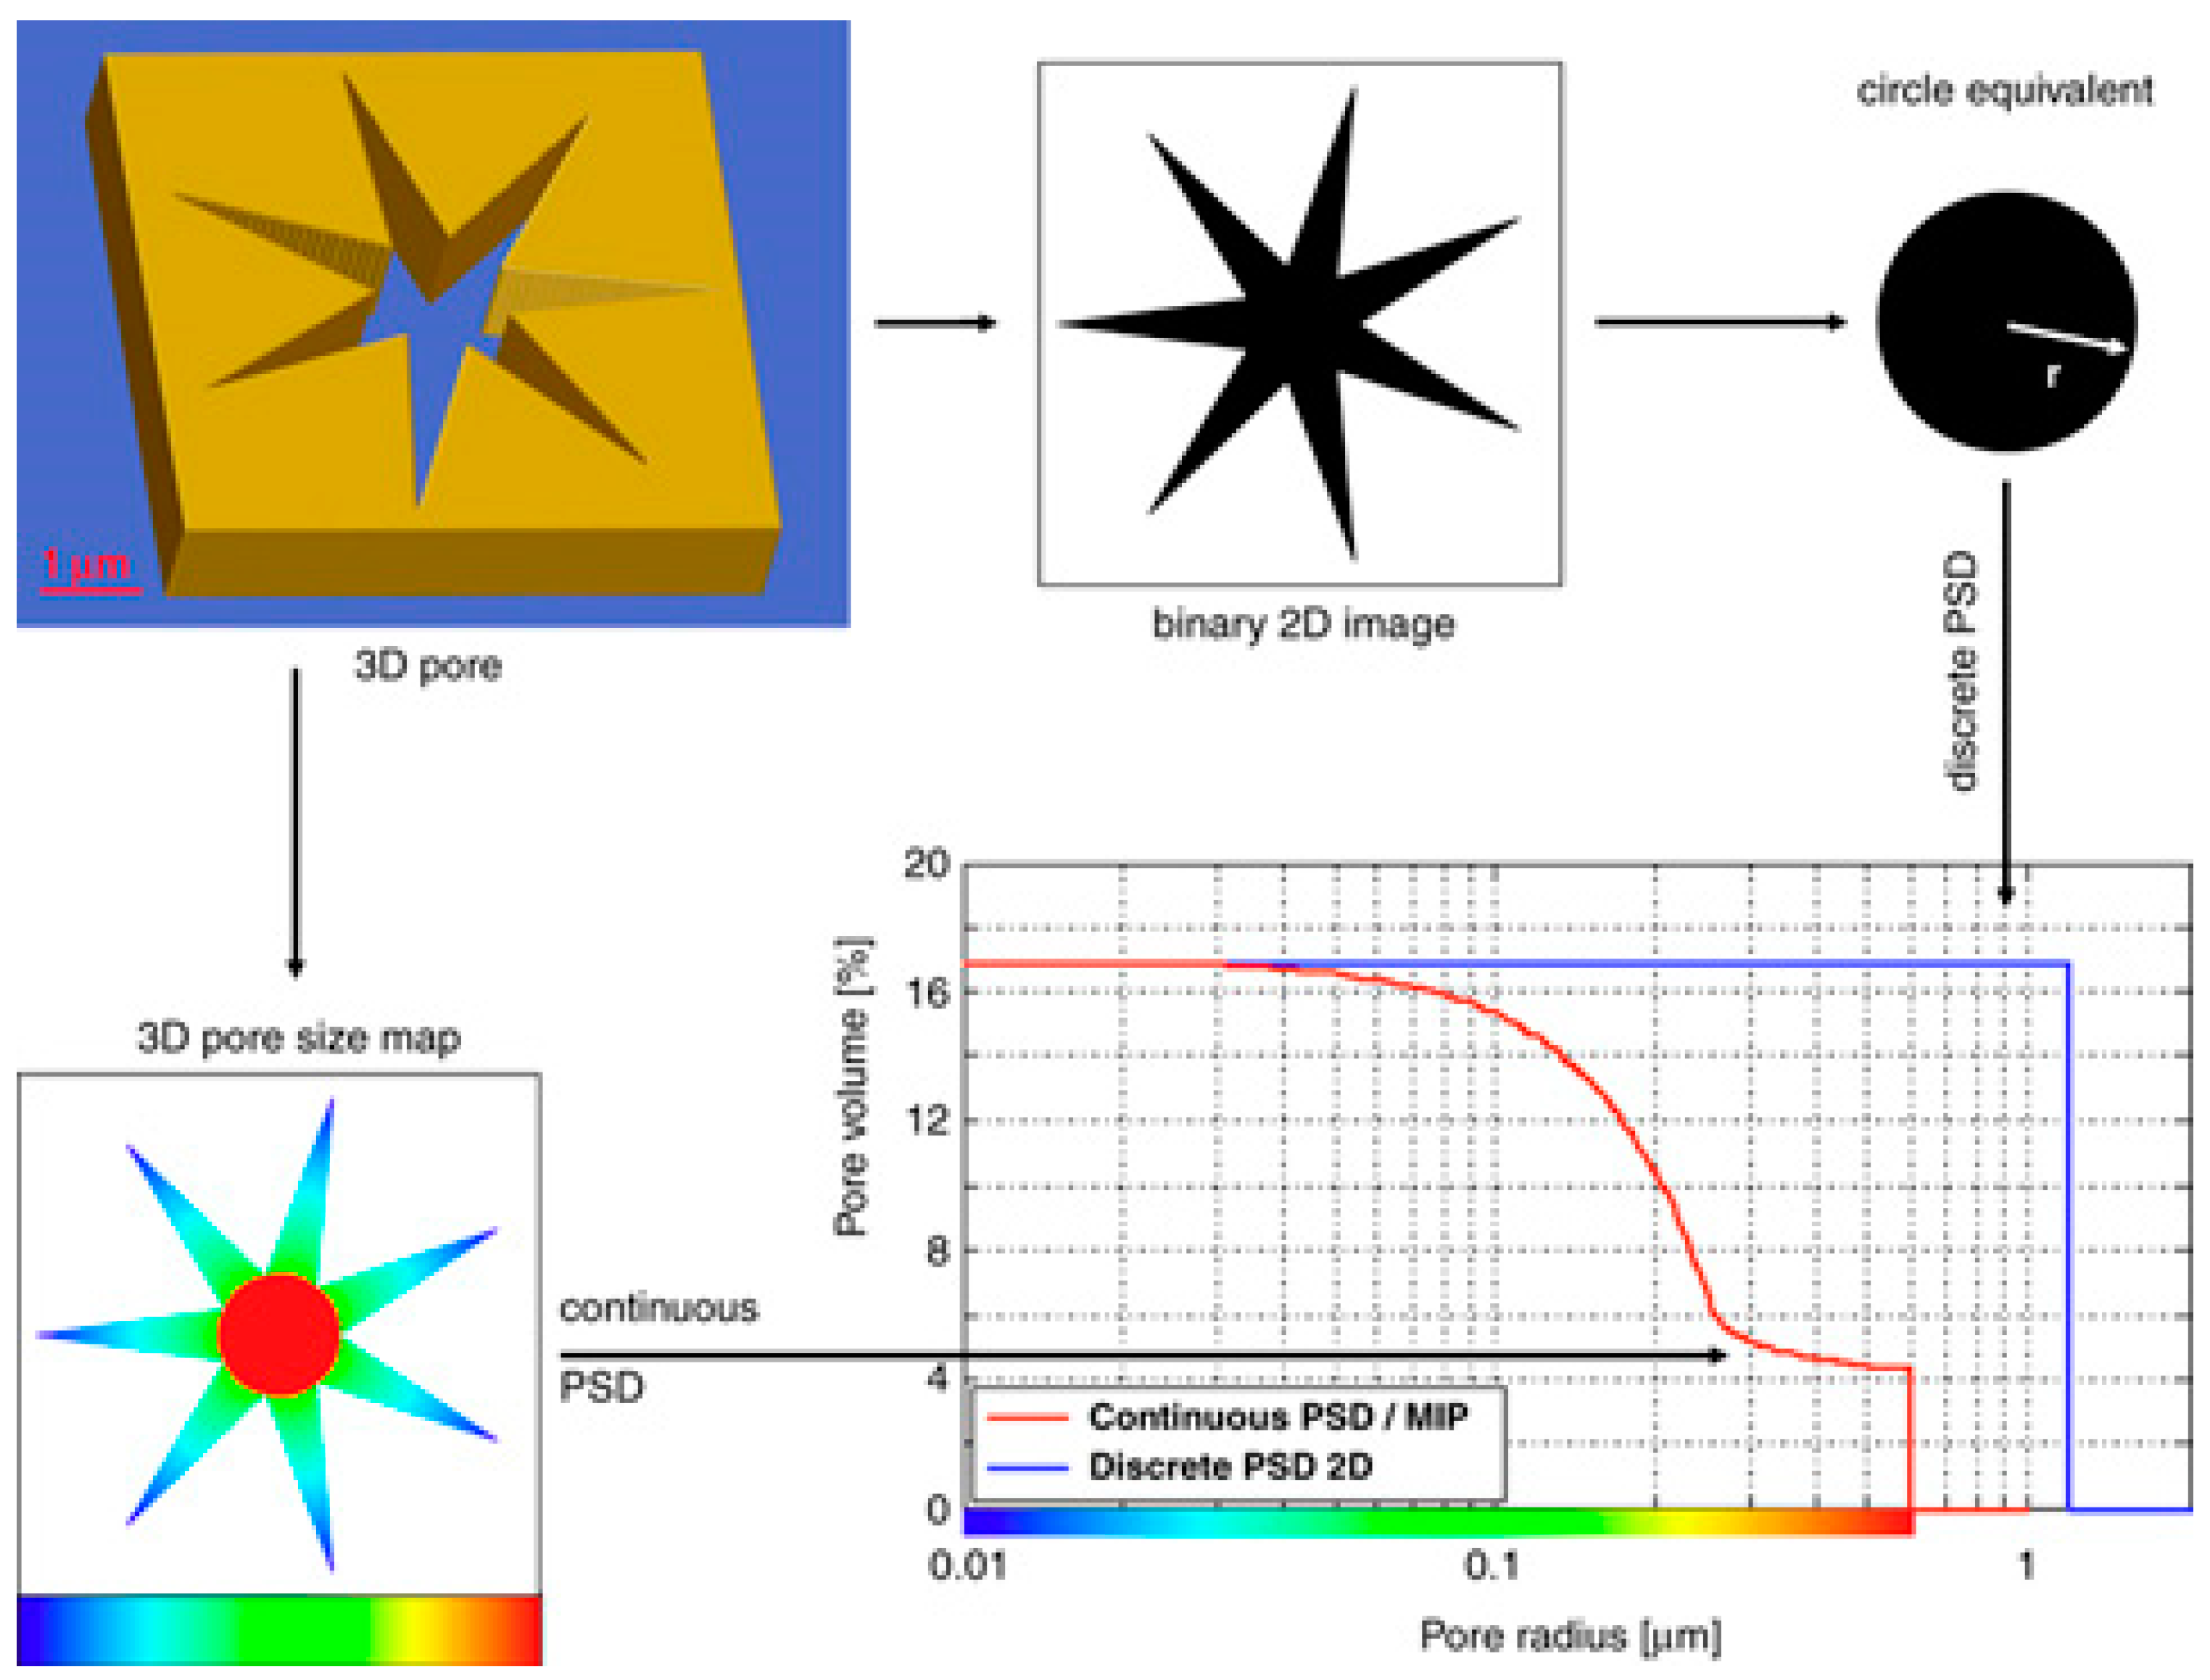
Figure 5.
(a) Virtual reality slice (VRS) images of a PNM representing the void space of an alumina steam reforming catalyst pellet obtained by simulating serial sectioning following simulated LMPA intrusion at pressure 0.3 atm; (b) VRS image at pressure 1 atm; (c) VRS image at pressure 10 atm; and (d) VRS image at pressure 50 atm. The solid phase is shown in grey, the empty pores showing in the sliced section are coloured red and the LMPA-intruded pores are coloured yellow. Reprinted with permission from Ref. [81]. 2003, Elsevier.

Figure 6.
(a) Real SEM image of a section through a steam reforming catalyst pellet after LMPA intrusion to pressure 0.3 atm; (b) real SEM image at pressure 1 atm; (c) real SEM image at pressure 10 atm; and (d) real SEM image at pressure 50 atm. The solid phase is shown in grey, the empty pores showing in the sliced section appear black and the LMPA-intruded pores appear white. Reprinted with permission from Ref. [81]. 2003, Elsevier.

Figure 7.
(a) Images showing 2D radial cross-sections and 3D reconstruction of a high-resolution CXT image of the spray-dried (SD) feed particle used to make the fresh SD feed methanol synthesis catalyst pellet. Also shown on the left side of the figure, for comparison purposes, is a low-resolution image of a whole SD feed pellet with an arrow indicating a corresponding individual constituent feed particle and (b) 2D and 3D reconstructed grayscale FIB-SEM images and segmentation result for fresh spray-dried pellet. Also shown in the figure is the trench/cavity site. The scale bar corresponds to 3 μm. Reprinted with permission from Ref. [85]. 2023, Elsevier.
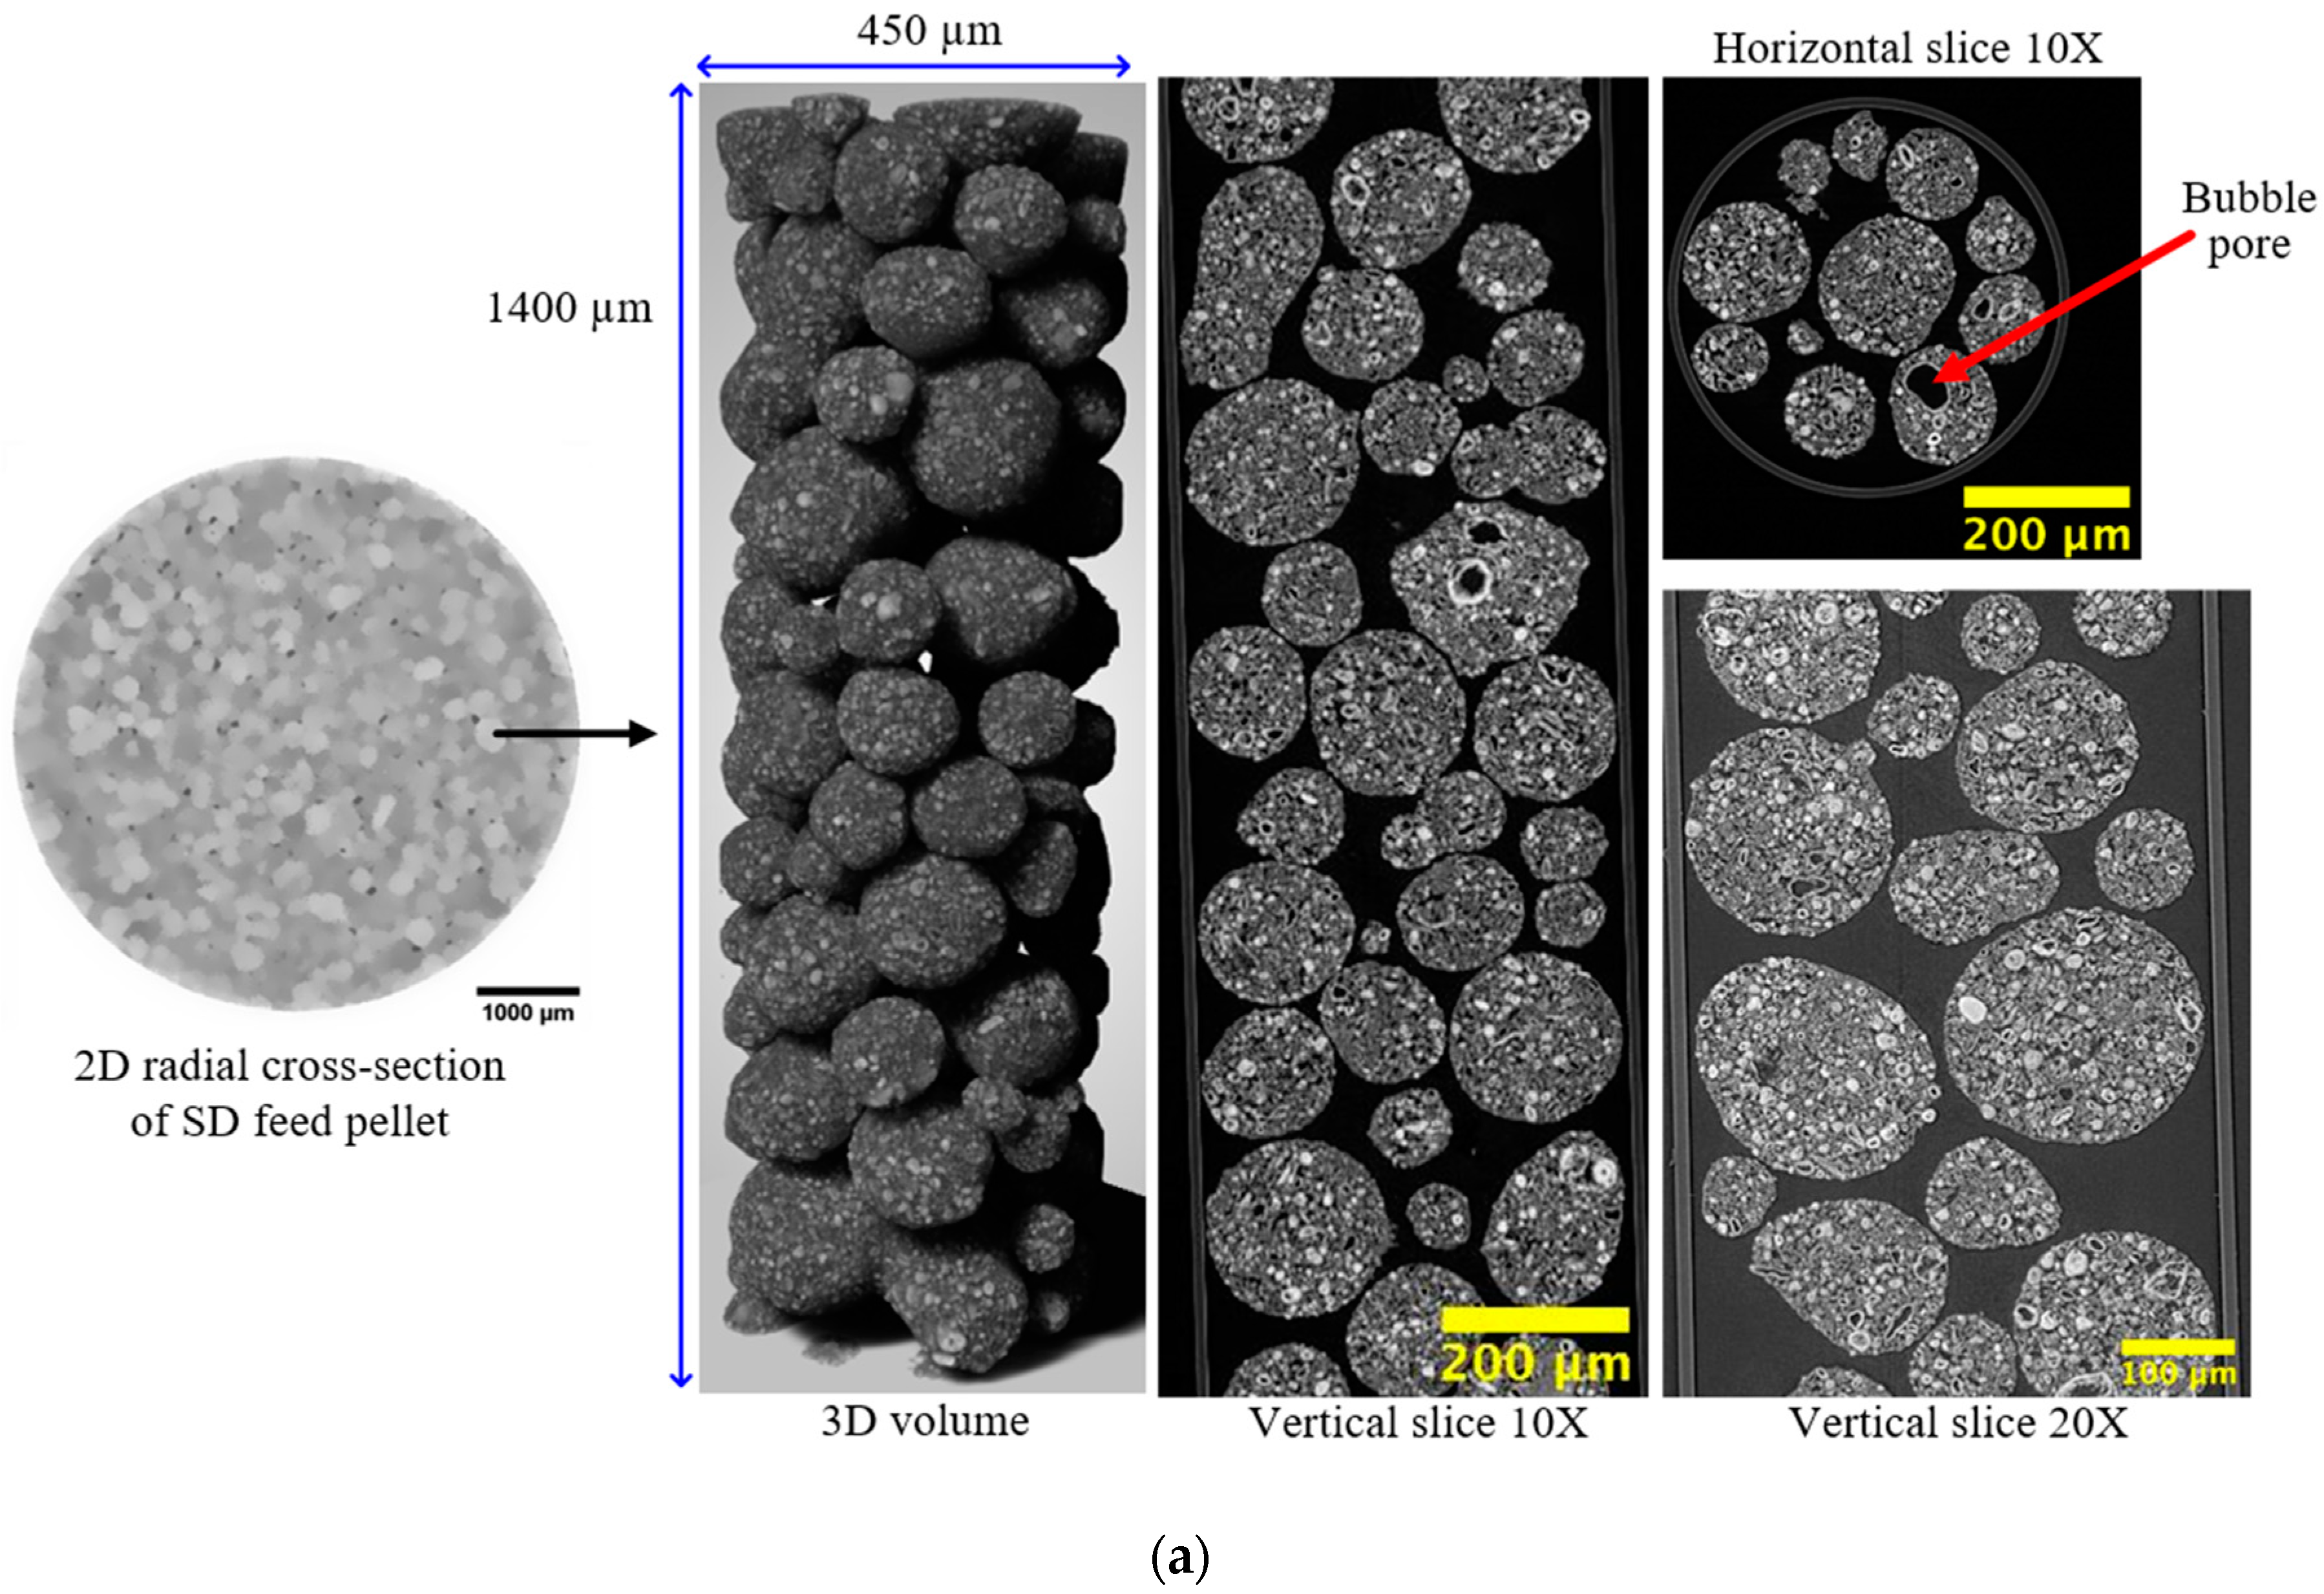

Figure 8.
Comparison, for spray-dried (SD) feed methanol synthesis catalyst pellet, of the observed fractional decline in the nitrogen gas uptake mass transfer coefficient (k/k0) following blockage of different fractions (%) of the void space with mercury entrapment (■), or water adsorption (▲), and that expected for a random arrangement of entrapped pore liquid from the Prager model (●), as described in [85]. The pressures and pore sizes correspond to the ultimate values achieved in the mercury intrusion scanning curves that led to the entrapment of mercury (white pixels), as seen in the CXT images of the pellet (grey pixels) obtained thereafter. Reprinted with permission from Ref. [85]. 2023, Elsevier.

Figure 9.
(a) Schematic diagram illustrating the minimalist modelling procedure for predicting the experimental mass transport rates in methanol synthesis catalyst pellets following mercury entrapment using serial gas sorption data. (b) Plot of fit (dashed line) to Equation (1) for experimental data for spray-dried (SD) (red ●) and roll-compacted (RC) (blue ■) feed pellets. Reprinted with permission from Ref. [85]. 2023, Elsevier.


Table 1.
Summary of the main pore characterisation methods.
| Pore Characterisation Method | Pore Size Range | Most Appropriate Porous Materials | Advantages | Disadvantages |
|---|---|---|---|---|
| Gas sorption (with overcondensation) | 0.3 nm–10 μm | Sol–gel silica, alumina, carbons, MOFs, zeolites, shales. | Wide pore size range within single experiment. | Indirect—requires model of interpretation. Sample needs pre-preparation (e.g., drying and evacuation) |
| Mercury porosimetry | 3.5 nm–100 μm | Sol–gel silica, alumina, monoliths, rocks. | Wide pore size range within single experiment. | Indirect—requires model of interpretation. Sample needs pre-preparation (e.g., drying and evacuation). High pressure may cause mechanical damage. |
| Thermoporometry | 2 nm–100 nm | Wet samples, e.g., gels. | Can run wet samples using pore fluid as probe. | The Gibbs–Thomson parameter limits pore size range for many probe fluids. |
| Small-angle X-ray scattering (SAXS) | 0.3 nm–200 nm | Samples with closed porosity, e.g., shales. | Can probe closed porosity. | Struggles with deconvolution of partially ordered systems. |
| NMR relaxometry | 1 nm–10 μm | Wet samples. | Can use on already wet samples using existing fluid as probe. Can be made fully 3D by coupling with MRI methods. | The presence of paramagnetic impurities can complicate interpretation. |
| FIB-SEM | 10 nm–1000 nm | Silicas, aluminas, carbons, rocks. | Direct characterisation. | Small sample size (microns). Slice thickness is finite. Beam can cause sample damage. Requires image analysis to remove noise and artefacts. |
| TEM | 0.1 nm–100 nm | Mesoporous solids. | Direct characterisation. Can be made tomographic. | Small sample size (few microns). Beam can cause sample damage. Requires image analysis to remove noise and artefacts. |
| Computerised X-ray Tomography (CXT) | 50 nm–100 μm | Rocks, monoliths. | Direct characterisation. Can add contrast agent to enhance image clarity. | Beam can cause sample damage. Can only obtain large sample volumes with low resolution. |
Disclaimer/Publisher’s Note: The statements, opinions and data contained in all publications are solely those of the individual author(s) and contributor(s) and not of MDPI and/or the editor(s). MDPI and/or the editor(s) disclaim responsibility for any injury to people or property resulting from any ideas, methods, instructions or products referred to in the content. |
© 2024 by the author. Licensee MDPI, Basel, Switzerland. This article is an open access article distributed under the terms and conditions of the Creative Commons Attribution (CC BY) license (https://creativecommons.org/licenses/by/4.0/).
Share and Cite
MDPI and ACS Style
Rigby, S.P. Do Pores Exist?—Foundational Issues in Pore Structural Characterisation. Foundations 2024, 4, 225-248. https://doi.org/10.3390/foundations4020015
AMA Style
Rigby SP. Do Pores Exist?—Foundational Issues in Pore Structural Characterisation. Foundations. 2024; 4(2):225-248. https://doi.org/10.3390/foundations4020015
Chicago/Turabian StyleRigby, Sean P. 2024. "Do Pores Exist?—Foundational Issues in Pore Structural Characterisation" Foundations 4, no. 2: 225-248. https://doi.org/10.3390/foundations4020015