Information Entropy of Influenza A Segment 7

1
Division of Applied Mathematics and Center for Computational Molecular Biology, Brown University, Providence, RI 02912, USA
2
Bioinformatics Center, Northwest A&F University, 712100 Yangling, Shaanxi, China
3
Department of Medicine, Alpert Medical School of Brown University, Providence, RI 02912, USA
*
Author to whom correspondence should be addressed.
Entropy 2008, 10(4), 736-744; https://doi.org/10.3390/e10040736
Submission received: 5 November 2008
/
Revised: 21 November 2008
/
Accepted: 21 November 2008
/
Published: 23 November 2008
Abstract
:Information entropy (H) is a measure of uncertainty at each position within in a sequence of nucleotides. H was used to characterize a set of influenza A segment 7 nucleotide sequences. Nucleotide locations of high entropy were identified near the 5’ start of all of the sequences and the sequences were assigned to subsets according to synonymous nucleotide variants at those positions: either uracil at position six (U6), cytosine at position six (C6), adenine (A12) at position 12, guanine at position 12 (G12), adenine at position 15 (A15) or cytosine (C15) at position 15. H values were found to be correlated/corresponding (Kendall tau) along the lengths of the nucleotide segments of the subset pairs at each position. However, the H values of each subset of sequences were statistically distinguishable from those of the other member of the pair (Kolmogorov-Smirnov test). The joint probability of uncorrelated distributions of U6 and C6 sequences to viral subtypes and to viral host species was 34 times greater than for the A12:G12 subset pair and 214 times greater than for the A15:C15 pair. This result indicates that the high entropy position six of segment 7 is either a reporter or a sentinel location. The fact that not one of the H5N1 sequences in the dataset was a member of the C6 subset, but all 125 H5N1 sequences are members of the U6 subset suggests a non-random sentinel function.
1. Introduction
Information entropy [1] is used here as a convenient measure of uncertainty [2], associated with the variation within influenza virus nucleotide sequences. Influenza A causes annual epidemics with significant mortality and morbidity, causes periodic worldwide pandemics and may have potential as a bioterrorism agent. Information entropy has been used as a parameter to classify influenza viruses [3], to analyze influenza evolution [4] and to facilitate the development of anti-influenza vaccines [5].
We present here an application of information entropy to the analysis of synonymous mutations in the influenza virus. Synonymous mutations are changes in nucleotide sequence that, because of redundancy of the genetic code, do not change the sequence of the encoded amino acids [6]. The first section of this study focuses on the initial portion of segment 7 of the virus. Segment 7 of influenza contains regions that are highly conserved [7], thereby permitting the study of synonymous mutations in the absence of perturbing effects of protein sequence variation. The analysis of information entropy is then extended to the entire sequence of segment 7 and, finally, the biological significance of this entropy is determined.
2. Results
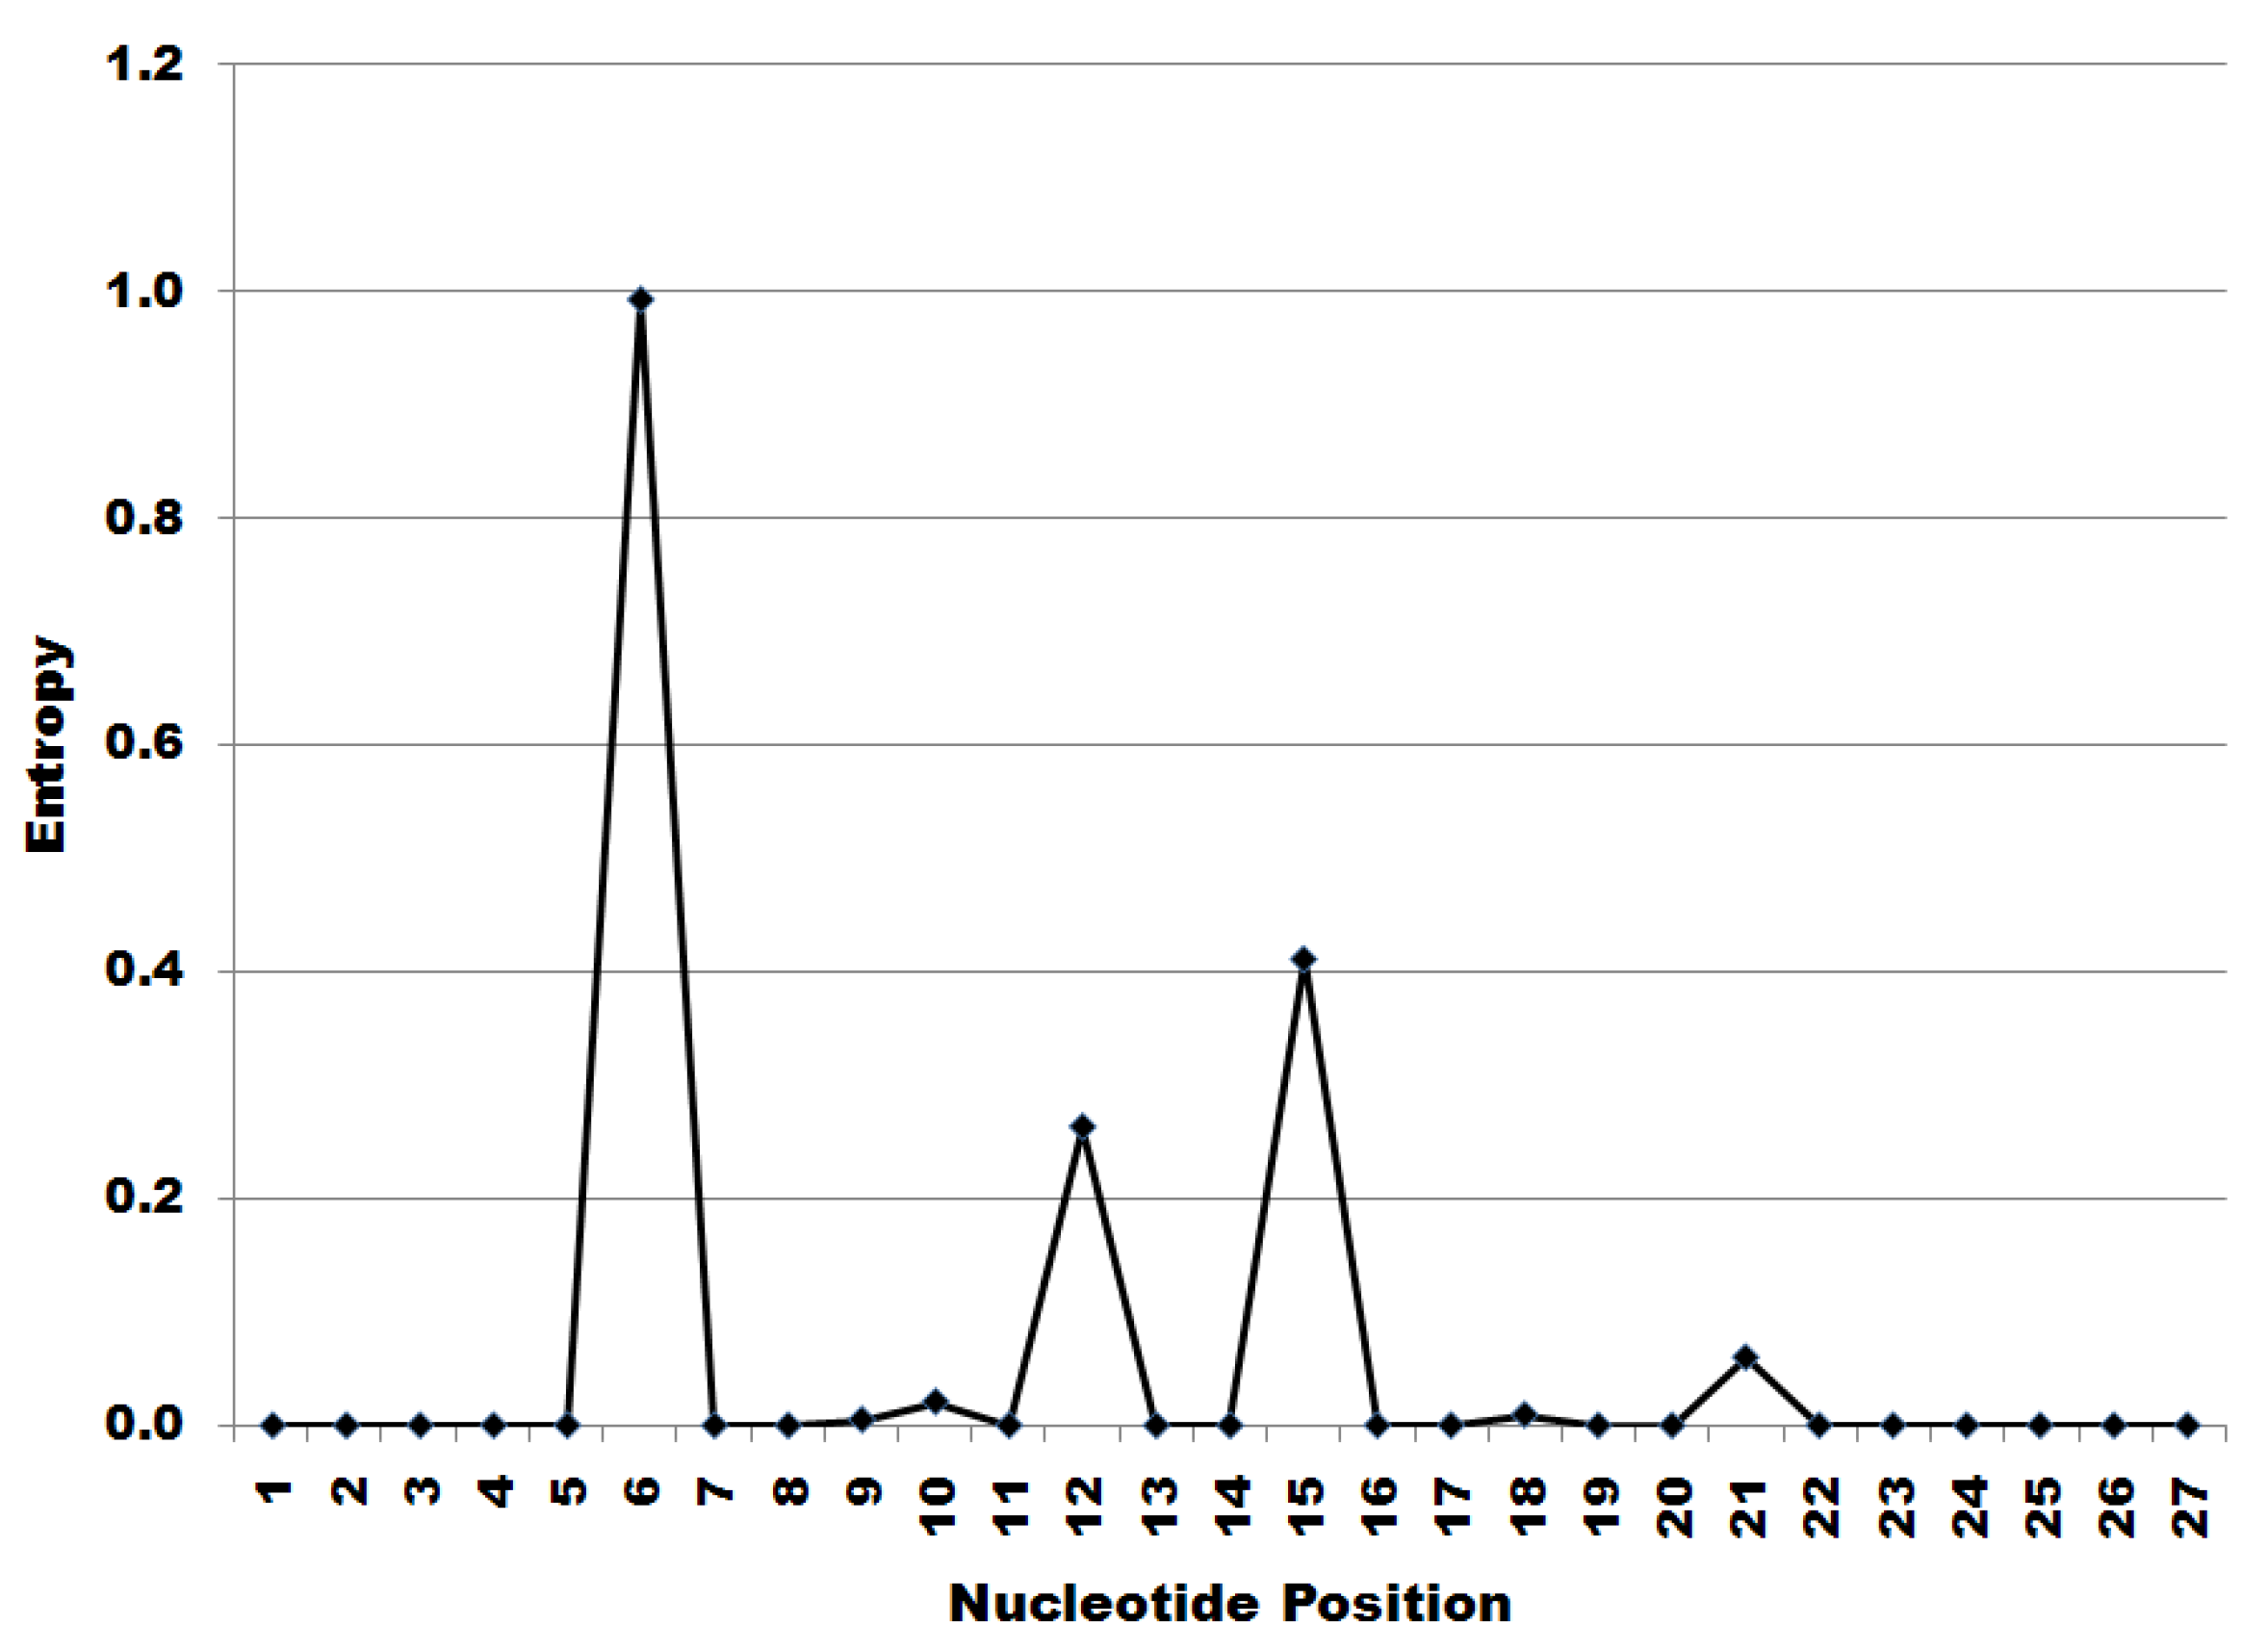
The first 27 nucleotides at the 5’ start of all 2489 downloaded segment 7 sequences were translated and it was found that 100% of the nucleotide sequences in the dataset encode the peptide MSLLTEVET. The information entropy at those encoding nucleotides is shown below in Figure 1. Since the amino acid sequence of the translated peptide remained constant, the peaks in entropy shown in Figure 1 indicate synonymous substitutions in nucleotide sequence.
Figure 1 shows entropic peaks at nucleotide positions six, 12, 15 and 21. The patterns of nucleotide substitutions at each of these positions are given in Figure 2.
As shown in Figure 2, 55% of the sequences contained uracil at position six (U6) and 45% contained cytosine (C6), 96% contained adenine at position 12 (A12), 4% contained guanine at position 12 (G12) and 8% contained adenine at position 15 (A15). In addition, two sequences (0.08%) at position 12 had synonymous A=>U transversions. The entropic peak at position 21 is caused by transition substitutions and both types of transversion substitutions, with a combined frequency of 0.60%. The very low incidence sequences were ignored and the sequences in the dataset were classified and assigned to subsets for further analysis as follows: U6, C6, A12, G12, A15 and C15. Statistical descriptions of these six subsets are given below in Table 1.
The statistical significance of pairwise differences between these segment 7 entropies is given below in Table 2.
The results in Table 2, below, show that the information entropies for each segment 7 subset differ significantly (ks) from those of the partner subset at that position. There is also significant correlation/correspondence (tau) of the entropy distributions between paired subsets at each position. The biological significance of these differences and correspondences was determined next.
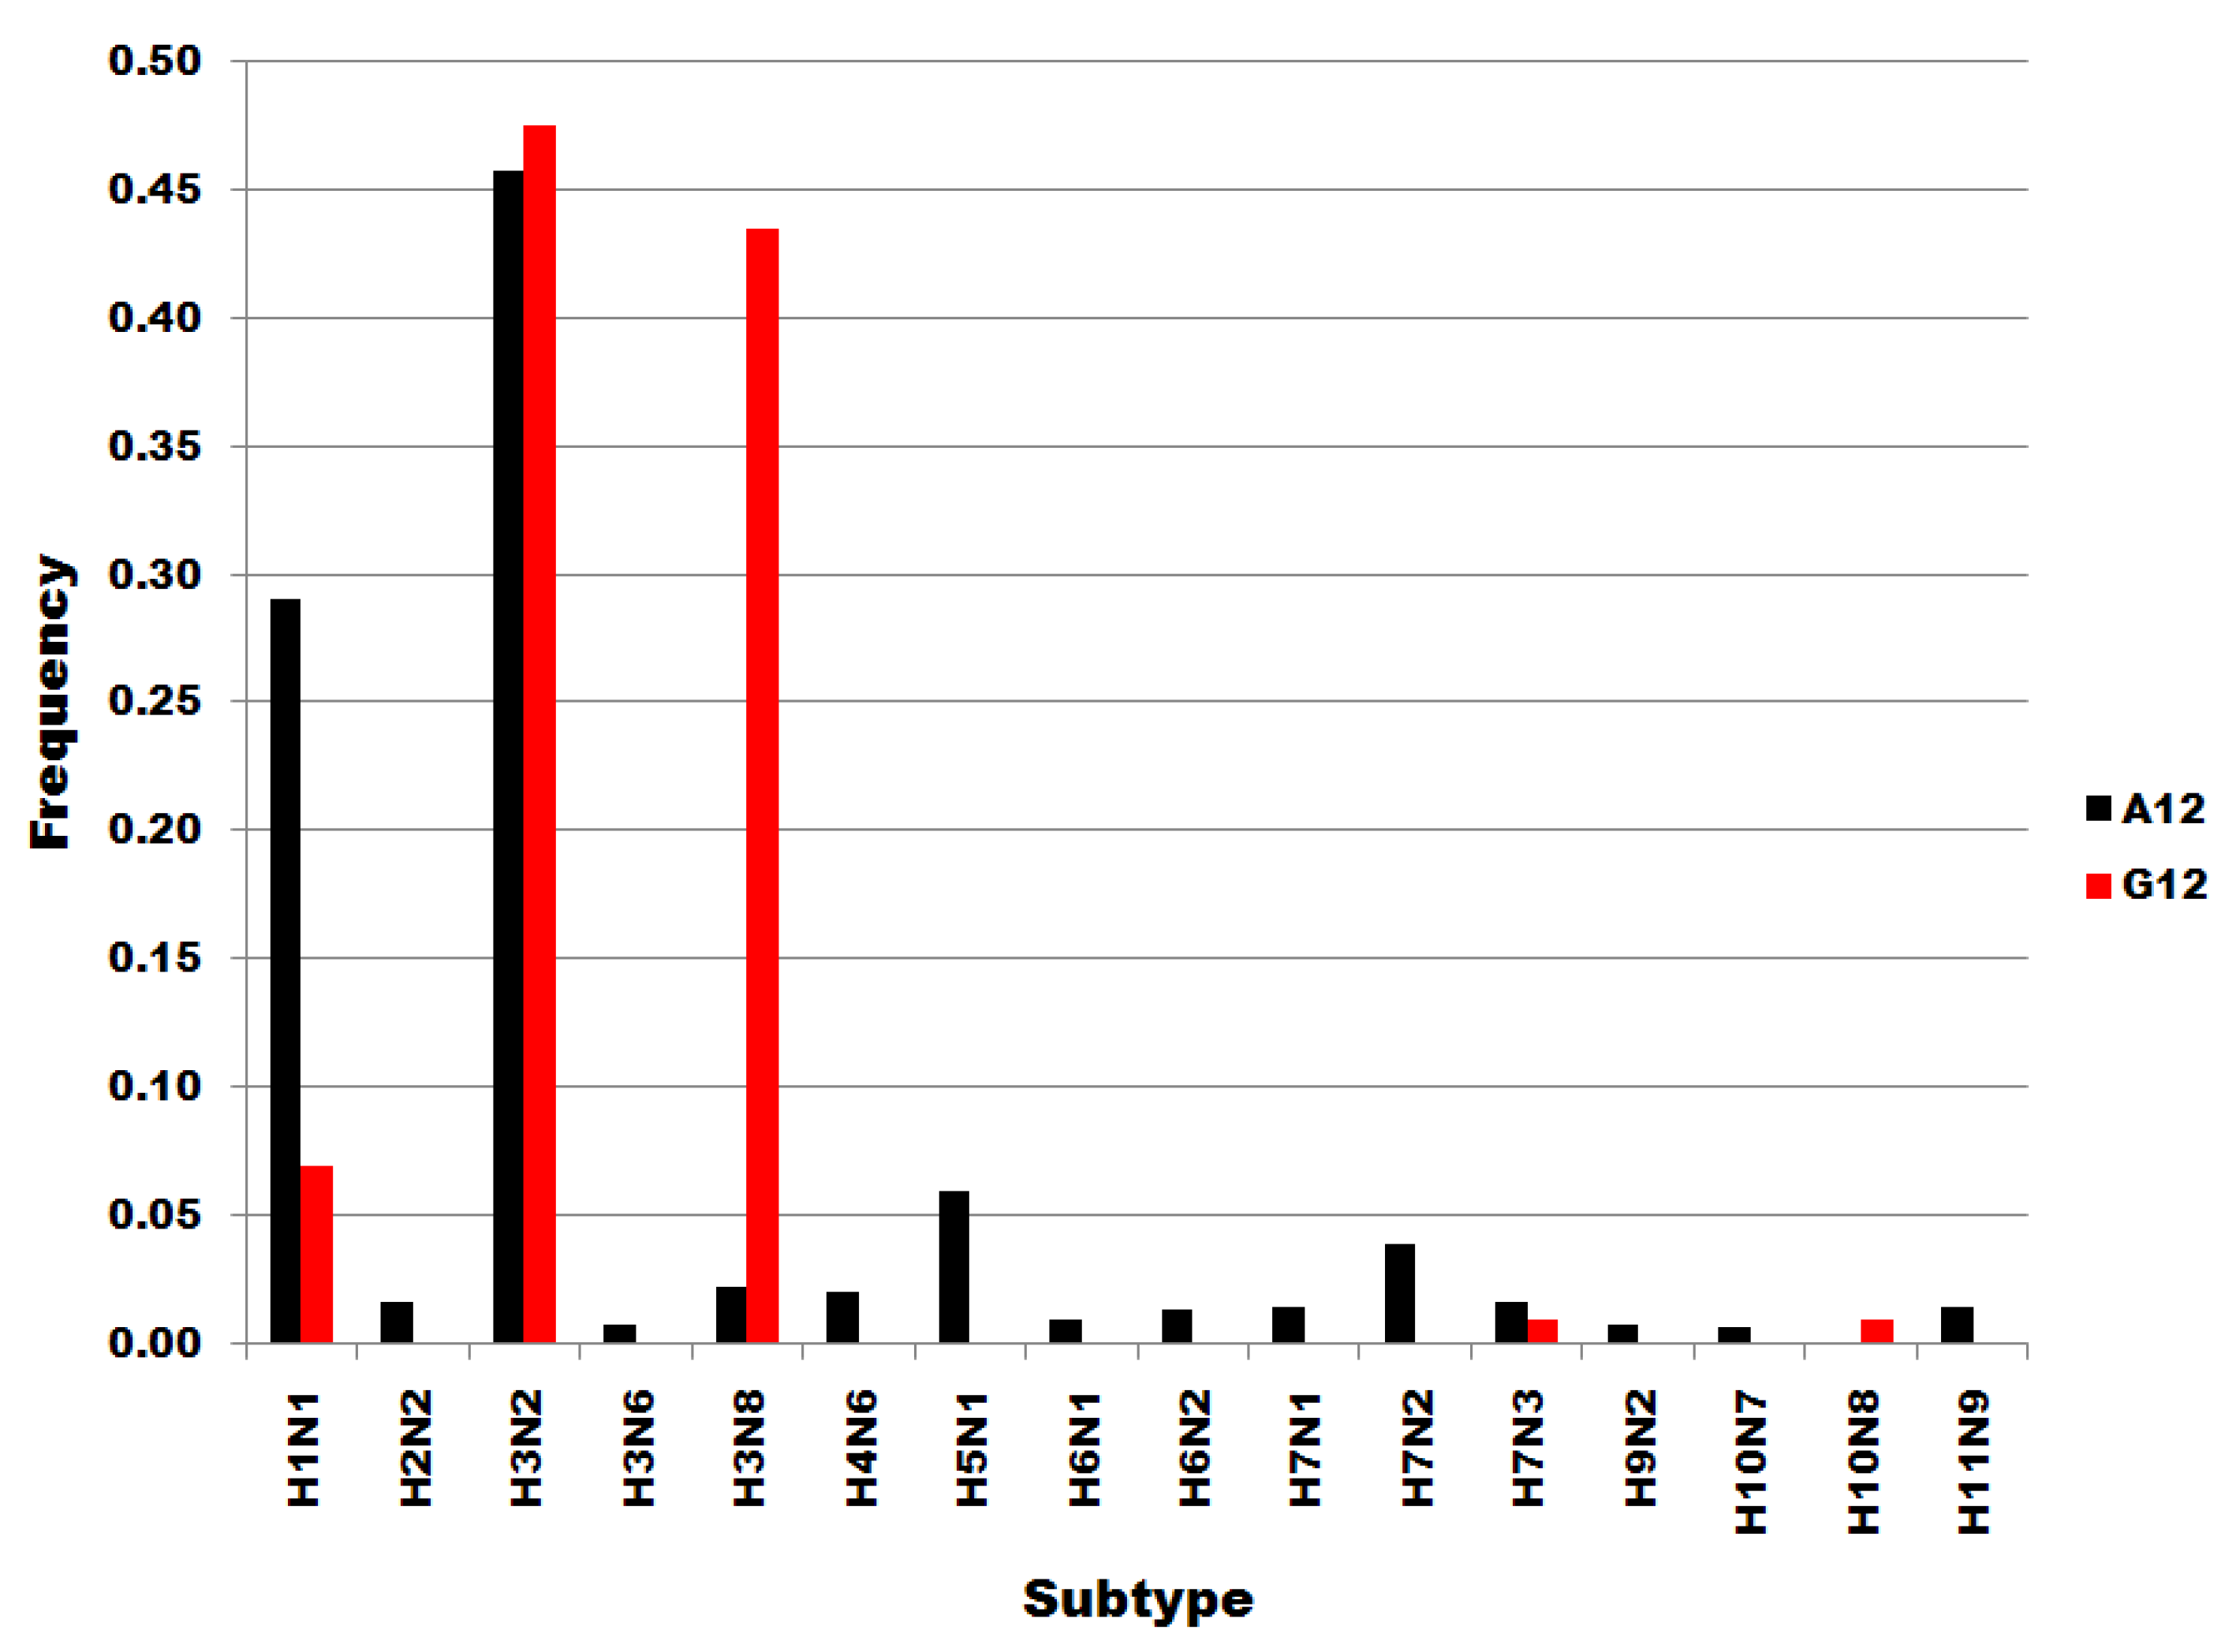
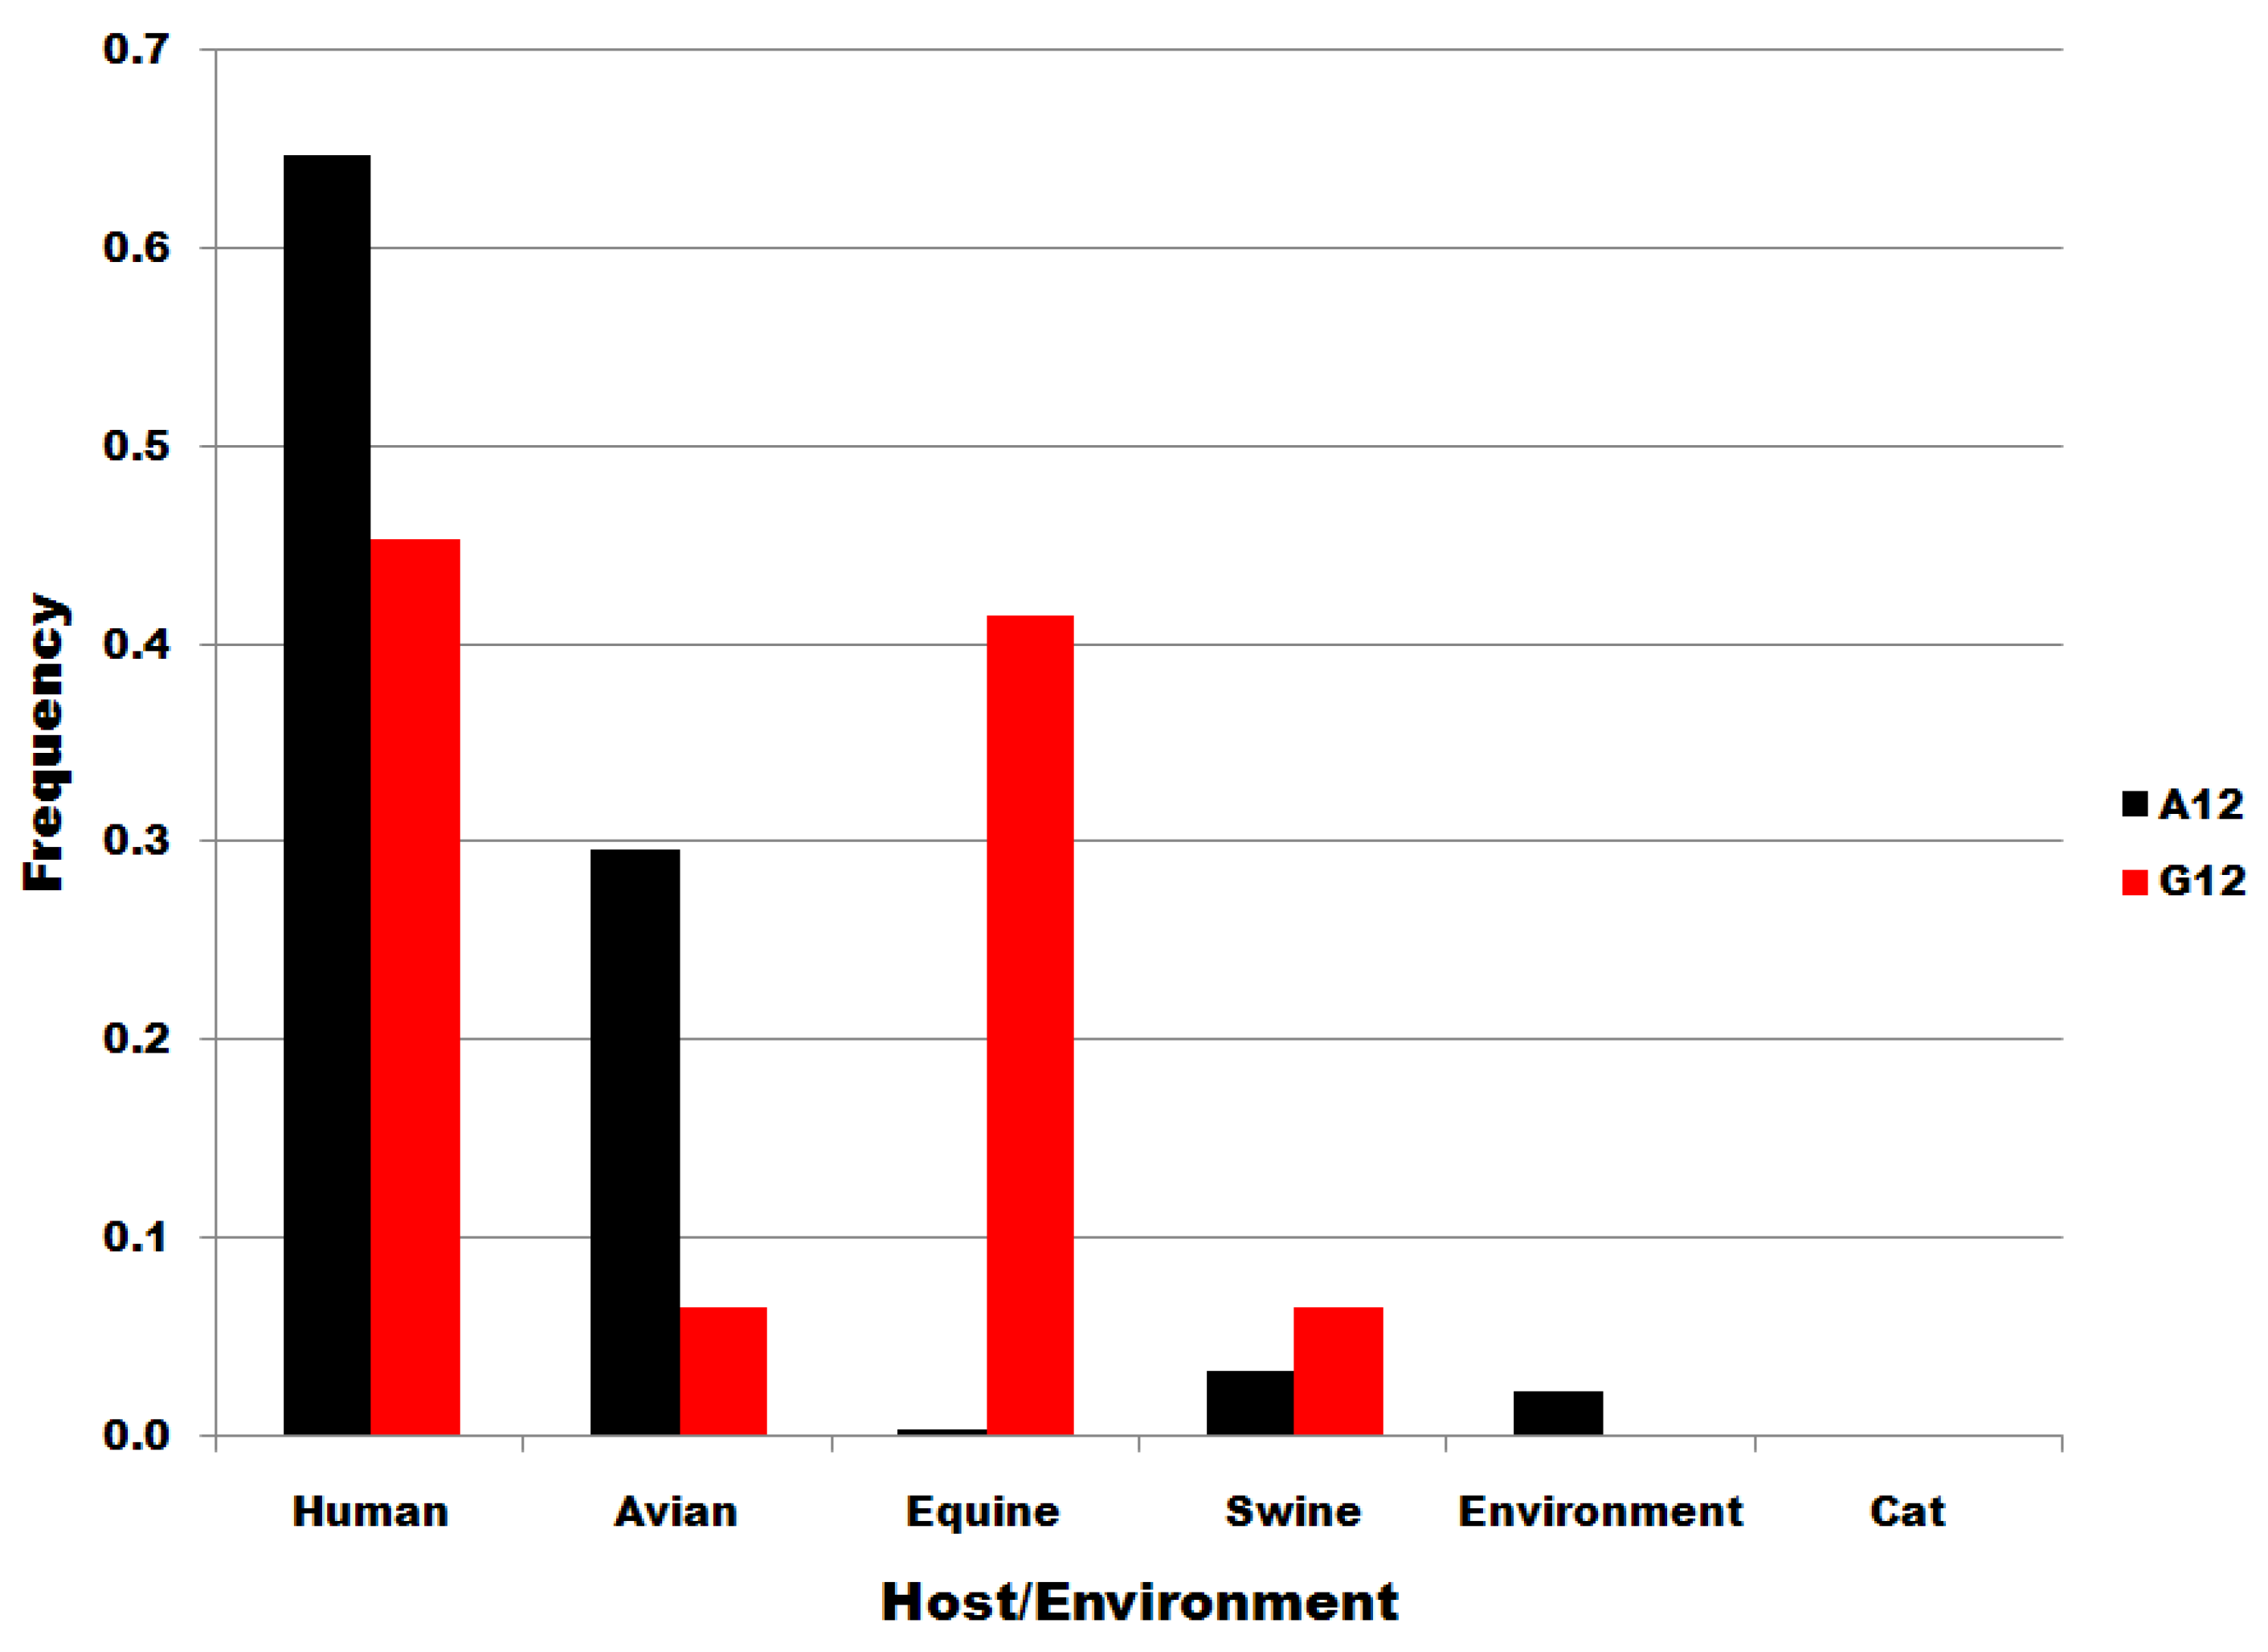
The frequency distribution of sequences to influenza subtypes and to host species was determined for each subset and the correlation/correspondence was determined for each subset pair (Table 3).
Figure 1.
Information entropy of the nucleotide sequence encoding the MSLLTEVET initial peptide of segment 7.
Figure 1.
Information entropy of the nucleotide sequence encoding the MSLLTEVET initial peptide of segment 7.

Figure 2.
Nucleotide frequency at high entropy positions within the nucleotide sequence encoding the MSLLTEVET initial peptide of segment 7. A=adenine, C=cytosine, G=guanine and U=uracil.
Figure 2.
Nucleotide frequency at high entropy positions within the nucleotide sequence encoding the MSLLTEVET initial peptide of segment 7. A=adenine, C=cytosine, G=guanine and U=uracil.


Table 1.
Information entropy of influenza A segment 7 subsets. Entropy values [bits] were determined for nucleotide positions 1 to 969 for each sequence of each subset. Total sequence counts in each subset are denoted as “n”.
| Subset | n | Sum | Mean | Median | Mode | Variance |
|---|---|---|---|---|---|---|
| U6 | 1370 | 191.4521 | 0.1976 | 0.0087 | 0, [462] | 0.1190 |
| C6 | 1119 | 93.3612 | 0.0963 | 0.0 | 0, [526] | 0.0413 |
| A12 | 2381 | 187.86008 | 0.1939 | 0.0053 | 0, [414.] | 0.1187 |
| G12 | 106 | 149.4194 | 0.1542 | 0.0 | 0, [700] | 0.1110 |
| A15 | 196 | 23.6925 | 0.0245 | 0.0 | 0, [700] | 0.0071 |
| C15 | 2290 | 192.6165 | 0.1988 | 0.0055 | 0, [413.] | 0.1233 |
Table 2.
Statistical comparison of information entropies in paired subsets of influenza A segment 7. The paired subsets at nucleotide position six, 12 and 15 are denoted as Subset1 and Subset2. Kolmogorov-Smirnov ks and p and Kendall tau and p are given for each subset pair; probabilities are in parentheses.
| Subset1 | Subset2 | ks, p | tau, p |
|---|---|---|---|
| U6 | C6 | 0.1125, (8.2310 x 10-006) | 0.6824, (5.2186 x 10-222) |
| A12 | G12 | 0.2951, (1.6729 x 10-037) | 0.6334, (1.5270 x 10-191) |
| A15 | C15 | -0.3653, (3.1344 x 10-057) | 0.5357, (1.4231 x 10-137) |
Table 3, below, gives the results of an analysis of possible correspondences between the distributions of sequences to viral subtypes and to viral host species in subset pairs at nucleotide positions six, 12 and 15. The Kendall tau for correlations/correspondences between subsets at position six is only 0.05 for distributions to subypes and 0.28 for distributions to host species, with associated probability values greater than 0.05 (0.79 and 0.44, in parentheses). As shown in Table 3, the null hypothesis cannot be rejected for any Kendall probability for the U6:C6 subset pair, even for the joint subtype:host probability (0.3431), i.e., there is no significant correlation/correspondence between position six subset sequence distributions. In contrast, there is a significance correspondence between the distribution of A15 and C15 subsets to viral host species (Kendall tau = 0.77, p =0.0290). Moreover, the joint probability of the host and subtype distribution probabilities for the U6:C6 subset pair is 34 times greater than for the A12:G12 pair (0.3441/0.0113) and 214 times greater than for the A15:C15 pair (0.3441/0.0016). Thus, the data in Table 3 show that U6 and C6 sequences, each 982 nucleotides long and assigned in this study according to a single position, form subsets that distribute to subtypes and viral host species without correlation/correspondence. The U6 and C6 frequency distributions are shown below in Figure 3 for subtypes and in Figure 4 for host species. The distributions for positions 12 and 15 subtypes and hosts are shown in supplementary data.
Table 3.
Correlated subtype distributions and host species distributions of paired subsets of influenza A segment 7. The paired subsets at nucleotide locations six, 12 and 15 are denoted as Subset1 and Subset2. The biological characteristics for which correlations between paired subsets were determined are influenza subtype and host species. Kendall tau and p values, in parentheses, are given for the non-parametric correlations. The joint correlation probability is the product of the subtype and host correlation probabilities.
| Subset1 | Subset2 | Subtype | Host | Joint Probability |
|---|---|---|---|---|
| U6 | C6 | 0.0503, (0.7858) | 0.2760, (0.4367) | 0.3431 |
| A12 | G12 | 0.3337, (0.0713) | 0.5013, (0.1578) | 0.0113 |
| A15 | C15 | 0.3575, (0.0534) | 0.7746, (0.0290) | 0.0016 |
Figure 3 shows that the distributions of U6 and C6 subset sequences to subtypes do not correspond or correlate. Members of the U6 subset of sequences are distributed widely throughout the subtypes. In contrast, C6 variants are most common in H3N2 subtypes. Not one of the H5N1 sequences was a member of the C6 subset, i.e., all 125 H5N1 sequences in the dataset were of the U6 variety. The results in Figure 3 show that the single nucleotide substitutions determining membership in sequence subsets U6 and C6 are associated with biological processes that determine viral subtypes.
Figure 3.
Influenza A subtype frequencies in segment 7 position 6 subsets. Subsets are denoted in the legend. Frequency, normalized to each subset total count, is on the ordinate.
Figure 3.
Influenza A subtype frequencies in segment 7 position 6 subsets. Subsets are denoted in the legend. Frequency, normalized to each subset total count, is on the ordinate.
Figure 4.
Viral source frequencies in influenza A segment 7 position 6 subsets. Subsets are denoted in the legend. Frequency, normalized to each subset total count, is on the ordinate.
Figure 4.
Viral source frequencies in influenza A segment 7 position 6 subsets. Subsets are denoted in the legend. Frequency, normalized to each subset total count, is on the ordinate.
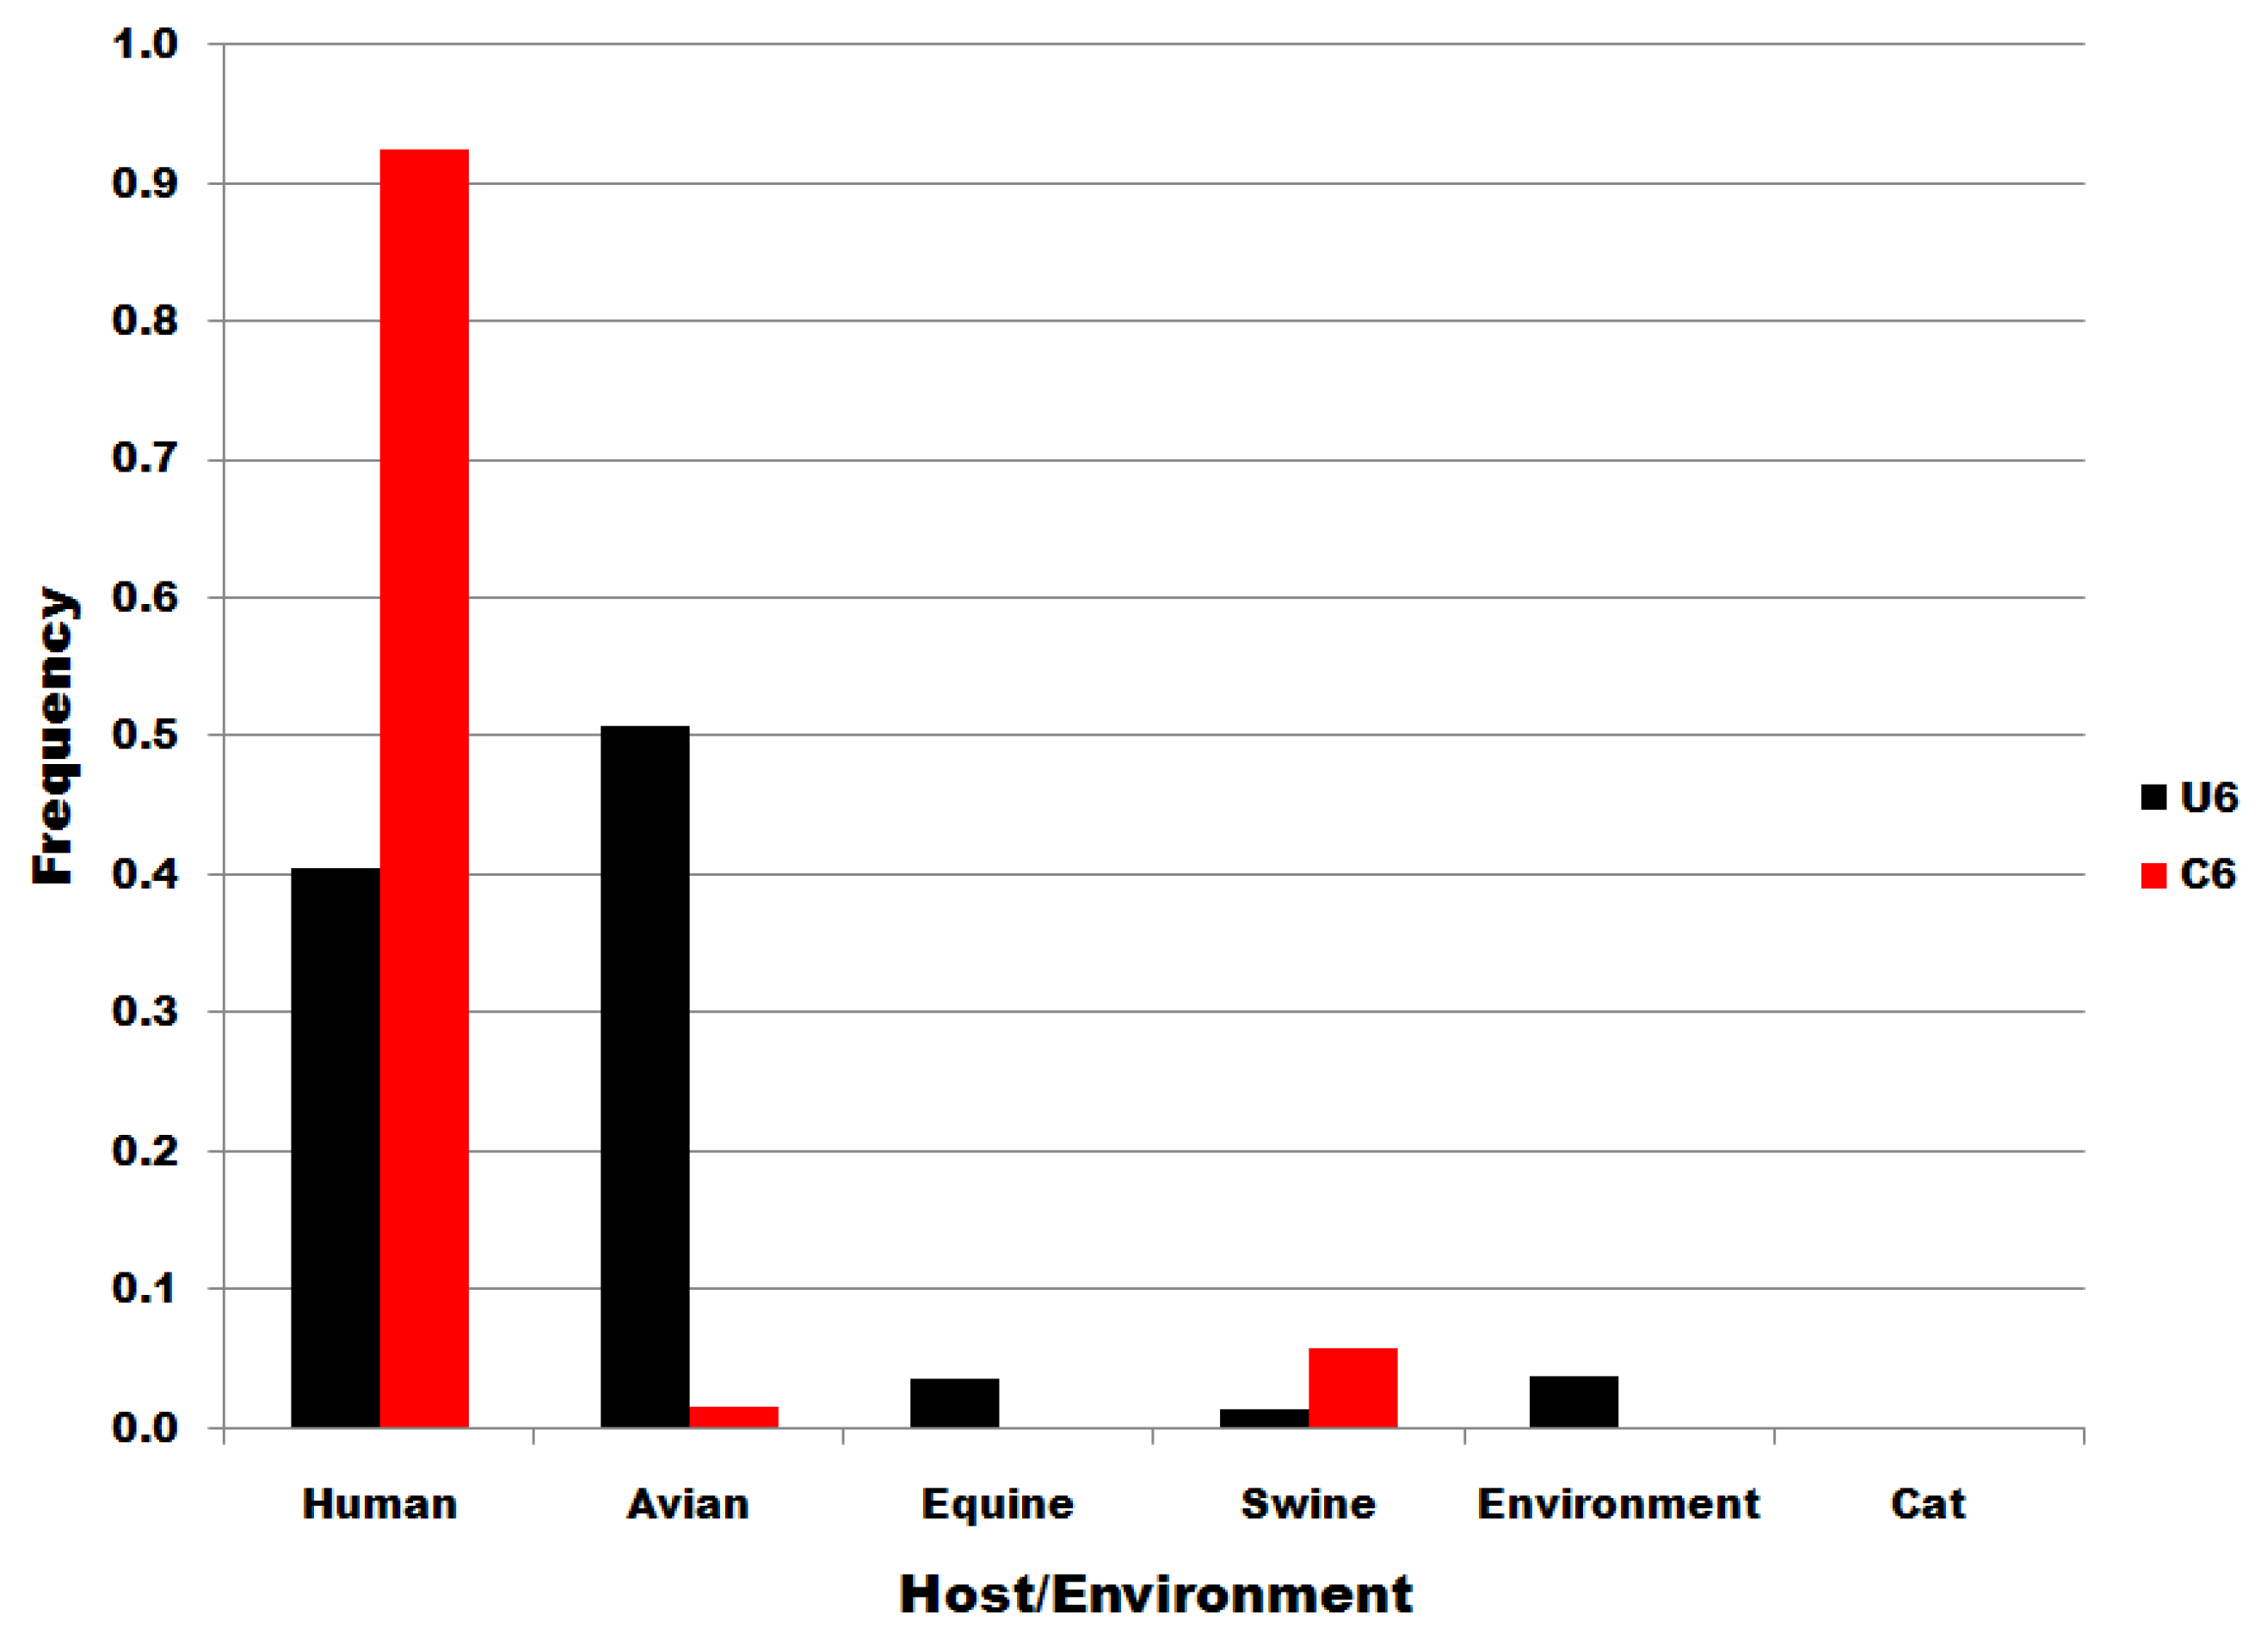
The distributions of subset U6 and C6 sequences to host species and to environmental viral sources are shown in Figure 4. There is no significant correlation/correspondence between the distribution of subset U6 and C6 sequences to host species or environmental viral source. Members of the U6 subset of sequences predominate in birds but are also distributed widely to various host species and in environmental viral sources. C6 variants are the most common in human infections. The results in Figure 4 show that the single nucleotide substitutions determining membership in sequence subsets U6 and C6 are associated with biological processes that determine infectivity in various species, including man.
3. Discussion
Information entropy [1] is a convenient measure of diversity, i.e., uncertainty [2], at a nucleotide position. We initiated our study at a region of the influenza virus in which the amino acid sequence is constant so that the only variations detected would be synonymous mutations, permitted because of redundancy in the genetic code [6]. Under these conditions it is possible to investigate regulation of expression of the influenza virus at the nucleic acid level in the absence of protein effects. Increases in entropy were detected at positions six, 12 and 15 of influenza A segment 7 (Figure 1). A superset of downloaded sequences was separated into subsets according to the nucleotides at positions six, 12 and 15. The information entropy at the nucleotide positions of each of these subset pairs formed differing, and yet correlated, paired entropies (Table 2). The U6 and C6 subsets had uncorrelated distributions to influenza A subtypes (Figure 3) and to specific viral hosts (Figure 4).
The entropy at segment position six was 0.99 (Figure 1), which is almost the maximum of 1.00 permitted by the wobble rules of the genetic code [6] for the AGU ⬄ AGC third position nucleotide transition in this serine codon. Maximum entropy suggests that these synonymous substitutions may have occurred merely by chance. However, all of the 125 H5N1 sequences in the dataset were of the U6 variety, with zero C6 sequences, a very non-random distribution. Furthermore, subsets of the downloaded dataset that were formed only upon the basis of a U6 or C6 nucleotide clearly do not segregate randomly, neither with respect to information entropies throughout their lengths (Table 1 and Table 2) nor with respect to biological properties (Table 3, Figure 3 and Figure 4).
It is not yet known whether the high entropy position six is a (1) reporter location that can broadcast the entropic and biological characteristics of the entire RNA length of segment 7 or whether position six is a (2) sentinel location that actively regulates and limits the biological characteristics of the virus. Several mathematical and biophysical approaches may be useful for determining the basis of position six function. For example, the topology of the sequences in the U6 and C6 subsets can be compared by star graph analysis [8]. The fact that not one of the H5N1 sequences in the dataset used for this study is a member of the C6 subset, but that all 125 H5N1 sequences are members of the U6 subset, suggests a non-random sentinel function for position six.
4. Experimental Section
The entire set of 2509 complete, non-duplicate, influenza A, segment 7 FLU Project nucleotide sequences was downloaded from the NCBI Influenza Virus Resource database [9] in FASTA format. Alternatively spliced sequences were deleted and four sequences encoding peptides non-synonymous with the starting MSLLTEVET peptide were deleted (two MSFLTEVET and two MSLLTEVAT). A total of 2489 sequences remained after redaction. Sequences were aligned with MUSCLE 3.6 [10] and the initial 27-mer oligonucleotide was translated into protein with JalView [11].
The dataset was parsed and sequences were counted with Biopython 1.42/Python 2.5 (Biopython.org). Statistical analyses (Kolmogorov-Smirnoff and Kendall tau) were performed with the stats package of SciPy (0.5.2)/Python 2.5 [12].
Information entropy [1] was calculated at each nucleotide position as:
![Entropy 10 00736 i001]() where Ω={A,T,C,G}. The sequence of influenza A segment 7 is 982 nucleotides long. Entropy was determined only for positions 1 to 969 rather than from 1 to 982 because of some raggedness in the dataset towards the 3’ termini of the sequences.
where Ω={A,T,C,G}. The sequence of influenza A segment 7 is 982 nucleotides long. Entropy was determined only for positions 1 to 969 rather than from 1 to 982 because of some raggedness in the dataset towards the 3’ termini of the sequences.

Acknowledgements
This research is supported by the United States Department of Energy grant DE-FG02-04ER63942c and the United States National Institutes of Health grants R01-HG01257 and 2P20-RR01-5578-06. The assistance of the Brown University Center for Computational Molecular Biology and Center for Computation and Visualization is greatly appreciated. The authors thank Dr. Ann M. Körner-Altman for critically reviewing an earlier version of this manuscript.
References
- Shannon, C.E. A Mathematical Theory of Communication. Bell Syst. Techn J. 1948, 27, 379-423, 623-656. [Google Scholar] [CrossRef]
- Feynman, R.P.; Hey, Tony; Allen, Robin W. Feynman Lectures on Computation; Chap. 4.3 Shannon’s Theorem, Chap. 4.6 Information Theory; Perseus Books Group; ISBN ISBN 0738202967. 2000. [Google Scholar]
- Smagala, J.A.; Dawson, E.D.; Mehlmann, M.; Townsend, M.B.; Kuchta, R.D.; Rowlen, K.L. ConFind: a robust tool for conserved sequence identification. Bioinformatics 2005, 21, 4420–4422. [Google Scholar] [CrossRef] [PubMed]
- Pavesi, A. Pattern of nucleotide substitution in the overlapping nonstructural genes of influenza A virus and implication for the genetic diversity of the H5N1 subtype. Gene 2007, 402, 28–34. [Google Scholar] [CrossRef] [PubMed]
- Heiny, A.T.; Miotto, O.; Srinivasan, K.N.; Khan, A.M.; Zhang, G.L.; Brusic, V.; Tan, T.W.; August, J.T. Evolutionarily conserved protein sequences of influenza a viruses, avian and human, as vaccine targets. PLoS ONE 2007, 2, e1190. [Google Scholar] [CrossRef] [PubMed] [Green Version]
- Crick, F.H.C. Codon--anticodon pairing: the wobble hypothesis. J. Mol. Biol. 1966, 19, 548–555. [Google Scholar] [CrossRef]
- Reid, A.H.; Fanning, T.G.; Janczewski, T.A.; McCall, S.; Taubenberger, J.K. Characterization of the 1918 "Spanish" influenza virus matrix gene segment. J. Virol. 2002, 76, 10717–10723. [Google Scholar] [CrossRef] [PubMed]
- Cruz-Monteagudo, M.; Munteanu, C.R.; Borges, F.; Natália, M.; Cordeiro, D.S.; Uriarte, E.; Chou, K.-C.; González-Díaz, H. Stochastic molecular descriptors for polymers. 4. Study of complex mixtures with topological indices of mass spectra spiral and star networks: The blood proteome case. Polymer 2008, 49, 5575–5587. [Google Scholar] [CrossRef]
- Bao, Y.; Bolotov, P.; Dernovoy, D.; Kiryutin, B.; Zaslavsky, L.; Tatusova, T.; Ostell, J.; Lipman, D. The Influenza Virus Resource at the National Center for Biotechnology Information. J. Virol. 2008, 82, 596–601. [Google Scholar]
- Edgar, R.C. MUSCLE: multiple sequence alignment with high accuracy and high throughput. Nucleic Acids Res 2004, 32, 1792–1797. [Google Scholar]
- Clamp, M.; Cuff, J.; Searle, S.M.; Barton, G.J. The Jalview Java Alignment Editor. Bioinformatics 2004, 20, 426–427. [Google Scholar] [CrossRef] [PubMed]
- Jones, E.; Oliphant, T.; Peterson, P.; et al. SciPy: Open Source Scientific Tools for Python. 2001. http://www.scipy.org .
Supplementary Material
Figure S1.
Influenza A subtype frequencies in segment 7 position 12 subsets. Subsets are denoted in the legend. Frequency, normalized to each subset total count, is on the ordinate.
Figure S1.
Influenza A subtype frequencies in segment 7 position 12 subsets. Subsets are denoted in the legend. Frequency, normalized to each subset total count, is on the ordinate.

Figure S2.
Influenza A subtype frequencies in segment 7 position 15 subsets. Subsets are denoted in the legend. Frequency, normalized to each subset total count, is on the ordinate.
Figure S2.
Influenza A subtype frequencies in segment 7 position 15 subsets. Subsets are denoted in the legend. Frequency, normalized to each subset total count, is on the ordinate.
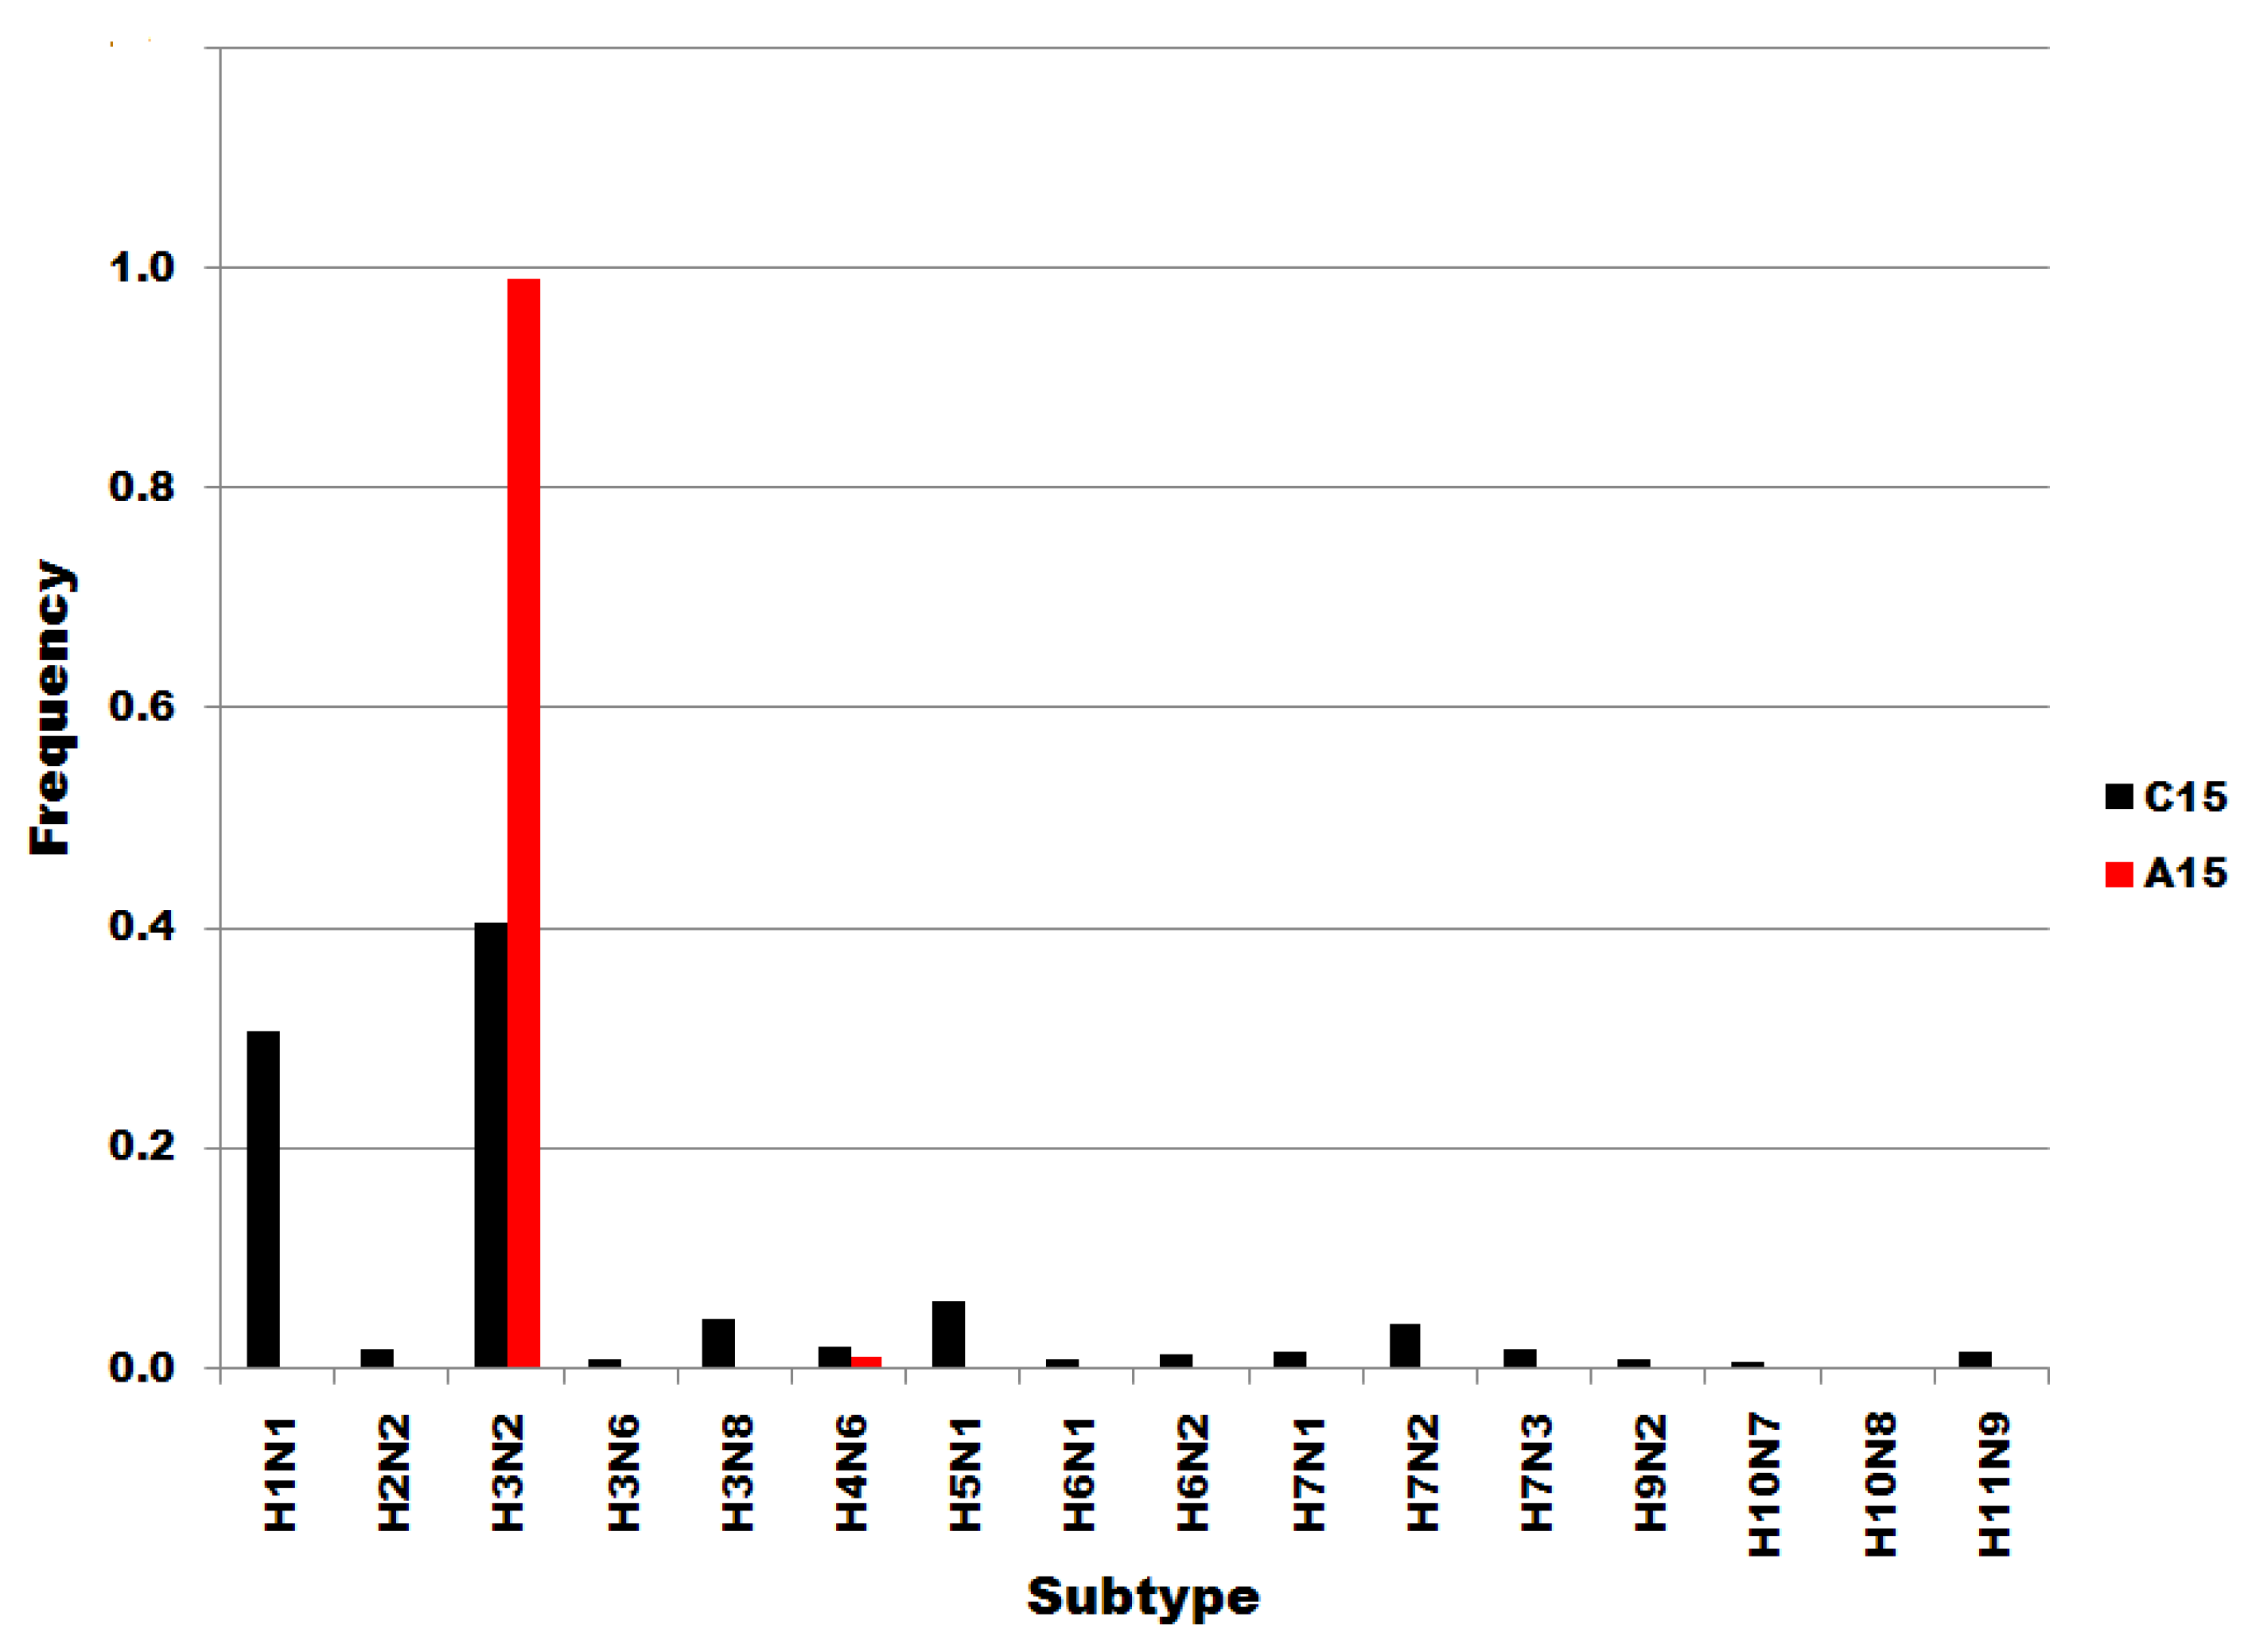
Figure S3.
Viral source frequencies in influenza A segment 7 position 12 subsets. Subsets are denoted in the legend. Frequency, normalized to each subset total count, is on the ordinate.
Figure S3.
Viral source frequencies in influenza A segment 7 position 12 subsets. Subsets are denoted in the legend. Frequency, normalized to each subset total count, is on the ordinate.

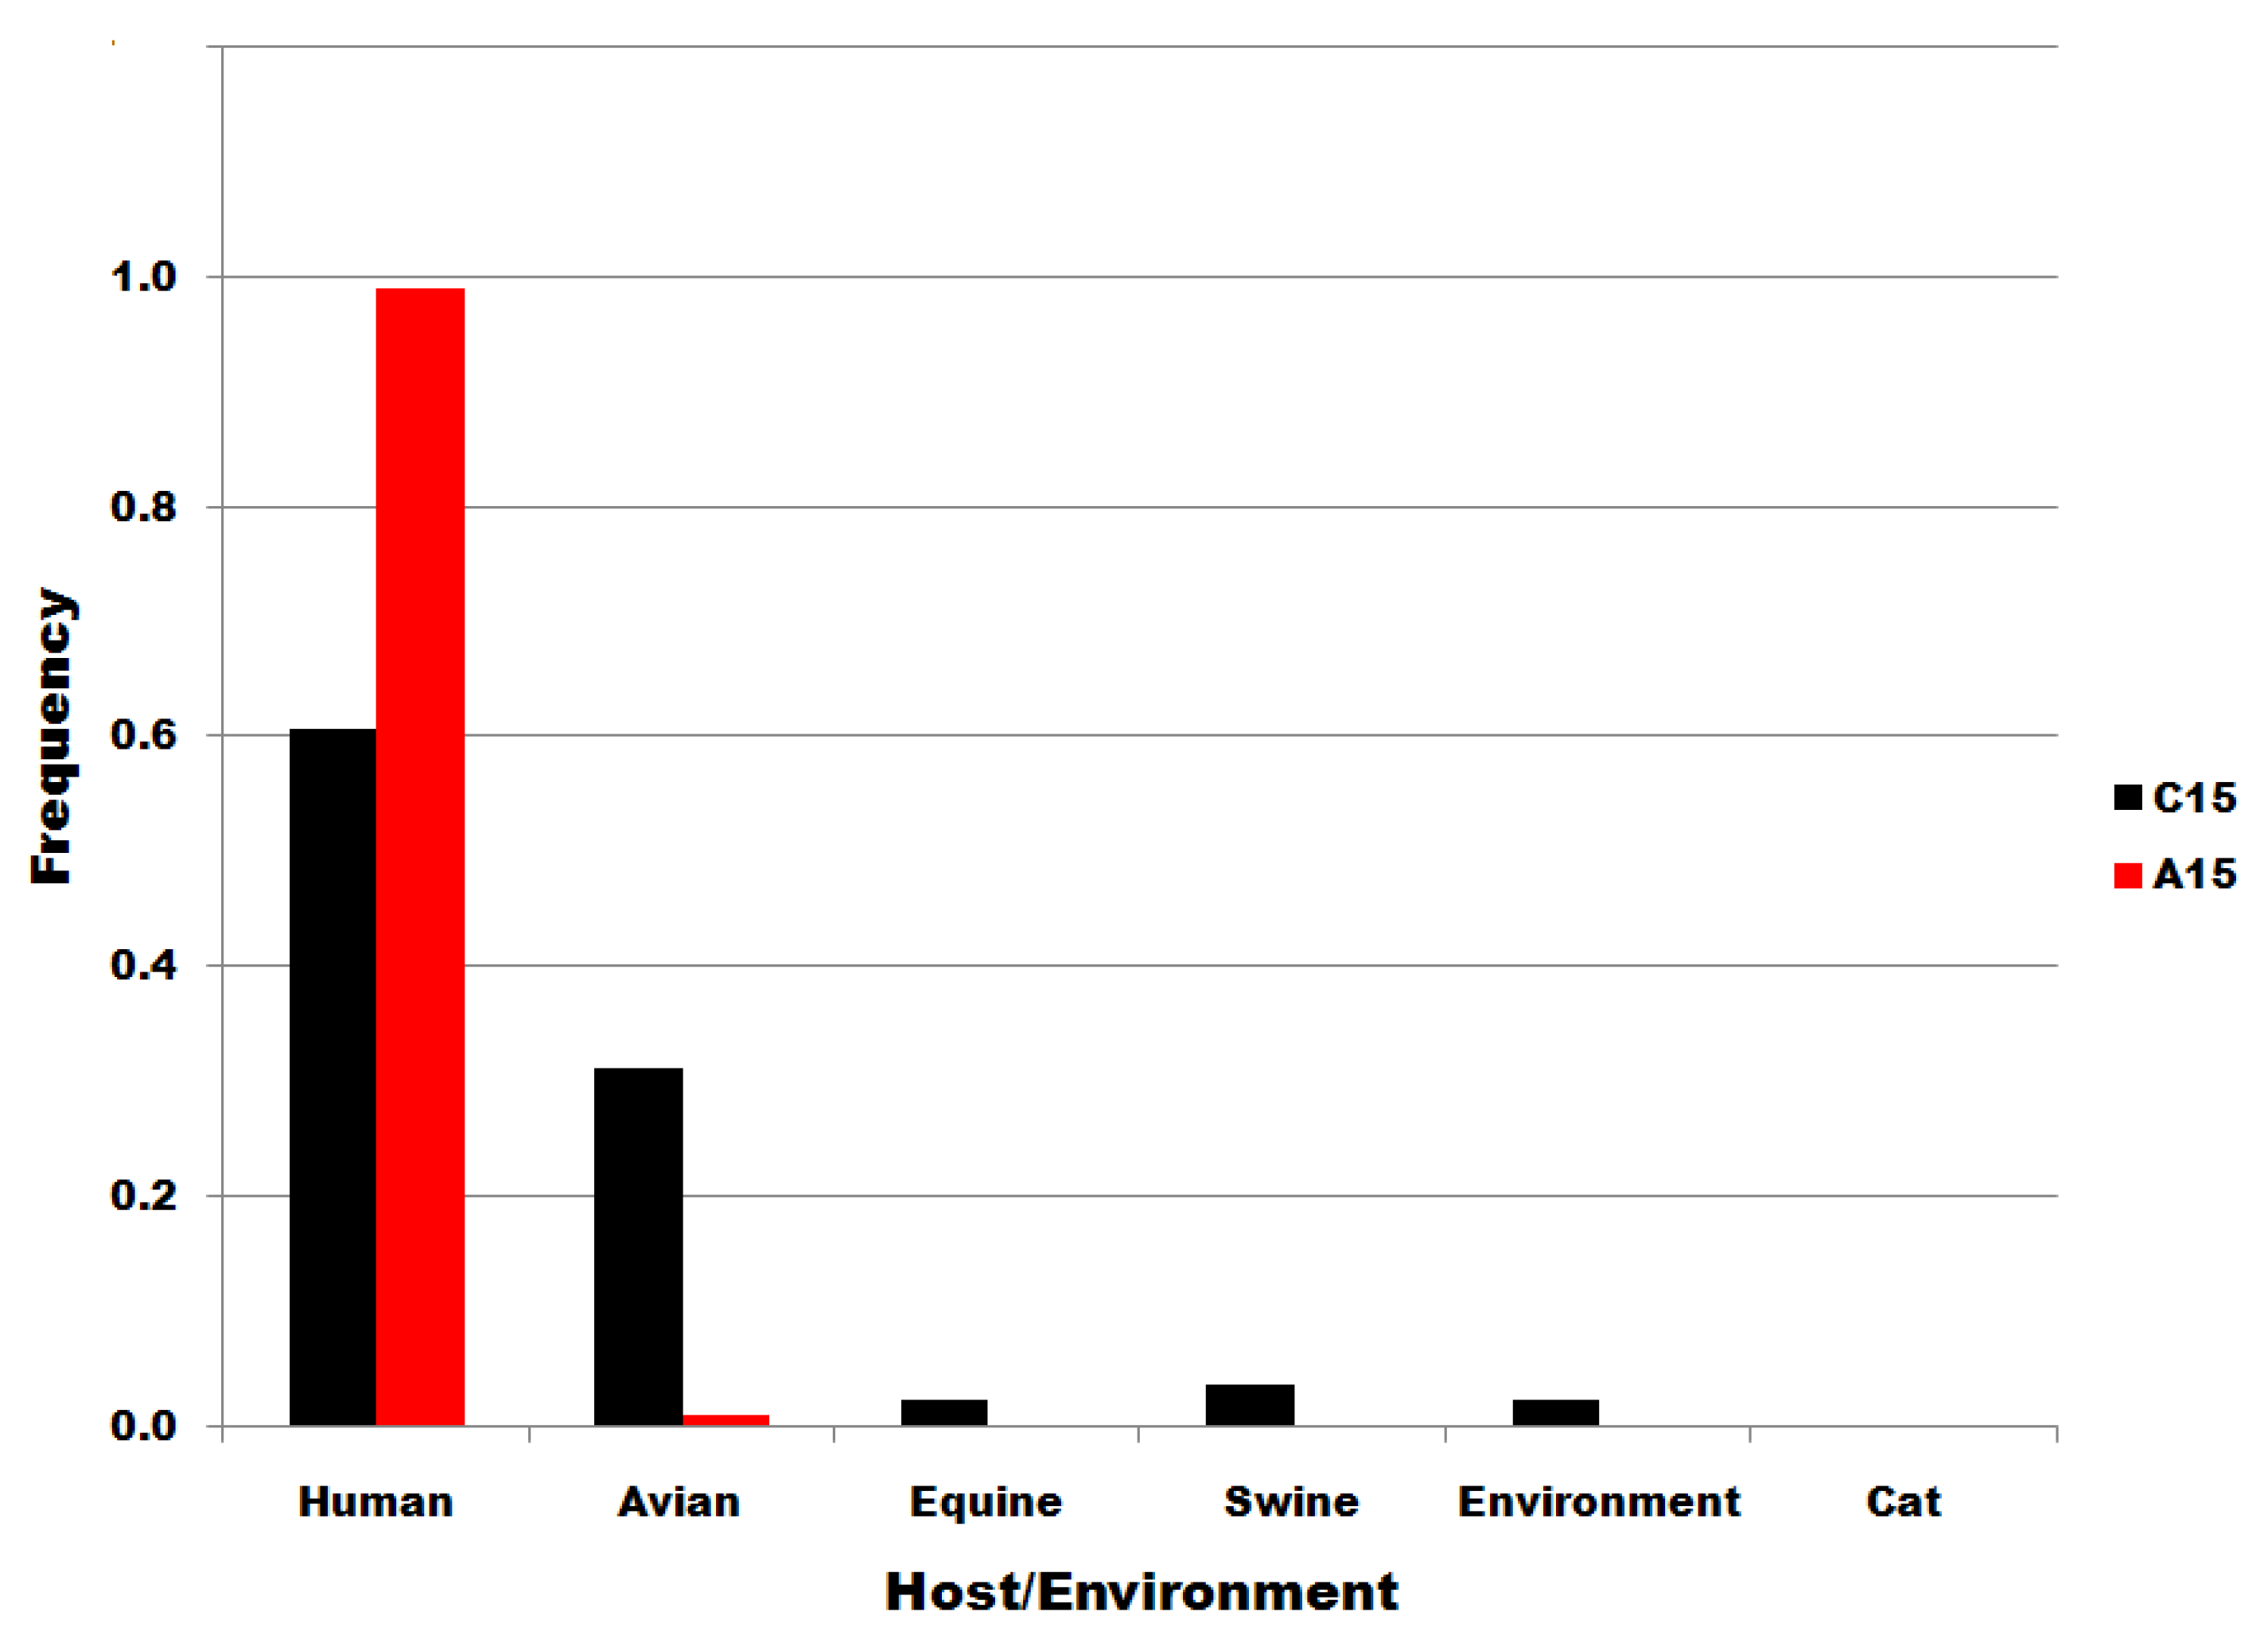
Figure S4.
Viral source frequencies in influenza A segment 7 position 15 subsets. Subsets are denoted in the legend. Frequency, normalized to each subset total count, is on the ordinate.
Figure S4.
Viral source frequencies in influenza A segment 7 position 15 subsets. Subsets are denoted in the legend. Frequency, normalized to each subset total count, is on the ordinate.
© 2008 by the authors; licensee Molecular Diversity Preservation International, Basel, Switzerland. This article is an open-access article distributed under the terms and conditions of the Creative Commons Attribution license (http://creativecommons.org/licenses/by/3.0/).
Share and Cite
MDPI and ACS Style
Thompson, W.A.; Fan, S.; Weltman, J.K. Information Entropy of Influenza A Segment 7. Entropy 2008, 10, 736-744. https://doi.org/10.3390/e10040736
AMA Style
Thompson WA, Fan S, Weltman JK. Information Entropy of Influenza A Segment 7. Entropy. 2008; 10(4):736-744. https://doi.org/10.3390/e10040736
Chicago/Turabian StyleThompson, William A., Shaohua Fan, and Joel K. Weltman. 2008. "Information Entropy of Influenza A Segment 7" Entropy 10, no. 4: 736-744. https://doi.org/10.3390/e10040736