Projection Pursuit Through ϕ-Divergence Minimisation

Laboratoire de Statistique Théorique et Appliquée, Université Pierre et Marie Curie, 175 rue du Chevaleret, 75013 Paris, France
Entropy 2010, 12(6), 1581-1611; https://doi.org/10.3390/e12061581
Submission received: 8 April 2010
/
Revised: 27 May 2010
/
Accepted: 31 May 2010
/
Published: 14 June 2010
Abstract
:In his 1985 article (“Projection pursuit”), Huber demonstrates the interest of his method to estimate a density from a data set in a simple given case. He considers the factorization of density through a Gaussian component and some residual density. Huber’s work is based on maximizing Kullback–Leibler divergence. Our proposal leads to a new algorithm. Furthermore, we will also consider the case when the density to be factorized is estimated from an i.i.d. sample. We will then propose a test for the factorization of the estimated density. Applications include a new test of fit pertaining to the elliptical copulas.
Keywords:
projection pursuit; minimum φ-divergence; elliptical distribution; goodness-of-fit; copula; regressionMSC Classification:
94A17; 62F05; 62J05; 62G081. Outline of the Article
The objective of projection pursuit is to generate one or several projections providing as much information as possible about the structure of the data set regardless of its size:
Once a structure has been isolated, the corresponding data are transformed through a Gaussianization. Through a recursive approach, this process is iterated to find another structure in the remaining data, until no further structure can be evidenced in the data left at the end.
Friedman [1] and Huber [2] count among the first authors to have introduced this type of approaches for evidencing structures. They each describe, with many examples, how to evidence such a structure and consequently how to estimate the density of such data through two different methodologies each. Their work is based on maximizing Kullback–Leibler divergence.
For a very long time, the two methodologies exposed by each of the above authors were thought to be equivalent but Zhu [3] showed it was in fact not the case when the number of iterations in the algorithms exceeds the dimension of the space containing the data, i.e., in case of density estimation. In the present article, we will therefore only focus on Huber’s study while taking into account the Zhu remarks.
At present, let us briefly introduce Huber’s methodology. We will then expose our approach and objective.
1.1. Huber’s analytic approach
Let f be a density on . We define an instrumental density g with same mean and variance as f. Huber’s methodology requires us to start with performing the test—with K being the Kullback–Leibler divergence. Should this test turn out to be positive, then and the algorithm stops. If the test were not to be verified, the first step of Huber’s algorithm amounts to defining a vector and a density by
where is the set of non-null vectors of , where (resp. ) stands for the density of (resp. ) when f (resp. g) is the density of X (resp. Y). More exactly, this results from the maximisation of since and it is assumed that is finite. In a second step, Huber replaces f with and goes through the first step again.
By iterating this process, Huber thus obtains a sequence of vectors of and a sequence of densities .
1.1. Huber stops his algorithm when the Kullback–Leibler divergence equals zero or when his algorithm reaches the iteration, he then obtains an approximation of f from g:
When there exists an integer j such that with , he obtains , i.e., since by induction . Similarly, when, for all j, Huber gets with , he assumes in order to derive .
He can also stop his algorithm when the Kullback–Leibler divergence equals zero without the condition is met. Therefore, since by induction we have with , we obtain . Consequently, we derive a representation of f as
Finally, he obtains with .
1.2. Huber’s synthetic approach
Keeping the notations of the above section, we start with performing the test; should this test turn out to be positive, then and the algorithm stops, otherwise, the first step of his algorithm would consist in defining a vector and a density by
More exactly, this optimisation results from the maximisation of since and it is assumed that is finite. In a second step, Huber replaces g with and goes through the first step again. By iterating this process, Huber thus obtains a sequence of vectors of and a sequence of densities .
1.2. First, in a similar manner to the analytic approach, this methodology enables us to approximate and even to represent f from g:
To obtain an approximation of f, Huber either stops his algorithm when the Kullback–Leibler divergence equals zero, i.e., implies with , or when his algorithm reaches the iteration, i.e., he approximates f with .
To obtain a representation of f, Huber stops his algorithm when the Kullback–Leibler divergence equals zero, since implies . Therefore, since by induction we have with , we then obtain
Second, he gets with .
1.3. Proposal
Let us first introduce the concept of divergence.
Let ϕ be a strictly convex function defined by and such that . We define a divergence of P from Q—where P and Q are two probability distributions over a space Ω such that Q is absolutely continuous with respect to P—by
or , if P and Q present p and q as density respectively.
Throughout this article, we will also assume that , that is continuous and that this divergence is greater than the distance—see also Appendix A.1 page 1604.
Now, let us introduce our algorithm.
We start with performing the test; should this test turn out to be positive, then and the algorithm stops, otherwise, the first step of our algorithm would consist in defining a vector and a density by
Later on, we will prove that simultaneously optimises (1.1), (1.2) and (1.3).
In our second step, we will replace g with , and we will repeat the first step.
And so on, by iterating this process, we will end up obtaining a sequence of vectors in and a sequence of densities .
We will thus prove that the underlying structures of f evidenced through this method are identical to the ones obtained through Huber’s method. We will also evidence the above structures, which will enable us to infer more information on f—see example below.
1.3. As in the previous algorithm, we first provide an approximate and even a representation of f from g: To obtain an approximation of f, we stop our algorithm when the divergence equals zero, i.e., implies with , or when our algorithm reaches the iteration, i.e., we approximate f with .
To obtain a representation of f, we stop our algorithm when the divergence equals zero. Therefore, since by induction we have with , we then obtain
Second, we get with .
Finally, the specific form of relationship (1.3) establishes that we deal with M-estimation. We can therefore state that our method is more robust than Huber’s—see Yohai [4], Toma [5] as well as Huber [6].
At present, let us study two examples:
1.1. Let f be a density defined on by , with n being a bi-dimensional Gaussian density, and h being a non-Gaussian density. Let us also consider g, a Gaussian density with same mean and variance as f.
Since , we then have as , i.e., the function reaches zero for —where and are the third marginal densities of f and g respectively.
We therefore obtain .
1.2. Assuming that the φ-divergence is greater than the norm. Let us consider , the Markov chain with continuous state space E. Let f be the density of and let g be the normal density with same mean and variance as f.
Let us now assume that with , i.e., let us assume that our algorithm stops for . Consequently, if is a random vector with g density, then the distribution law of given is Gaussian and is equal to the distribution law of given .
And then, for any sequence —where —we have
To recapitulate our method, if , we derive f from the relationship ; should a sequence , , of vectors in defining and such that exist, then , i.e., f coincides with g on the complement of the vector subspace generated by the family —see also Section 2 for a more detailed explanation.
In this paper, after having clarified the choice of g, we will consider the statistical solution to the representation problem, assuming that f is unknown and , ,... are i.i.d. with density f. We will provide asymptotic results pertaining to the family of optimizing vectors —that we will define more precisely below—as m goes to infinity. Our results also prove that the empirical representation scheme converges towards the theoretical one. As an application, Section 3.4 permits a new test of fit pertaining to the copula of an unknown density f, Section 3.5 gives us an estimate of a density deconvoluted with a Gaussian component and Section 3.6 presents some applications to regression analysis. Finally, we will present simulations and an application to real datasets.
2. The Algorithm
2.1. The model
As explained by Friedman [1] and Diaconis [7], the choice of g depends on the family of distribution one wants to find in f. Until now, the choice has only been to use the class of Gaussian distributions. This can be extended to the class of elliptic distributions with almost all divergences.
Elliptical laws
The interest of this class lies in the fact that conditional densities with elliptical distributions are also elliptical—see Cambanis [8], Landsman [9]. This very property allows us to use this class in our algorithm.
Definition 2.1.
X is said to abide by a multivariate elliptical distribution—noted —if X presents the following density, for any x in :
- with Σ, being a positive-definite matrix and with μ, being a d-column vector,
- with , being referred as the “density generator”,
- with , being a normalisation constant, such that , with .
Property 2.1.
1/ For any , for any A, being an matrix with rank and for any b, being an m-dimensional vector, we have .
Therefore, any marginal density of multivariate elliptical distribution is elliptic, i.e., .
2/ Corollary 5 of Cambanis [8] states that conditional densities with elliptical distributions are also elliptic. Indeed, if , with (resp. ) being a size (resp. ), then with and with and .
2.1.
Landsman [9] shows that multivariate Gaussian distributions derive from . He also shows that if has an elliptical density such that its marginals verify and for then μ is the mean of X and Σ is a multiple of the covariance matrix of X. Consequently, from now on, we will assume that we are in this case.
Definition 2.2.
Let t be an elliptical density on and let q be an elliptical density on . The elliptical densities t and q are said to belong to the same family—or class—of elliptical densities, if their generating densities are and respectively, which belong to a common given family of densities.
2.1.
Consider two Gaussian densities and . They are said to belong to the same elliptical families as they both present as generating density.
Choice of g
Let us begin with studying the following case:
Let f be a density on . Let us assume there exists d non-null linearly independent vectors , with of , such that
with , with n being an elliptical density on and with h being a density on , which does not belong to the same family as n. Let be a vector presenting f as density.
Define g as an elliptical distribution with same mean and variance as f.
For simplicity, let us assume that the family is the canonical basis of :
The very definition of f implies that is independent from . Hence, the density of given is n.
Let us assume that for some . We then get , since, by induction, we have .
Consequently, the fact that conditional densities with elliptical distributions are also elliptical enables us to infer that
In other words, f coincides with g on the complement of the vector subspace generated by the family .
Now, if the family is no longer the canonical basis of , then this family is again a basis of . Hence, Lemma D.1—page 1607—implies that
which is equivalent to having —since by induction .
The end of our algorithm implies that f coincides with g on the complement of the vector subspace generated by the family . Therefore, the nullity of the divergence provides us with information on the density structure.
In summary, the following proposition clarifies our choice of g which depends on the family of distribution one wants to find in f:
Proposition 2.1.
With the above notations, is equivalent to
More generally, the above proposition leads us to defining the co-support of f as the vector space generated from vectors .
Definition 2.3.
Let f be a density on . We define the co-vectors of f as the sequence of vectors which solves the problem where g is an elliptical distribution with same mean and variance as f. We define the co-support of f as the vector space generated from vectors .
2.2.
Any family defining f as in (2.1), is an orthogonal basis of —see Lemma D.2
2.2. Stochastic outline of our algorithm
Let , ,.., (resp. , ,..,) be a sequence of m independent random vectors with same density f (resp. g). As customary in nonparametric divergence optimizations, all estimates of f and as well as all uses of Monté Carlo’s methods are being performed using subsamples , ,.., and , ,..,—extracted respectively from , ,.., and , ,..,—since the estimates are bounded below by some positive deterministic sequence —see Appendix B.
Let be the empirical measure of the subsample , ,.,. Let (resp. for any a in ) be the kernel estimate of f (resp. ), which is built from , ,.., (resp. , ,..,).
The stochastic setting up of the algorithm uses and instead of f and —since g is known. Thus, at the first step, we build the vector which minimizes the divergence between and and which estimates :
Proposition B.1 page 1606 and Lemma D.3 page 1607 enable us to minimize the divergence between and . Defining as the argument of this minimization, Proposition 3.3 page 1589 shows us that this vector tends to .
Finally, we define the density as which estimates through Theorem 3.1.
Now, from the second step and as defined in Section 1.3, the density is unknown. Consequently, once again, we have to truncate the samples:
All estimates of f and (resp. and ) are being performed using a subsample , ,.., (resp. , ,..,) extracted from , ,.., (resp. , ,..,—which is a sequence of m independent random vectors with same density ) such that the estimates are bounded below by some positive deterministic sequence —see Appendix B.
Let be the empirical measure of the subsample , ,..,. Let (resp. , , for any a in ) be the kernel estimate of f (resp. and as well as ) which is built from , ,.., (resp. , ,.., and , ,.., as well as , ,..,). The stochastic setting up of the algorithm uses and instead of f and .
Thus, we build the vector which minimizes the divergence between and —since and are unknown—and which estimates .
Proposition B.1 page 1606 and Lemma D.3 page 1607 enable us to minimize the divergence between and . Defining as the argument of this minimization, Proposition 3.3 page 1589 shows us that this vector tends to in n. Finally, we define the density as which estimates through Theorem 3.1.
And so on, we will end up obtaining a sequence of vectors in estimating the co-vectors of f and a sequence of densities such that estimates through Theorem 3.1.
3. Results
3.1. Convergence results
3.1.1. Hypotheses on f
In this paragraph, we define the set of hypotheses on f which could possibly be of use in our work. Discussion on several of these hypotheses can be found in Appendix C.
In this section, to be more legible we replace g with . Let
where is the probability measure presenting f as density.
Similarly as in chapter V of Van der Vaart [10], let us define :
- (H1)
- :
- (H2)
- :
- (H3)
- : There is a neighbourhood V of ak, and a positive function H, such that, for all
- (H4)
- : There is a neighbourhood V of ak, such that for all ε, there is a η such that for all
- (H5)
- : The function φ is in ) and there is a neighbourhood of such that, for all of , the gradient and the Hessian exist (), and the first order partial derivatives and the first and second order derivatives of are dominated (a.s.) by λ-integrable functions.
- (H6)
- : The function is in a neighbourhood of for all x; and the partial derivatives of are all dominated in by a integrable function .
- (H7)
- : and are finite and the expressions and exist and are invertible.
- (H8)
- : There exists k such that .
- (H9)
- : exists and is invertible.
- (H0)
- : f and g are assumed to be positive and bounded and such that .
3.1.2. Estimation of the first co-vector of f
Let be the class of all positive functions r defined on and such that is a density on for all a belonging to . The following proposition shows that there exists a vector a such that minimizes in r:
Proposition 3.1.
There exists a vector a belonging to such that
3.1.
This proposition proves that simultaneously optimises (1.1), (1.2) and (1.3). In other words, it proves that the underlying structures of f evidenced through our method are identical to the ones obtained through Huber’s methods.
Following Broniatowski [11], let us introduce the estimate of , through
Proposition 3.2.
Let be such that
Then, is a strongly convergent estimate of a, as defined in Proposition 3.1.
Let us also introduce the following sequences and , for any given n—see Section 2.2.:
- is an estimate of as defined in Proposition 3.2 with instead of g,
- is such that , , i.e., .
3.1.3. Convergence study at the step of the algorithm:
In this paragraph, we will show that the sequence converges towards and that the sequence converges towards .
Let with , and . We state
Proposition 3.3.
Both and converge toward a.s.
Finally, the following theorem shows that converges almost everywhere towards :
Theorem 3.1.
It holds
3.2. Asymptotic Inference at the step of the algorithm
The following theorem shows that converges towards at the rate in three different cases, namely for any given x, with the distance and with the Kullback–Leibler divergence:
Theorem 3.2.
It holds and
The following theorem shows that the laws of our estimators of , namely and , converge towards a linear combination of Gaussian variables.
Theorem 3.3.
It holds and where , and
3.3. A stopping rule for the procedure
In this paragraph, we will call (resp. ) the kernel estimator of (resp. ). We will first show that converges towards f in k and n. Then, we will provide a stopping rule for this identification procedure.
3.3.1. Estimation of f
The following proposition provides us with an estimate of f:
Theorem 3.4.
We have a.s.
Consequently, the following corollary shows that converges towards zero as k and then as n go to infinity:
Corollary 3.1.
We have a.s.
3.3.2. Testing of the criteria
In this paragraph, through a test of our criteria, namely , we will build a stopping rule for this procedure. First, the next theorem enables us to derive the law of our criteria:
Theorem 3.5.
For a fixed k, we have
where k represents the step of our algorithm and where I is the identity matrix in .
Note that k is fixed in Theorem 3.5 since where M is a known function of k—see Section 3.1. Thus, in the case when , we obtain
Corollary 3.2.
We have .
Hence, we propose the test of the null hypothesis
Based on this result, we stop the algorithm, then, defining as the last vector generated, we derive from Corollary 3.2 a α-level confidence ellipsoid around , namely
where is the quantile of a α-level reduced centered normal distribution and where is the empirical measure arising from a realization of the sequences and .
Consequently, the following corollary provides us with a confidence region for the above test:
Corollary 3.3.
is a confidence region for the test of the null hypothesis versus .
3.4. Goodness-of-fit test for copulas
Let us begin with studying the following case:
Let f be a density defined on and let g be an elliptical distribution with same mean and variance as f. Assuming first that our algorithm leads us to having where family is the canonical basis of . Hence, we have —through Lemma D.4 page 1608—and . Therefore, i.e., , and then where (resp. ) is the copula of f (resp. g).
Let us assume that our algorithm implies that .
Hence, we have, for any , , i.e., , since Lemma D.4 page 1608 implies that if .
Moreover, the family is a basis of —see Lemma D.5 page 1608. Hence, putting and defining vector y (resp. density , copula of , density , copula of ) as the expression of vector x (resp. density f, copula of f, density g, copula of g) in basis A, the above equality implies
Finally, we perform a statistical test of the null hypothesis : versus the alternative : . Since, under , we have , then, as explained in Section 3.3, Corollary 3.3 provides us with a confidence region for our test.
Theorem 3.6.
Keeping the notations of Corollary 3.3, we infer that is a confidence region for the test of the null hypothesis versus the alternative hypothesis .
3.5. Rewriting of the convolution product
In the present paper, we first elaborated an algorithm aiming at isolating several known structures from initial data. Our objective was to verify if for a known density on , a known density n on such that, for ,
did indeed exist, with , with being a basis of and with h being a density on .
Secondly, our next step consisted in building an estimate (resp. a representation) of f without necessarily assuming that f meets relationship (3.1)—see Theorem 3.4.
Consequently, let us consider and , two random vectors with respective densities and —which is elliptical—on . Let us consider a random vector X such that and let f be its density. This density can then be written as
Then, the following property enables us to represent f under the form of a product and without the integral sign.
Proposition 3.4.
Let φ be a centered elliptical density with , , as covariance matrix, such that it is a product density in all orthogonal coordinate systems and such that its characteristic function is integrable—see Landsman [9]. Let f be a density on which can be deconvoluted with ϕ, i.e., where is some density on . Let be the elliptical density belonging to the same elliptical family as f and having same mean and variance as f.
Then, the sequence converges uniformly a.s. and in towards f in k, i.e.,
Finally, with the notations of Section 3.3 and of Proposition 3.4, the following theorem enables us to estimate any convolution product of a multivariate elliptical density φ with a continuous density :
Theorem 3.7.
It holds
3.6. On the regression
In this section, we will study several applications of our algorithm pertaining to the regression analysis. We define (resp. ) as a vector with density f (resp. g—see Section 2.1).
3.2.
In this paragraph, we will work in the space. Then, we will first only consider the divergences which are greater than or equal to the distance—see Vajda [12]. Note also that the co-vectors of f can be obtained in the space—see Lemma D.3 and Proposition B.1.
3.6.1. The basic idea
In this paragraph, we will assume that and that our algorithm stops for and . The following theorem provides us with the regression of on :
Theorem 3.8.
The probability measure of given is the same as the probability measure of given . Moreover, the regression between and is where ε is a centered random variable orthogonal to .
3.3
This theorem implies that . This equation can be used in many fields of research. The Markov chain theory has been used for instance in Example 1.2.
Moreover, if g is a Gaussian density with same mean and variance as f, then Saporta [14] implies that and then
3.6.2. General case
In this paragraph, we will assume that and that our algorithm stops with j for . Lemma D.6 implies the existence of an orthogonal and free family of such that and such that
Hence, the following theorem provides us with the regression of , , on :
Theorem 3.9.
The probability measure of given is the same as the probability measure of given . Moreover, the regression of , , on is , where ε is a centered random vector such that is orthogonal to .
Corollary 3.4.
If g is a Gaussian density with same mean and variance as f, and if for any , then, the regression of , , on is , where ε is a centered random vector such that is orthogonal to .
4. Simulations
Let us study five simulations. The first involves a -divergence, the second a Hellinger distance, the third and the fourth a Cressie–Read divergence (still with ), and the fifth a Kullback–Leibler divergence.
In each example, our program will follow our algorithm and will aim at creating a sequence of densities , , , such that and with being a divergence and for all . Moreover, in the second example, we will study the robustness of our method with two outliers. In the third and the fourth example, defining as a vector with f as density, we will study the regression of on . And finally, in the fifth example, we will perform our goodness-of-fit test for copulas.
4.1
(With the divergence).
We are in dimension 3(=d), and we consider a sample of 50(=n) values of a random variable X with a density law f defined by
where the Normal law parameters are and and where the Gumbel distribution parameters are and 4. Let us generate then a Gaussian random variable Y with a density—that we will name g—presenting the same mean and variance as f.
We theoretically obtain and . To get this result, we perform the following test:
Then, Corollary 3.3 enables us to estimate by the following 0.9(=α) level confidence ellipsoid
And, we obtain
Therefore, we conclude that f = g(1).

| Our Algorithm | |
| Projection Study 0 : | minimum : 0.0201741 |
| at point : (1.00912,1.09453,0.01893) | |
| P-Value : 0.81131 | |
| Test : | : : True |
| (Kernel Estimation of , ) | 6.1726 |
4.2
(With the Hellinger distance H).
We are in dimension 20(=d). We first generate a sample with 100(=n) observations, namely two outliers and 98 values of a random variable X with a density f defined by
where the Gumbel law parameters are -5 and 1 and where the normal distribution is reduced and centered. Our reasoning is the same as in Simulation 4.1.
In the first part of the program, we theoretically obtain and . To get this result, we perform the following test
We estimate by the following 0.9(=α) level confidence ellipsoid
And, we obtain
| Our Algorithm | |
| Projection Study 0 | minimum : 0.002692 |
| at point : (1.01326, 0.0657, 0.0628, 0.1011, 0.0509, 0.1083, | |
| 0.1261, 0.0573, 0.0377, 0.0794, 0.0906, 0.0356, 0.0012, | |
| 0.0292, 0.0737, 0.0934, 0.0286, 0.1057, 0.0697, 0.0771) | |
| P-Value : 0.80554 | |
| Test : | : : True |
| H(Est. of , ) | 3.042174 |
Therefore, we conclude that f = g(1).
4.3
(With the Cressie-Read divergence ()).
We are in dimension 2(=d), and we consider a sample of 50(=n) values of a random variable with a density law f defined by
where the Gumbel law parameters are -5 and 1 and where the normal distribution parameters are . Let us generate then a Gaussian random variable Y with a density—that we will name g—presenting the same mean and variance as f.
We theoretically obtain and . To get this result, we perform the following test
Then, Corollary 3.3 enables us to estimate by the following 0.9(=α) level confidence ellipsoid
And, we obtain
| Our Algorithm | |
| Projection Study 0 : | minimum : 0.0210058 |
| at point : (1.001,0.0014) | |
| P-Value : 0.989552 | |
| Test : | : : True |
| (Kernel Estimation of , ) | 6.47617 |
Therefore, we conclude that f = g(1).
Figure 1.
Graph of the distribution to estimate (red) and of our own estimate (green).

Figure 2.
Graph of the distribution to estimate (red) and of Huber’s estimate (green).

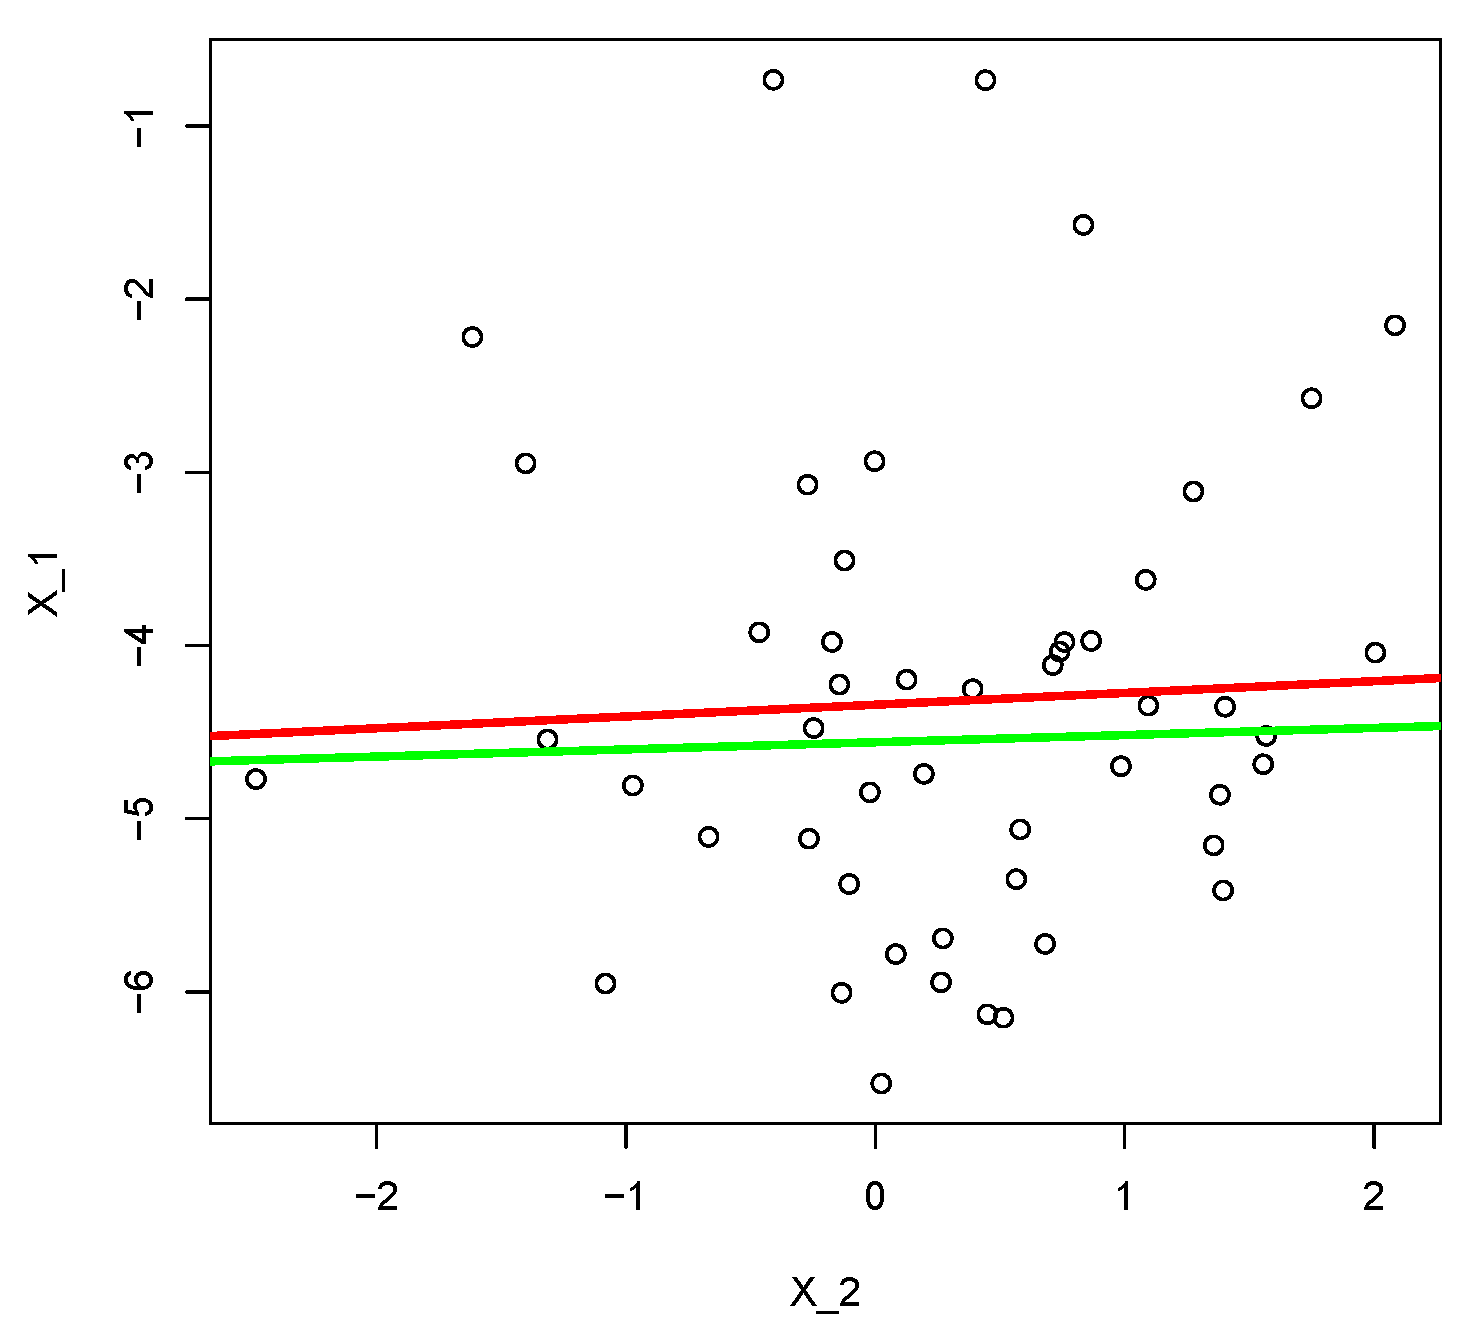
At present, keeping the notations of this simulation, let us study the regression of on .
Our algorithm leads us to infer that the density of given is the same as the density of given . Moreover, Property A.1 implies that the co-factors of f are the same for any divergence. Consequently, applying Theorem 3.8 implies that where ε is a centered random variable orthogonal to .
Thus, since g is a Gaussian density, Remark 3.3 implies that
Now, using the least squares method, we estimate and such that
Thus, the following table presents the results of our regression and of the least squares method if we assume that ε is Gaussian.
| Our Regression | -4.545483 | |
| 0.0380534 | ||
| 0.9190052 | ||
| 0.3103752 | ||
| correlation | 0.02158213 | |
| Least squares method | -4.34159227 | |
| Std Error of | 0.19870 | |
| 0.06803317 | ||
| Std Error of | 0.21154 | |
| correlation | 0.04888484 |
Figure 3.
Graph of the regression of on based on the least squares method (red) and based on our theory (green).
Figure 3.
Graph of the regression of on based on the least squares method (red) and based on our theory (green).

4.4
(With the Cressie-Read divergence ()).
We are in dimension 2(=d), and we consider a sample of 500(=n) values of a random variable with a density law f defined by
where the Gumbel law parameters are -5 and 1 and where the normal distribution parameters are . Let us generate then a Gaussian random variable Y with a density—that we will name g—presenting the same mean and variance as f.
We theoretically obtain and . To get this result, we perform the following test Then, Corollary 3.3 enables us to estimate by the following 0.9(=α) level confidence ellipsoid
And, we obtain
| Our Algorithm | |
| Projection Study 0 : | minimum : 0.010920 |
| at point : (1.09,-0.9701) | |
| P-Value : 0.889400 | |
| Test : | : : True |
| (Kernel Estimation of , ) | 5.25077 |
Therefore, we conclude that f = g(1).
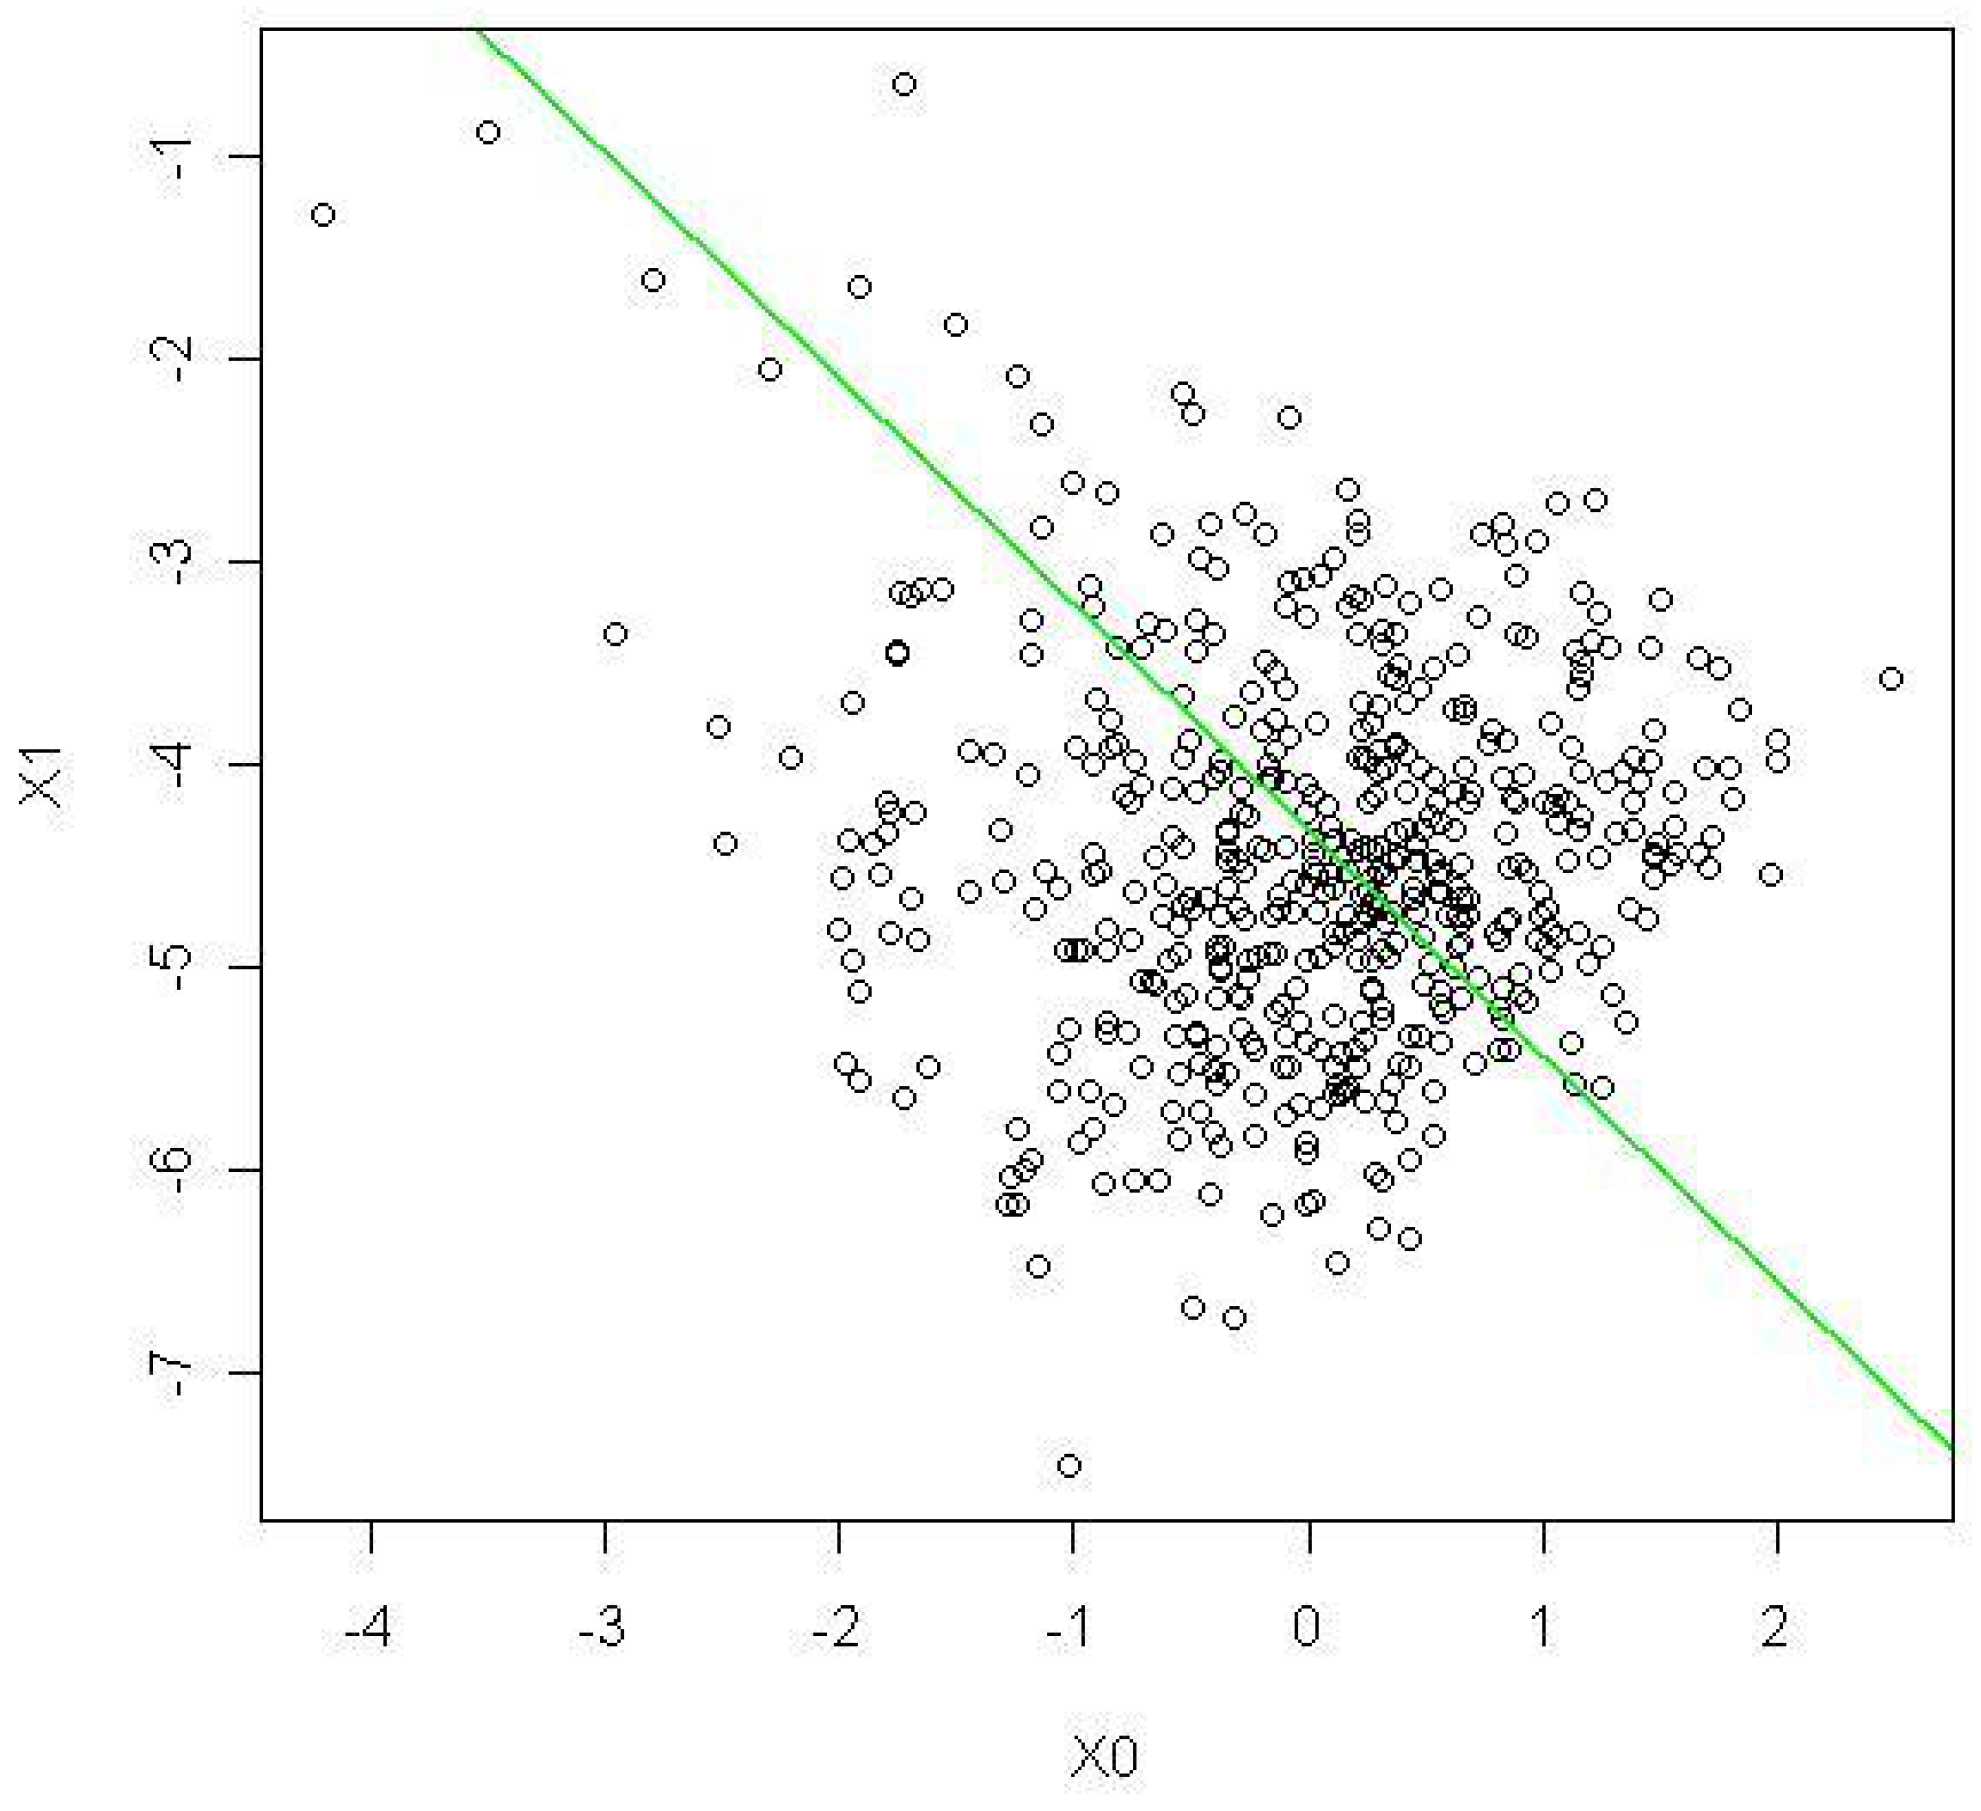
At present, keeping the notations of this simulation, let us study the regression of on . Our algorithm leads us to infer that the density of given is the same as the density of given . Moreover, Property A.1 implies that the co-factors of f are the same for any divergence. Consequently, putting , , and , and since is an orthogonal basis, we can therefore infer from Theorem 3.8 that where ε is a centered random variable orthogonal to .
Thus, since g is a Gaussian density, Remark 3.3 implies that
In other words, we apply the same reasoning as the one used in the regression studies in Simulation 4.3 to instead of . This is possible since is an orthogonal basis of , i.e., we implement a change in basis from the canonical basis of to .
Thus, in the canonical basis becomes , i.e., we obtain that
where ε is a centered random variable orthogonal to .
The following table presents the results of our regression.
We simulate 10 times the regression and we obtain a and b such that :
| Simulation | a | Std Error of a | b | Std Error of b |
| 1 | -4.83739 | 0.11149 | -0.95861 | 0.04677 |
| 2 | -4.56895 | 0.09989 | -0.88577 | 0.04225 |
| 3 | -4.4926 | 0.1057 | -1.2085 | 0.0452 |
| 4 | -4.70619 | 0.10350 | -1.04549 | 0.04235 |
| 5 | -4.40331 | 0.10248 | -1.00890 | 0.0438 |
| 6 | -4.61757 | 0.09813 | -1.20890 | 0.04649 |
| 7 | -4.40572 | 0.09172 | -1.16085 | 0.04091 |
| 8 | -4.39581 | 0.10174 | -1.38696 | 0.04487 |
| 9 | -4.42780 | 0.10018 | -0.93672 | 0.04066 |
| 10 | -4.55394 | 0.09923 | -0.98065 | 0.04382 |
Figure 4.
Graph of the regression of on based on our theory (green).

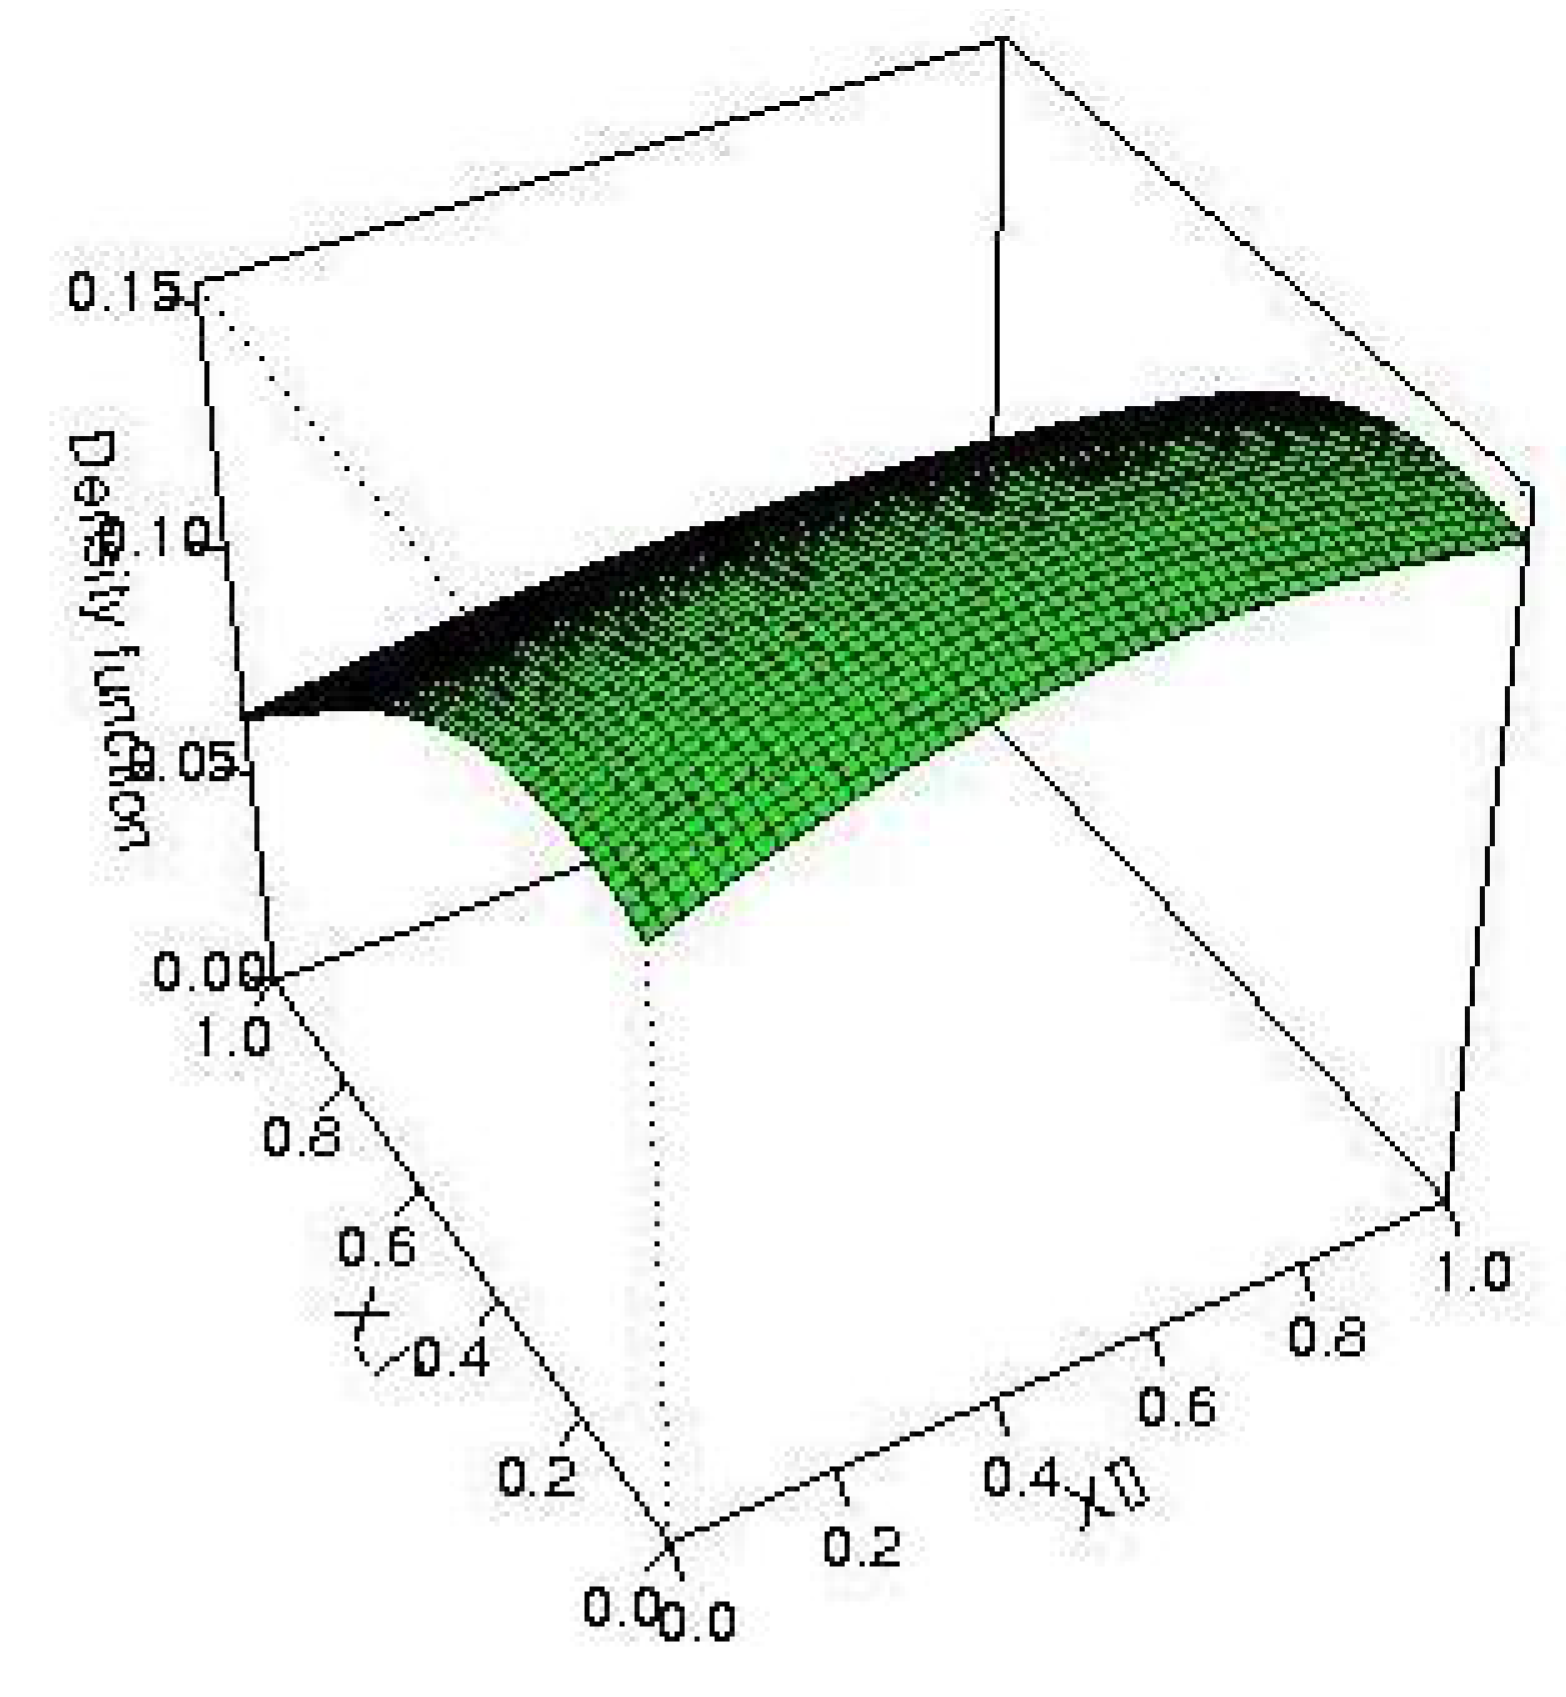
4.5
(With the Kullback-Leibler divergence K).
We are in dimension 2(=d), and we use the Kullback–Leibler divergence to perform our optimisations. Let us consider a sample of 50(=n) values of a random variable X with a density law f defined by :
where :
Then, Theorem 3.6 enables us to verify by the following 0.9(=α) level confidence ellipsoid
And, we obtain
- c is the Gaussian copula with correlation coefficient ,
- the Gumbel distribution parameters are and 1 and
- the Exponential density parameter is 2.
| Our Algorithm | |
| Projection Study number 0 : | minimum : 0.445199 |
| at point : (1.0142,0.0026) | |
| P-Value : 0.94579 | |
| Test : | : : True |
| Projection Study number 1 : | minimum : 0.0263 |
| at point : (0.0084,0.9006) | |
| P-Value : 0.97101 | |
| Test : | : : True |
| K(Kernel Estimation of , ) | 4.0680 |
Figure 5.
Graph of the estimate of .

Application to real datasets
Let us now apply our theory to real datasets.
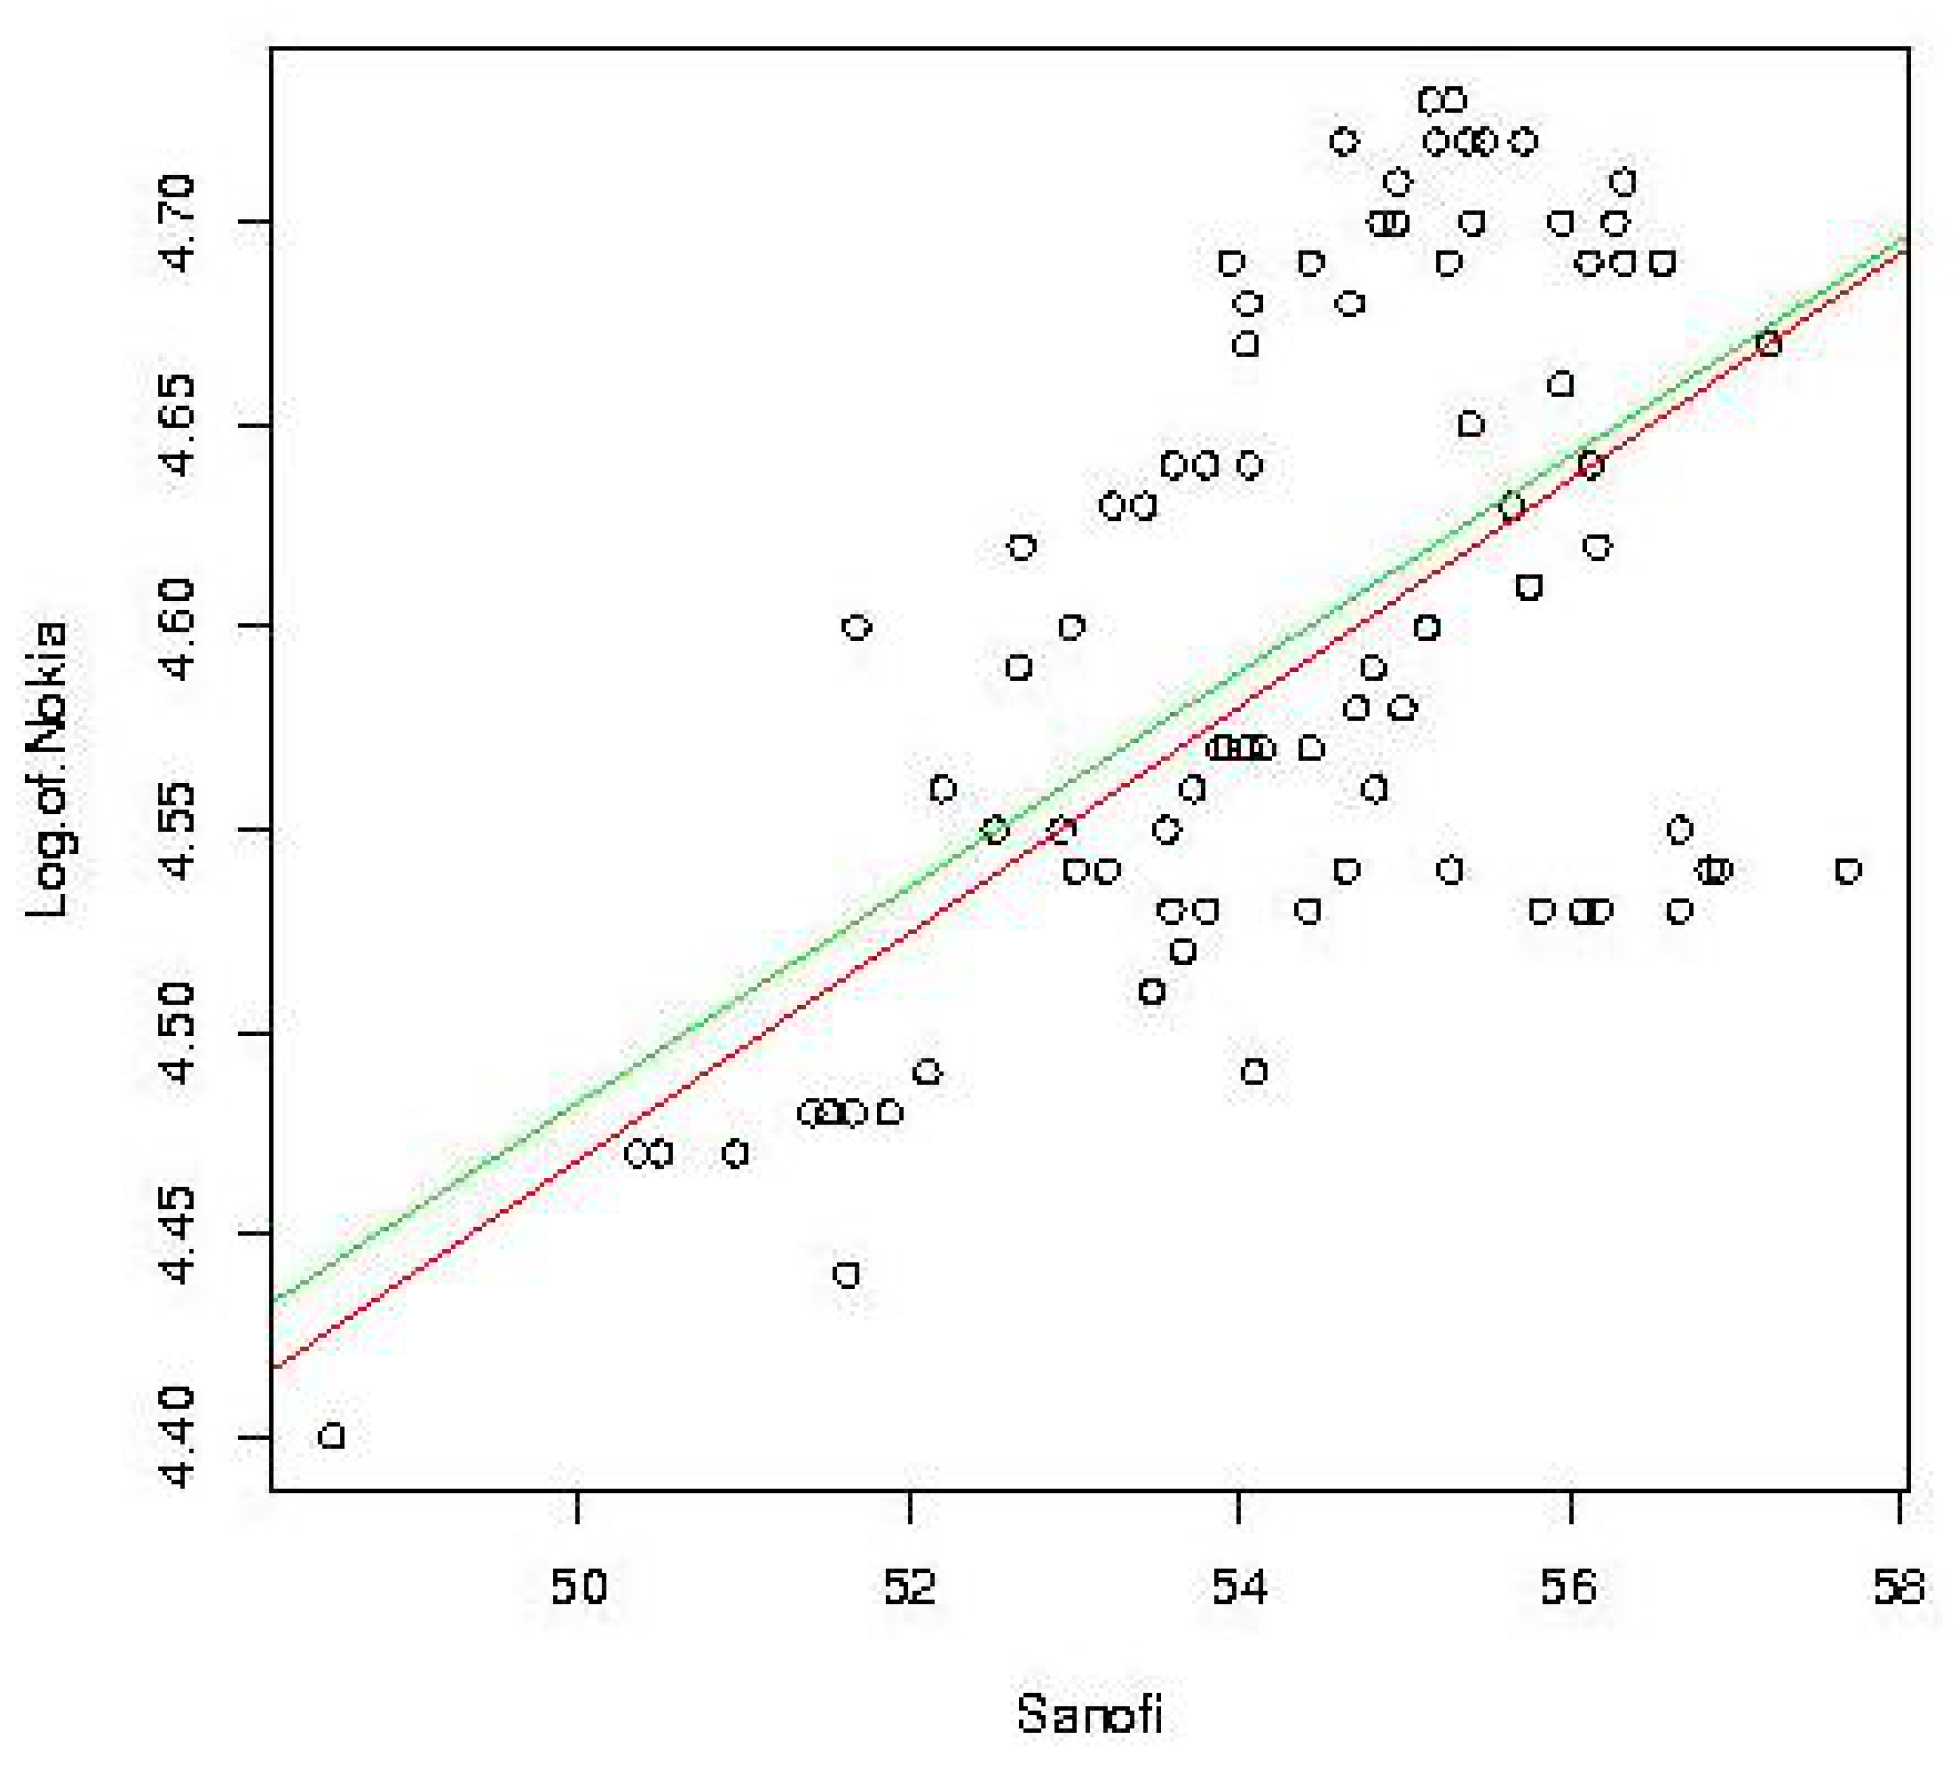
Let us for instance study the moves in the stock prices of Nokia and Sanofi from January 11, 2010 to May 10, 2010. We thus gather 84(=n) data from these stock prices—see data below.
Let us also consider (resp. ) the random variable defining the stock price of Nokia (resp. Sanofi). We will assume—as it is commonly done in mathematical finance—that the stock market abides by the classical hypotheses of the Black–Scholes model—see [13].
Consequently, and each present a log-normal distribution as probability distribution. Let f be the density of vector , let us now apply our algorithm to f with the Kullback–Leibler divergence as φ-divergence. Let us generate then a Gaussian random variable Y with a density—that we will name g—presenting same mean and variance as f.
We first assume that there exists a vector a such that .
In order to verify this hypothesis, our reasoning will be the same as in Simulation 4.1. Indeed, we assume that this vector is a co-factor of f. Consequently, Corollary 3.3 enables us to estimate a by the following 0.9(=α) level confidence ellipsoid
And, we obtain
Therefore, we conclude that , i.e., our hypothesis is confirmed.
| Our Algorithm | |
| Projection Study 0 : | minimum : 0.017345 |
| at point : (0.027,3.18) | |
| P-Value : 0.890210 | |
| Test : | : : True |
| K(Kernel Estimation of , ) | 2.7704005 |
Consequently, as explained in Simulations 4.3 and 4.4, we can say that
where ε is a centered random variable orthogonal to .
Finally, using the least squares method, we estimate and such that Thus, the following table presents the results of the least squares method if we assume that ε is Gaussian:
| Simulation | Std Error of | Std Error of | ||
| 1 | 3.153694 | 0.230380 | 0.026578 | 0.004236 |
Figure 6.
Graph of the regression of log of Nokia on Sanofi based on the least squares method (red) and based on our theory (green).
Figure 6.
Graph of the regression of log of Nokia on Sanofi based on the least squares method (red) and based on our theory (green).

| Date | Nokia | Log-of-Nokia | Sanofi | Date | Nokia | Log-of-Nokia | Sanofi |
| 10/05/10 | 84.75 | 4.44 | 51.62 | 07/05/10 | 81.85 | 4.4 | 48.5 |
| 06/05/10 | 87.3 | 4.47 | 50.35 | 05/05/10 | 87.75 | 4.47 | 50.95 |
| 04/05/10 | 87.25 | 4.47 | 50.49 | 03/05/10 | 87.85 | 4.48 | 51.51 |
| 30/04/10 | 87.8 | 4.48 | 51.66 | 29/04/10 | 87.85 | 4.48 | 51.41 |
| 28/04/10 | 87.85 | 4.48 | 51.88 | 27/04/10 | 89 | 4.49 | 52.11 |
| 26/04/10 | 89.2 | 4.49 | 54.09 | 23/04/10 | 90.7 | 4.51 | 53.47 |
| 22/04/10 | 92.75 | 4.53 | 53.59 | 21/04/10 | 108.4 | 4.69 | 53.95 |
| 20/04/10 | 108.9 | 4.69 | 54.43 | 19/04/10 | 108.3 | 4.68 | 54.05 |
| 16/04/10 | 106.8 | 4.67 | 54.04 | 15/04/10 | 109.9 | 4.7 | 54.95 |
| 14/04/10 | 109.8 | 4.7 | 54.86 | 13/04/10 | 108.3 | 4.68 | 54.67 |
| 12/04/10 | 109.1 | 4.69 | 55.27 | 09/04/10 | 110.1 | 4.7 | 55.41 |
| 08/04/10 | 110.7 | 4.71 | 54.96 | 07/04/10 | 113.2 | 4.73 | 55.3 |
| 06/04/10 | 112.4 | 4.72 | 54.64 | 01/04/10 | 113.3 | 4.73 | 55.16 |
| 31/03/10 | 112.4 | 4.72 | 55.19 | 30/03/10 | 112.5 | 4.72 | 55.39 |
| 29/03/10 | 111.8 | 4.72 | 55.49 | 26/03/10 | 112.5 | 4.72 | 55.72 |
| 25/03/10 | 111.4 | 4.71 | 56.33 | 24/03/10 | 110.2 | 4.7 | 55.95 |
| 23/03/10 | 109.1 | 4.69 | 56.12 | 22/03/10 | 109.2 | 4.69 | 56.33 |
| 19/03/10 | 108.5 | 4.69 | 56.57 | 18/03/10 | 108.4 | 4.69 | 56.56 |
| 17/03/10 | 109.9 | 4.7 | 56.28 | 16/03/10 | 107 | 4.67 | 57.21 |
| Date | Nokia | Log-of-Nokia | Sanofi | Date | Nokia | Log-of-Nokia | Sanofi |
| 15/03/10 | 105.3 | 4.66 | 55.95 | 12/03/10 | 105 | 4.65 | 55.4 |
| 11/03/10 | 103 | 4.63 | 55.65 | 10/03/10 | 104 | 4.64 | 56.13 |
| 09/03/10 | 101.5 | 4.62 | 56.17 | 08/03/10 | 100.7 | 4.61 | 55.75 |
| 05/03/10 | 100.2 | 4.61 | 55.76 | 04/03/10 | 98.7 | 4.59 | 54.81 |
| 03/03/10 | 99.8 | 4.6 | 55.14 | 02/03/10 | 97.25 | 4.58 | 54.99 |
| 01/03/10 | 95.85 | 4.56 | 54.82 | 26/02/10 | 95.85 | 4.56 | 53.72 |
| 25/02/10 | 94.55 | 4.55 | 52.92 | 24/02/10 | 96.3 | 4.57 | 53.92 |
| 23/02/10 | 96.2 | 4.57 | 54.05 | 22/02/10 | 96.7 | 4.57 | 54.14 |
| 19/02/10 | 97.3 | 4.58 | 54.71 | 18/02/10 | 96.6 | 4.57 | 54.43 |
| 17/02/10 | 96.1 | 4.57 | 53.88 | 16/02/10 | 94.95 | 4.55 | 53.56 |
| 15/02/10 | 93.65 | 4.54 | 53.2 | 12/02/10 | 93.55 | 4.54 | 53.01 |
| 11/02/10 | 94.6 | 4.55 | 52.52 | 10/02/10 | 95.55 | 4.56 | 52.2 |
| 09/02/10 | 98.4 | 4.59 | 52.66 | 08/02/10 | 99.2 | 4.6 | 52.98 |
| 05/02/10 | 99.8 | 4.6 | 51.68 | 04/02/10 | 102.6 | 4.63 | 53.42 |
| 03/02/10 | 103.9 | 4.64 | 54.06 | 02/02/10 | 103.8 | 4.64 | 53.8 |
| 01/02/10 | 102.4 | 4.63 | 53.23 | 29/01/10 | 103.6 | 4.64 | 53.6 |
| 28/01/10 | 101.8 | 4.62 | 52.68 | 27/01/10 | 92.55 | 4.53 | 53.8 |
| 26/01/10 | 92.7 | 4.53 | 54.42 | 25/01/10 | 91.9 | 4.52 | 53.66 |
| 22/01/10 | 94.1 | 4.54 | 54.65 | 21/01/10 | 93.7 | 4.54 | 55.28 |
| 20/01/10 | 92.75 | 4.53 | 56.67 | 19/01/10 | 93.6 | 4.54 | 57.69 |
| 18/01/10 | 94.55 | 4.55 | 56.67 | 15/01/10 | 93.55 | 4.54 | 56.85 |
| 14/01/10 | 93.7 | 4.54 | 56.91 | 13/01/10 | 92.5 | 4.53 | 56.18 |
| 12/01/10 | 92.35 | 4.53 | 55.83 | 11/01/10 | 93 | 4.53 | 56.08 |
5. Critics of the Simulations
In the case where f is unknown, we will never be sure to have reached the minimum of the φ-divergence: we have indeed used the simulated annealing method to solve our optimisation problem, and therefore it is only when the number of random jumps tends in theory towards infinity that the probability to reach the minimum tends to 1. We also note that no theory on the optimal number of jumps to implement does exist, as this number depends on the specificities of each particular problem. Moreover, we choose the (resp. and ) for the AMISE of Simulations 4.1, 4.2 and 4.3 (resp. Simulations 4.4 and 4.5). This choice leads us to simulate 50 (resp. 500 and 100) random variables—see Scott [15] page 151—none of which have been discarded to obtain the truncated sample. This has also been the case in our application to real datasets.
Finally, we remark that some of the key advantages of our method over Huber’s consist in the fact that—since there exist divergences smaller than the Kullback–Leibler divergence—our method requires a considerably shorter computation time and also in the superior robustness of our method.
6. Conclusions
Projection Pursuit is useful in evidencing characteristic structures as well as one-dimensional projections and their associated distributions in multivariate data. Huber [2] shows us how to achieve it through maximization of the Kullback–Leibler divergence.
The present article shows that our ϕ-divergence method constitutes a good alternative to Huber’s particularly in terms of regression and robustness as well as in terms of copula’s study. Indeed, the convergence results and simulations we carried out, convincingly fulfilled our expectations regarding our methodology.
References
- Friedman, J.H.; Stuetzle, W.; Schroeder, A. Projection pursuit density estimation. J. Amer. Statist. Assoc. 1984, 79, 599–608. [Google Scholar] [CrossRef]
- Huber, P.J. Projection pursuit. Ann. Statist. 1985, 13, 435–525, With discussion. [Google Scholar] [CrossRef]
- Zhu, M. On the forward and backward algorithms of projection pursuit. Ann. Statist. 2004, 32, 233–244. [Google Scholar] [CrossRef]
- Yohai, V.J. Optimal robust estimates using the Kullback-Leibler divergence. Stat. Probab. Lett. 2008, 78, 1811–1816. [Google Scholar] [CrossRef]
- Toma, A. Optimal robust M-estimators using divergences. Stat. Probab. Lett. 2009, 79, 1–5. [Google Scholar] [CrossRef]
- Huber, P.J. Robust Statistics; Wiley: Hoboken, NJ, USA, 1981; republished in paperback, 2004. [Google Scholar]
- Diaconis, P.; Freedman, D. Asymptotics of graphical projection pursuit. Ann. Statist. 1984, 12, 793–815. [Google Scholar] [CrossRef]
- Cambanis, S.; Huang, S.; Simons, G. On the theory of elliptically contoured distributions. J. Multivariate Anal. 1981, 11, 368–385. [Google Scholar] [CrossRef]
- Landsman, Z.M.; Valdez, E.A. Tail conditional expectations for elliptical distributions. N. Am. Actuar. J. 2003, 7, 55–71. [Google Scholar] [CrossRef]
- Van der Vaart, A.W. Asymptotic Statistics. In Cambridge Series in Statistical and Probabilistic Mathematics; Cambridge University Press: Cambridge, MA, USA, 1998; Volume 3. [Google Scholar]
- Broniatowski, M.; Keziou, A. Parametric estimation and tests through divergences and the duality technique. J. Multivariate Anal. 2009, 100, 16–36. [Google Scholar] [CrossRef]
- Vajda, I. χα-divergence and generalized Fisher’s information. In Transactions of the Sixth Prague Conference on Information Theory, Statistical Decision Functions, Random Processes; Czech Technical University in Prague: Prague, Czech, 1971; dedicated to the memory of Antonín Spacek; Academia: Prague, Czech; pp. 873–886. [Google Scholar]
- Black, F.; Scholes, M.S. The pricing of options and corporate liabilities. J. Polit. Econ. 1973, 3, 637–654. [Google Scholar] [CrossRef]
- Saporta, G. Probabilités, Analyse des données et Statistique; Technip: Paris, France, 2006. [Google Scholar]
- Scott, D.W. Multivariate Density Estimation. Theory, Practice, and Visualization; John Wiley and Sons: New York, NY, USA, 1992. [Google Scholar]
- Cressie, N.; Read, T.R.C. Multinomial goodness-of-fit tests. J. Roy. Statist. Soc. 1984, Ser. B 46, 440–464. [Google Scholar]
- Csiszár, I. On topology properties of f-divergences. Studia Sci. Math. Hungar. 1967, 2, 329–339. [Google Scholar]
- Liese, F.; Vajda, I. Convex Statistical Distances. In Teubner-Texte zur Mathematik [Teubner Texts in Mathematics]; B.G. Teubner Verlagsgesellschaft: Leipzig, Germany, 1987; Volume 95. [Google Scholar]
- Pardo, L. Statistical inference based on divergence measures. In Statistics: Textbooks and Monographs; Chapman & Hall/CRC: Boca Raton, FL, USA, 2006; Volume 185. [Google Scholar]
- Zografos, K.; Ferentinos, K.; Papaioannou, T. ϕ-divergence statistics: sampling properties and multinomial goodness of fit and divergence tests. Comm. Statist. Theory Methods 1990, 19, 1785–1802. [Google Scholar] [CrossRef]
- Azé, D. Eléments d’analyse convexe et variationnelle; Ellipse: Minneapolis, MN, USA, 1997. [Google Scholar]
- Touboul, J. Projection pursuit through φ-divergence minimisation. arXiv:0912.2883, 2009. [Google Scholar]
- Bosq, D.; Lecoutre, J.-P. Livre—Theorie De L’Estimation Fonctionnelle; Economica: Hoboken, NJ, USA, 1999. [Google Scholar]
Appendix
A. Reminders
A.1. φ-Divergence
Let us call the density of if h is the density of Z. Let ϕ be a strictly convex function defined by and such that .
Definition A.1. We define the divergence of P from Q, where P and Q are two probability distributions over a space Ω such that Q is absolutely continuous with respect to P, by
The above expression (A.1) is also valid if P and Q are both dominated by the same probability.
The most used distances (Kullback, Hellinger or ) belong to the Cressie–Read family (see Cressie [16], Csiszár [17] and the books of Liese [18], Pardo [19] and Zografos [20]). They are defined by a specific ϕ. Indeed,
- -
- with the Kullback–Leibler divergence, we associate
- -
- with the Hellinger distance, we associate
- -
- with the distance, we associate
- -
- more generally, with power divergences, we associate , where
- -
- and, finally, with the norm, which is also a divergence, we associate
Property A.1. We have
Property A.2. The divergence function is convex, lower semi-continuous (l.s.c.)—for the topology that makes all the applications of the form continuous where f is bounded and continuous—as well as l.s.c. for the topology of the uniform convergence.
Property A.3. (corollary (1.29), page 19 of Liese [18]). If is measurable and if then with equality being reached when T is surjective for .
Theorem A.1. (theorem III.4 of Azé [21]). Let be a convex function. Then f is a Lipschitz function in all compact intervals In particular, f is continuous on .
A.2. Miscellaneous
In the present section, all demonstrations can be found in Touboul [22].
Lemma A.1. The set is closed in for the topology of the uniform convergence.
Lemma A.2. For all , we have where .
Lemma A.3. G is closed in for the topology of the uniform convergence.
Lemma A.4. Let consider the sequence defined in (2.3) page 1587.
We then have a.s.
In the case where f is known and keeping the notations introduced in Section 3.1, we have
Proposition A.1. Assuming to hold. Both and tends to a.s.
Theorem A.2. Assuming to hold, for any and any , we have and as well as
Theorem A.3. Assuming that to , and hold. Then, , where k represents the step of the algorithm and with I being the identity matrix in .
B. Study of the sample
Let , ,.., be a sequence of independent random vectors with same density f. Let , ,.., be a sequence of independent random vectors with same density g. Then, the kernel estimators , , and of f, g, and , for all , almost surely and uniformly converge since we assume that the bandwidth of these estimators meets the following conditions (see Bosq [23])—with :
Let us consider
Our goal is to estimate the minimum of . To do this, it is necessary for us to truncate our samples:
Let us consider now a positive sequence such that where is the almost sure convergence rate of the kernel density estimator—, see Lemma D.7— where is defined by , for all b in and all x in , and finally where is defined by , for all b in and all x in .
We will generate , and from the starting sample and we will select the and vectors such that and , for all i and for all .
The vectors meeting these conditions will be called and .
Consequently, the next proposition provides us with the condition required for us to derive our estimations.
Proposition B.1. Using the notations introduced in Broniatowski [11] and in Section 3.1, it holds
B.1. With the Kullback–Leibler divergence, we can take for the expression , with .
C. Hypotheses’ discussion
C.1. Discussion of .
Let us work with the Kullback–Leibler divergence and with g and .
For all , we have since, for any b in , the function is a density. The complement of in is ∅ and then the supremum looked for in is . We can therefore conclude. It is interesting to note that we obtain the same verification with f, and .
C.2. Discussion of .
This hypothesis consists in the following assumptions:
- We work with the Kullback–Leibler divergence, (0)
- We have , i.e., —we could also derive the same proof with f, and —(1)
Thus, our hypothesis enables us to derive since implies , i.e., . We can therefore conclude.
Preliminary : Shows that through a reductio ad absurdum, i.e., if we assume .
Thus, our hypothesis enables us to derive
We can therefore conclude as above.
Let us now verify :
We have Moreover, the logarithm is negative on and is positive on .
Thus, the preliminary studies and show that and always present a negative product. We can therefore conclude, since is not null for all c and for all a—with .
D. Proofs
Preliminary remark :
Let us note that if , a simple reductio ad absurdum enables us to to infer that . Therefore, through an induction, we immediately obtain that, for any k, . Thus, for any k and from a certain rank n, we derive that .
Proof of Lemma D.1.
Lemma D.1. We have .
Putting , let us determine f in basis A. Let us first study the function defined by , We can immediately say that ψ is continuous and since A is a basis, its bijectivity is obvious. Moreover, let us study its Jacobian.
By definition, it is since A is a basis. We can therefore infer : i.e., Ψ (resp. y) is the expression of f (resp of x) in basis A, namely , with and being the expressions of n and h in basis A. Consequently, our results in the case where the family is the canonical basis of , still hold for Ψ in basis A—see Section 2.1. And then, if is the expression of g in basis A, we have , i.e., .
Proof of Lemma D.2.
Lemma D.2. Should there exist a family such that with , with f, n and h being densities, then this family is an orthogonal basis of .
Using a reductio ad absurdum, we have . We can therefore conclude.
Lemma D.3. is reached when the ϕ-divergence is greater than the distance as well as the distance.
Indeed, let G be and be for all c>0. From Lemmas A.1, A.2 and A.3 (see page 1605), we get is a compact for the topology of the uniform convergence, if is not empty. Hence, and since property A.2 (see page 1605) implies that is lower semi-continuous in for the topology of the uniform convergence, then the infimum is reached in . (Taking for example Ω is necessarily not empty because we always have ). Moreover, when the divergence is greater than the distance, the very definition of the space enables us to provide the same proof as for the distance.
Proof of Lemma D.4.
Lemma D.4. For any , we have —see Huber’s analytic method -, —see Huber’s synthetic method - and —see our algorithm.
As it is equivalent to prove either our algorithm or Huber’s, we will only develop here the proof for our algorithm. Assuming, without any loss of generality, that the , , are the vectors of the canonical basis, since we derive immediately that . We note that it is sufficient to operate a change in basis on the to obtain the general case.
Proof of Lemma D.5.
Lemma D.5. If there exits p, , such that , then the family of —derived from the construction of —is free and orthogonal.
Without any loss of generality, let us assume that and that the are the vectors of the canonical basis. Using a reductio ad absurdum with the hypotheses and , where , we get and . Hence It consequently implies that since . Therefore, , i.e., which leads to a contradiction. Hence, the family is free. Moreover, using a reductio ad absurdum we get the orthogonality. Indeed, we have . The use of the same argument as in the proof of Lemma D.2, enables us to infer the orthogonality of .
Proof of Lemma D.6.
Lemma D.6. If there exits p, , such that , where is built from the free and orthogonal family ,...,, then, there exists a free and orthogonal family of vectors of , such that and such that .
Through the incomplete basis theorem and similarly as in Lemma D.5, we obtain the result thanks to the Fubini’s theorem.
Proof of Lemma D.7.
Lemma D.7. For any continuous density f, we have .
Defining as , we have . Moreover, from page 150 of Scott [15], we derive that where . Then, we obtain . Finally, since the central limit theorem rate is , we infer that .
Proof of Proposition 3.1.
Without loss of generality, we reason with in lieu of .
Let us define . We remark that g and present the same density conditionally to . Indeed, .
We can therefore prove this proposition.
First, since f and g are known, then, for any given function , the application T, which is defined by
Second, the above remark implies that
Consequently, property A.3 page 1605 infers:
, by the very definition of T.
, which completes the proof of this proposition.
Proof of Proposition 3.3. Proposition 3.3 comes immediately from Proposition B.1 page 1606 and Lemma A.1 page 1605.
Proof of Theorem 3.1. First, by the very definition of the kernel estimator converges towards g. Moreover, the continuity of and and Proposition 3.3 imply that converges towards . Finally, since, for any k, , we conclude by an immediate induction.
Proof of Theorem 3.2. First, from Lemma D.7, we derive that, for any x, . Then, let us consider , we have i.e., since and . We can therefore conclude similarly as in the proof of Theorem A.2.
Proof of Theorem D.1.
Theorem D.1. In the case where f is known and under the hypotheses assumed in Section 3.1, it holds and where , and
First of all, let us remark that hypotheses to imply that and converge towards in probability. Hypothesis enables us to derive under the integrable sign after calculation, , and consequently which implies,
The very definition of the estimators and , implies that i.e. i.e.
Under and , and using a Taylor development of the (resp. ) equation, we infer there exists (resp. ) on the interval such that (resp. ) with . Thus we get Moreover, the central limit theorem implies: , , since , which leads us to the result.
Proof of Theorem 3.3. We derive this theorem through Proposition B.1 and Theorem D.1.
Proof of Theorem 3.4. We recall that is the kernel estimator of . Since the Kullback–Leibler divergence is greater than the -distance, we then have
Moreover, the Fatou’s lemma implies that
and Through Lemma A.4, we then obtain that , i.e., that . Moreover, for any given k and any given n, the function is a convex combination of multivariate Gaussian distributions. As derived at Remark 2.1 of page 1585, for all k, the determinant of the covariance of the random vector—with density —is greater than or equal to the product of a positive constant times the determinant of the covariance of the random vector with density f. The form of the kernel estimate therefore implies that there exists an integrable function φ such that, for any given k and any given n, we have .
Finally, the dominated convergence theorem enables us to say that , since converges towards f and since .
Proof of Corollary 3.1. Through the dominated convergence theorem and through Theorem 3.4, we get the result using a reductio ad absurdum.
Proof of Theorem 3.5. Through Proposition B.1 and Theorem A.3, we derive theorem 3.5.
© 2010 by the author; licensee MDPI, Basel, Switzerland. This article is an open access article distributed under the terms and conditions of the Creative Commons Attribution license http://creativecommons.org/licenses/by/3.0/.
Share and Cite
MDPI and ACS Style
Touboul, J. Projection Pursuit Through ϕ-Divergence Minimisation. Entropy 2010, 12, 1581-1611. https://doi.org/10.3390/e12061581
AMA Style
Touboul J. Projection Pursuit Through ϕ-Divergence Minimisation. Entropy. 2010; 12(6):1581-1611. https://doi.org/10.3390/e12061581
Chicago/Turabian StyleTouboul, Jacques. 2010. "Projection Pursuit Through ϕ-Divergence Minimisation" Entropy 12, no. 6: 1581-1611. https://doi.org/10.3390/e12061581