Article

Measurement Back-Action in Quantum Point-Contact Charge Sensing

by
Bruno Küng
1,*,
Simon Gustavsson
1,2,
Theodore Choi
1,
Ivan Shorubalko
1,3,
Oliver Pfäffli
1,
Fabian Hassler
4,5,
Gianni Blatter
4,
Matthias Reinwald
6,
Werner Wegscheider
1,6,
Silke Schön
7,
Thomas Ihn
1 and
Klaus Ensslin
1
1
Solid State Physics Laboratory, ETH Zurich, Schafmattstr. 16, 8093 Zurich, Switzerland
2
Massachusetts Institute of Technology, 77 Massachusetts Avenue, Cambridge, MA 02139, USA
3
EMPA, 8600 Dübendorf, Switzerland
4
Theoretische Physik, ETH Zurich, Wolfgang-Pauli-Str. 27, 8093 Zurich, Switzerland
5
Instituut-Lorentz, Universiteit Leiden, P.O. Box 9506, 2300 RA Leiden, The Netherlands
6
Institut für Experimentelle und Angewandte Physik, Universität Regensburg, 93040 Regensburg, Germany
7
FIRST Laboratory, ETH Zurich, Wolfgang-Pauli-Str. 10, 8093 Zurich, Switzerland
*
Author to whom correspondence should be addressed.
Entropy 2010, 12(7), 1721-1732; https://doi.org/10.3390/e12071721
Submission received: 10 May 2010 / Revised: 21 June 2010 / Accepted: 25 June 2010 / Published: 29 June 2010
(This article belongs to the Collection Quantum Information)

Abstract

:
Charge sensing with quantum point-contacts (QPCs) is a technique widely used in semiconductor quantum-dot research. Understanding the physics of this measurement process, as well as finding ways of suppressing unwanted measurement back-action, are therefore both desirable. In this article, we present experimental studies targeting these two goals. Firstly, we measure the effect of a QPC on electron tunneling between two InAs quantum dots, and show that a model based on the QPC’s shot-noise can account for it. Secondly, we discuss the possibility of lowering the measurement current (and thus the back-action) used for charge sensing by correlating the signals of two independent measurement channels. The performance of this method is tested in a typical experimental setup.

1. Introduction

Semiconductor quantum dots (QDs) are islands of a semiconducting material small enough to confine electrons in a region comparable to their Fermi wavelength. They represent electronic quantum systems just like natural atoms, but are much more easily incorporated in macroscopic electric circuits. By today’s nanofabrication tools and material design, it is possible to control and tune their properties according to the experimental needs. Among others, these are reasons why QDs (“artificial atoms”) are subject of experimental research for already about two decades [1].
It has been proposed [2], and later experimentally demonstrated in double quantum-dot (DQD) systems [3,4], that electronic spin states in QDs possess long enough coherence times to make them attractive objects for the realization of quantum bits (qubits). The read-out of those quantum bits is, however, based not on a direct spin measurement. Instead, the spin is translated to the charge degree of freedom in a spin-selective tunneling process based on the Pauli exclusion principle. The subsequent measurement of the charge state can be achieved by measuring current passed through the DQD via source and drain leads [5]. In a qubit read-out scheme [4], this method has the drawback that each operation cycle delivers a read-out signal that only consists of one or a few electrons, which is too little to be measured in a single shot, and averaging over many cycles is required. Alternatively, one can place a quantum point-contact (QPC), a narrow, ballistic constriction, close to the QD: since the conductance of such a device is very sensitive to changes in the electrostatic potential, different charge occupation states of the QD can be distinguished by a measurement of the current through the QPC [6]. Both single-shot readout of the spin in a single dot [7] and of the singlet/triplet states in a DQD qubit [8] have been realized based on this experimental technique.
In discussing such a measurement on a system as delicate as a single electron on a QD, the question of measurement back-action naturally arises, which is the subject of this paper. It has been shown previously [9,10] that a QPC, if biased with large enough current, can drive inelastic tunneling events in the QD that would be forbidden in the absence of the QPC. Our focus lies on such inelastic mechanisms of back-action (in contrast to pure quantum mechanical dephasing as, e.g., studied in [11]). Considering the importance of QPC charge detection in quantum-dot research and particularly in the field of spin qubits, we believe that it is not only desirable to deepen the understanding of back-action effects, but also to present ways of minimizing these unwanted effects. Here, we present on the one hand experimental results obtained in a coupled system of a QPC and a double quantum dot showing the connection between QPC back-action and QPC shot-noise. On the other hand, we demonstrate an experimental technique based on cross-correlation of two QPC sensor signals, allowing to operate the sensors at a lower current level, and thus to suppress back-action.
Our paper is organized as follows. In Section 2, we introduce the QPC and the concept of charge detection. General back-action in charge detection, and photon-mediated back-action in a InAs double quantum-dot sample are discussed in Section 3. Lastly in the Section 4, we describe charge detection with cross-correlation techniques applied to a GaAs sample.

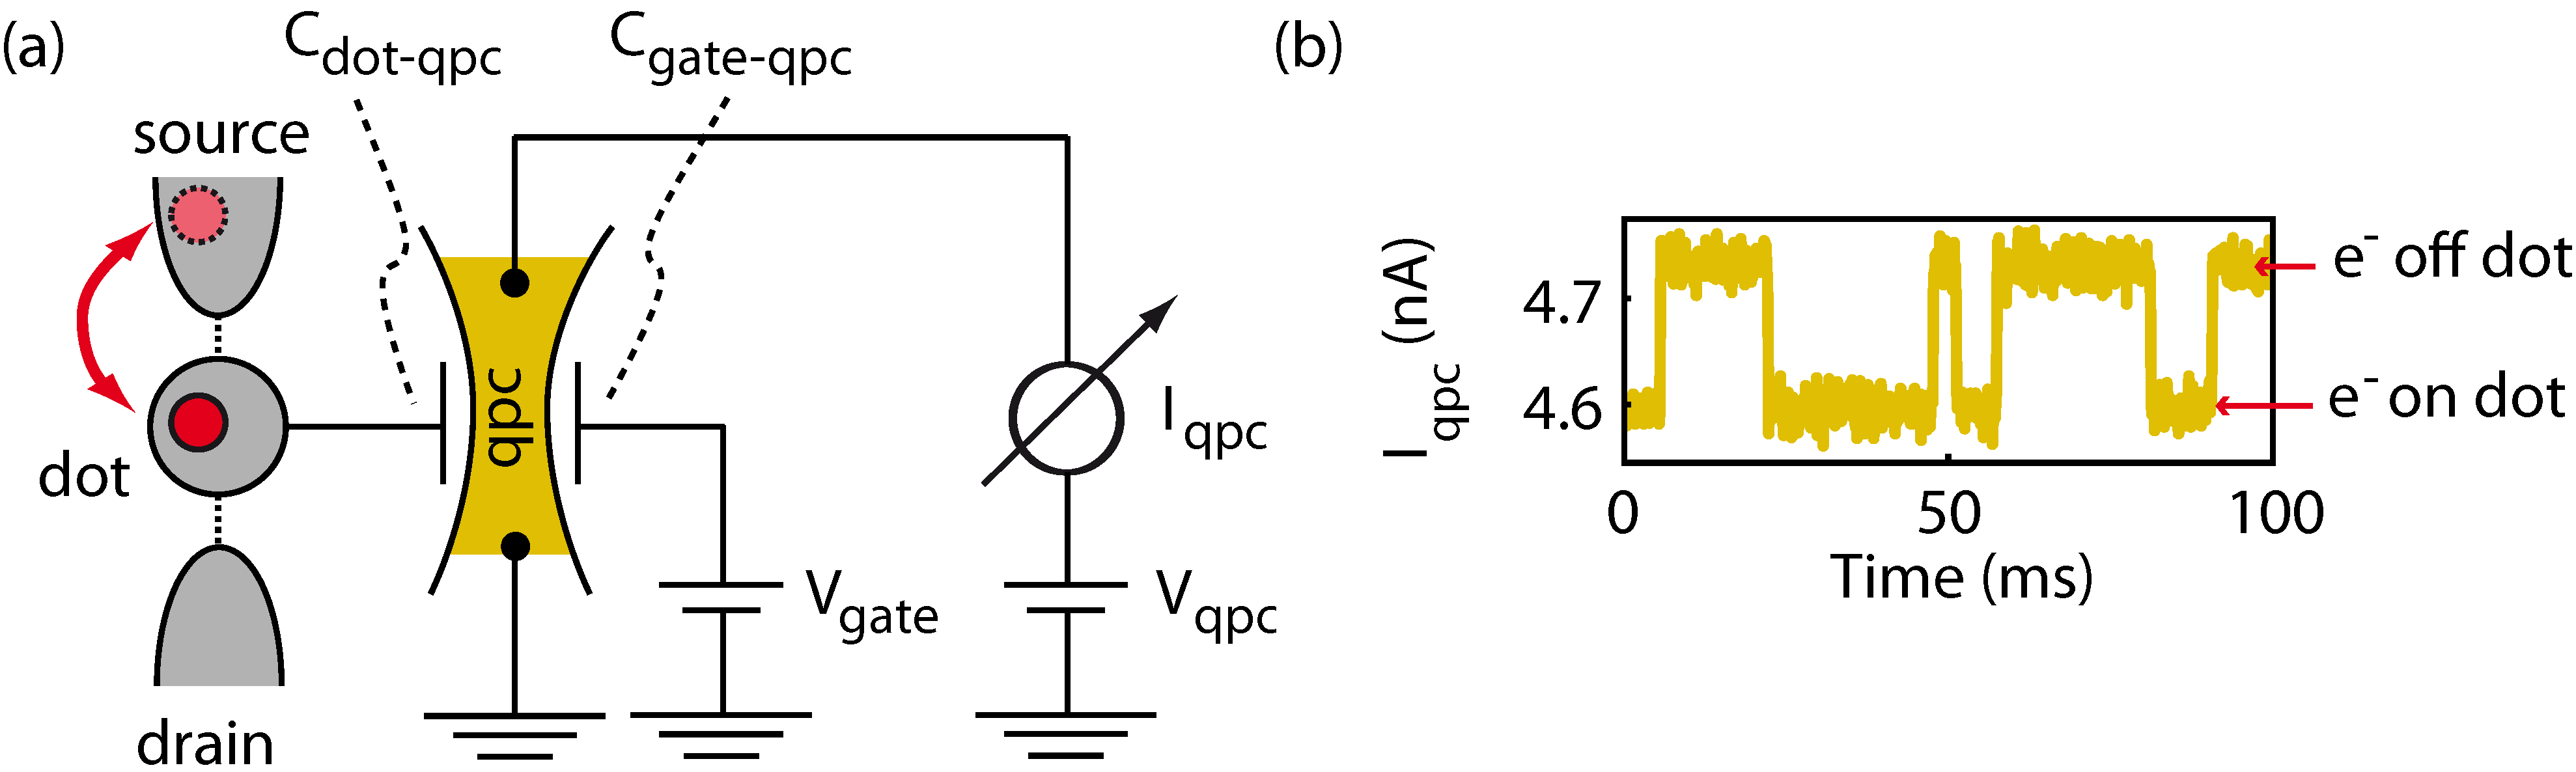
2. Charge Detection with a Quantum Point Contact

A QPC is a narrow channel in which electrons move ballistically, and in which their transverse motion is quantized into modes with a typical energy spacing larger than the thermal energy k B T [12]. Each of the modes connects the source and drain reservoirs with a transmission coefficient D between 0 and 1 and contributes a value of D × 2 e 2 / h to the QPC conductance G qpc according to the Landauer formula. The transmission can be tuned by changing the width of the channel, e.g., using a gate voltage V gate (cf. Figure 1(a)). In particular when only one mode transmits partly (at around G qpc 0.5 × 2 e 2 / h ), the QPC conductance is very sensitive to V gate and, equivalently, to rearrangements of electric charges in its vicinity. An electron hopping on and off a nearby QD is then enough to lead to a measurable change in G qpc .
Figure 1(b) shows a typical measurement of QPC current vs. time, with an electron tunneling randomly back and forth between a QD and a lead. Additional electrons are not allowed to tunnel onto the dot due to Coulomb repulsion. Time-resolved measurements of such kind [13,14] have, e.g., been used to investigate the statistics of single-electron transport through a quantum dot [15]. In case one is only interested in the mean occupation of the dot, a time-averaged measurement of the QPC current is sufficient and will yield a value between the two levels of the time trace.
Figure 1. (a) Generic measurement setup used in a charge detection measurement. A quantum dot is connected to source and drain electrodes via tunneling barriers. A QPC, placed nearby, serves as a single tunneling barrier in a separate electric circuit. Its transmission D can be tuned continuously from 0 to 1 using a gate voltage capacitively coupled to the QPC. Electrons tunneling on and off the QD have an effect completely analogous to that of the gate voltage because of the capacitive coupling between QPC and QD. This is used to determine the QD charge state using the QPC current. (b) Typical experimental time-dependence of a QPC current. Whenever an electron tunnels onto the dot, the QPC current drops and vice versa.
Entropy 12 01721 g001

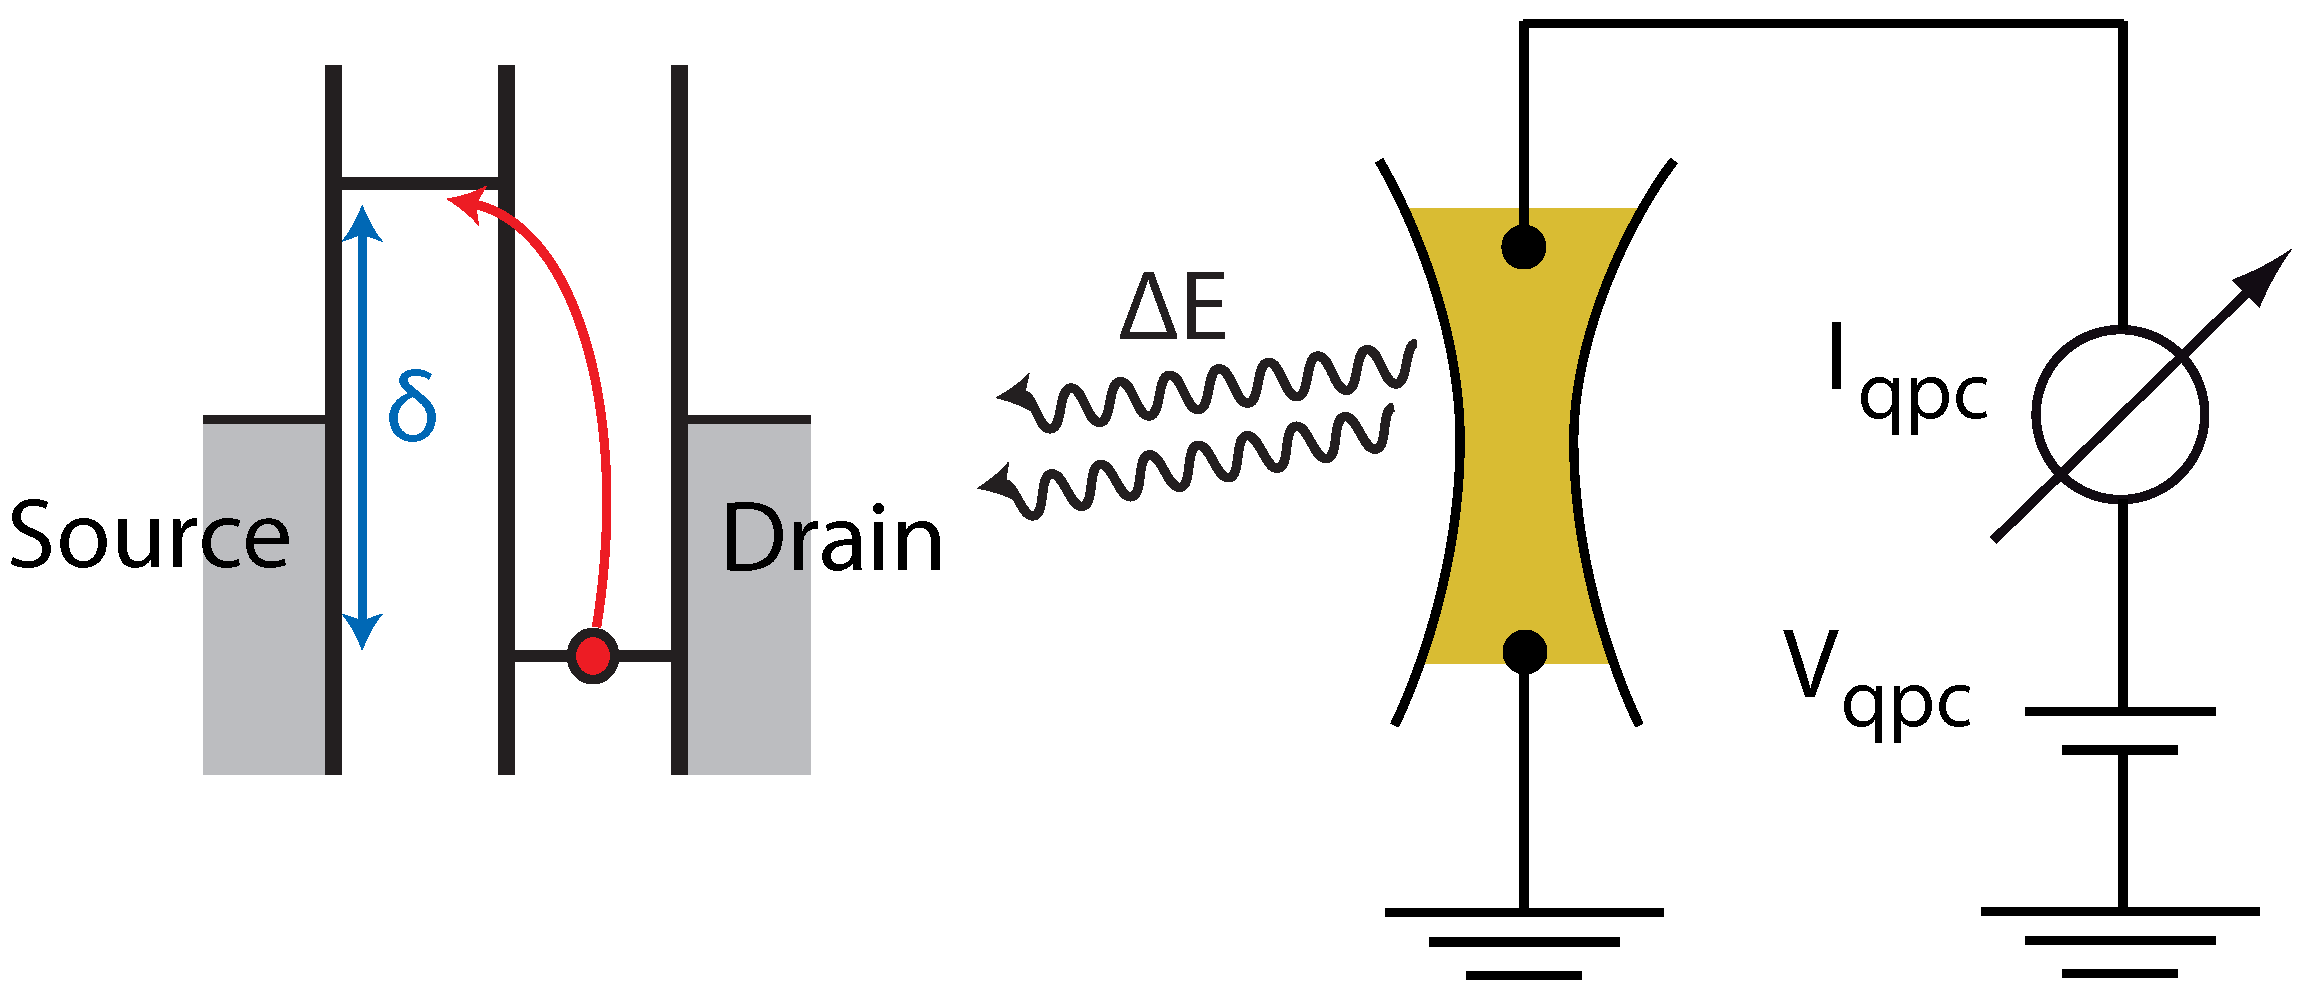
3. Photonic Back-Action in an InAs Double Dot

3.1. Back-action in quantum-dot systems

Inelastic QPC back-action has been studied in single [9,16], double [10,17,18,19,20], and even triple quantum dots [21]. The conceptual picture is, however, similar in all cases and sketched in Figure 2. The QPC, biased at a finite source-drain voltage V qpc , dissipates energy in quanta Δ E into its environment. Some of the energy can be absorbed by the QD system where it excites an electron from its ground state to a higher-energy state. This can for example be an excited state inside the dot or a state in the leads. In our experiment, we consider a double quantum dot, where the valence-state energy of each dot can be tuned independently with gate voltages. The inelastic transition driven by the QPC is a tunneling process of an electron from one dot to the second dot which is separated in energy by the detuning δ.
Figure 2. Back-action of a QPC on a DQD. The QPC as a non-equilibrium system dissipates energy quanta Δ E which can be absorbed by the DQD and excite an electron from the energetically lower-lying dot to the neighboring dot if Δ E matches the interdot detuning δ. The spectrum of the dissipated energy Δ E depends on the QPC bias voltage V qpc .
Entropy 12 01721 g002

3.2. Sample and measurement description

As for the nature of the transferred energy quanta Δ E , it is nowadays believed that photons [10,16,20] and phonons [17,18,20] contribute the relevant fractions, and depending on the specific measurement regime and sample properties, either of the two mechanisms can dominate. The sample used in this experiment is special in the sense that the DQD and the QPC are hosted in different materials with different phonon dispersion relations. Even if there were small areas of mechanical contact between the two, the large impedance mismatch is expected to prevent phonons from crossing the material boundary. The distance between the two devices is however small (about 80 nm ), and no metals but only dielectrics are located between them; therefore the capacitive (or photonic) coupling between the two is large. Figure 3(a) shows a scanning-electron micrograph of the sample. The horizontal object is an InAs nanowire. It has been thinned down at three positions in an etching process, defining two quantum dots indicated with circles [22]. This device lies on top of a GaAs/AlGaAs heterostructure containing a two-dimensional electron gas (2DEG) 34 nm below the surface. In the same etching process, this 2DEG has been cut along regions appearing bright in the image, which defines two QPCs. The sample is cooled in a 4 He cryostat to a temperature of T = 2 K and the QPC current is measured using a room-temperature amplifier. The signal is then digitized and stored for analysis.
Figure 3. (a) Scanning-electron micrograph of the sample used in the first experiment. An InAs nanowire (horizontal) lies on top of a GaAs/AlGaAs heterostructure containing a 2DEG under the surface. By chemical etching, two coupled dots (red disks) and two QPCs are defined. The left QPC serves both as a counter of the electron tunneling events between the dots, and as an energy source influencing those tunneling events. (b) Interdot tunneling rate measured as a function of DQD detuning δ and QPC source-drain voltage V qpc . The right panel is based on a model treating the QPC as a noise source with a V qpc -dependent spectrum known from QPC shot-noise theory. It takes into account the data measured close to V qpc = 0 mV (i.e., in the “absence” of the QPC) in order to calculate the data expected at finite V qpc .
Entropy 12 01721 g003
Only the left QPC is operated in this experiment. It serves both as a source of energy for the back action and as a measurement device for the interdot tunneling rate Γ interdot . The latter is determined by first searching for two distinct current levels in I qpc ( t ) -traces with an algorithm, and then counting the transitions between the levels over a long enough integration time. Figure 3(b) shows a measurement (left panel) of Γ interdot as a function of the DQD detuning δ and QPC voltage V qpc in a logarithmic colorscale. At very low V qpc , the QPC signal is too small to be used for counting. The corresponding data points, contained in a region appearing as a black horizontal stripe in the measurement, were consequently removed from the set.
At the smallest possible V qpc voltage still allowing for a measurement of Γ interdot , the DQD is close to equilibrium. The rate is then maximum at δ = 0 meV , where thermally driven tunneling between the dots occurs. To the left and right side of the plot, the electron is trapped in either dot and Γ interdot tends to zero. Upon increasing the QPC voltage, the peak in Γ interdot broadens, since now the QPC as a source for non-equilibrium energy can drive transitions for detuning energies exceeding k B T . The amount of the broadening is roughly on the scale of the applied voltage e V qpc . As a second consequence we observe a reduction of the rate close to δ = 0 meV : for aligned dot energy levels, tunneling slows down when the QPC voltage is increased.

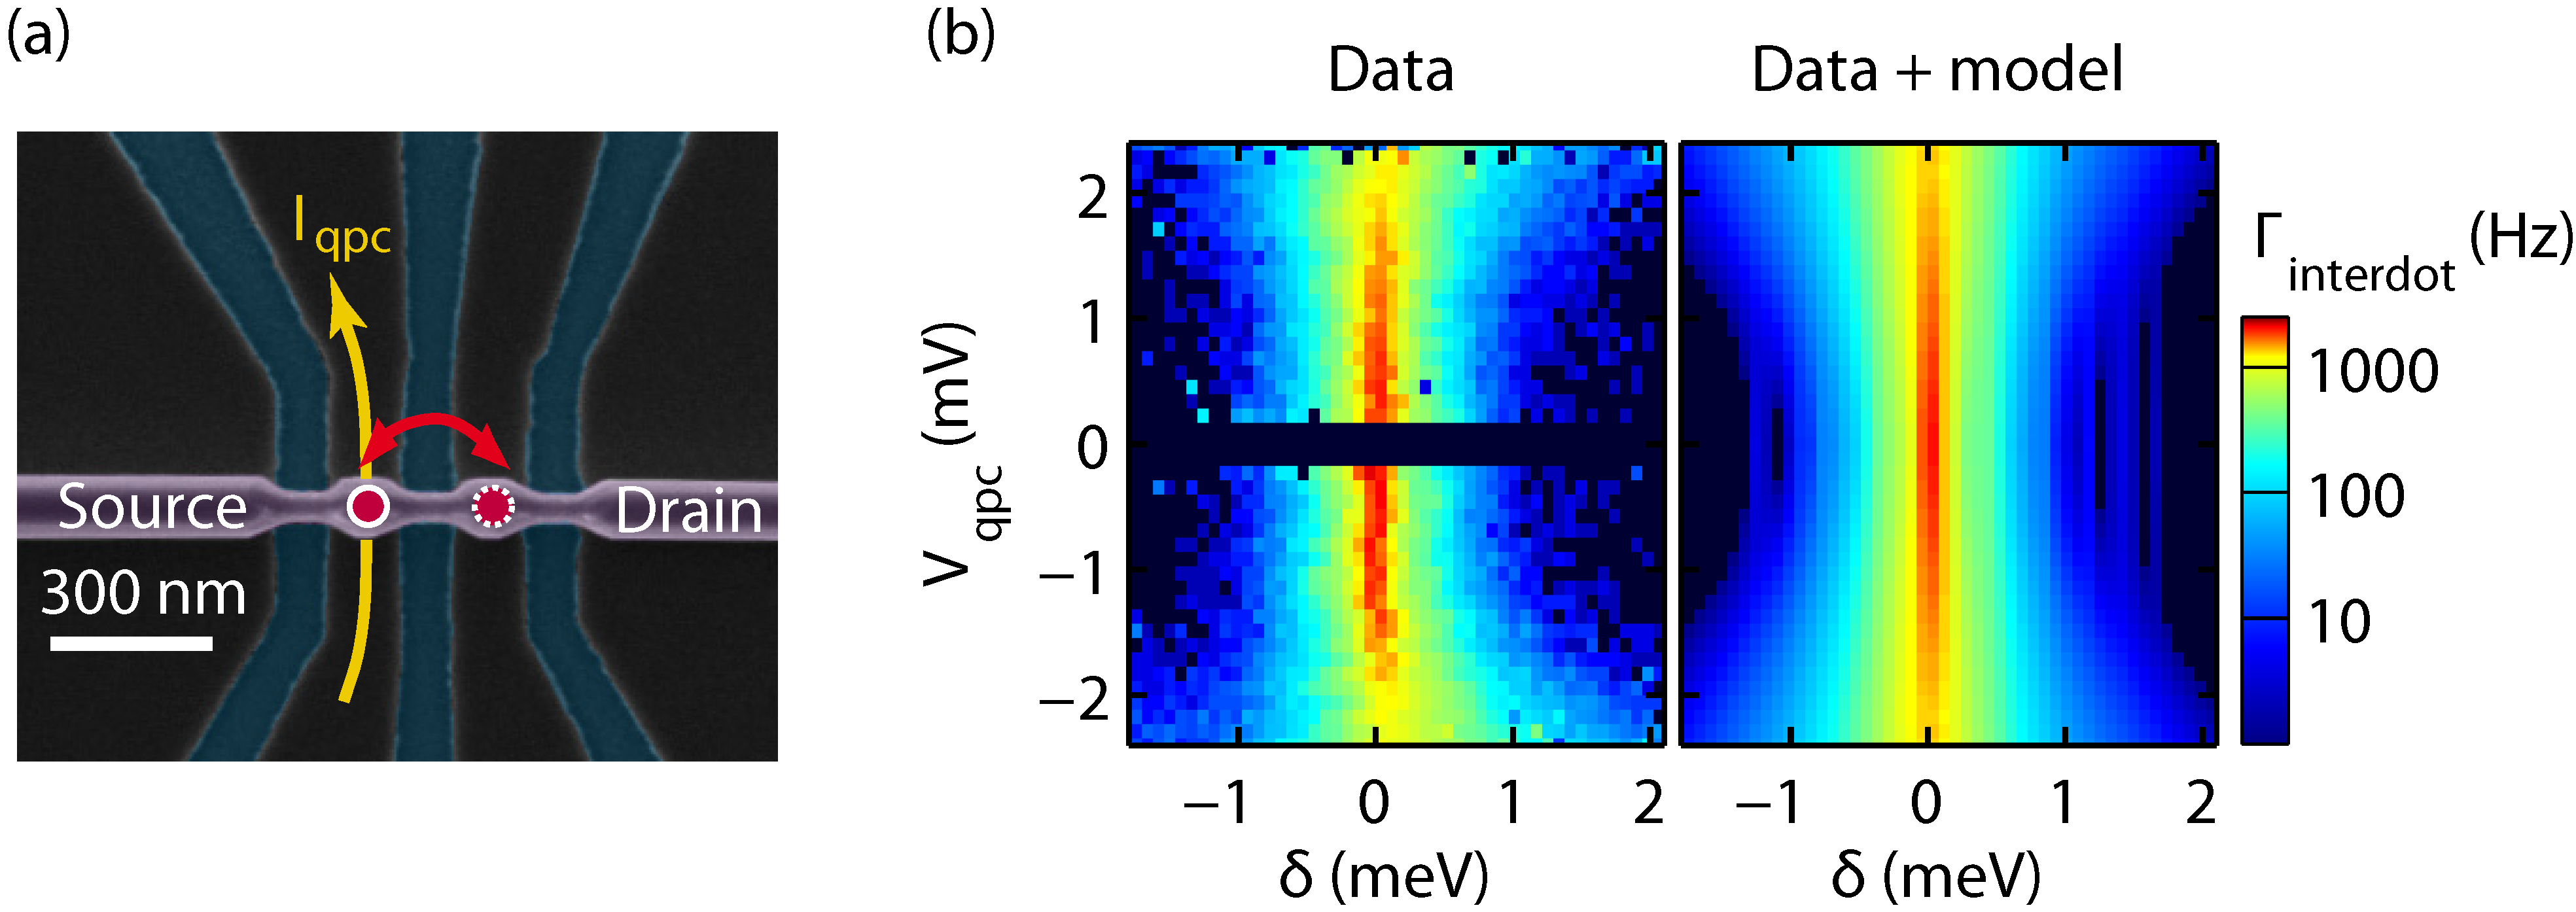
3.3. Model based on QPC shot-noise

We can understand this behavior by modeling the QPC as a source of electrical, high-frequency noise coupling to the DQD detuning δ. Consider a DQD capacitively coupled to an alternating voltage source shaking the DQD detuning according to e V ^ ( t ) . The tunneling rate between the two dots will generally be influenced by the voltage, an effect which is termed photon-assisted tunneling (PAT) [23] and has been studied e.g., in Reference [24], where the voltage is a discrete-frequency microwave signal applied to one of the gates of the sample.
In this case, as well as in our experiment, the energy transfer from the source (the microwave in the coaxial cable, or the QPC, respectively) and the detector (DQD) takes place in the near field, i.e., the distance between the two is small compared to the radiation wavelength. No free propagation of photons occurs, and it is therefore possible to describe the process of photon-assisted tunneling in terms of a capacitive (in essence electrostatic) coupling. Nevertheless, the term “photon” is commonly used in this context and hints to the fact that the scale of the transferred energy is linked to the frequency, not the amplitude V ^ , of the voltage. Namely, if the characteristic frequency of the voltage is much larger than the interdot tunneling rate, we can express the probability to absorb an energy quantum E from the field V ^ ( t ) during the tunneling process as [25],
P ( E ) = 1 2 π d t exp J ( t ) + i E t /
Here, the voltage fluctuations are described in terms of the autocorrelation function J ( t ) = [ ϕ ^ ( t ) ϕ ^ ( 0 ) ] ϕ ^ ( 0 ) of the phase operators ϕ ^ ( t ) = 0 t d t e V ^ ( t ) / . From the leading-order expansion in V ^ [26], it follows that P ( E ) is related to the spectral density S V ( ω ) of the voltage fluctuations V ^ ,
P ( E ) = 1 e 2 2 d ω S V ( ω ) ω 2 δ ( E ) + e 2 S V ( E / ) E 2
The probability P can be interpreted as an effective (tunneling) density of the dot states, which, in the absence of the perturbation S V , is a peaked at zero energy and zero otherwise, allowing only for elastic tunneling processes. At nonzero S V , also the probability to absorb energy E > 0 from the voltage field becomes nonzero. In addition, the weight of the δ-peak at zero energy is reduced, as the total weight of the dot states is conserved. Note that the spectrum S V ( ω ) appearing in Equation 2 is a non-symmetrized one [27]. The values of S V at negative ω lead to stimulated and spontaneous emission of energy into the voltage field.
In our experiment, the role of the voltage source is played by the QPC. Namely, a QPC biased at finite source-drain voltage generates current shot-noise, or excess noise. Its spectrum S I ex ( ω ; V qpc ) [28,29] has a characteristic cut-off frequency of e V qpc / , since the photons that are emitted by the QPC in the form of noise have an energy bounded by the bias voltage | e V qpc | . In Reference [26], a mechanism based on a circuit model is proposed, coupling the current fluctuations in the QPC to voltage fluctuations in δ via a trans-impedance, S V ( ω ; V qpc ) = | Z tr | 2 S I ex ( ω ; V qpc ) . Using these three ingredients, that is PAT theory, QPC shot-noise theory, and the QPC-DQD coupling mechanism, we can understand the features of the data in Figure 3(b) discussed above.
In the right panel of Figure 3(b), we present a quantitative comparison of our data with theory showing good agreement. A coupling impedance of Z tr = 5.4 k Ω was determined as a fitting parameter. In the calculation, which is detailed in Reference [19], it is also taken into account that there are environmental (equilibrium) fluctuations other than the QPC excess noise, such as phonons in the InAs nanowire. These lead to the thermal broadening of the Γ interdot peak. Although not fully under experimental control, the measurement of Γ interdot close to zero QPC bias serves as an indirect measurement of the equilibrium fluctuations, and these data enter the calculation shown in Figure 3(b). The vertical stripes appearing in the colorplot are an artifact of this mixing of experimental and theoretical data: small statistical fluctuations in the measurement of Γ interdot are incorporated into the fit and remain visible until they are eventually averaged out at | V qpc | 1 mV .

4. Charge Readout with Cross-Correlation Techniques

4.1. Noise limitation of charge readout

As seen in the previous section, the amount of back-action increases with the QPC bias, and in a given experiment, it is therefore recommendable to the bias to zero whenever the readout is not needed (e.g., during coherent evolution of a qubit), and to keep it as low as possible while measuring. However, a small QPC bias usually implies a smaller absolute signal (i.e., a smaller step height Δ I in the I qpc ( t ) -trace), and since the limiting noise of the current amplification is bias-independent, this leads to a smaller signal-to-noise ratio (SNR). For a given bandwidth, signal strength and noise level, a roughly defined minimum bias voltage exists below which measurements become impossible because the two QPC current levels belonging to the different charge states cannot be distinguished any more.
Figure 4. (a) Atomic-force micrograph of the sample used for the cross-correlation experiment. The white ridges are oxidized parts of the surface of a GaAs/AlGaAs heterostructure containing a 2DEG. They form insulating barriers and pattern the 2DEG to form a DQD and two QPCs (yellow arrows). (b) Electron tunneling events between one of the dots and the adjacent lead as indicated in panel (a), measured simultaneously with both QPCs. The comparison of the traces shows perfect correlation of the readout signals.
Entropy 12 01721 g004
In order to push down this lower boundary on the QPC bias, one might consider to increase the capacitive coupling between QPC and DQD in some way to obtain a larger Δ I . The photonic back-action is, however, mediated by the same coupling and will then also increase. The second option is hence to reduce the noise in the measurement. This can, e.g., be achieved by optimizing the signal amplification toward a lower noise level using cryogenic amplifiers [30,31]. A complementary approach is to set up two amplification lines with separate signal paths and in the end analyze the cross-correlation of the two outputs. Noise generated in the two paths should be largely independent of each other and average out in this process.
We demonstrate an implementation of such a measurement exploiting cross-correlation in the QD-QPC system. The setup we use is very similar the one described in Section 3 except for the lower sample temperature of 80 mK achieved in a 3 He/ 4 He dilution cryostat. The DQD sample, which is shown in the atomic-force micrograph in Figure 4(a), features two readout QPCs. Their currents are guided in separate wiring to room temperature where they are measured and digitized.

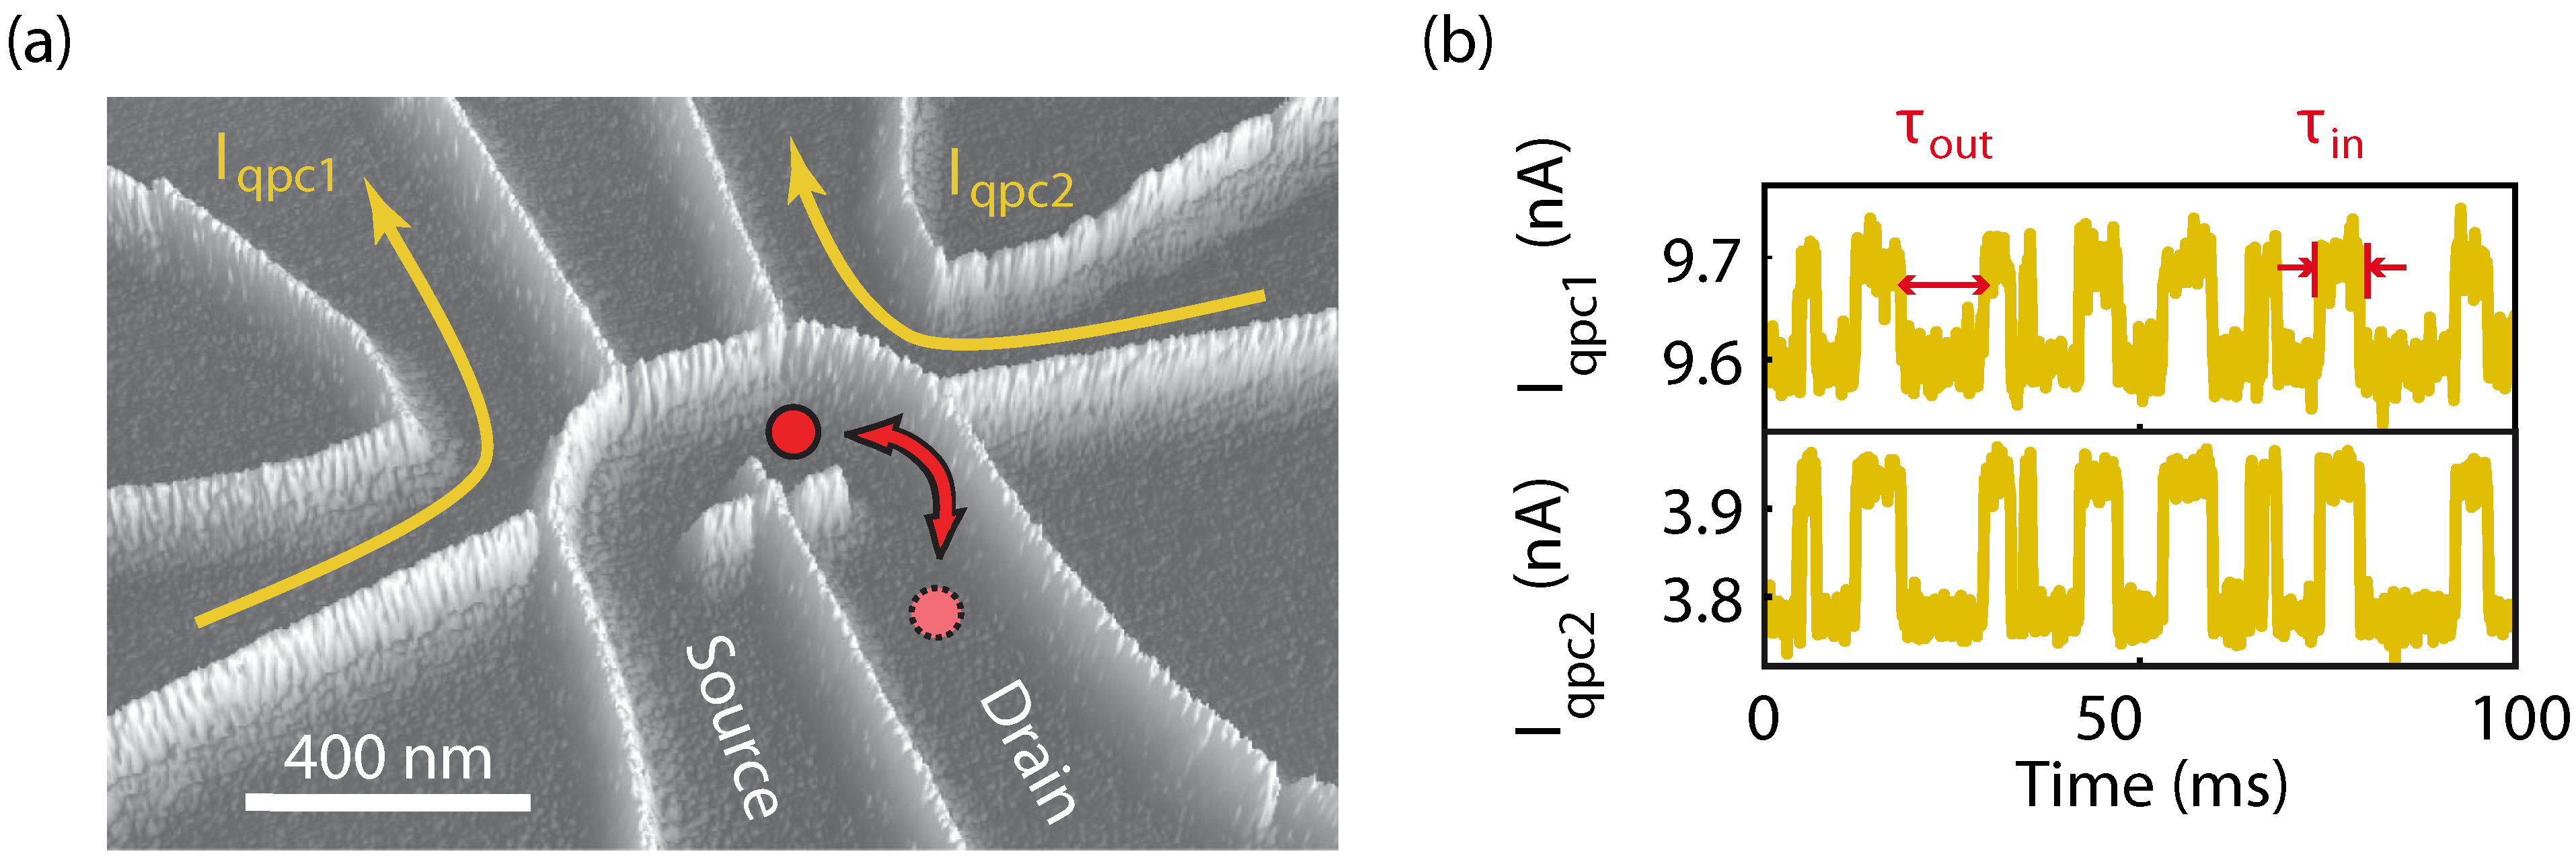
4.2. Cross-correlation analysis

For this experiment we do not intend to study complex double-dot physics. Instead, we want to set up a typical charge read-out measurement situation disregarding the physics behind it. For that, we choose the state where one electron is allowed to tunnel back and forth between one of the dots and the adjacent lead as indicated by an arrow in Figure 4(a). This tunneling process is sensed by both QPCs, and from the time traces in Figure 4(b) recorded simultaneously, it is evident that both QPC currents exhibit identical switching behavior [32]. Since in these traces the SNR is rather good, they can be used to extract the mean tunneling rate into and out of the dot given by Γ in , out = 1 / τ in , out # [15], where the averaging · # has to be performed over many switching events, what we refer to in the following as a “counting” analysis.
The two quantities Γ in and Γ out can be determined by cross-correlation also in the case where the SNR of the two signals is too low to perform a meaningful counting analysis of the above kind. While the detailed procedure is described in Reference [33], we give here a short qualitative overview. We first write each of the QPC currents I 1 ( t ) and I 2 ( t ) as a sum of a random telegraph signal (RTS) α j I ( c ) ( t ) describing the switching caused by the dot, and of a noise contribution I j ( n ) ( t ) ,
I j ( t ) = α j I ( c ) ( t ) + I j ( n ) ( t ) ( j = 1 , 2 )
While the RTS is the same in both currents up to the proportionality factors α j , the noise contributions are assumed to be mutually uncorrelated. Moreover, the noise is uncorrelated with the RTS. In the cross-correlation function of the two currents, C ( τ ) = I 1 ( t ) I 2 ( t + τ ) , the corresponding terms therefore drop out,
C ( τ ) = I 1 ( t ) I 2 ( t + τ ) = [ α 1 I ( c ) ( t ) + I 1 ( n ) ( t ) ] [ α 2 I ( c ) ( t + τ ) + I 2 ( n ) ( t + τ ) ] = α 1 α 2 I ( c ) ( t ) I ( c ) ( t + τ ) + α 1 I ( c ) ( t ) I 2 ( n ) ( t + τ ) + α 2 I 1 ( n ) ( t ) I ( c ) ( t + τ ) + I 1 ( n ) ( t ) I 2 ( n ) ( t + τ ) = α 1 α 2 I ( c ) ( t ) I ( c ) ( t + τ )
(Angle brackets denote averaging over t, and we assume zero average of all introduced current components.) What remains is the autocorrelation function of the RTS which is known to be C ( τ ) = α 1 α 2 I ( c ) 2 e | τ | / τ 0 [34], where the decay time of the exponential is given by τ 0 = 1 / ( Γ in + Γ out ) . By computing the cross-correlation function 4 from the digitally stored time traces and fitting to it a double-sided exponential, we can therefore obtain the sum of the tunneling-in and -out rates, which is the first step of the correlation analysis. In order to obtain the two rates separately, a second step is necessary in which we compute third-order correlators of the form I i ( t ) 2 I j ( t ) in a very similar fashion. These correlators are equally insensitive to the background noise and encode the ratio Γ in / Γ out , i.e., the degree of asymmetry between the occupation of the two RTS states.
In Figure 5, we compare the outcomes of the counting and the correlation analysis algorithm. What we see in this plot is a measurement of the total tunneling rate Γ tot = ( 1 / Γ in + 1 / Γ out ) 1 between the right dot and the drain lead while tuning the energy level of the dot from above to below the potential of the lead with a gate voltage. When the two are aligned, equilibrium tunneling occurs leading to a maximum Γ tot . The vertical axis shows the bias voltages of both QPCs which we vary continuously from 250 μ V , where both QPC signals feature clearly distinct current levels, to 0 μ V , where only the bias-independent noise remains. The left plot shows the result of the counting analysis, the right plot that of the cross-correlation analysis based on the same raw data.
Figure 5. Dot-lead tunneling rate (cf. Figure 4[a]) as a function of QPC bias voltages and one gate voltage tuning the energy level of the dot from above to below the potential of the leads. From the same raw time-trace data, the rate is once determined using a counting algorithm (left colorplot), and once using cross-correlation (right colorplot). The I 2 ( t ) -time traces to the right for three different bias voltages demonstrate the decrease in signal quality for decreasing QPC bias.
Entropy 12 01721 g005
In the high-bias parts of the plots, the two data sets agree as expected. As the QPC bias drops below about 150 μ V , the counting algorithm fails to produce an output, since the SNR is too low and the false-count rate would be too high. The correlation analysis algorithm however remains largely unaffected by the noise down to a bias voltage of about 20 μ V ; i.e., we gain a factor of 7 to 8 in bias voltage. The limiting factor for the correlation analysis is not broadband amplifier noise as it is for the counting analysis. Instead the remaining noise consists predominantly of discrete-frequency components from external sources coupling into both signal paths. These noise components can in principle be reduced by improving the electric shielding of the measurement setup.
Although only applied to the simple tunneling process between a dot and its lead, the correlation analysis in the way described in this section can be applied to measure the rate of any Poissonian tunneling process in single- and multi-dot systems. Just like the counting analysis, it provides a direct measurement of the rate which is an advantage over conventional transport measurements. Interesting prospects of correlation measurements have been proposed e.g., in Refs. [35] and [36]. Unfortunately, the correlation analysis cannot be directly applied to the spin-qubit readout method used, e.g., in [3]; the reason is that in this case, the measured tunneling process is not fully random (Poissonian) but is regularized using a periodic gate pulse scheme.

5. Conclusions

Beyond its importance as an experimental tool for the study of quantum-dot systems, charge sensing with quantum point-contacts is worth studying ion its own right due to the complex back-action mechanisms involved in the measurement. Disregarding phononic mechanisms, back-action in a DQD can be explained by considering the QPC as a source of electrical noise coupling to the DQD. By operating two independent QPC sensors for the measurement, time-averaged cross-correlation of their signals can allow for a reduction of the necessary QPC bias voltages, and thus reduce unwanted back-action effects.

Acknowledgments

We acknowledge financial support by the Swiss National Science Foundation (Schweizerischer Nationalfonds).

References

  1. Kouwenhoven, L.P.; Marcus, C.M.; McEuen, P.M.; Tarucha, S.; Westervelt, R.M.; Wingreen, N.S. Electron transport in quantum dots. In Mesoscopic Electron Transport; Sohn, L.L., Kouwenhoven, L.P., Schön, G., Eds.; NATO ASI Ser. E 345; Kluwer: Dordrecht, the Netherlands, 1997; pp. 105–214. [Google Scholar]
  2. Loss, D.; DiVincenzo, D.P. Quantum computation with quantum dots. Phys. Rev. A 1998, 57, 120. [Google Scholar] [CrossRef]
  3. Petta, J.R.; Johnson, A.C.; Taylor, J.M.; Laird, E.A.; Yacoby, A.; Lukin, M.D.; Marcus, C.M.; Hanson, M.P.; Gossard, A.C. Coherent manipulation of coupled electron spins in semiconductor quantum dots. Science 2005, 309, 2180–2184. [Google Scholar] [CrossRef]
  4. Koppens, F.H.L.; Buizert, C.; Tielrooij, K.J.; Vink, I.T.; Nowack, K.C.; Meunier, T.; Kouwenhoven, L.P.; Vandersypen, L.M.K. Driven coherent oscillations of a single electron spin in a quantum dot. Nature (London) 2006, 442, 766–771. [Google Scholar] [CrossRef]
  5. Ono, K.; Austing, D.G.; Tokura, Y.; Tarucha, S. Current rectification by pauli exclusion in a weakly coupled double quantum dot system. Science 2002, 297, 1313–1317. [Google Scholar] [CrossRef]
  6. Field, M.; Smith, C.G.; Pepper, M.; Ritchie, D.A.; Frost, J.E.F.; Jones, G.A.C.; Hasko, D.G. Measurements of coulomb blockade with a noninvasive voltage probe. Phys. Rev. Lett. 1993, 70, 1311–1314. [Google Scholar] [CrossRef]
  7. Elzerman, J.M.; Hanson, R.; van Beveren, L.H.W.; Witkamp, B.; Vandersypen, L.M.K.; Kouwenhoven, L.P. Single-shot read-out of an individual electron spin in a quantum dot. Nature (London) 2004, 430, 431. [Google Scholar] [CrossRef]
  8. Barthel, C.; Reilly, D.J.; Marcus, C.M.; Hanson, M.P.; Gossard, A.C. Rapid single-shot measurement of a singlet-triplet qubit. Phys. Rev. Lett. 2009, 103, 160503. [Google Scholar] [CrossRef]
  9. Onac, E.; Balestro, F.; Willems van Beveren, L.H.; Hartmann, U.; Nazarov, Y.V.; Kouwenhoven, L.P. Using a quantum dot as a high-frequency shot noise detector. Phys. Rev. Lett. 2006, 96, 176601. [Google Scholar] [CrossRef]
  10. Gustavsson, S.; Studer, M.; Leturcq, R.; Ihn, T.; Ensslin, K.; Driscoll, D.C.; Gossard, A.C. Frequency-selective single-photon detection using a double quantum dot. Phys. Rev. Lett. 2007, 99, 206804. [Google Scholar] [CrossRef]
  11. Buks, E.; Schuster, R.; Heiblum, M.; Mahalu, D.; Umansky, V. Dephasing in electron interference by a ’which-path’ detector. Nature (London) 1998, 391, 871–874. [Google Scholar]
  12. Büttiker, M. Quantized transmission of a saddle-point constriction. Phys. Rev. B 1990, 41, 7906–7909. [Google Scholar] [CrossRef]
  13. Vandersypen, L.M.K.; Elzerman, J.M.; Schouten, R.N.; Willems van Beveren, L.H.; Hanson, R.; Kouwenhoven, L.P. Real-time detection of single-electron tunneling using a quantum point contact. Appl. Phys. Lett. 2004, 85, 4394–4396. [Google Scholar] [CrossRef]
  14. Schleser, R.; Ruh, E.; Ihn, T.; Ensslin, K.; Driscoll, D.C.; Gossard, A.C. Time-resolved detection of individual electrons in a quantum dot. Appl. Phys. Lett. 2004, 85, 2005. [Google Scholar] [CrossRef]
  15. Gustavsson, S.; Leturcq, R.; Simovic, B.; Schleser, R.; Ihn, T.; Studerus, P.; Ensslin, K.; Driscoll, D.C.; Gossard, A.C. Counting statistics of single electron transport in a quantum dot. Phys. Rev. Lett. 2006, 96, 076605. [Google Scholar] [CrossRef]
  16. Gustavsson, S.; Shorubalko, I.; Leturcq, R.; Ihn, T.; Ensslin, K.; Schön, S. Detecting terahertz current fluctuations in a quantum point contact using a nanowire quantum dot. Phys. Rev. B 2008, 78, 035324. [Google Scholar] [CrossRef]
  17. Khrapai, V.S.; Ludwig, S.; Kotthaus, J.P.; Tranitz, H.P.; Wegscheider, W. Double-dot quantum ratchet driven by an independently biased quantum point contact. Phys. Rev. Lett. 2006, 97, 176803. [Google Scholar] [CrossRef]
  18. Gasser, U.; Gustavsson, S.; Küng, B.; Ensslin, K.; Ihn, T.; Driscoll, D.C.; Gossard, A.C. Statistical electron excitation in a double quantum dot induced by two independent quantum point contacts. Phys. Rev. B 2009, 79, 035303. [Google Scholar] [CrossRef]
  19. Küng, B.; Gustavsson, S.; Choi, T.; Shorubalko, I.; Ihn, T.; Schön, S.; Hassler, F.; Blatter, G.; Ensslin, K. Noise-induced spectral shift measured in a double quantum dot. Phys. Rev. B 2009, 80, 115315. [Google Scholar] [CrossRef]
  20. Harbusch, D.; Taubert, D.; Tranitz, H.; Wegscheider, W.; Ludwig, S. Phonon-mediated vs. coulombic back-action in quantum dot circuits. 2009. arXiv:0910.4093v2. arXiv.org e-Print archive http://lanl.arxiv.org/abs/0910.4093v2 (accessed 24 June 2010).
  21. Taubert, D.; Pioro-Ladrière, M.; Schröer, D.; Harbusch, D.; Sachrajda, A.S.; Ludwig, S. Telegraph noise in coupled quantum dot circuits induced by a quantum point contact. Phys. Rev. Lett. 2008, 100, 176805. [Google Scholar] [CrossRef]
  22. Shorubalko, I.; Leturcq, R.; Pfund, A.; Tyndall, D.; Krischek, R.; Schön, S.; Ensslin, K. Self-aligned charge read-out for inAs nanowire quantum dots. Nano Lett. 2008, 8, 382–385. [Google Scholar] [CrossRef]
  23. Platero, G.; Aguado, R. Photon-assisted transport in semiconductor nanostructures. Phys. Rep. 2004, 395, 96–123. [Google Scholar] [CrossRef]
  24. Fujisawa, T.; Tarucha, S. Multiple Photon assisted tunneling between two coupled quantum dots. Jpn. J. Appl. Phys. 1997, 36, 4000–4003. [Google Scholar] [CrossRef]
  25. Devoret, M.H.; Esteve, D.; Grabert, H.; Ingold, G.L.; Pothier, H.; Urbina, C. Effect of the electromagnetic environment on the Coulomb blockade in ultrasmall tunnel junctions. Phys. Rev. Lett. 1990, 64, 1824–1827. [Google Scholar] [CrossRef]
  26. Aguado, R.; Kouwenhoven, L.P. Double quantum dots as detectors of high-frequency quantum noise in mesoscopic conductors. Phys. Rev. Lett. 2000, 84, 1986–1989. [Google Scholar] [CrossRef]
  27. Lesovik, G.B.; Loosen, R. On the detection of finite-frequency current fluctuations. JETP Lett. 1997, 65, 295–299. [Google Scholar] [CrossRef]
  28. Khlus, V.A. Current and voltage fluctuations in microjunctions between normal metals and superconductors. Sov. Phys. JETP 1987, 66, 1243–1249. [Google Scholar]
  29. Lesovik, G.B. Excess quantum noise in 2D ballistic point contacts. JETP Lett. 1989, 49, 592–594. [Google Scholar]
  30. Reilly, D.J.; Marcus, C.M.; Hanson, M.P.; Gossard, A.C. Fast single-charge sensing with a rf quantum point contact. Appl. Phys. Lett. 2007, 91, 162101. [Google Scholar] [CrossRef]
  31. Vink, I.T.; Nooitgedagt, T.; Schouten, R.N.; Vandersypen, L.M.K.; Wegscheider, W. Cryogenic amplifier for fast real-time detection of single-electron tunneling. Appl. Phys. Lett. 2007, 91, 123512. [Google Scholar] [CrossRef]
  32. Choi, T.; Shorubalko, I.; Gustavsson, S.; Schön, S.; Ensslin, K. Correlated counting of single electrons in a nanowire double quantum dot. New J. Phys. 2009, 11, 013005. [Google Scholar] [CrossRef]
  33. Küng, B.; Pfäffli, O.; Gustavsson, S.; Ihn, T.; Ensslin, K.; Reinwald, M.; Wegscheider, W. Time-resolved charge detection with cross-correlation techniques. Phys. Rev. B 2009, 79, 035314. [Google Scholar] [CrossRef]
  34. Machlup, S. Noise in semiconductors: Spectrum of a two-parameter random signal. J. Appl. Phys. 1954, 25, 341–343. [Google Scholar] [CrossRef]
  35. Jordan, A.N.; Büttiker, M. Continuous quantum measurement with independent detector cross correlations. Phys. Rev. Lett. 2005, 95, 220401. [Google Scholar] [CrossRef] [PubMed]
  36. Korotkov, A.N. Persistent Rabi oscillations probed via low-frequency noise correlation. 2010. arXiv:1004.0220v1. arXiv.org e-Print archive http://arxiv4.library.cornell.edu/abs/1004.0220/ (accessed 24 June 2010).

