Article

Discrete Wavelet Entropy Aided Detection of Abrupt Change: A Case Study in the Haihe River Basin, China

1
Key Laboratory of Water Cycle & Related Land Surface Processes, Institute of Geographic Sciences and Natural Resources Research, Chinese Academy of Sciences, Beijing 100101, China
2
Center for Water Resources Research, Chinese Academy of Sciences, Beijing 100101, China
3
General Institute of Water Resources and Hydropower Planning and Design, Ministry of Water Resources, Beijing 100120, China
*
Author to whom correspondence should be addressed.
Entropy 2012, 14(7), 1274-1284; https://doi.org/10.3390/e14071274
Submission received: 10 May 2012 / Revised: 5 July 2012 / Accepted: 11 July 2012 / Published: 17 July 2012

Abstract

:
Detection of abrupt change is a key issue for understanding the facts and trends of climate change, but it is also a difficult task in practice. The Mann-Kendall (MK) test is commonly used for treating the issue, while the results are usually affected by the correlation and seasonal characters and sample size of series. This paper proposes a discrete wavelet entropy-aided approach for abrupt change detection, with the temperature analyses in the Haihe River Basin (HRB) as an example. The results show some obviously abrupt temperature changes in the study area in the 1960s–1990s. The MK test results do not reflect those abrupt temperature changes after the 1980s. Comparatively, the proposed approach can detect all main abrupt temperature changes in HRB, so it is more effective than the MK test. Differing from the MK test which only considers series’ value order or the conventional entropy which mainly considers series’ statistical random characters, the proposed approach is to describe the complexity and disorderliness of series using wavelet entropy theories, and it can fairly consider series’ composition and characteristics under different scales, so the results can more accurately reflect not only the abrupt changes, but also the complexity variation of a series over time. However, since it is based on the entropy theories, the series analyzed must have big sample size enough and the sampling rates being smaller than the concerned scale for the accurate computation of entropy values.

1. Introduction

This paper mainly considers the issue of abrupt change detection. Understanding the climate change over time and space is a hot issue at present, since it has potential impact on hydrology, ecology, environment, biodiversity conservation, desertification, weather risk assessment, as well as many other natural processes [1,2]. Climate change generally increases global average precipitation [3] and global and continental runoff [4]. Moreover, changes in runoff have severe impacts on the temporal and spatial distributions of available water resources [5,6,7,8]. Climate change also will lead to the changes of the times, intensities and durations of water-induced disasters, including environmental problems linked to water management and quality [9,10]. Therefore, evaluating the climate change is an important task, as it is for helpfully guiding many practical water management activities [11].
During the investigation of climate change, abrupt change detection is a foremost task to support the description of general and local dynamics and effects. However, it is also a difficult task due to the complex climatic processes and existing methods’ defects. Most of present studies indicate thatabrupt climate changes in the World have mainly happened since the 1980s [12], while there are differences from region to region due to the diverse climatic and geographic conditions, which make further investigation of the space differences of abrupt climate change. The rank-based nonparametric Mann-Kendall (MK) test is one most commonly used method for detection of trends and abrupt changes of a series [13,14]. It is simple and can cope with missing values and values below a detection limit [15,16,17]. However, the MK test is not robust against autocorrelation and cross-correlation of series [18,19], and also depends on the sample size as well as magnitude of the trend to be detected [20]. Observed climatic series usually have short lengths and good correlations, so the MK results would be inaccurate and must be viewed with caution. To overcome the defects of the MK test, various approaches were suggested to remove the affects of serial correlation, such as pre-whitening, trend-free pre-whitening, variance correction and block resampling techniques [21,22,23].
Presently information entropy theories are also widely used for analyzing the complexity of dynamic systems. The entropy is a measure of the degree of uncertainty, complexity, disorderliness and irregularity [24,25,26]. Higher entropy reflects more random and complex systems, and vice versa. Traditional entropy usually provides inaccurate or incomplete descriptions of dynamic systems which generally operate over multi-temporal scales [11]. Comparatively, the sample entropy and multi-scale entropy are more effective for analyses of those systems with multi-temporal scale characteristics [27,28], but they cannot treat the non-stationary series such as climatic series [4,19]. Characterizing the scaling properties is essential for understanding climate variability. The wavelet analysis (WA) method is capable of elucidating the localized characteristics of non-stationary series both in temporal and frequency domains [29,30,31]. The wavelet entropy, combined by WA and information entropy theories, is an important concept of describing the variability and complexity of dynamic systems with non-stationary and multi-temporal characteristics [32,33]. It is to first analyze a series by WA, such as continuous or discrete wavelet transform, and then calculate the entropy measures such as Shannon entropy [34], mutual information and relative entropy [35]. Various studies have manifested the better performance of wavelet entropy in analyzing the variability and complexity of climate processes compared with traditional methods [35,36,37].
The main objective of this study is to propose an alternative but simple approach for abrupt change detection by employing the wavelet entropy theories, which are used to quantify the complexity of a climatic series, and obvious changes of series’ complexity can reflect the abrupt climate change. Following the basic idea, this study takes the Haihe River Basin as example, and employs the wavelet entropy theories to detect the abrupt temperature changes in the basin. The discrete wavelet entropy results are compared with the MK test results and conventional entropy results for verification. Results indicate that the proposed approach is more effective for abrupt change detection compared with the other two. Finally, a set of conclusions summarize this study.

2. Data Set and Methods
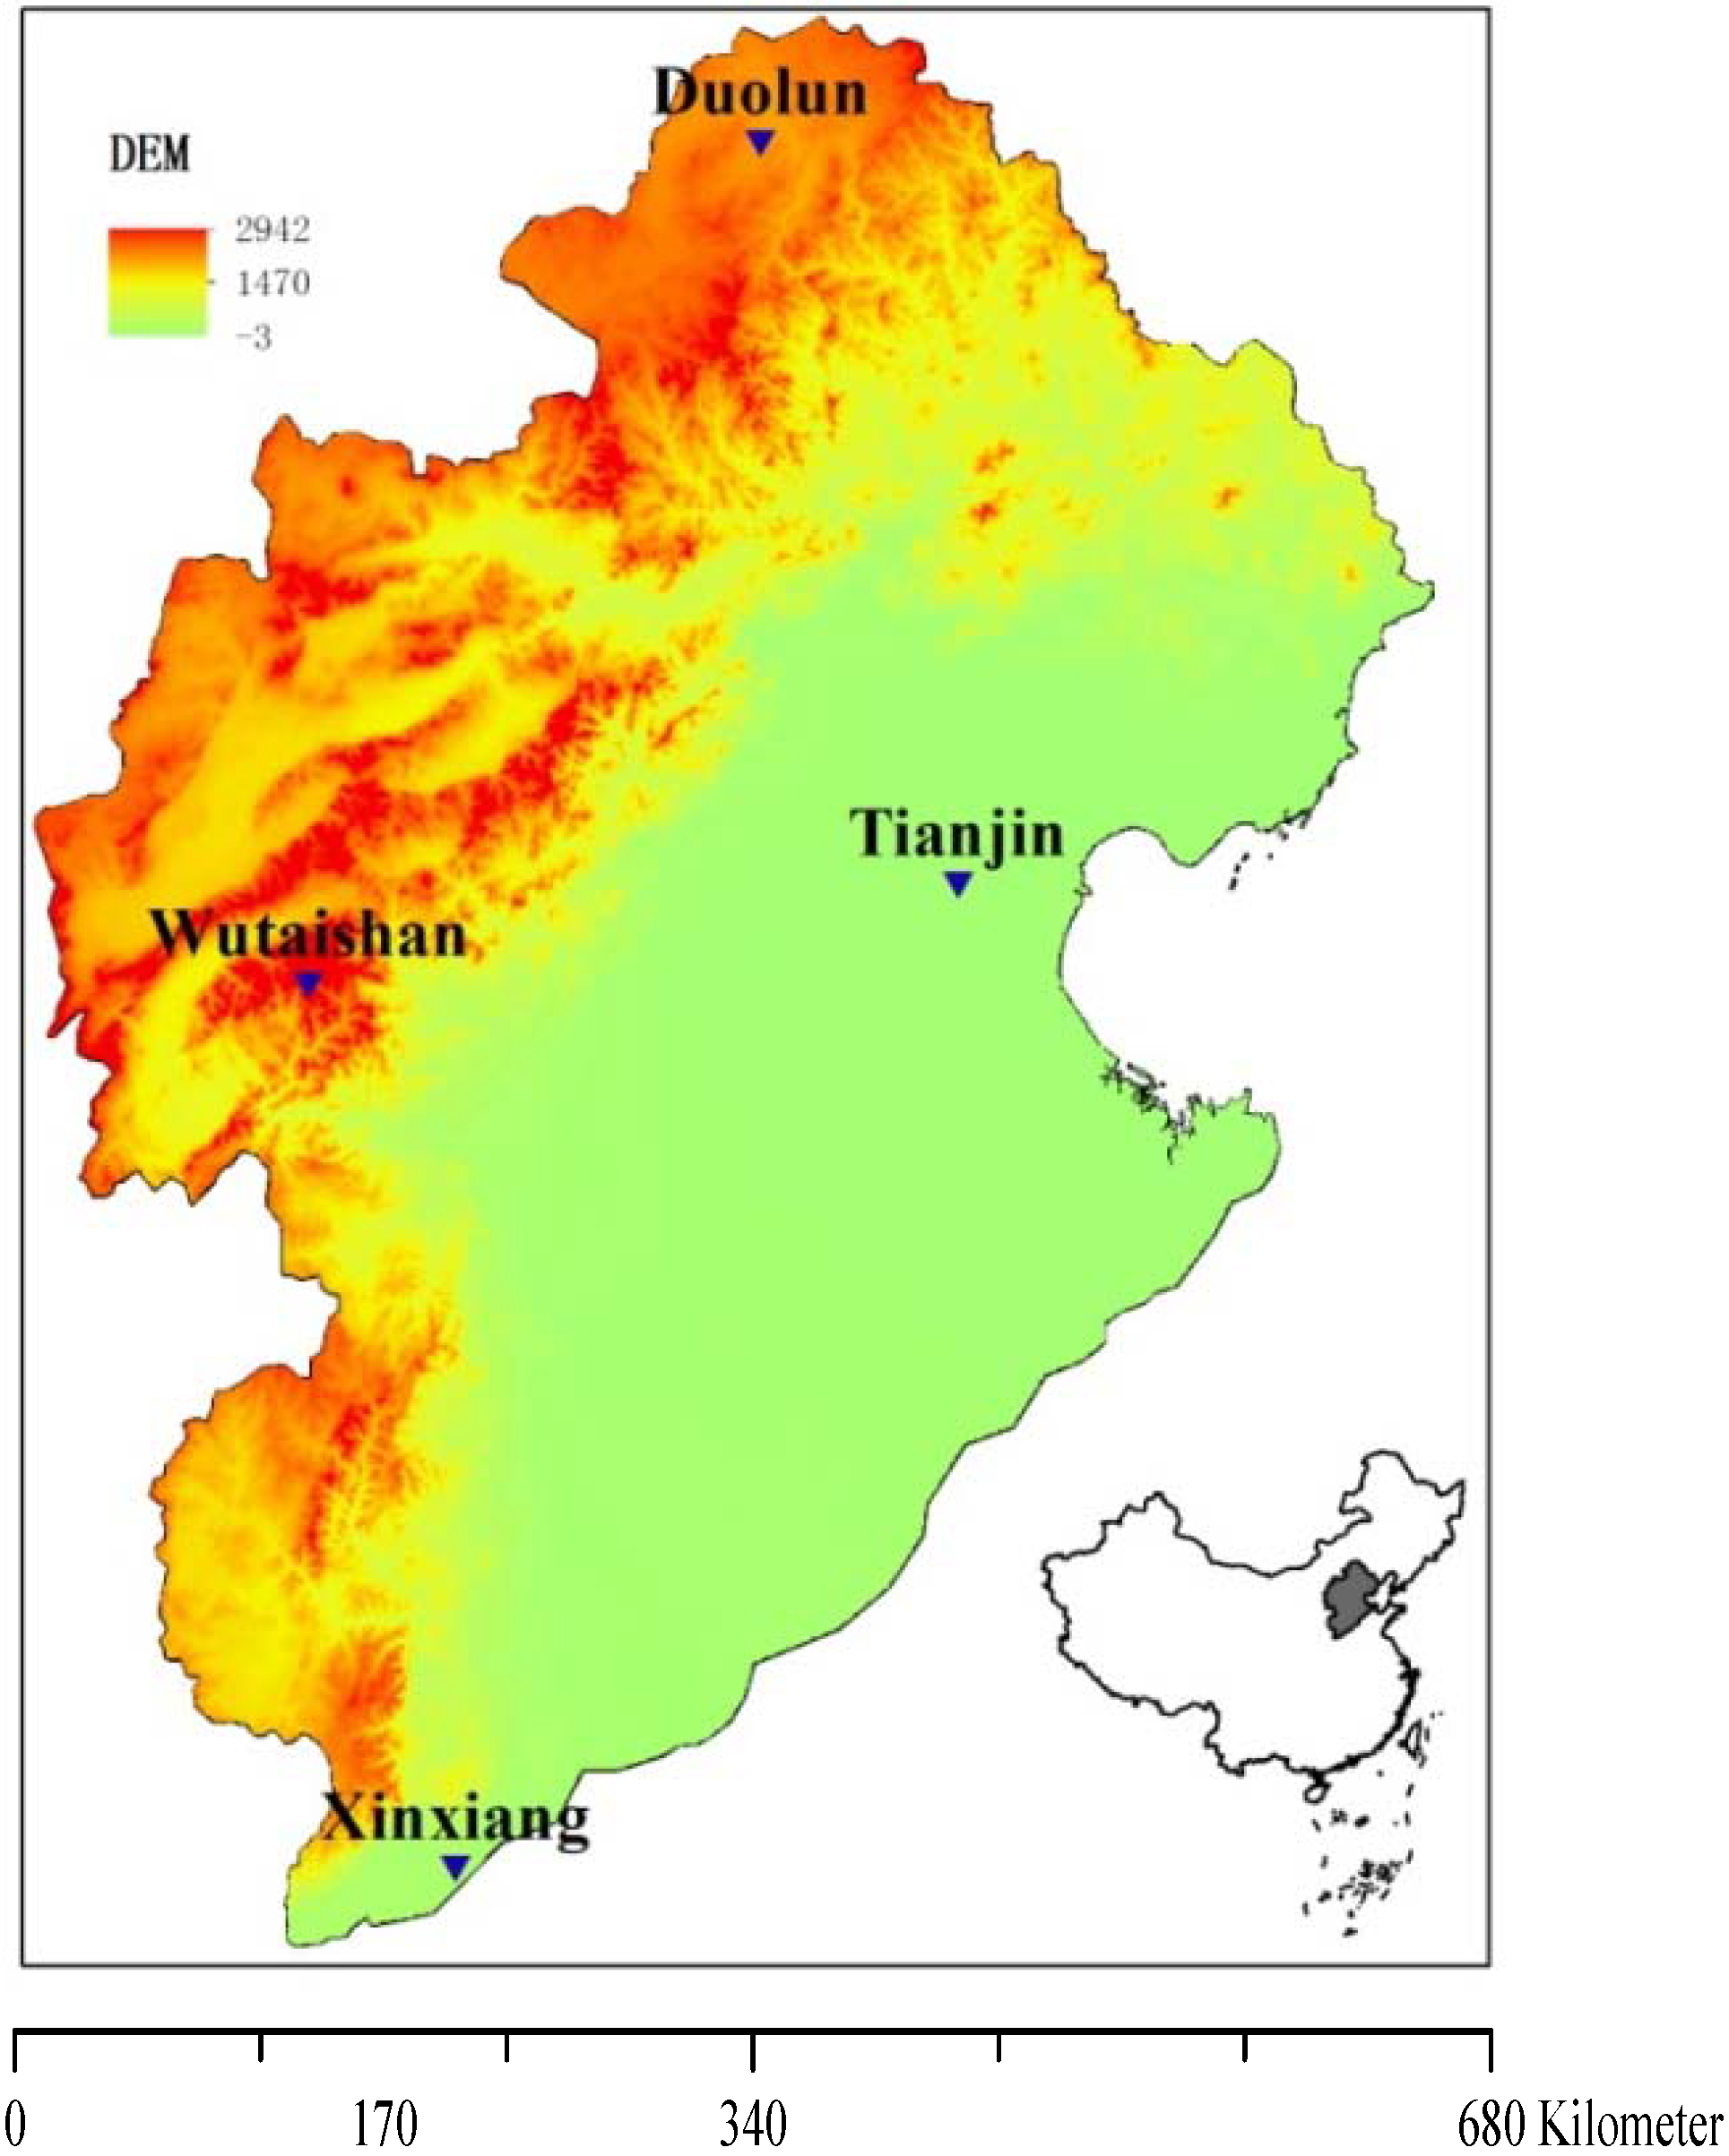
2.1. Data Set

The Haihe River Basin in North China is greatly impacted by climate change. With an area of 318,200 km2, it is located between 35°–43°N latitude and 112°–120°E longitude. It comprises mountains and plateaus in the north and west, and the North China Plain in the east and south parts (Figure 1). The study area belongs to the semi-humid climate in the monsoon region of the East Asia warm temperate zone, characterized by hot and wet summers and cold and dry winters. Average temperatures in the basin range between −4.9 and 15.0 °C [38].
Figure 1. The places of four weather stations in the Haihe River Basin used in this study.
Entropy 14 01274 g001
In order to clearly and intuitively display the abrupt temperature changes in the study area, the series of temperature data measured at the Duolun, Tianjin, Wutaishan and Xinxiang weather stations in the study area (Figure 1) were selected as examples for the study. The data were gained from the China Meteorological Data Sharing Service System (http://cdc.cma.gov.cn/). All these series have the same measured years from 1961 to 2010, with no missing segments.
The observed annual average temperature series in Figure 2 clearly show the main abrupt changes during 1960s–1990s. The temperature measured at the Duole station declines in the 1960s, is stable in 1970–1985, but increases afterwards. The temperature measured at the Wutaishan station obviously increases around the 2000s. The temperature measured at the Tianjin station declines in the 1960s, but obviously increases twice in the 1980s. The temperature measured at the Xinxiang station declines in the 1960s, is stable in the 1970s, obviously declines around 1985, and then increases afterwards.
Figure 2. Four annual average temperature (T) series used in this study, and their conventional entropy and discrete wavelet entropy (DWE) results computed by using daily temperature series.
Entropy 14 01274 g002

2.2. MK Test

The Mann–Kendall (MK) test is commonly used for detecting trends and abrupt changes in time series. All the mathematical test details can be found in [39]. The essence of the MK test is based on series’ value order, so the results are usually affected by serial correlation. The prewhitening method is usually used to eliminate the influences of series’ correlations (if significant) on the trend detection results. However, the impacts of serial correlation depend on the sample size, magnitude of the serial correlation, and the magnitude of trend. Generally, when the sample size and magnitude of trend are large enough, serial correlation would not significantly affect the MK test statistics. Besides serial correlation, the seasonal component of a series would also affect the MK test statistics [18]. Therefore, the annual series are used commonly to eliminate the affects of seasonal components. Since observed annual climatic series usually have no enough sample size, the influences of sample size and seasonal components cannot be eliminated meantime. In this study, we used the MK test to analyze both the daily and annual average temperature series for comparison with the proposed approach.

2.3. The DWE-Aided Approach Proposed

Differing from the MK test which mainly considers series’ value order, the proposed approach is based on the wavelet entropy theories. It is to detect the abrupt changes according to the variations of series’ complex characters described by discrete wavelet entropy (DWE). There are obvious differences between stable systems and changing systems. Generally speaking, the complexity of a system is relevant to its entropy in the way that the entropy increases with the degree of disorder: the larger the entropy, the more disorder and complex a system [11,33,40,41]. Here we assume that a climatic system under natural condition is stable, while it would become disordered and complex when encountering climate change. The changing climatic system has higher entropy than stable system, since climate change destroys the intrinsic meaningful structure in stable climatic system. Thereby, analyses of the variation of DWE values over time can understand the changes of physically climatic processes to some extent: more obvious increases of DWE values reflect more obviously abrupt change, and decreases of DWE values reflect weakening processes of climate change.
We used the discrete wavelet entropy to quantify the complexity of a series, mainly to treat the non-stationary characteristics of climatic series. A brief description of DWE computation is presented. The dyadic discrete wavelet transform of a series f(t) is computed as:
W f ( j , k ) = + f ( t ) ψ j , k * ( t ) d t with ψ j , k ( t ) = 2 j / 2 ψ ( 2 j t k ) j , k Z , j 0
where j is decomposition level and k is time translation; ψ*(t) is the complex conjugate of mother wavelet ψ(t), and Wf(j,k) is discrete wavelet coefficient. The biggest decomposition level M equals log2n given that the series has the length of n [29]. The sub-signal under each level is reconstructed as:
f j ( t ) = k W f ( j , k ) ψ j , k ( t )
Therefore, a series f(t) after discrete wavelet decomposition can be expressed as:
f ( t ) = f ¯ + j = 1 M f j ( t )
where f ¯ is the residual under the biggest level M, and it generally is the mean or trend of series [31].
Furthermore, we used the Equation (4) to compute probability density function, which is estimated according to the wavelet energy (i.e., variance):
p E ( j ) = E ( j ) E = E ( j ) j ( E ( j ) )     w i t h      E ( j ) = k ( W f ( j , k ) ) 2
After that, the DWE is computed according to the conventional entropy equation [34]:
D W E = j = 1 M p E ( j ) log 2 [ p E ( j ) ]
Differing from the conventional entropy which mainly considers series’ statistical random characters [40], the Equation (4) shows that the DWE is computed according to the composition and characteristics of series under different scales (i.e., decomposition levels), so it can more truthfully reflect the variability and complexity of climate processes.
The daily temperature series were analyzed by the proposed approach for detection of abrupt temperature changes. To be specific, the DWE value of daily data in each year was computed, and the variation of temperature series’ DWE value with years at each station was obtained. Obvious changes of DWE values reflect the abrupt temperature changes. Choice of a suitable wavelet is the foremost task for computing DWE. In this study the “db8” mother wavelet (Daubechchies least-asymmetric eight wavelet) was chosen. The wavelet provides a reasonable choice for maintaining compact support in both the frequency and temporal domains and has an approximately linear filtering. All analyses on the series data were conducted in MathWorks MATLAB R2010.

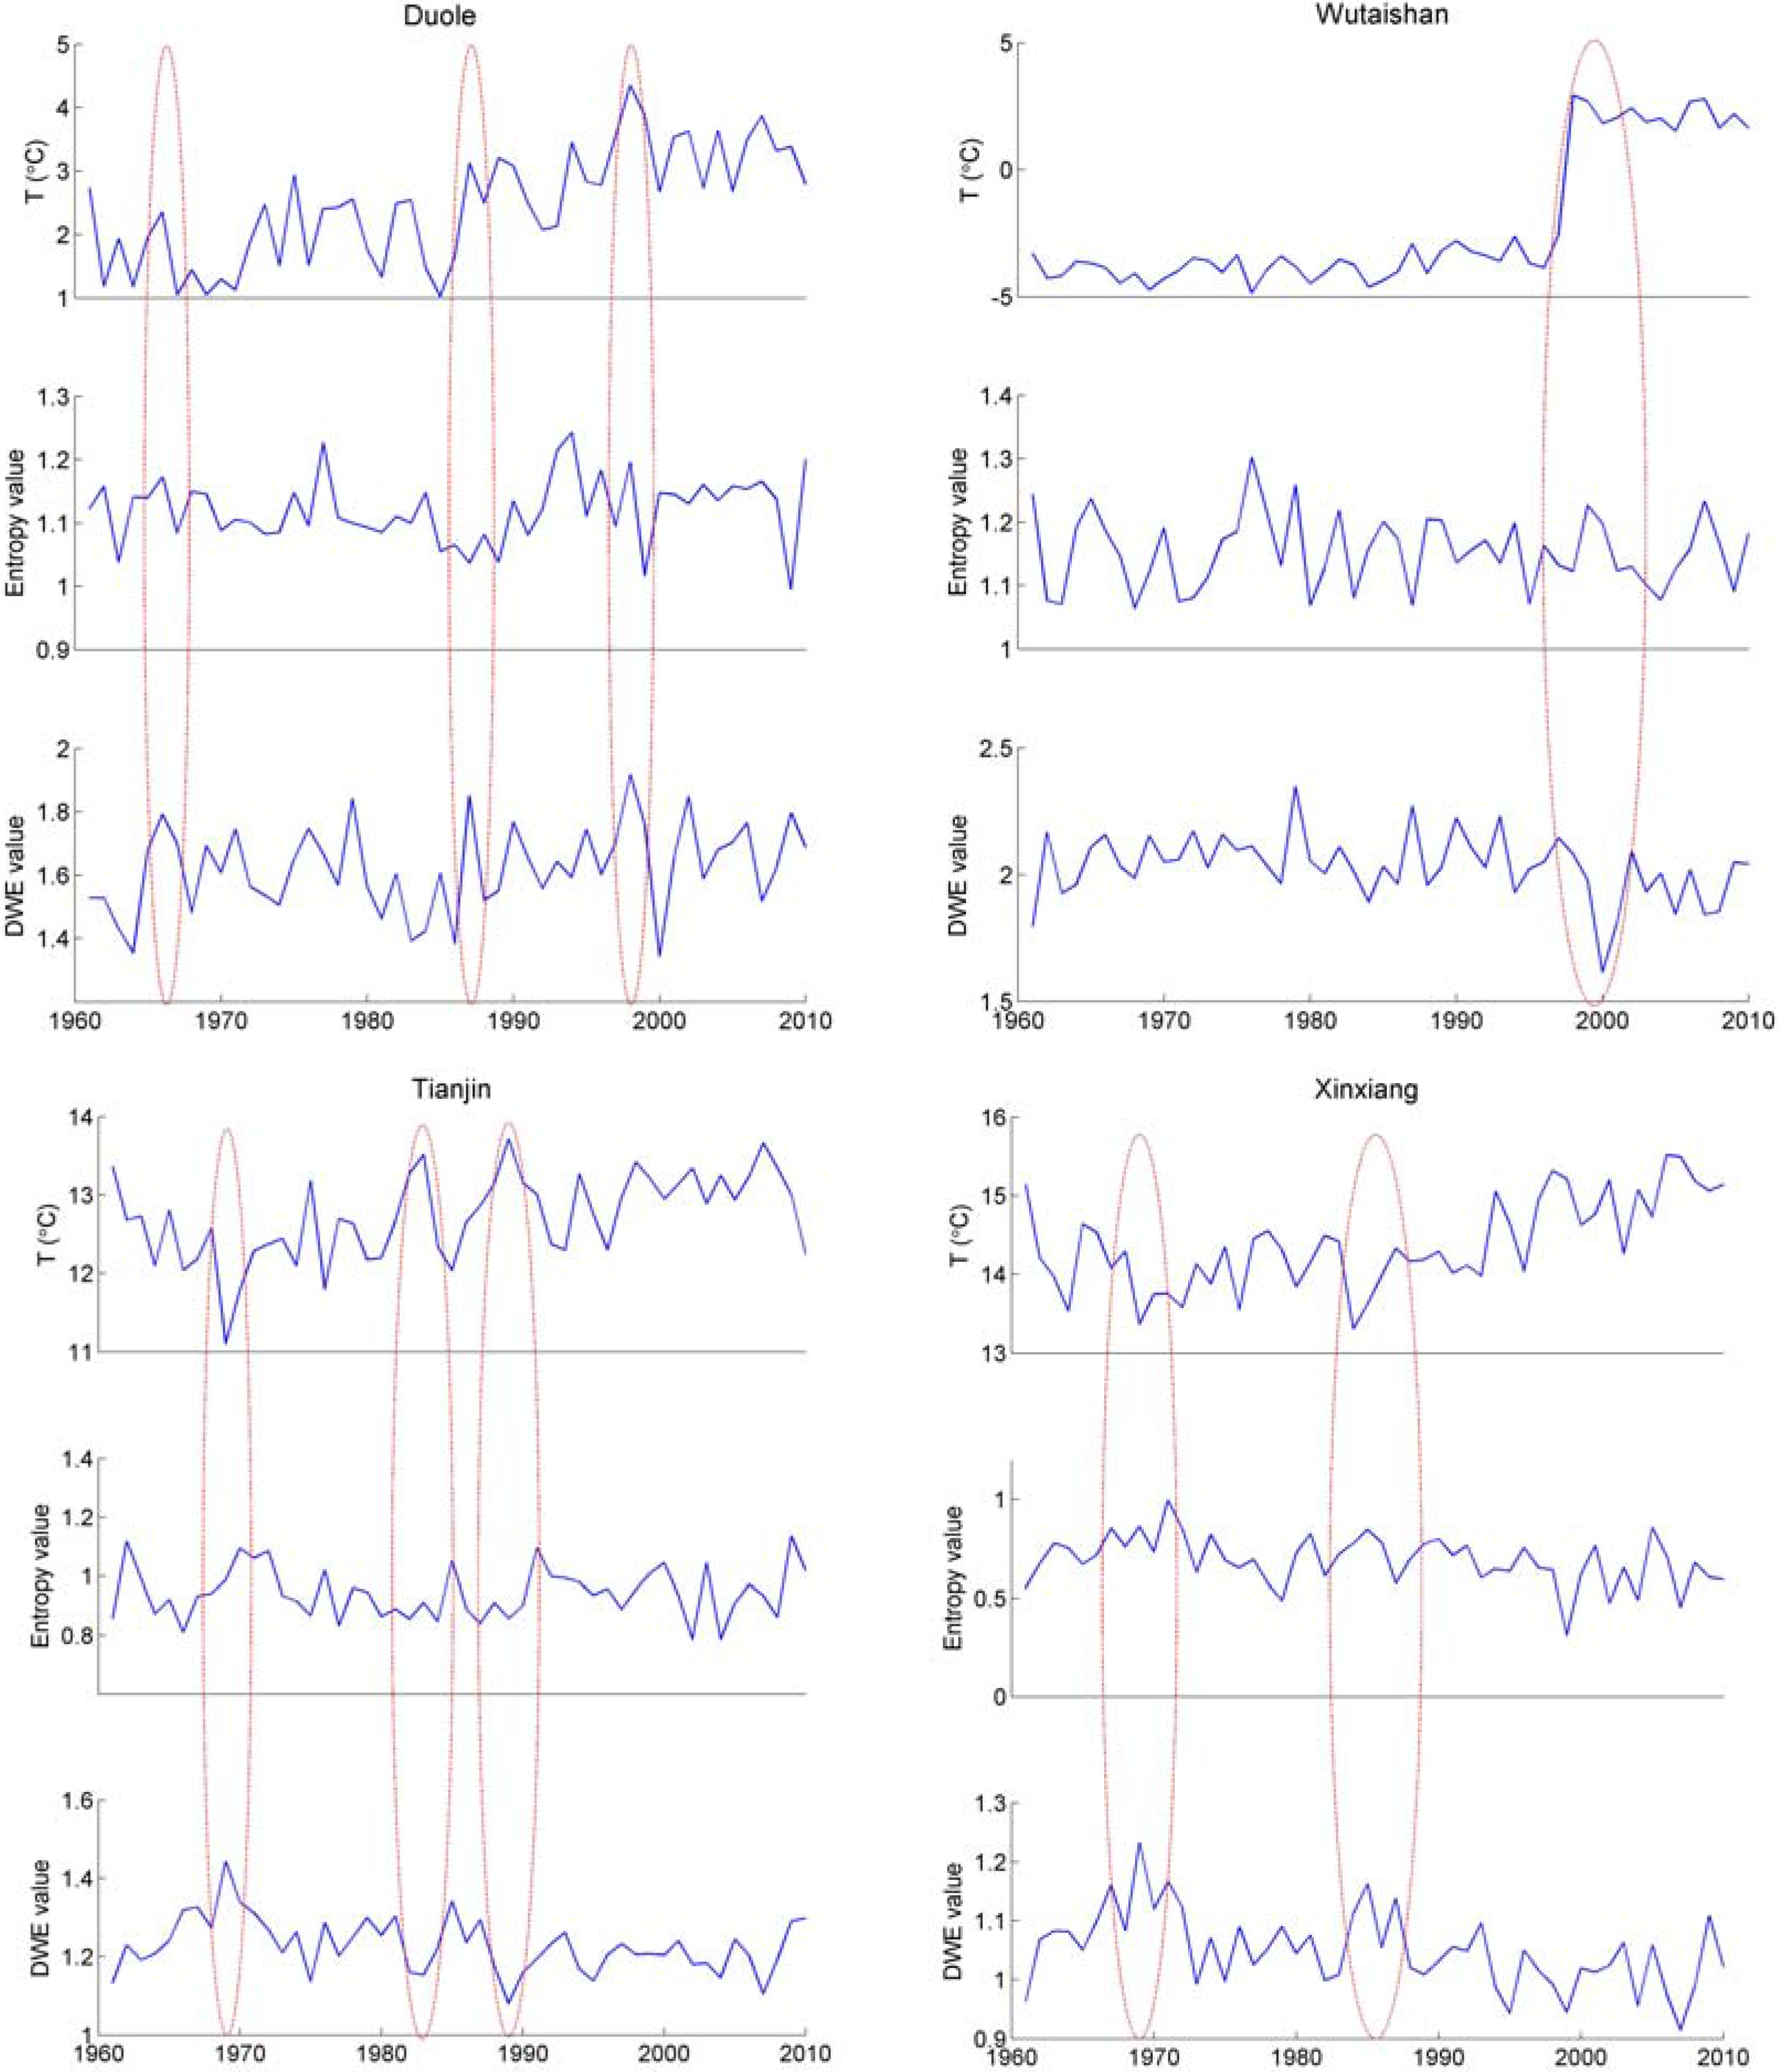
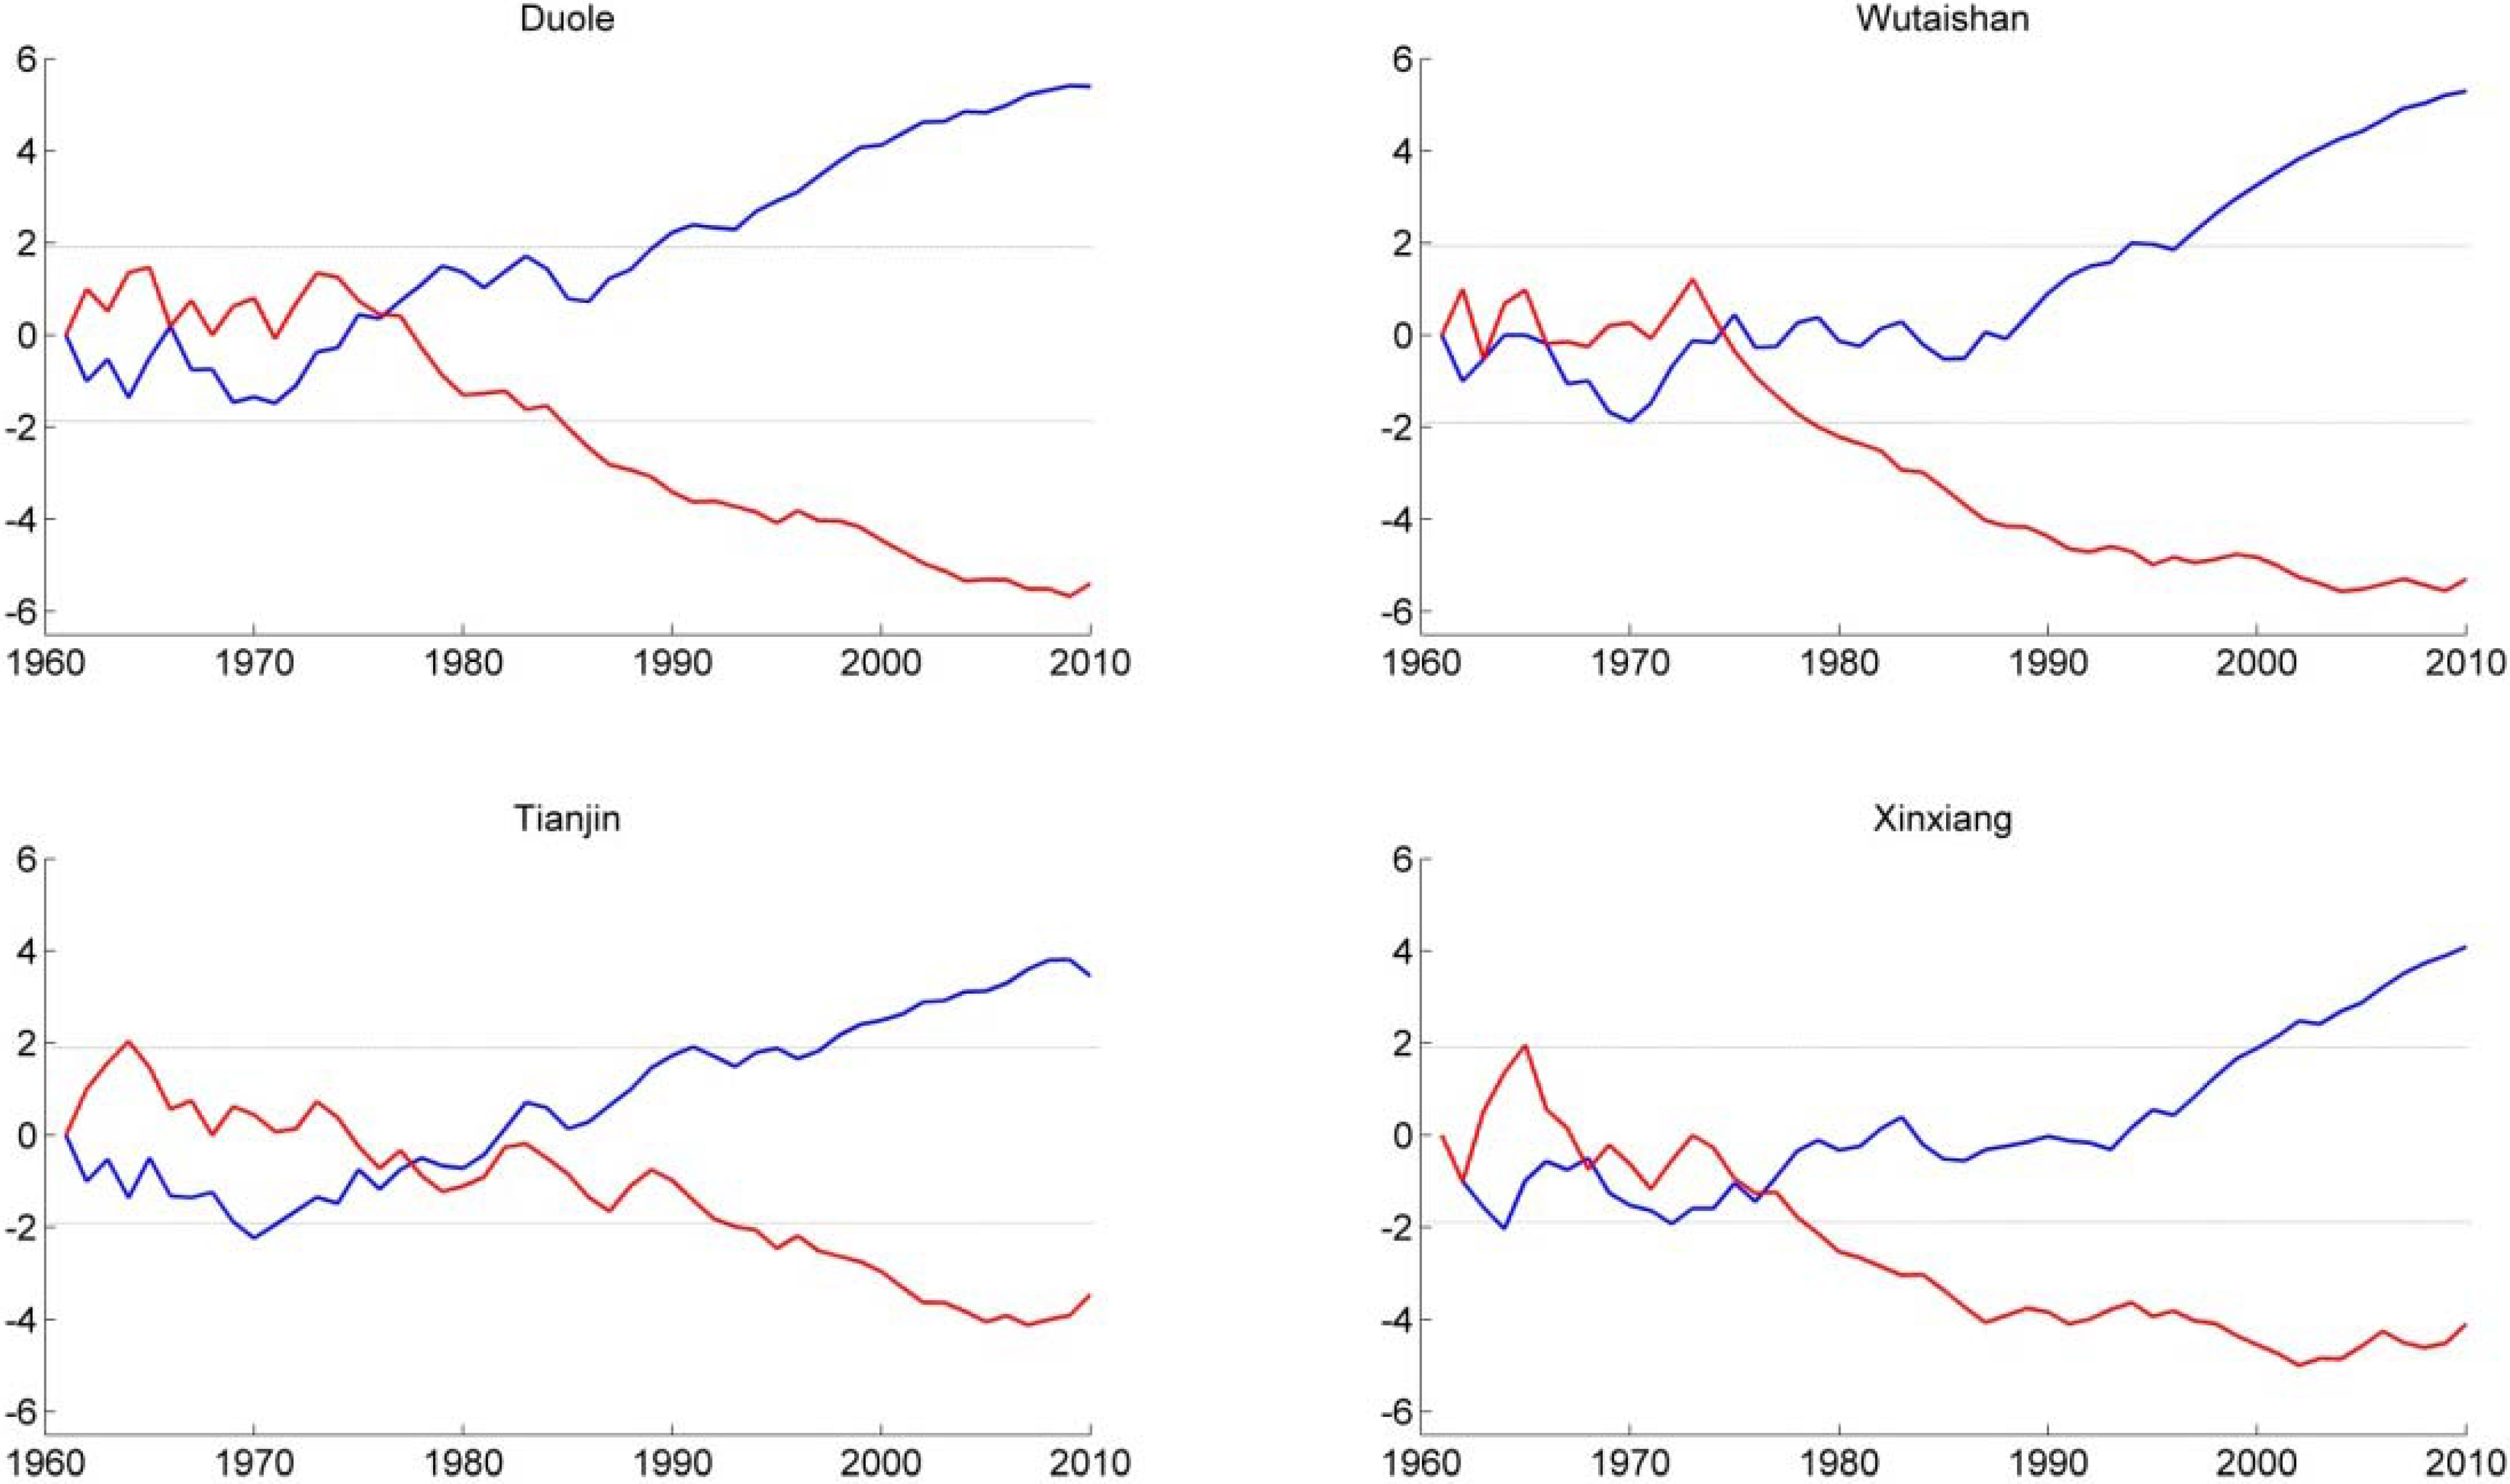
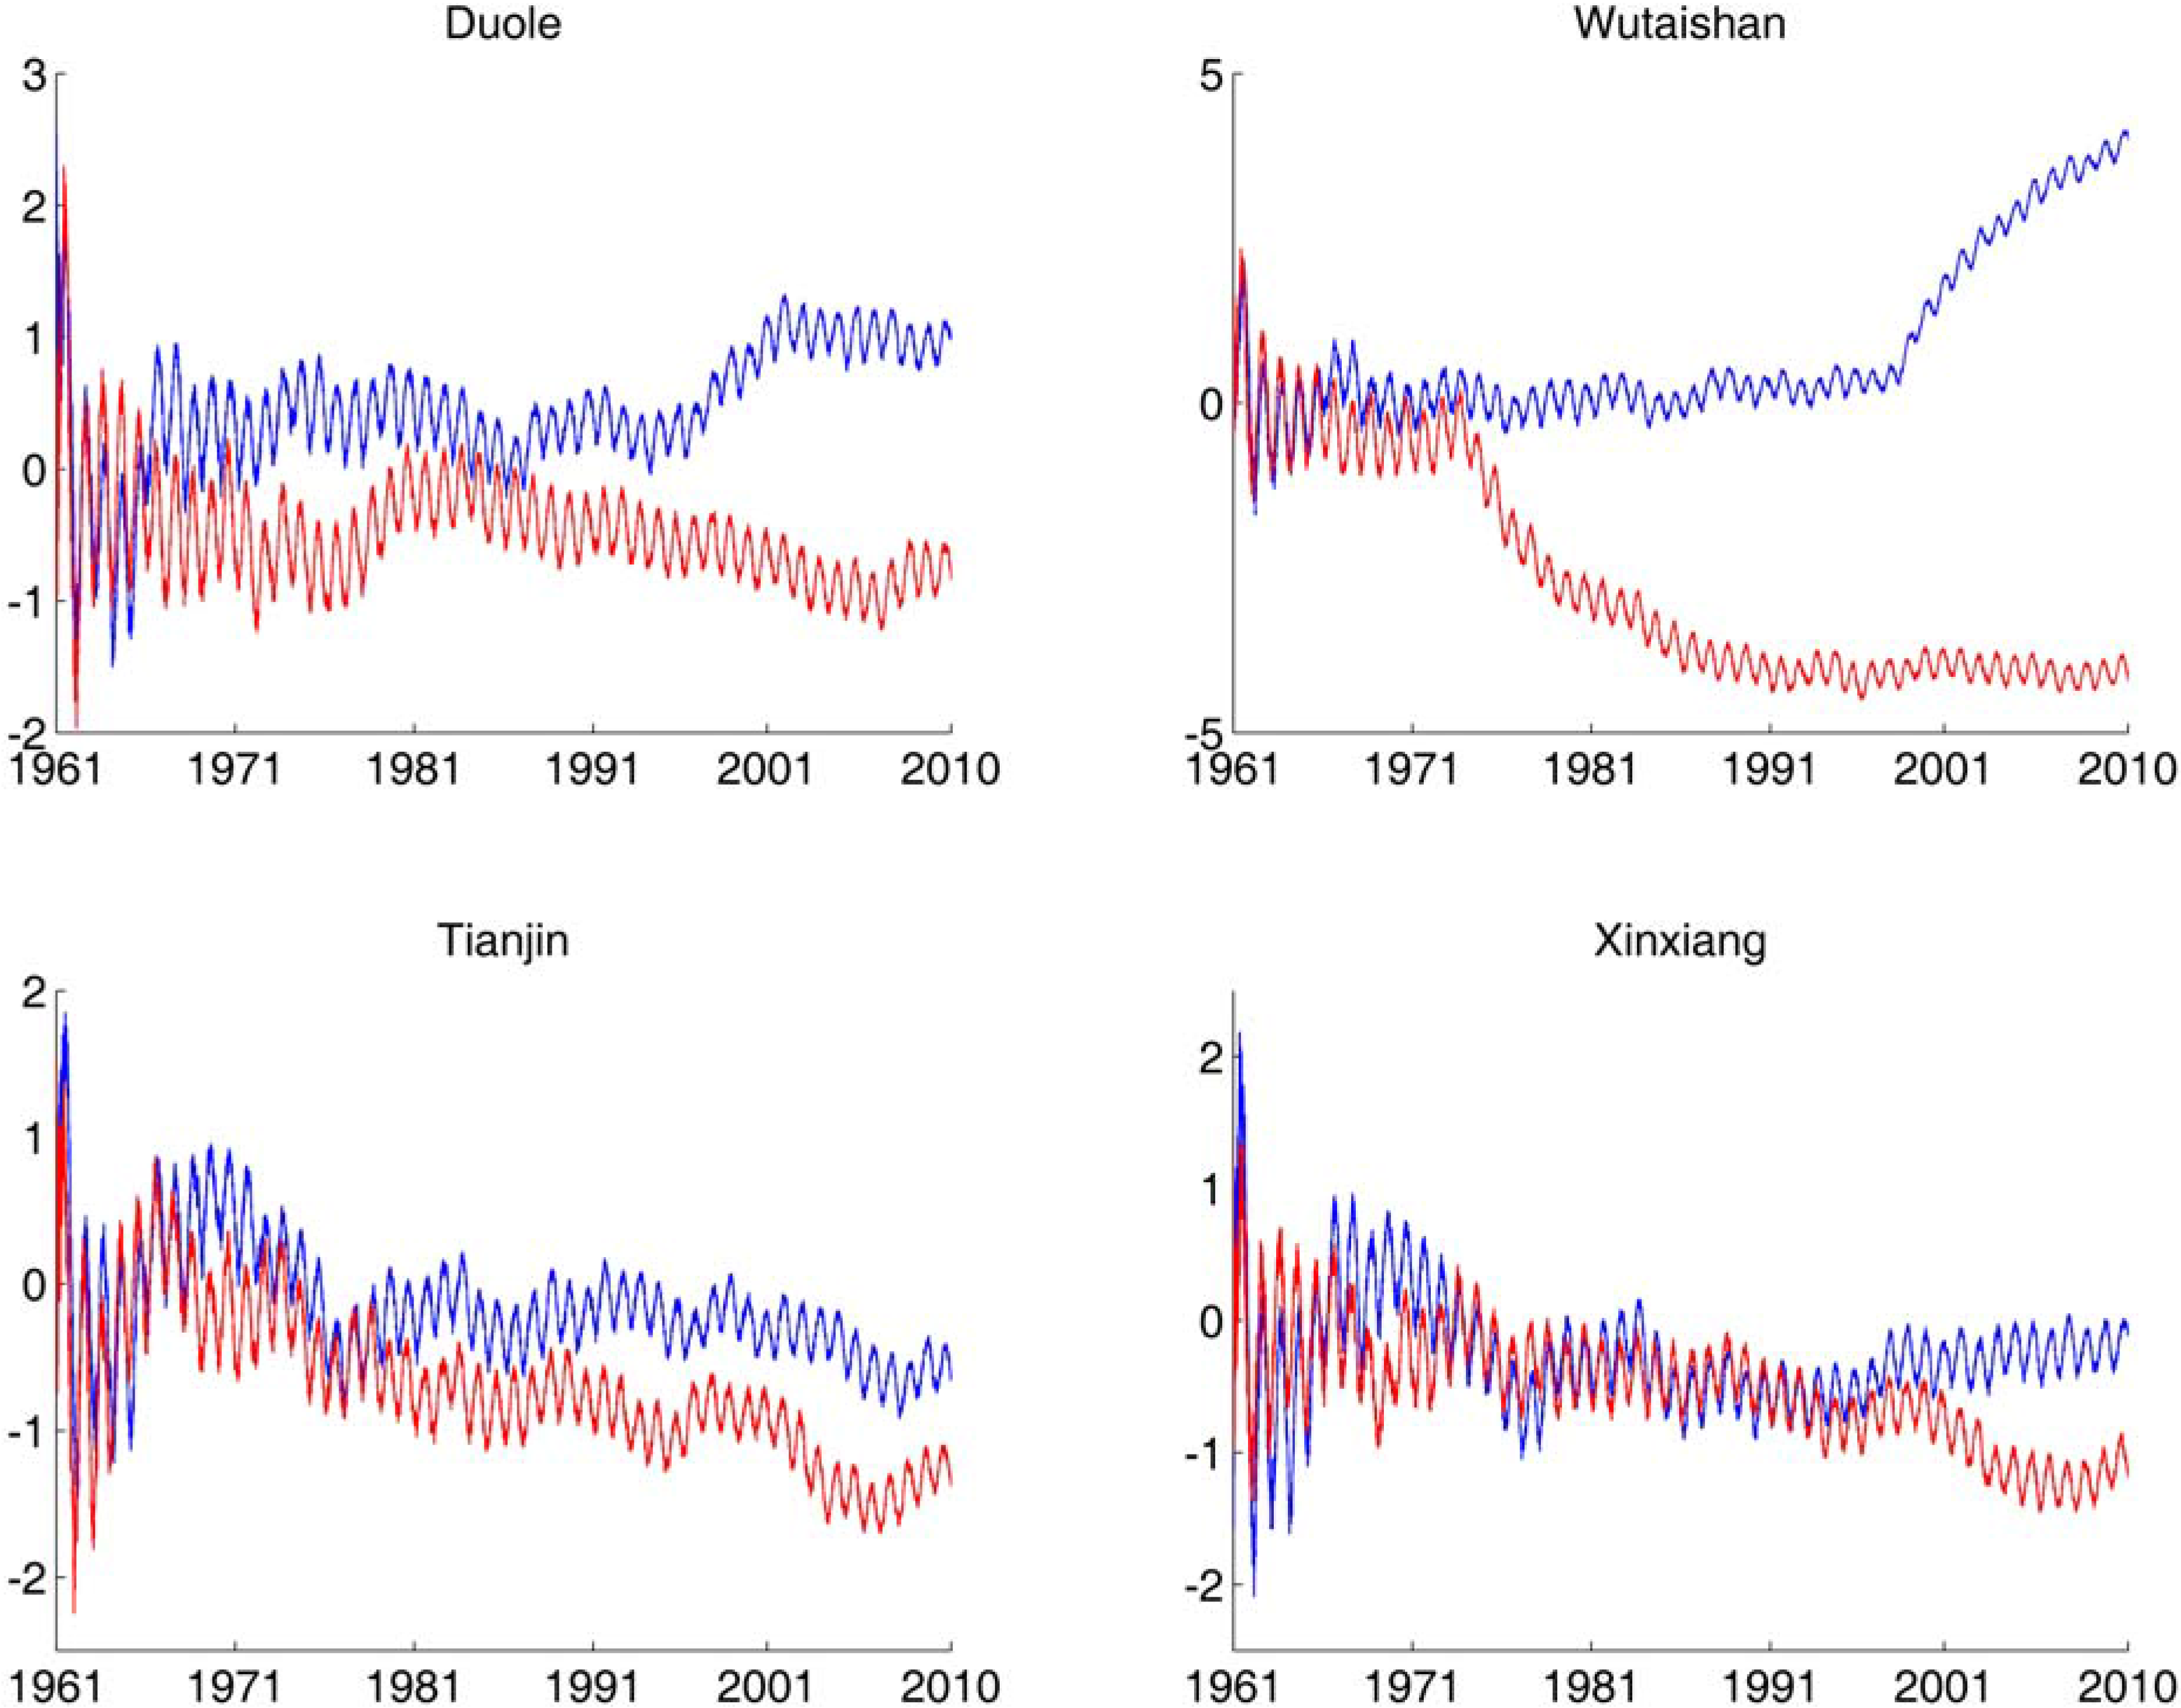
3. Results and Discussion

The DWE results of four daily temperature series were computed (Figure 2), and they were also compared with the observed series and conventional entropy results for verification. The DWE values of those main abrupt changes of each observed temperature series were focused on. At the Duole station, a clear change from declining temperature to stable temperature in 1967 corresponds to an abrupt DWE increase, and two obvious temperature increases in 1987 and 1997 also correspond to two abrupt DWE increases. At the Wutaishan station, the obvious temperature increase at around 2000 corresponds to the abrupt DWE decrease. At the Tianjin station, the obvious temperature decrease in 1969 corresponds to an abrupt DWE increase, and two obvious temperature increases in 1980s also correspond to two abrupt DWE decreases. At the Xinxiang station, two obvious temperature decreases in 1969 and 1986 correspond to two abrupt DWE increases.
As a result, the variation of series’ DWE values can clearly reflect all the main abrupt changes of four observed temperature series, verifying the reliability of the DWE-aided approached proposed. Comparatively, conventional entropy results cannot reflect these main abrupt temperature changes, indicating its deficiency compared with the DWE results. The reason can be due to the different essences of the two measures. As explained before, the DWE is based on the composition and characteristics of series under different scales, so the climate processes can be effectively considered for abrupt change detection when using the proposed approach. However, the conventional entropy mainly considers series’ statistical random characters, but cannot consider the composition and characteristics of series. To sum up, the proposed approach is to describe the complexity and disorderliness of series by DWE, and the results more reflect the variations and abrupt changes of climatic systems, but do not only consider the visual fluctuations of series. In addition, by considering 95% statistical confidence level, the abrupt changes of four temperature series were also detected by the MK test. Abrupt changes of annual average temperature mainly occurred in 1966 and 1975 at the Duole station, in the 1960s and 1975 at the Wutaishan station, in 1977 at the Tianjin station, and in 1967 and 1977 at the Xinxiang station (Figure 3).
Figure 3. MK test results of four annual average temperature series used in this study. — forward sequence; — backward sequence.
Entropy 14 01274 g003
As a result, the MK test results indicate that four annual average temperature series show abrupt changes in 1960s and 1970s. Compared with the observed series in Figure 2, it can be found that those obviously abrupt temperature changes after 1980s were not detected by the MK test. Therefore, the MK test results are not as good as expected.
The inaccurate MK results should be due to the defects of the MK test which is based on series’ value order. The MK test results of four daily temperature series are displayed in Figure 4, from which no reliable abrupt temperature changes can be detected, and it is due to the seasonal components in the four daily temperature series.
Comparison results indicate that the proposed approach can detect not only the abrupt changes, but also the complexity variation of a series over time, so based on it the climate change and variability can be more clearly understood. The MK test is usually impacted by serial correlation and seasonality, so it is not suitable for analyses of daily and monthly series but usually used for analyses of annual series. Moreover, the MK test results are mainly based on the value order of series, so it cannot reflect the complexity and disorderliness of series. Compared with the MK test, the proposed approach can fairly consider the composition and characteristics of series under different scales, so it can more accurately reflect the climate change and variability.
Figure 4. MK test results of four daily temperature series used in this study. — forward sequence; backward sequence.
Entropy 14 01274 g004
However, more attention should be paid the following issues when using the proposed approach. First, wavelet choice and series’ trend would impact the computation of wavelet entropy values [42], so they would also impact the results of abrupt change detection by the proposed approach, and they should be carefully considered. Second, since the proposed approach is based on the entropy theories, the series analyzed must have big sample size enough and the sampling rates being smaller than the concerned scale for the accurate computation of entropy values, for instance, the daily temperature series were analyzed by the proposed approach for detecting the years when abrupt temperature changes occurred, but the annual series cannot meet this need.

4. Conclusions

In this paper, by taking the temperature variations in the Haihe River Basin as an example, a discrete wavelet entropy-aided approach was proposed for abrupt change detection. The observed temperature series indicate some main abrupt temperature changes in 1970s–1990s in the study area. The MK test results cannot reflect those obviously abrupt temperature changes after the 1980s. Comparatively, the proposed approach can detect all the main abrupt temperature changes in the Haihe River Basin, but the conventional entropy results cannot do this. Differing from the MK test which mainly considers the value order of series or the conventional entropy which mainly considers series’ statistical random characters, the proposed approach can describe the complexity of a series by effectively considering its composition and characteristics under different scales, based on which the results of abrupt change detection can be more reliable and accurate.
Since the proposed approach uses DWE to describe the complexity and disorderliness of series, the results more reflect the variations and abrupt changes of climatic systems. In addition, the proposed approach can detect not only the abrupt change but also the complexity variation of a climatic variable over time, so based on it the climate change and variability can be more clearly understood. To sum up, the conventional MK test cannot meet the practical needs enough, and the DWE-aided approach can be an effectively alternative method for abrupt change detection. Besides, the proposed approach can also be suitable for analyses of time series and dynamic systems in other domains.
Finally, further studies using more data from other basins with diverse geographic characters should be conducted to further strengthen the effectiveness of the proposed approach. In addition, the uncertainty of the DWE-aided abrupt change detection results should be further studied in the future.

Acknowledgements

The authors gratefully acknowledge the valuable review comments and suggestions given by the editors and the anonymous reviewers. The authors also thank Feifei Liu for her assistance in preparation of the manuscript. This project was financially supported by the National Natural Science Foundation of China (No. 40701027 and 40971023), and the Water Resources Public-Welfare Projects (No. 200901042 and 201201072).

References

  1. Loukas, A.; Vasiliades, L.; Dalezios, N.R. Potential climate change impacts on flood producing mechanisms in southern British Columbia, Canada using the CGCMA1 simulation results. J. Hydrol. 2002, 259, 163–188. [Google Scholar] [CrossRef]
  2. Camilloni, I.A.; Barros, V.R. Extreme discharge events in the Parana River and their climate forcing. J. Hydrol. 2003, 278, 94–106. [Google Scholar] [CrossRef]
  3. Clark, P.U.; Alley, R.B.; Pollard, D. Northern hemisphere ice-sheet influences on global climate change. Science 1999, 286, 1104–1111. [Google Scholar] [CrossRef]
  4. Labat, D.; Godderis, Y.; Probst, J.L.; Guyot, J.L. Evidence for global runoff increase related to climate warming. Adv. Water Resour. 2004, 27, 631–642. [Google Scholar] [CrossRef] [Green Version]
  5. Douglas, E.M.; Vogel, R.M.; Kroll, C.N. Trends in floods and low flows in the United States: Impact of spatial correlation. J. Hydrol. 2000, 240, 90–105. [Google Scholar] [CrossRef]
  6. Brunetti, M.; Maugeri, M.; Monti, F.; Nanni, T. Temperature, precipitation variability in Italy in the last two centuries from homogeneised instrumental time series. Inter. J. Climatol. 2006, 26, 345–381. [Google Scholar] [CrossRef]
  7. Sang, Y.F.; Wang, Z.G.; Li, Z.L.; Liu, C.M.; Liu, X.J. Investigation into the daily precipitation variability in the Yangtze River Delta, China. Hydrol. Process. 2012. [Google Scholar] [CrossRef]
  8. Mishra, A.K.; Ozger, M.; Singh, V.P. An entropy-based investigation into the variability of precipitation. J. Hydrol. 2009, 370, 139–154. [Google Scholar] [CrossRef]
  9. Milly, P.C.D.; Wetherald, R.T.; Dunne, K.A.; Delworth, T.L. Increasing risk of great floods in a changing climate. Nature 2002, 415, 514–517. [Google Scholar] [CrossRef] [PubMed]
  10. Sang, Y.F.; Wang, D.; Wu, J.C. Probabilistic forecast and uncertainty assessment of hydrologic design values using Bayesian theories. Hum. Ecol. Risk Assess. 2010, 16, 1184–1207. [Google Scholar] [CrossRef]
  11. Li, Z.W.; Zhang, Y.K. Multi-scale entropy analysis of Mississippi river flow. Stoch. Env. Res. Risk A. 2008, 22, 507–512. [Google Scholar] [CrossRef]
  12. Xia, J.; Liu, C.M.; Ding, Y.J.; Jia, S.F.; Lin, C.H. China Water Resources Vision; The Press of Science: Beijing, China, 2011; Volume 1. [Google Scholar]
  13. Kendall, M. Rank Correlation Methods; Charles Griffin: London, UK, 1975. [Google Scholar]
  14. Mann, H. Non-parametric tests against trend. Econometrica 1945, 13, 245–259. [Google Scholar] [CrossRef]
  15. Kuczera, G. Uncorrelated measurement error in flood frequency inference. Water Resour. Res. 1992, 28, 183–188. [Google Scholar] [CrossRef]
  16. Mann, M.E.; Lees, J.M. Robust estimation of background noise and signal detection in climatic time series. Clim. Change 1996, 33, 409–445. [Google Scholar] [CrossRef]
  17. Kundzewicz, Z.W.; Graczyk, D.; Maurer, T.; Pinskwar, I.; Radziejewski, M.; Svensson, C.; Szwed, M. Trend detection in river flow series: 1. Annual maximum flow. Hydrol. Sci. J. 2005, 50, 797–810. [Google Scholar] [CrossRef]
  18. Shao, Q.X.; Li, M. A new trend analysis for seasonal time series with consideration of data dependence. J. Hydrol. 2011, 396, 104–112. [Google Scholar] [CrossRef]
  19. Sang, Y.F.; Wang, Z.G.; Liu, C.M. Discrete wavelet-based trend identification in hydrologic time series. Hydrol. Process. 2012. [Google Scholar] [CrossRef]
  20. Adamowski, K.; Prokoph, A.; Adamowski, J. Development of a new method of wavelet aided trend detection and estimation. Hydrol. Process. 2009, 23, 2686–2696. [Google Scholar] [CrossRef]
  21. Hamed, K.H. Trend detection in hydrologic data: The Mann-Kendall trend test under the scaling hypothesis. J. Hydrol. 2008, 349, 350–363. [Google Scholar] [CrossRef]
  22. Khaliq, M.N.; Ouarda, T.B.M.J.; Gachon, P.; Sushama, L.; St-Hilaire, A. Identification of hydrological trends in the presence of serial and cross correlations: A review of selected methods and their application to annual flow regimes of Canadian rivers. J. Hydrol. 2009, 368, 117–130. [Google Scholar] [CrossRef]
  23. Rivard, C.; Vigneault, H. Trend detection in hydrological series: When series are negatively correlated. Hydrol. Process. 2009, 23, 2737–2743. [Google Scholar] [CrossRef]
  24. Zaccarelli, N.; Li, B.L.; Petrosillo, I.; Zurlini, G. Order and disorder in ecological time-series: Introducing normalized spectral entropy. Ecol. Indic. 2011. [Google Scholar] [CrossRef]
  25. Ren, W.X.; Sun, Z.S. Structural damage identification by using wavelet entropy. Eng. Struct. 2008, 30, 2840–2849. [Google Scholar] [CrossRef]
  26. Rosso, O.A.; Blanco, S.; Yordanova, J.; Kolev, V.; Figliola, A.; Schurmann, M.; Basar, E. Wavelet entropy: A new tool for analysis of short duration brain electrical signals. J. Neurosci. Meth. 2001, 105, 65–75. [Google Scholar] [CrossRef]
  27. Zhang, Y.C. Complexity and 1/f noise: A phase space approach. J. Phys. I France 1991, 1, 971–977. [Google Scholar] [CrossRef]
  28. Costa, M.; Goldberger, A.L.; Peng, C.K. Multiscale entropy analysis of biological signals. Phys. Rev. E 2005, 71, 021906. [Google Scholar] [CrossRef]
  29. Percival, D.B.; Walden, A.T. Wavelet Methods for Time Series Analysis; Cambridge University Press: Cambridge, UK, 2000. [Google Scholar]
  30. Chui, C.K. Wavelet Analysis and Its Applications. In An Introduction to Wavelets; Academic Press: Boston, MA, USA, 1992. [Google Scholar]
  31. Sang, Y.F. A practical guide to discrete wavelet decomposition of hydrologic time series. Water Resour. Manag. 2012. [Google Scholar] [CrossRef]
  32. Zunino, L.; Perez, D.G.; Garavaglia, M.; Rosso, O.A. Wavelet entropy of stochastic processes. Phys.A Stat. Mech. Appl. 2007, 379, 503–512. [Google Scholar] [CrossRef]
  33. Emre Cek, M.; Ozgoren, M.; Acar Savaci, F. Continuous time wavelet entropy of auditory evoked potentials. Comput. Biol. Med. 2010, 40, 90–96. [Google Scholar] [CrossRef] [PubMed]
  34. Jaynes, E.T. Information theory and statistical mechanics. Phys. Rev. 1957, 106, 620–630. [Google Scholar] [CrossRef]
  35. Brunsell, N.A. A multiscale information theory approach to assess spatial-temporal variability of daily precipitation. J. Hydrol. 2010, 385, 165–172. [Google Scholar] [CrossRef]
  36. Chou, C.M. Wavelet-Based Multi-Scale Entropy Analysis of Complex Rainfall Time Series. Entropy 2011, 13, 241–253. [Google Scholar] [CrossRef]
  37. Mishra, A.K.; Özger, M.; Singh, V.P. An entropy-based investigation into the variability of precipitation. J. Hydrol. 2009, 370, 139–154. [Google Scholar] [CrossRef]
  38. Wang, Z.; Luo, Y.; Liu, C.; Xia, J.; Zhang, M. Spatial and temporal variations of precipitation in Haihe River Basin, China: Six decades of measurements. Hydrol. Process. 2011, 25, 2916–2923. [Google Scholar] [CrossRef]
  39. Khaliq, M.N.; Ouarda, T.B.M.J.; Gachon, P.; Sushama, L.; St-Hilaire, A. Identification of hydrological trends in the presence of serial and cross correlations: A review of selected methods and their application to annual flow regimes of Canadian rivers. J. Hydrol. 2009, 368, 117–130. [Google Scholar] [CrossRef]
  40. Singh, V.P. Entropy-Based Parameter Estimation in Hydrology; Kluwer Academic Publishers: Boston, MA, USA, 1998. [Google Scholar]
  41. Sang, Y.F. Wavelet entropy-based investigation into the daily precipitation variability in the Yangtze River Delta with rapid urbanization. Theor. Appl. Climatol. 2012. [Google Scholar] [CrossRef]
  42. Sang, Y.F.; Wang, D.; Wu, J.C.; Zhu, Q.P.; Wang, L. Wavelet-based analysis on the complexity of hydrologic series data under multi-temporal scales. Entropy 2011, 13, 195–210. [Google Scholar] [CrossRef]

