Searching for Next Single-Phase High-Entropy Alloy Compositions

1
National Energy Technology Laboratory, 1450 Queen Ave SW, Albany, OR 97321, USA
2
URS Corporation, P.O. Box 1959, Albany, OR 97321, USA
*
Author to whom correspondence should be addressed.
Entropy 2013, 15(10), 4504-4519; https://doi.org/10.3390/e15104504
Submission received: 22 September 2013
/
Revised: 11 October 2013
/
Accepted: 16 October 2013
/
Published: 18 October 2013
(This article belongs to the Special Issue High Entropy Alloys)
Abstract
:There has been considerable technological interest in high-entropy alloys (HEAs) since the initial publications on the topic appeared in 2004. However, only several of the alloys investigated are truly single-phase solid solution compositions. These include the FCC alloys CoCrFeNi and CoCrFeMnNi based on 3d transition metals elements and BCC alloys NbMoTaW, NbMoTaVW, and HfNbTaTiZr based on refractory metals. The search for new single-phase HEAs compositions has been hindered by a lack of an effective scientific strategy for alloy design. This report shows that the chemical interactions and atomic diffusivities predicted from ab initio molecular dynamics simulations which are closely related to primary crystallization during solidification can be used to assist in identifying single phase high-entropy solid solution compositions. Further, combining these simulations with phase diagram calculations via the CALPHAD method and inspection of existing phase diagrams is an effective strategy to accelerate the discovery of new single-phase HEAs. This methodology was used to predict new single-phase HEA compositions. These are FCC alloys comprised of CoFeMnNi, CuNiPdPt and CuNiPdPtRh, and HCP alloys of CoOsReRu.
Keywords:
high-entropy alloys; ab initio molecular dynamics simulations; CALPHAD; pair correlation function; diffusion constants; phase diagrams; solid solution; FCC; BCC; HCPPACS Codes:
05.70.-a, 81.30.Bx, 31.15.A-, 61.25.Mv1. Introduction
High-entropy alloys (HEAs) have attracted worldwide attention from the materials science and engineering community since the first few papers on the subject were published in 2004 [1,2] and 2005 [3,4]. Although HEAs originally referred to multi-component (N ≥ 5) solid solution phases with equal or near-equal molar ratios [1], the vast majority of the published reports concern multi-phase alloys rather than single-phase solid solution alloys. In this scenario, multiple principal elemental partitioning between the different phases reduces the configurational entropy of each phase. To date, only a few compositions have been reported that result in a single-phase solid solution. They either have a face-centered cubic (FCC) or body-centered cubic (BCC) structure, depending on their constituent elements. The FCC alloys, including CoCrFeNi [5] and CoCrFeMnNi [2], are based on 3d transition metals. The BCC alloys, including NbMoTaW [6,7], NbMoTaVW [6,7], and HfNbTaTiZr [8], are based on refractory metals. Effort has been made to fabricate hexagonal closed-packed (HCP) HEAs, but without success [9].
Zhang et al. [10] proposed empirical rules based on liquid enthalpy using the Miedema model [11] and atomic size difference after surveying a wide range of alloy compositions. They claimed that an enthalpy value range between −15 and +5 kJ/mol and an atomic size difference of less than 5% favors solid solution phase formation. The statement makes general physical sense and can be viewed as an extension of the Hume-Rothery rules of binary systems to multi-component systems. Too large a negative enthalpy of formation causes formation of intermetallics, while too positive an enthalpy often results in phase separation into terminal phases with low mutual solubilities. However, these enthalpy values from the Miedema model are not accurate, and thus more reliable enthalpy data for different structures (BCC, FCC, HCP) from density functional theory (DFT) and CALculations of PHAse Diagrams (CALPHAD) modeling are needed. Secondly, there exist many compositions that satisfy these rules but form multi-phase alloys instead. This indicates the necessity of developing more restrictive criteria (e.g., at atomic level) for single-phase solid solution formation.
Recently Guo et al. [12] claimed that FCC solid solution are stable at higher valence electron concentration (VEC) (≥ 8) and lower VEC (< 6.87) for BCC solid solution. This conclusion is consistent with the general trend of VEC vs. crystal structure for pure metallic elements in the periodic table. This effective VEC parameter can be viewed as complementary to the criteria of Zhang et al. [10]. The reason is simple: mixing FCC (BCC) elements with high (low) valence electrons in equal atomic ratio does not always guarantee it will form a FCC (BCC) solid solution.
Lack of an effective scientific-based means for predicting solid solution phase formation in multi-component systems is one of the main reasons why only a limited number of single-phase HEAs have been reported and studied (two FCC and three BCC alloys compositions). This constitutes the motivation of this study: to develop a computational approach for predicting single-phase HEA compositions. The approach outlined in this report uses predictive ab initio molecular dynamics (AIMD) simulations to investigate the nature of interatomic interaction and the CALPHAD method for calculating multi-component phase diagrams. By combining the computational simulations with inspection of existing binary and ternary phase diagrams, new single-phase FCC and HCP multi-component solid solution HEA compositions were predicted.
2. Computational Methodologies
A distinct advantage of AIMD simulations is their predictive nature, since they are based on quantum mechanics. Consequently the development of empirical interaction potentials, which need to be fitted against experimental or DFT data in classical MD simulations, are no longer needed. Since the DFT method calculates the instantaneous forces acting on atoms, AIMD simulations [13,14] can be used to predict individual atomic trajectories of solids or liquids held at a constant elevated temperature. However, the tradeoff is the very high computational cost, limited to small systems (typically several hundred atoms) and a short period of time (~ 10–100 ps). The diffusion rate in the solid state is orders of magnitude smaller than that in the liquid state, and hence it is usually difficult to equilibrate the system in the solid state (e.g., phase transformations). Previous work by Kao et al. [15] using the tight-binding method indicates that the melt-quenched alloys tend to show a liquid-like solidified structure when there are five or more elements, favoring high-entropy phase formation.
The AIMD simulations were performed using the plane-wave pseudo-potential software, Vienna Ab Initio Simulation Package (VASP) [16,17]. Projector augmented-wave (PAW) potentials [18] were used as supplied with VASP. The revised Perdew-Burke-Ernzerhof [19] gradient approximation to the exchange-correlation functional was used. Cubic supercells of 200 atoms that correspond to the compositions of Al1.3CoCrCuFeNi [20], HfNbTaTiZr, and CuNiPPdPt [21] were built. The choice of these three representative compositions is that they form multi-phases, single-phase solid solution, and amorphous structure upon cooling from liquid respectively. Note that there are four phases in CuNiPPdPt at T = 630 K [21] while the amorphous structure can only be obtained using fast cooling rate. All the calculations were carried out in a canonical ensemble, i.e., constant mole, volume, and temperature, with atomic-configuration relaxation and temperature controlled by a Nose thermostat [22]. This arrangement requires the accurate determination of the densities of the liquid and solid. This is achieved by adjusting the volume of the cell so that the pressure is zero to reach equilibrium. The simulations were performed at the Γ point only (i.e., the origin of the first Brillion zone), with a time step of 1 fs. A “medium” precision setting, as described in VASP, was used. The electronic-energy-convergence criterion was set to 1 × 10⁻⁴ meV/at. AIMD simulations were performed at temperatures of 1,873, 2,273, and 1,200 K for a total simulation time of 30, 35, and 30 ps with the plane-wave cutoff energy set at 273.2, 223.7, and 273.2 eV for Al1.3CoCrCuFeNi, HfNbTaTiZr, and CuNiPPdPt respectively. Phase diagram calculations were done using the TTNI-8 database supplied with the ThermoCalc software [23] although other databases such as SSOL5 and TCNI5 were also tested and compared.
3. Results and Discussions
3.1. AIMD Simulations
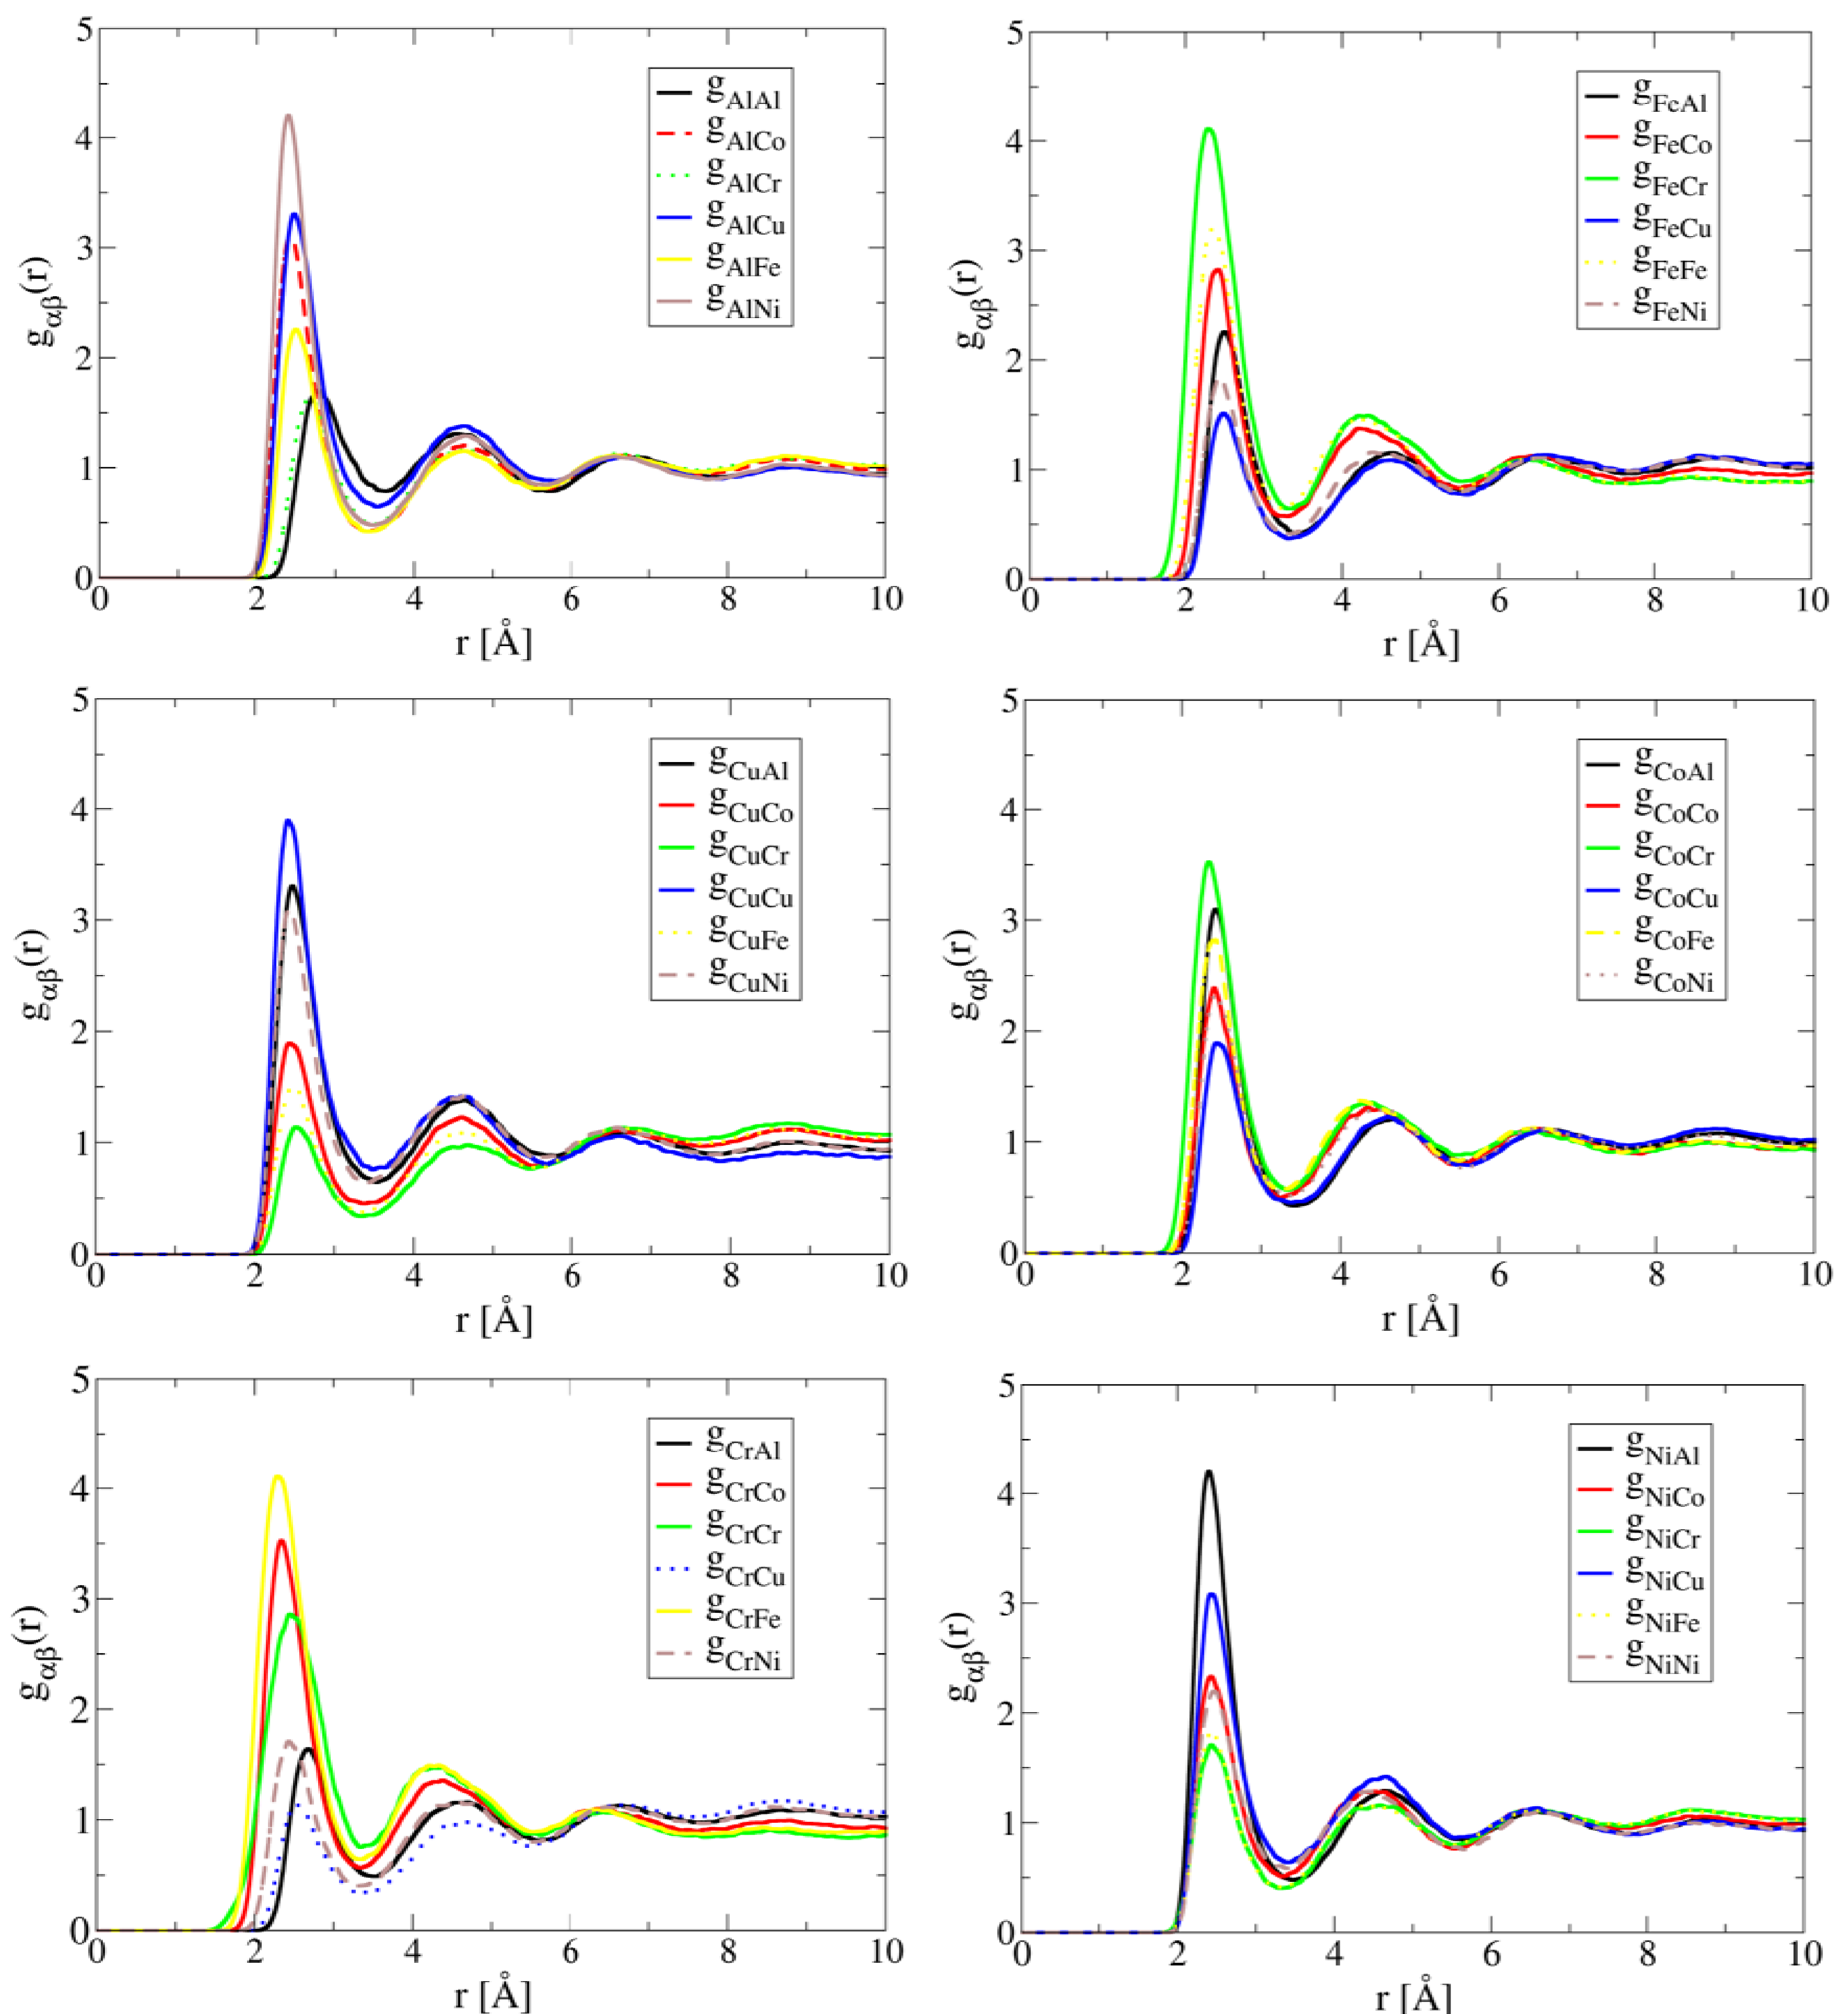
The simulated partial correlation functions of Al1.3CoCrCuFeNi at 1,873 K are shown in Figure 1. Note that the preferred correlation for both Al and Ni is the Al-Ni pair, the Cr-Fe pair for both Cr and Fe, the Co-Cr pair for Co, and the Cu-Cu pair for Cu. These results suggest the existence of preferred short-range ordering of Al-Ni, Co-Cr and Cr-Fe pairs in the liquid. These structural features in liquid are consistent with experimental observation of formation of B2-NiAl [20,24] and Cr-Co-Fe rich phase [20,25] during solidification. The preferred Cu-Cu pair correlation suggests Cu tends to segregate in the liquid. This leads to the formation of a Cu-rich phase during solidification, which is also consistent with experimental observations [4,20,24]. For alloys with high Al contents (x > 0.5), multiple phases (FCC, BCC and B2) have been also observed to form [4]. For example, Singh et al. [24] using three-dimensional atom probe has confirmed the presence of Cu-rich precipitates, Al-Ni-rich plates, and Cr-Fe-rich in the cast AlCoCrCuFeNi HEA.
Figure 1.
AIMD simulated partial correlation functions of Al1.3CoCrCuFeNi at 1,873 K after the simulation time of 30 ps, showing Cu clustering and short-range ordering between Al-Ni, Fe-Cr and Cr-Co pairs.
Figure 1.
AIMD simulated partial correlation functions of Al1.3CoCrCuFeNi at 1,873 K after the simulation time of 30 ps, showing Cu clustering and short-range ordering between Al-Ni, Fe-Cr and Cr-Co pairs.
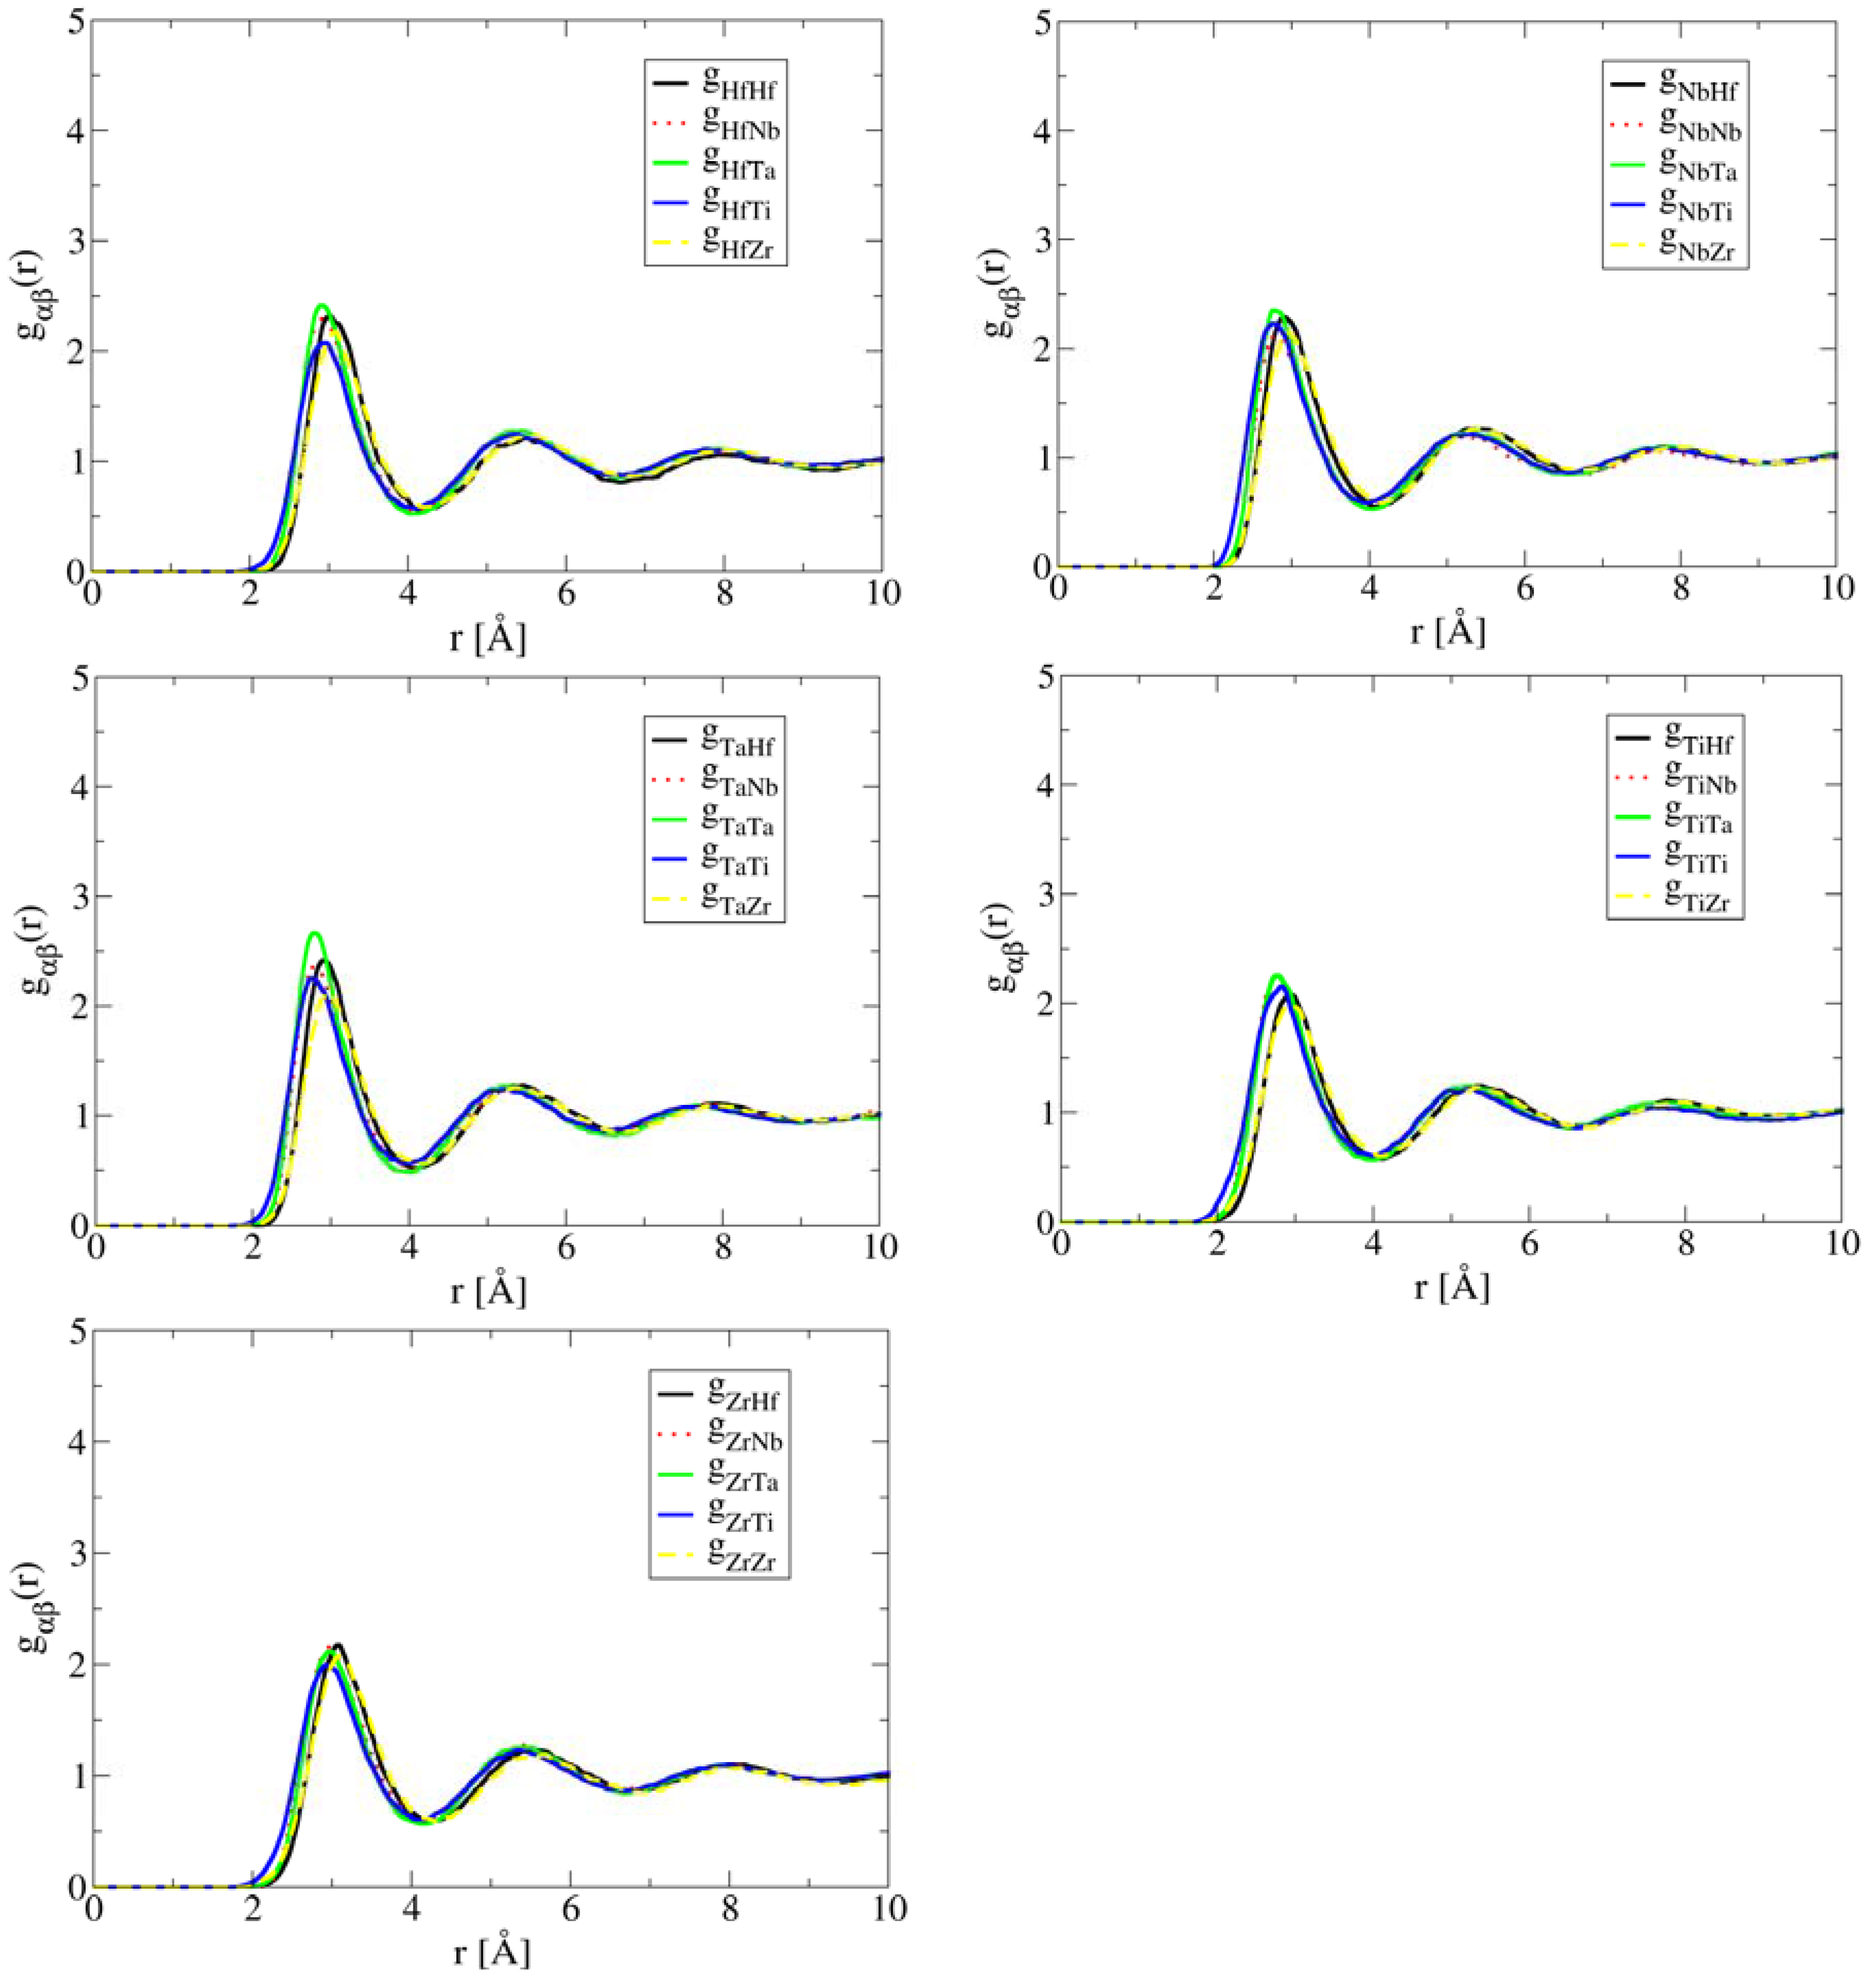
The close correlation between short-range ordering and segregation in liquid and phase formation during solidification demonstrates the important role of liquid structure in the development of the solid state microstructure of HEAs. In other words, single-phase solid solution HEAs are promoted by compositions in which preferred short-range ordering and segregation are absent in the liquid structure. This is exactly the case of HfNbTaTiZr. As shown in Figure 2, the simulated partial correlation functions of HfNbTaTiZr at 2,773 K are uniform, suggesting that the atoms are much more randomly distributed than the case of Al1.3CoCrCuFeNi. As a result, a single BCC phase forms in the solid state.
Figure 2.
AIMD simulated partial pair correlation functions for HEA HfNbTaTiZr at T = 2,773 K after 35 ps simulation time, showing lack of short-range ordering or segregation.
Figure 2.
AIMD simulated partial pair correlation functions for HEA HfNbTaTiZr at T = 2,773 K after 35 ps simulation time, showing lack of short-range ordering or segregation.

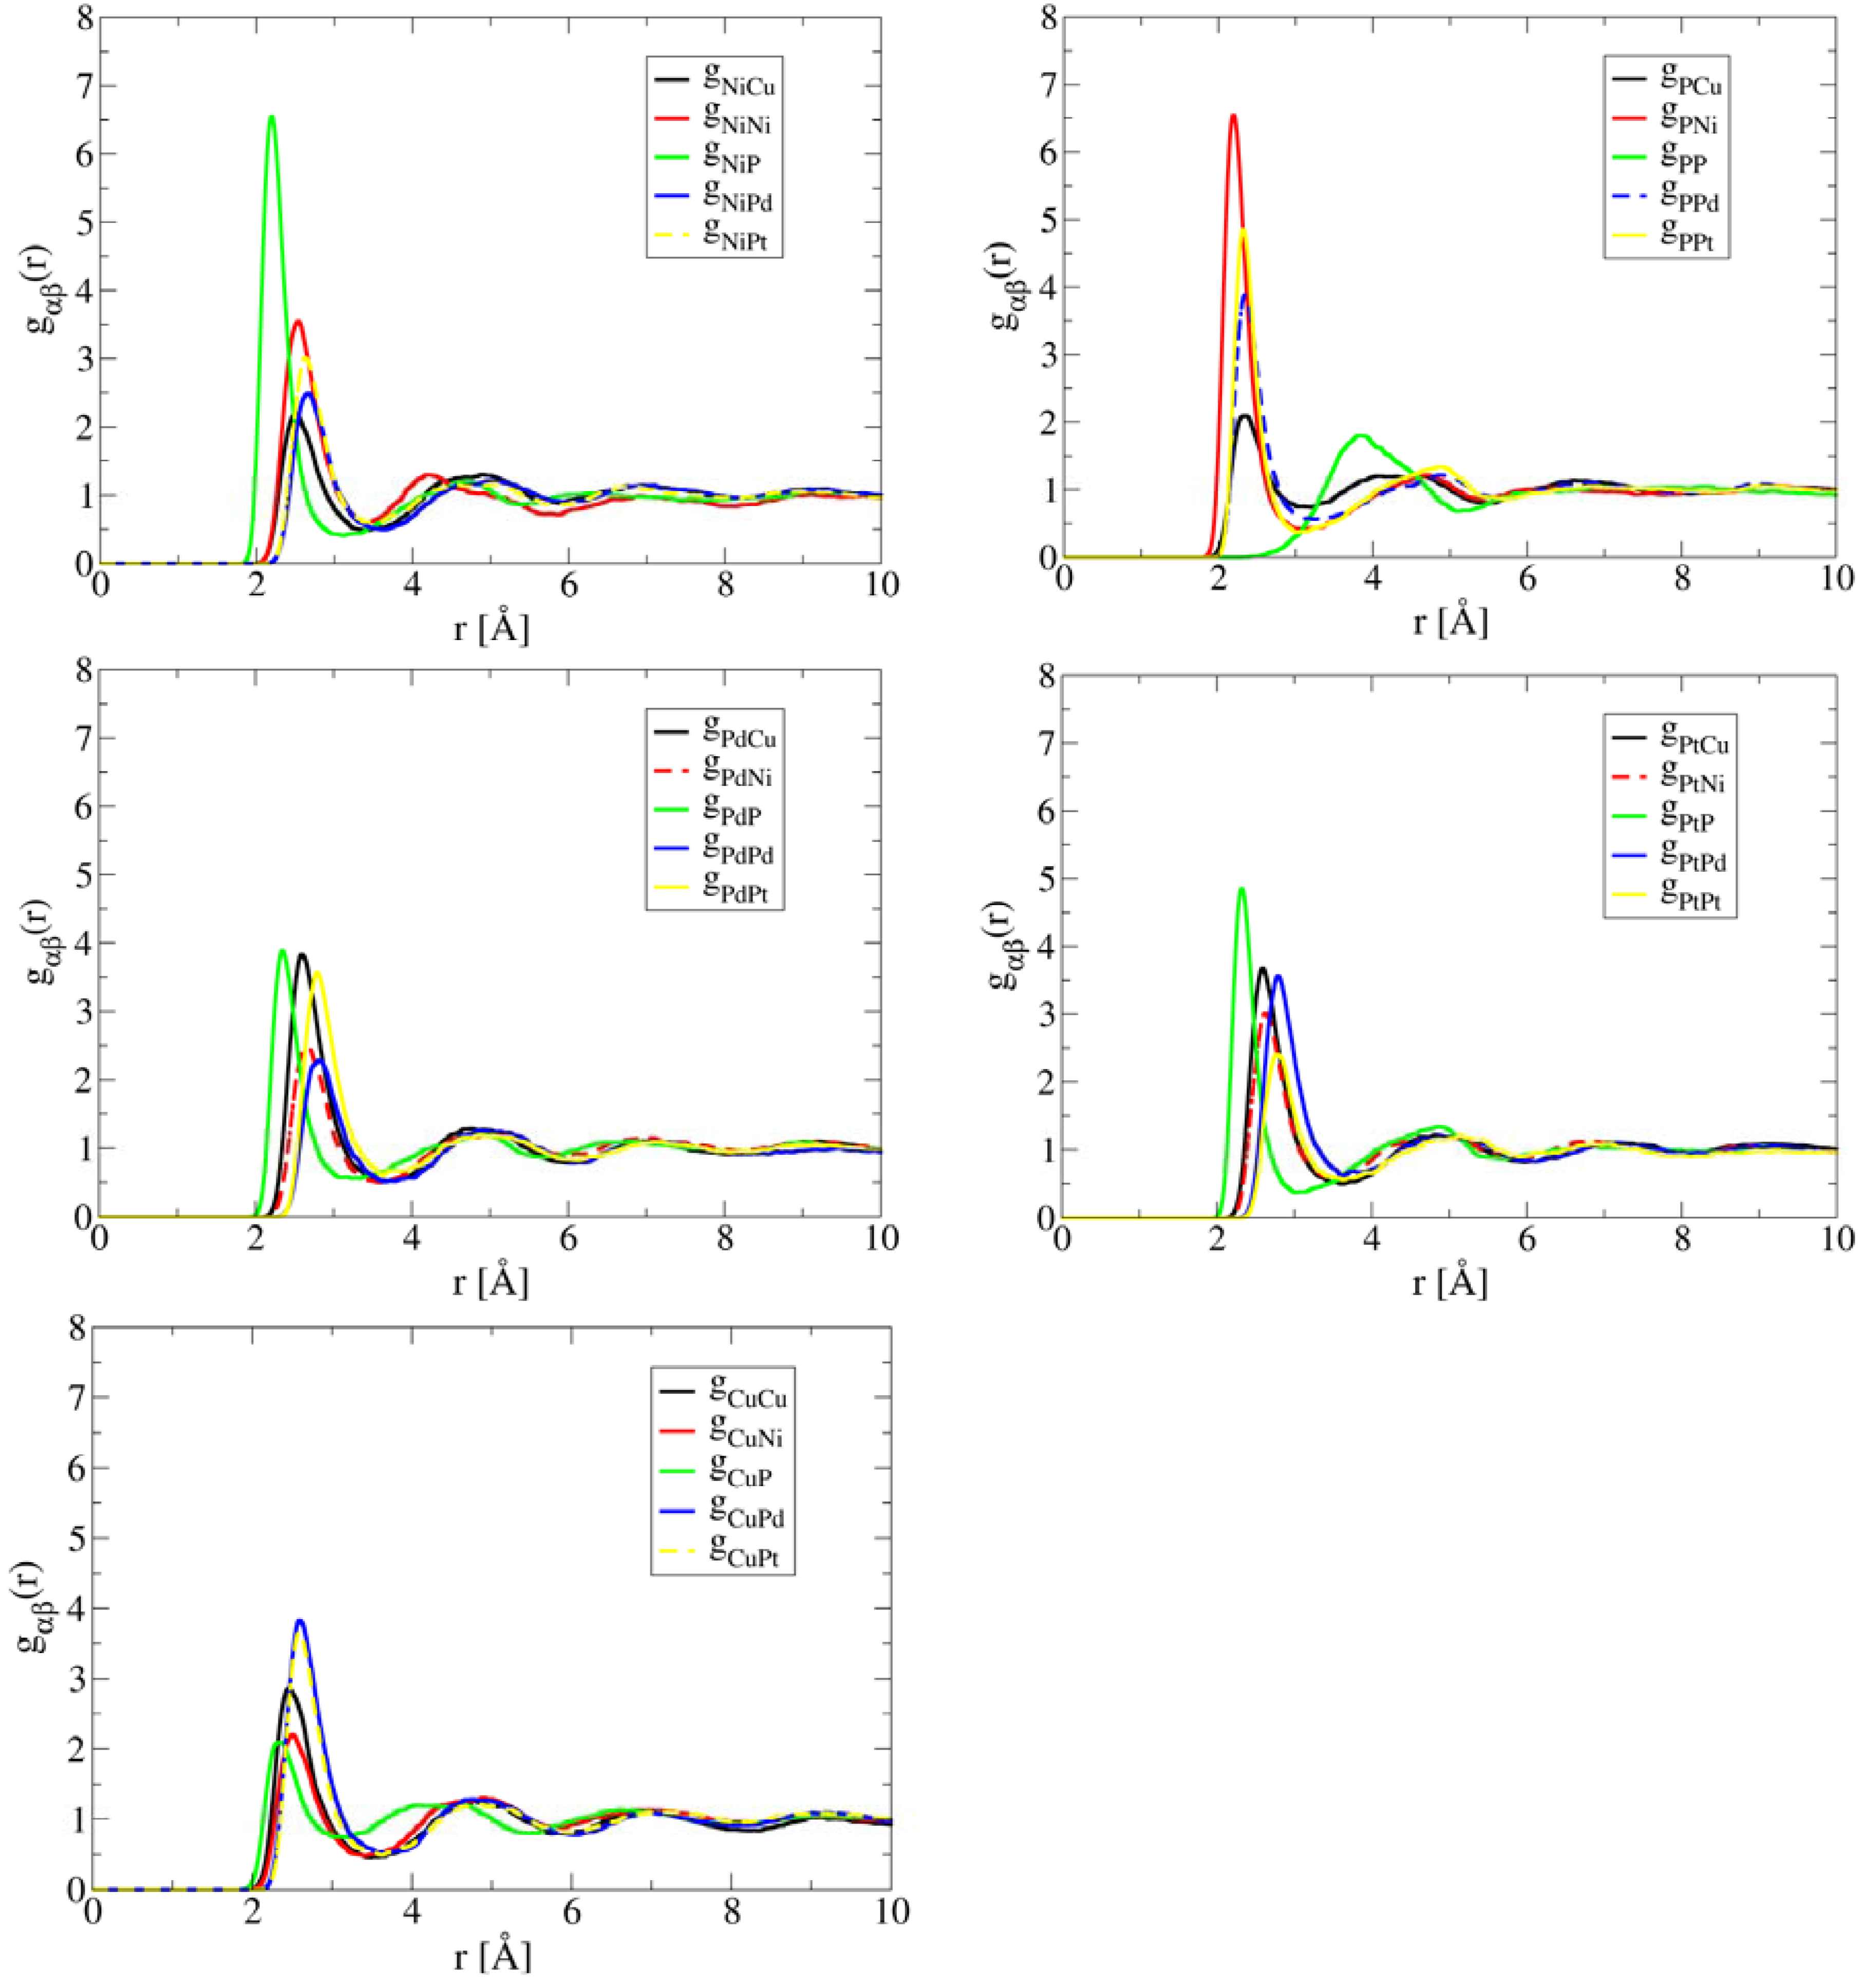
Figure 3 plots the pair correlations in high-entropy bulk metallic glass (HE-BMG) CuNiPPdPt. The result contrasts Al1.3CoCrCuFeNi and HfNbTaTiZr remarkably. The inclusion of metalloid element P causes strong Ni-P pair correlation, followed by Pt-P, and then Pd-P. The bond length of Ni-P pair in liquid is ~ 2.2 Å which is noticeably shorter than the metal-metal bonds because a P atom has much smaller diameter than the metals (Pd, Pt, Ni, and Cu). Note that this distance is fairly close to the Ni-P bond-length of tetragonal Ni3P which is 2.3 Å. The distance for the nearest P-P pairs is about 3.9 Å, indicating P atoms are well separated from each other. Based on the significant contrast among pair correlations shown in Figure 3, intuitively one would expect formation of Ni-P intermetallic phase as the primary phase during solidification, not a solid solution phase. While there is no report in phase diagram or equilibrium solidification of this alloy, Takeuchi et al. [21] studied the glass forming ability of this alloy and they were able to cast an amorphous cylinder of 10 mm in diameter. Annealing the as-cast BMG at T = 630 K for 2.4 ks results in formation of a mixture of four phases, namely tetragonal Ni3P, FCC Ni2Pd2P, FCC (Ni, Pd) solid solution, and cubic PtP2. Details of the crystal structure and lattice parameters of these phases can be found from [21,26].
Figure 3.
AIMD simulated partial pair correlation functions for CuNiPPdPt at T = 1,200 K after 30 ps simulation time, showing strong short-range ordering between P and Ni.
Figure 3.
AIMD simulated partial pair correlation functions for CuNiPPdPt at T = 1,200 K after 30 ps simulation time, showing strong short-range ordering between P and Ni.
By examining the atomic trajectory, the diffusion constants can be obtained by plotting the mean square displacement (MSD) versus time using the following equation:
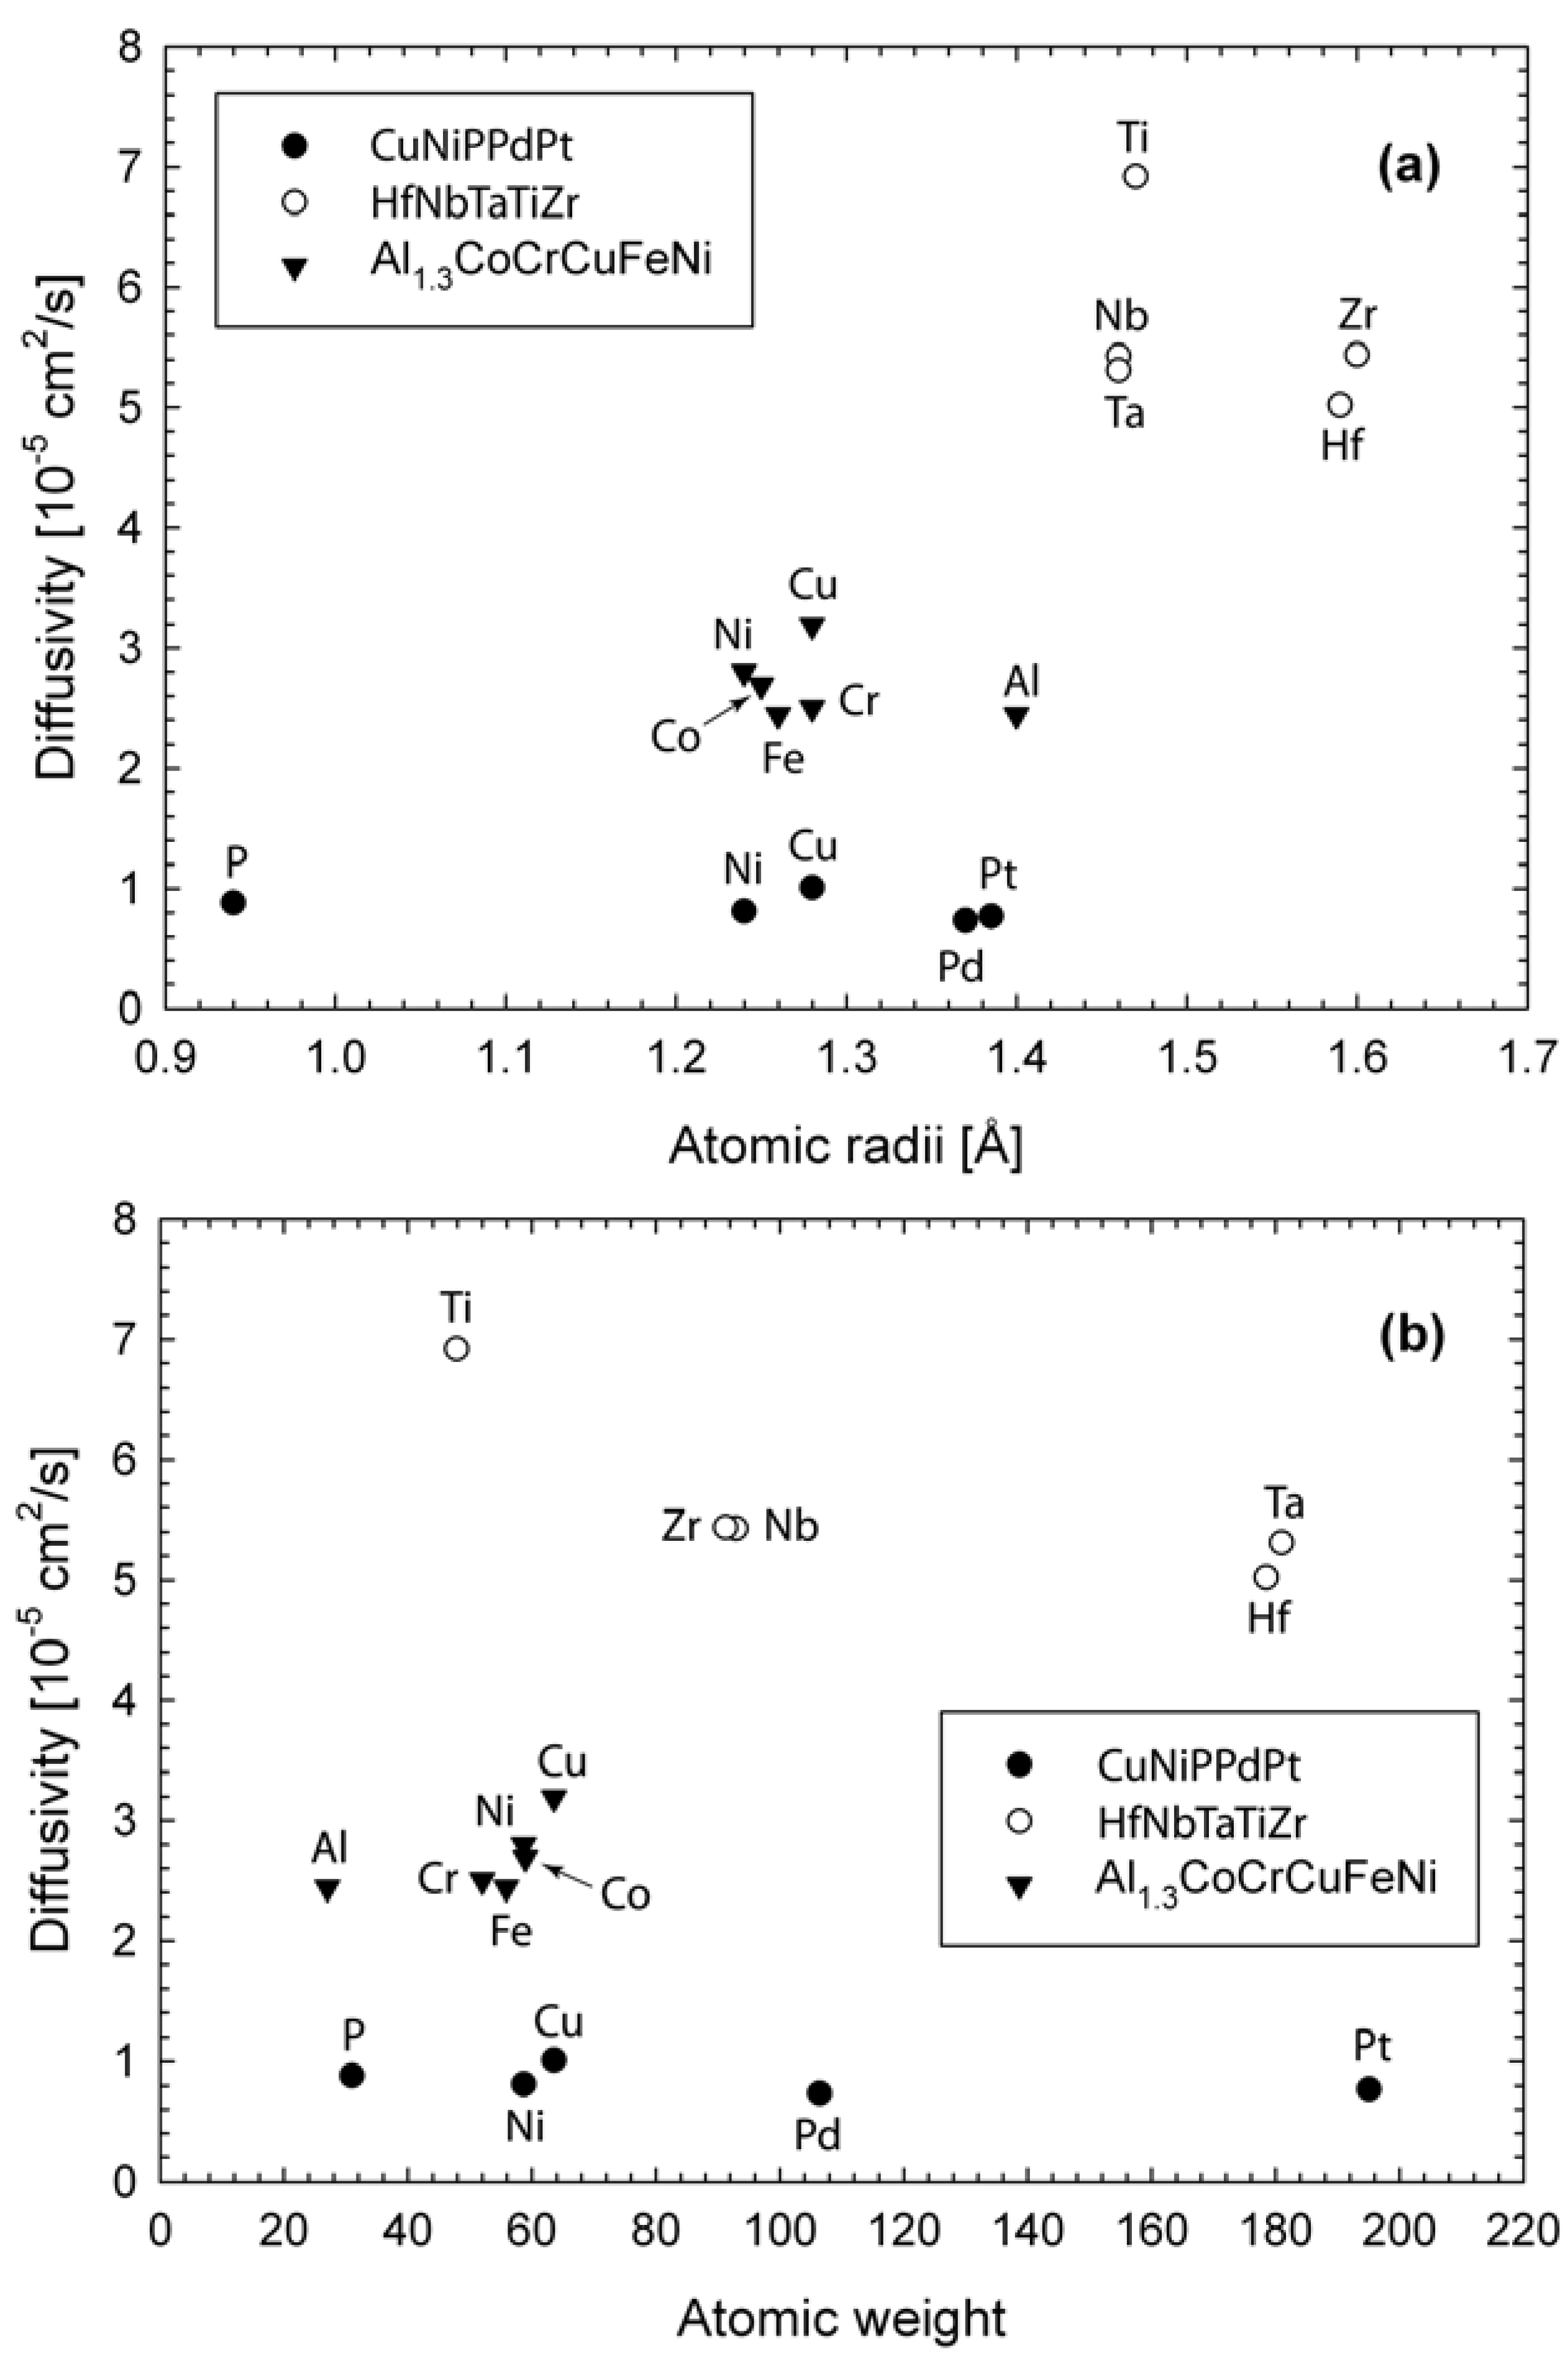
where is the self-diffusion constant of species i, and and denotes the atomic position of species i at time t and t = 0 respectively. The brackets denotes an average over all the same species. The plots are linear (not shown), and the predicted diffusion constants are listed in Table 1. The difference in self-diffusion constants among these three alloys is dictated by the simulation temperatures. High temperatures correspond to high diffusivity. Comparison of diffusivities with respect to atomic radii and atomic weight are shown in Figure 4. For Al1.3CoCrCuFeNi, Cu is the fastest diffusion species and its diffusivity is about 31% higher than Al or Fe. Cu segregation enhances Cu diffusivity, while strong correlation between Al and the transition metals (Ni, Co, Cu) and large atomic size of Al make contributions to slower diffusion rate of Al. For HfNbTaTiZr, Ti diffuses the fastest, while Hf the slowest. Although Ti has similar atomic size to Nb and Ta, its atomic weight is the lightest. The trend in the diffusion constants in the descending order (Ti > Nb ~ Zr > Ta > Hf) seems to follow the order of the atomic size and weight of the constituent elements, further confirming lack of strong chemical ordering or segregation. For CuNiPPdPt, P has the smallest atomic size but its diffusivity is noticeably smaller than Cu which has the highest diffusivity. This is a direct consequence of strong bonding between P and metals. Furthermore, ongoing AIMD simulations by the authors on other HE-BMG that do not contain metalloids such as CuHfNiTiZr [27] also clearly show preferred pair correlations between the Hf/Ti/Zr group and the Cu/Ni group (not shown). In summary, in single-phase HEA of HfNbTaTiZr, the diffusivities seem to correlate with the atomic size and weight, while for multiphase Al1.3CoCrCuFeNi and HE-BMG of CuNiPPdPt and CuHfNiTiZr, chemical interaction plays a big role in addition to atomic size.

Table 1.
Predicted atomic diffusivity [10−5 cm2/s] in Al1.3CoCrCuFeNi, HfNbTaTiZr and CuNiPPdPt from the present AIMD simulations at temperatures of 1,873, 2,273, and 1,200 K, respectively. The metallic atomic radii [Å] [28] except P and the atomic weight of elements are also provided.
| Alloy | Element | Diffusivity | Radii | Weight |
|---|---|---|---|---|
| Al1.3CoCrCuFeNi | Ni | 2.8 | 1.24 | 58.69 |
| Co | 2.69 | 1.25 | 58.93 | |
| Fe | 2.44 | 1.26 | 55.85 | |
| Cu | 3.19 | 1.28 | 63.55 | |
| Cr | 2.5 | 1.28 | 52 | |
| Al | 2.44 | 1.4 | 26.98 | |
| HfNbTaTiZr | Ti | 6.92 | 1.47 | 47.87 |
| Nb | 5.43 | 1.46 | 92.91 | |
| Zr | 5.44 | 1.6 | 91.22 | |
| Hf | 5.02 | 1.59 | 178.49 | |
| Ta | 5.31 | 1.46 | 180.95 | |
| CuNiPPdPt | P | 0.88 | 0.94 | 30.97 |
| Ni | 0.81 | 1.24 | 58.69 | |
| Cu | 1.01 | 1.28 | 63.55 | |
| Pd | 0.74 | 1.37 | 106.42 | |
| Pt | 0.77 | 1.385 | 195.08 |
Figure 4.
Diffusion constants predicted from AIMD simulations: (a) atomic size effect; (b) atomic weight effect. The simulation temperature is 1,873, 2,773, 1,200 K for Al1.3CoCrCuFeNi, HfNbTaTiZr, and CuNiPPdPt respectively.
Figure 4.
Diffusion constants predicted from AIMD simulations: (a) atomic size effect; (b) atomic weight effect. The simulation temperature is 1,873, 2,773, 1,200 K for Al1.3CoCrCuFeNi, HfNbTaTiZr, and CuNiPPdPt respectively.
3.2. CALPHAD Calculations
While AIMD simulations can help reveal atomic structure and diffusion constants in the liquid, the results are indirectly linked to HEA formation. The competing phases in the solid state are equally important, and thus the phase relationships (namely phase diagrams) need to be determined. Unfortunately, there is very limited phase diagram information available on HEAs and only from recent studies [4,29]. Although various commercial databases have developed via the CALPHAD method since 1970s, database development targeted for HEAs is also limited to the study by Zhang et al. [30] and Senkov et al. [31].
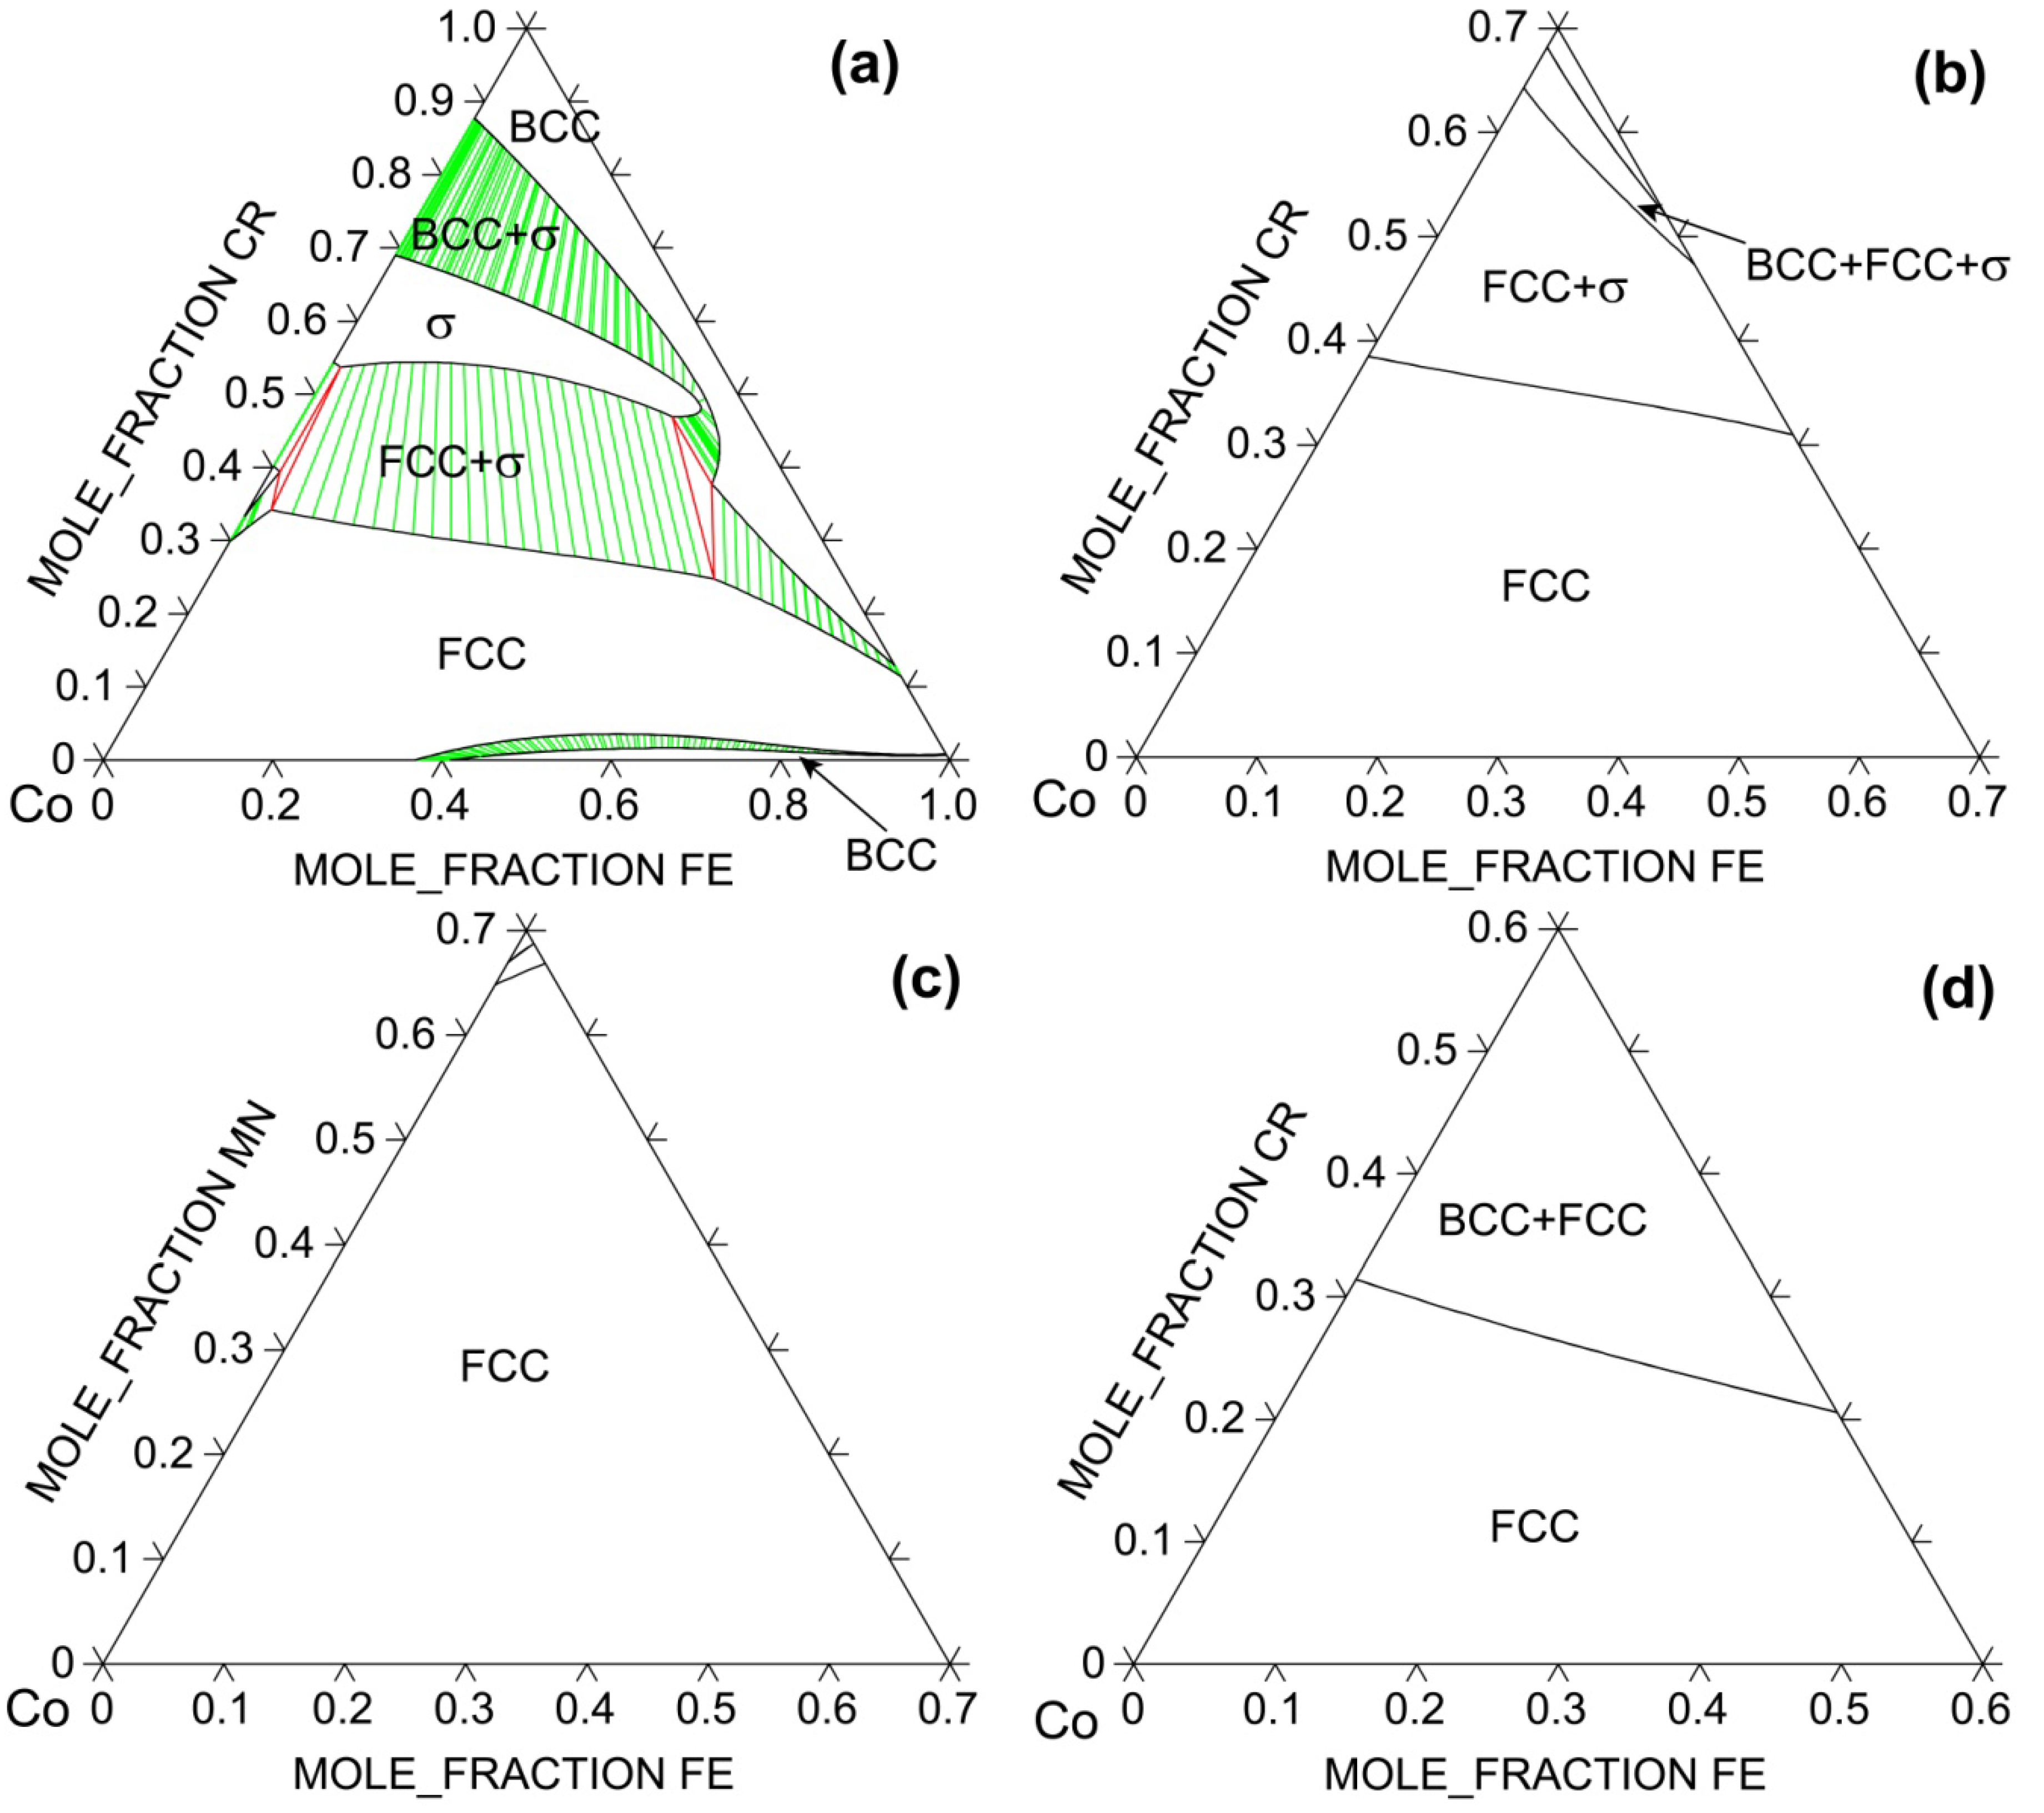
In the following examples, thermodynamic calculations are carried out to show how solid solution phase becomes stabilized against intermetallic σ phase as more favorable components are added to the system. The space group notation for σ phase is P42/mnm with Pearson symbol of tP30. It is a very stable compound in Co-Cr binary [26]; it decomposes at 1,282° C and has a homogeneity range of 59–73 at% Cr even at 600° C [26]. σ phase is also stable in Cr-Fe but only within a narrow temperature range of 520–840° C [26]. Figure 5 shows how the isothermal section at 900° C evolves with respect to the alloy system using the TTNI8 database. For the Co-Cr-Fe ternary system, FCC solid solution phase dominates at low Cr contents only. This is understandable since Cr has a BCC structure and is known as a strong BCC stabilizer in steels. Binary CoCr2 σ phase has large solubility for Fe and thus it extends greatly into the ternary. Adding Ni to the ternary significantly expands the phase field of FCC phase, suggesting the importance of configurational entropy of the solid solution against σ phase. The largest FCC phase field at 900° C occurs in Co-Fe-Mn-Ni, followed by Co-Cr-Fe-Ni and then Co-Cr-Fe-Mn-Ni. Co, Mn and Ni are known potent FCC stabilizers in steels.
Figure 5.
Calculated 900° C isotherms for (a) Co-Cr-Fe; (b) Co-Cr-Fe-0.25Ni; (c) Co-Fe-Mn-0.25Ni, and (d) Co-Cr-Fe-0.2Mn-0.2Ni systems using TTNI8 database. Note that the database does not have descriptions for all constituent ternaries for (b–d).
Figure 5.
Calculated 900° C isotherms for (a) Co-Cr-Fe; (b) Co-Cr-Fe-0.25Ni; (c) Co-Fe-Mn-0.25Ni, and (d) Co-Cr-Fe-0.2Mn-0.2Ni systems using TTNI8 database. Note that the database does not have descriptions for all constituent ternaries for (b–d).

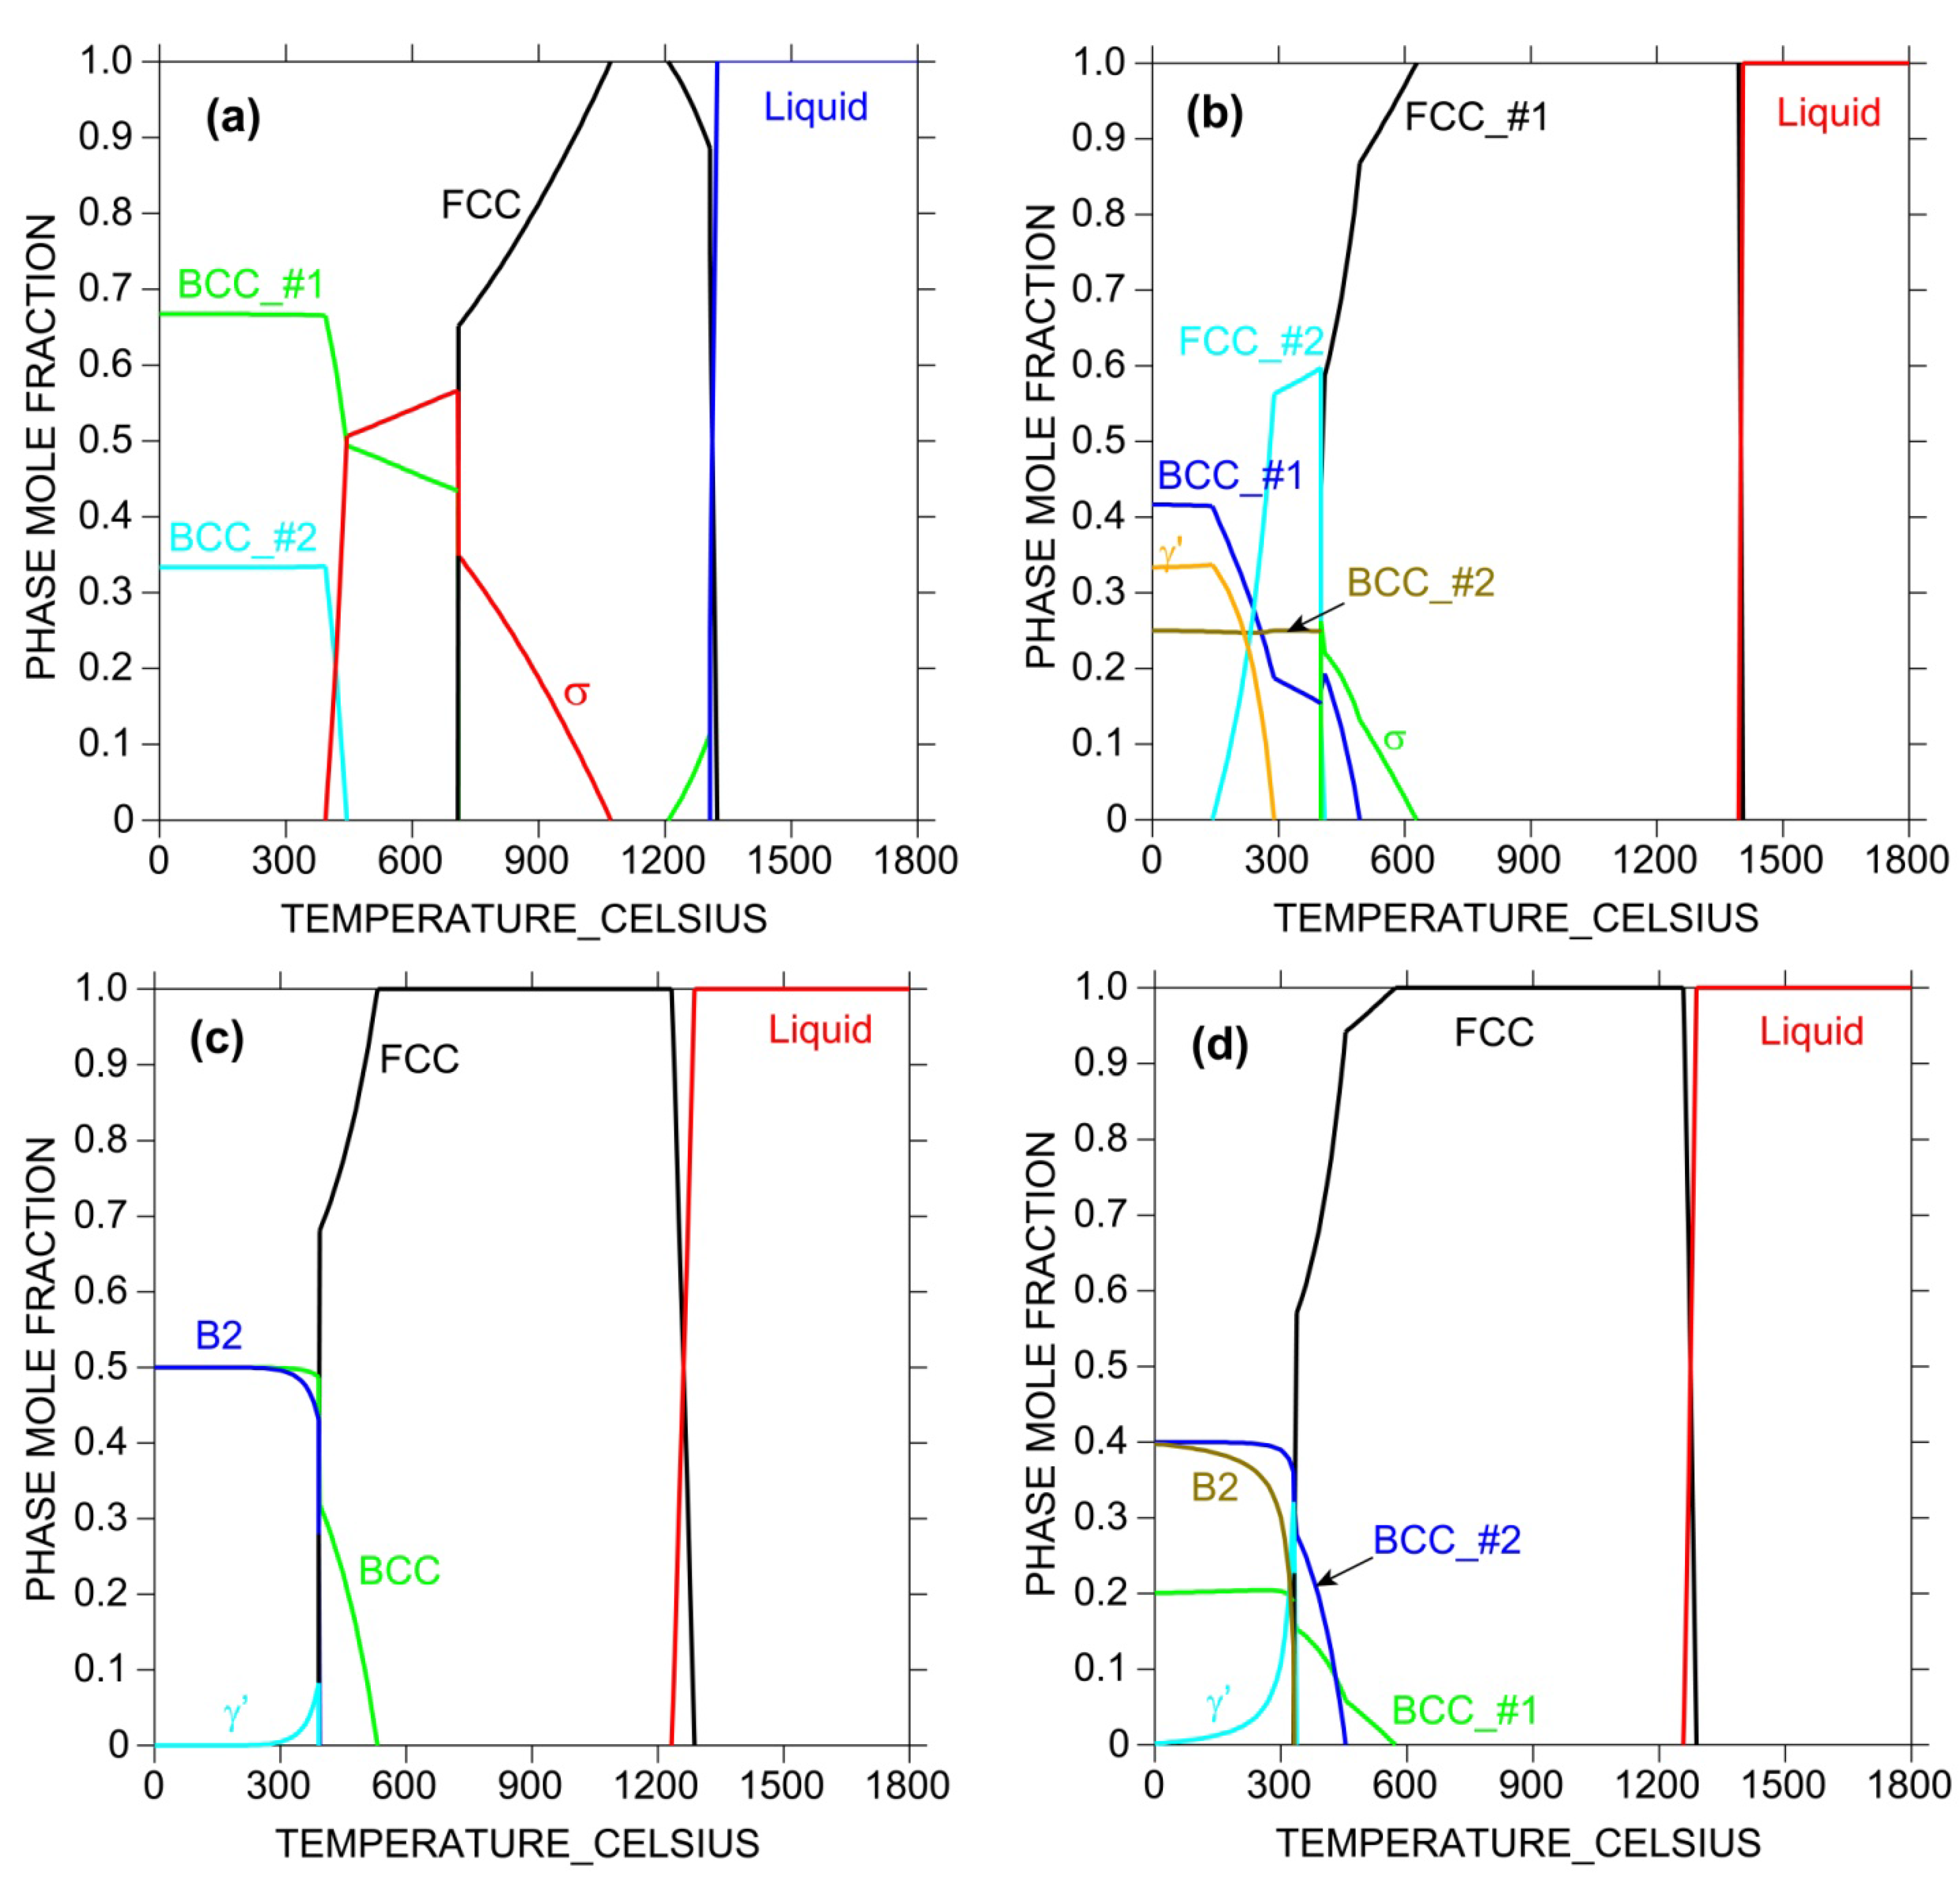
Another useful calculation is the phase mole fraction plot as a function of temperature at fixed composition, as shown in Figure 6. Such plots provide not only the melting point and the temperature range over which the single-phase solid solution phase prevails, but also possible competing intermetallic phases. Only addition of those elements that will stabilize the solid solution phase and destabilize intermetallics formation will effectively enhance HEA formation. Such information is not available if the database does not have physically-based descriptions of these phases, however, AIMD simulations and DFT calculations can be used to assist deriving these descriptions.
Figure 6.
Calculated phase mole fraction as a function of temperature for (a) CoCrFe; (b) CoCrFeNi; (c) CoFeMnNi; and (d) CoCrFeMnNi equi-atomic alloys using TTNI8 database. Note that the database does not have descriptions for all constituent ternaries for (b–d).
Figure 6.
Calculated phase mole fraction as a function of temperature for (a) CoCrFe; (b) CoCrFeNi; (c) CoFeMnNi; and (d) CoCrFeMnNi equi-atomic alloys using TTNI8 database. Note that the database does not have descriptions for all constituent ternaries for (b–d).

Since the TTNI8 database does not cover all the constituent ternaries of those HEA systems, they are crude for HEA design in that sense and the calculated results should be treated with great caution. However, the CALPHAD calculations as shown in Figure 5 and Figure 6 still offer valuable information on alloying strategy and can be used to guide experiments in terms of tailoring composition and heat treatment.
3.3. Hints from Existing Binary and Ternary Phase Diagrams
While CALPHAD can provide useful prediction of phase diagrams to guide experimental design and processing, such calculations are at the most semi-quantitative because of incomplete databases that either do not have thermodynamic descriptions for all edge binaries and ternaries, or are only valid for compositions near one or two principal elements. As a matter of fact, most commercial thermodynamic databases are developed for traditional alloys that are based on one or two principal elements such as Al-, Mg-, Fe-, Ni- and Ti-based alloys, and thus simple extrapolation of these databases into the center of the phase diagrams requires experimental verification. On the other hand, developing thermodynamic databases for HEA systems is also difficult because of a lack of experimental phase diagram information and relevant thermo-chemistry data in these systems.
However, comparison between experimentally reported single-phase HEAs (including CoCrFeNi, CoCrFeMnNi, NbMoTaW, NbMoTaVW, and HfNbTaTiZr) and available phase diagrams [26] suggests that addition of FCC (BCC) stabilizers to a multi-component FCC (BCC) solid solution phase will likely stabilize that phase provided such addition does not promote formation of too stable intermetallics. This conclusion also applies to HCP solid solution alloys. Note that the term “stabilizers” does not mean that they need to have the same crystal structure in their elemental states as the solid solution phase. For example, Al has a FCC structure, but it is a known BCC stabilizer in various multi-principal-element alloys based on 3d transition metals [32]. The mechanisms are discussed in detail from the viewpoints of lattice-strain energies and electronic bonds as well as CALPHAD calculations of lattice stability between BCC, FCC and intermetallic compounds [32]. Likewise, the fact that FCC CoCrFeNi and CoCrFeMnNi alloys have 25 at% and 20 at% solubility for Cr does not alter the nature that Cr is a BCC stabilizer in these systems as illustrated in [30] using CALPHAD method. Rather, it demonstrates the importance of entropy pertaining to solubility; high entropy promotes solubility. In fact, the FCC phase field is much wider in Co-Fe-Ni and Co-Fe-Mn-Ni systems than Co-Cr-Fe-Ni and Co-Cr-Fe-Mn-Ni systems (see Figure 5) because addition of Cr promotes formation of stable intermetallic phases such as σ phase in addition to BCC.
FCC/BCC/HCP stabilizers for a specific solution phase can be obtained from existing binary and ternaries wherever available [26], and DFT calculations can be carried out to predict the enthalpy of formation as a function of arbitrary composition. In the case of refractory metal HEAs such as NbMoTaW and NbMoTaVW, the elements all have a BCC lattice and are all strong BCC stabilizers. In the case of HfNbTaTiZr, Ti, Zr and Hf all have a HCP lattice at low temperatures and a BCC lattice at high temperatures. They all form isomorphous solid solution with Nb and Ta (only at high temperatures for Zr/Hf with Nb/Ta) and can be regarded as BCC stabilizers in this case. However, addition of Cr to these refractory metal-based HEAs causes formation of the C15 Laves phase (FCC, prototype MgCu2) [31,33,34] and formation of two BCC solid solution phases [31,34]. Since Cr has much smaller atomic radii than other refractory metals, their work [31,33,34] indicate the importance of small atomic size difference [10] in HEA design.
Most reported HEAs have centered on 3d transition metals Co-Cr-Fe-Mn-Ni with addition of Al, Si, Ti, Nb, Mo, etc. Through an analysis of this system and others employing the methodology described above, several new HEA compositions are predicted that should form a single-phase alloy from conventional solidification processing methods. These compositions are based on ongoing AIMD simulations by the authors, CALPHAD calculations such as shown in Figure 5 and Figure 6, and existing binary and ternary phase diagrams [26]. The FCC compositions are: CoFeMnNi, CuNiPdPt, and CuNiPdPtRh. Formation of FCC HEA for CoFeMnNi is expected since Co, Mn and Ni are all FCC stabilizers in steels. The present authors noticed a recent study by Praveen et al. [35] reported formation of single-phase FCC in CoFeMnNi using mechanical alloying technique, but it is worth noting that they also observed σ phase formation in CoCrFeNi which is contradictory to [5]. Confirmation of the single-phase nature of FCC solid solution via solidification is currently being conducted.
As for CuNiPdPt, these elements all have a FCC crystal structure, and Ni, Pd and Pt are located in the same column in the periodic table. As a result, an isomorphous solid solution forms in all six edge binaries. While there are no compound formation in Ni-Pd, Pd-Pt, and Cu-Ni binaries, ordered structures form in the others at lower temperatures. Since Rh also forms isomorphous solid solution with Cu, Ni, Pd and Pt (only at higher temperatures for last three), it is not impossible that a single-phase FCC solid solution forms for CuNiPdPtRh.
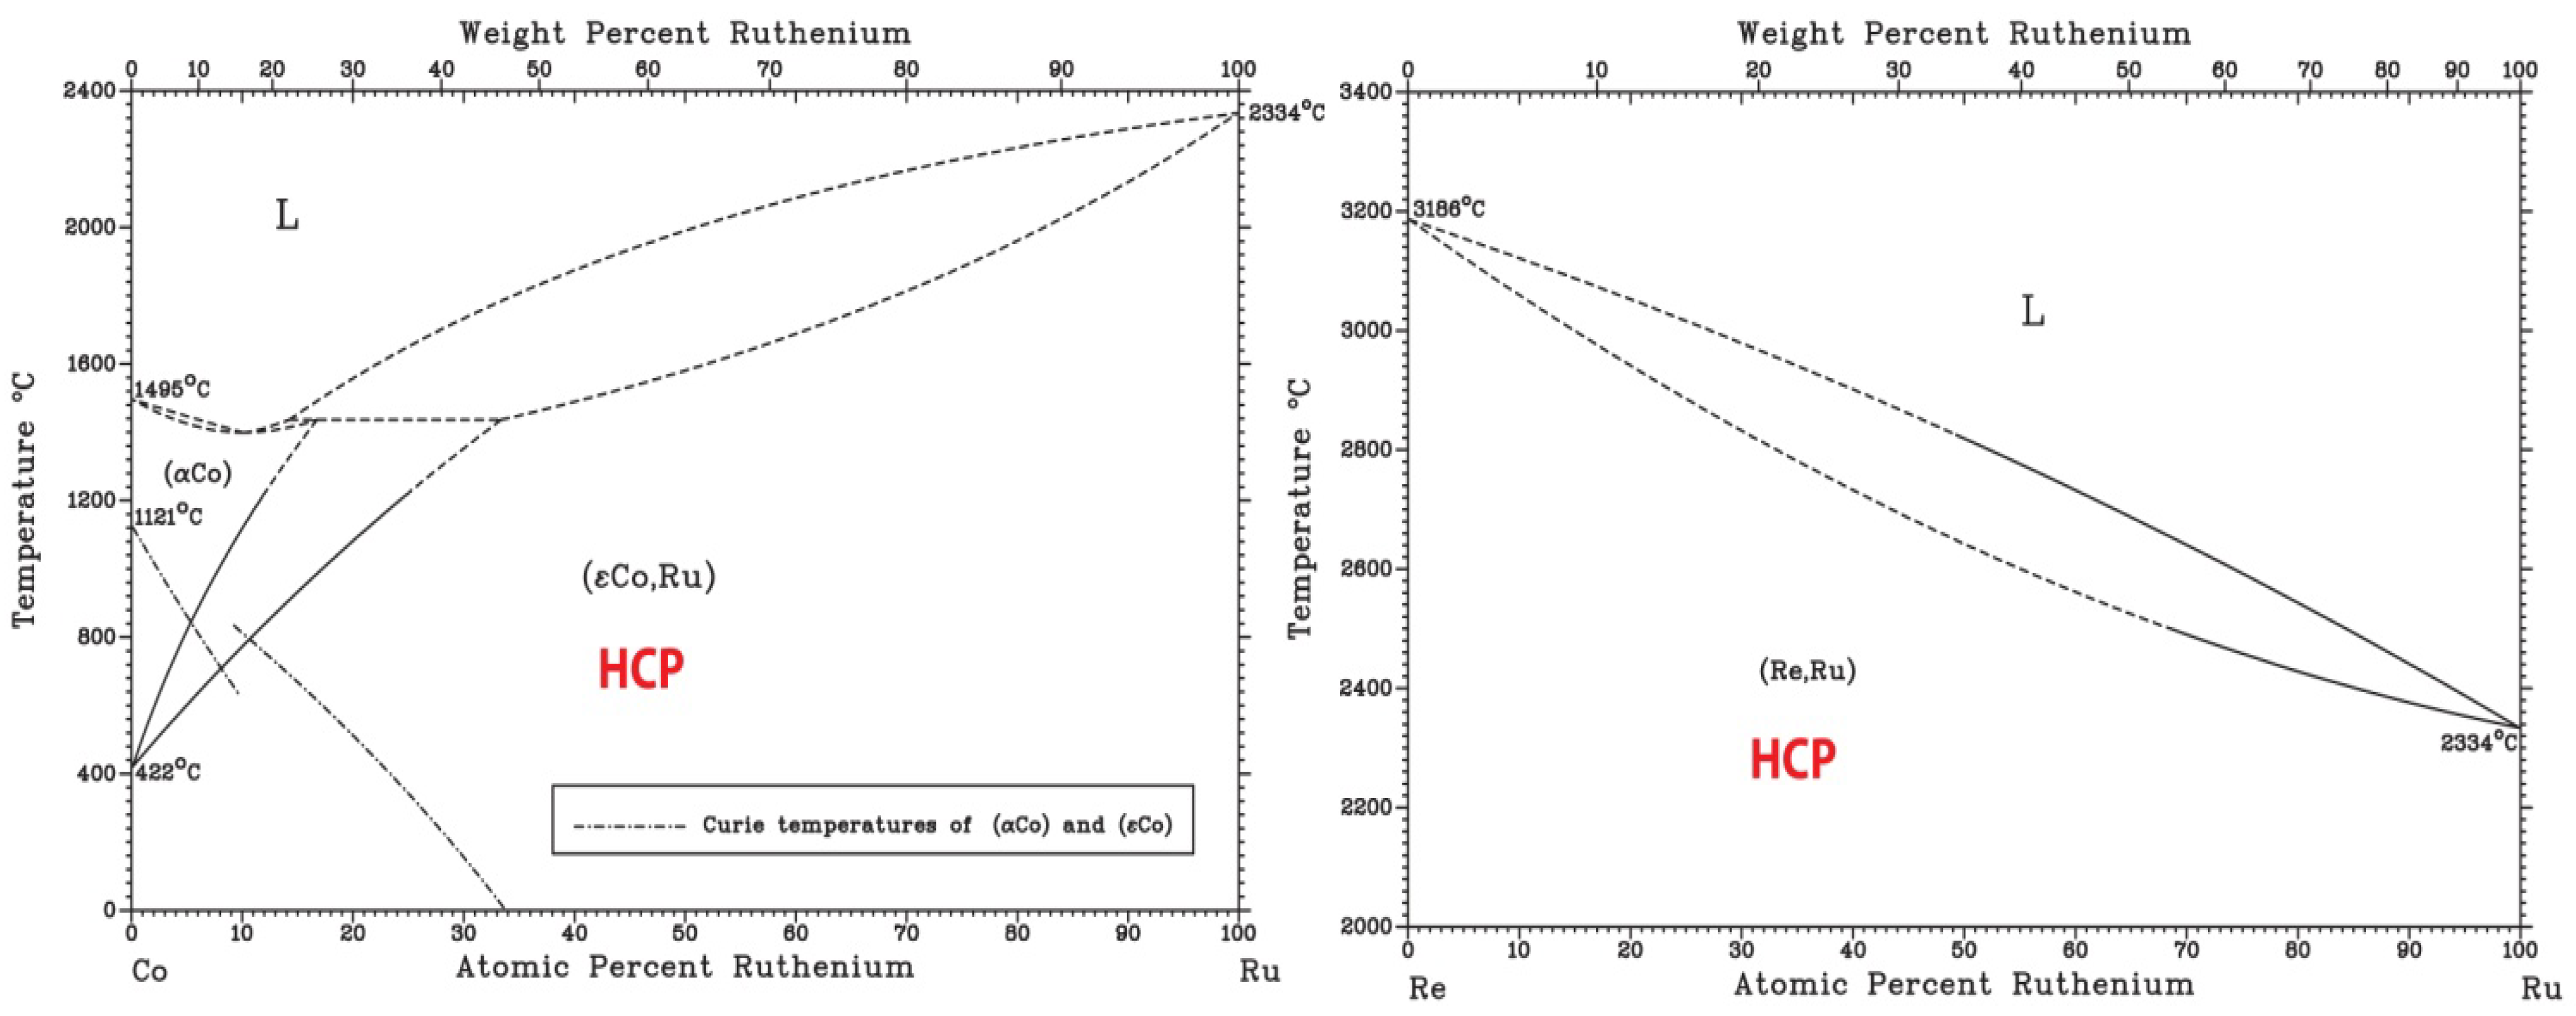
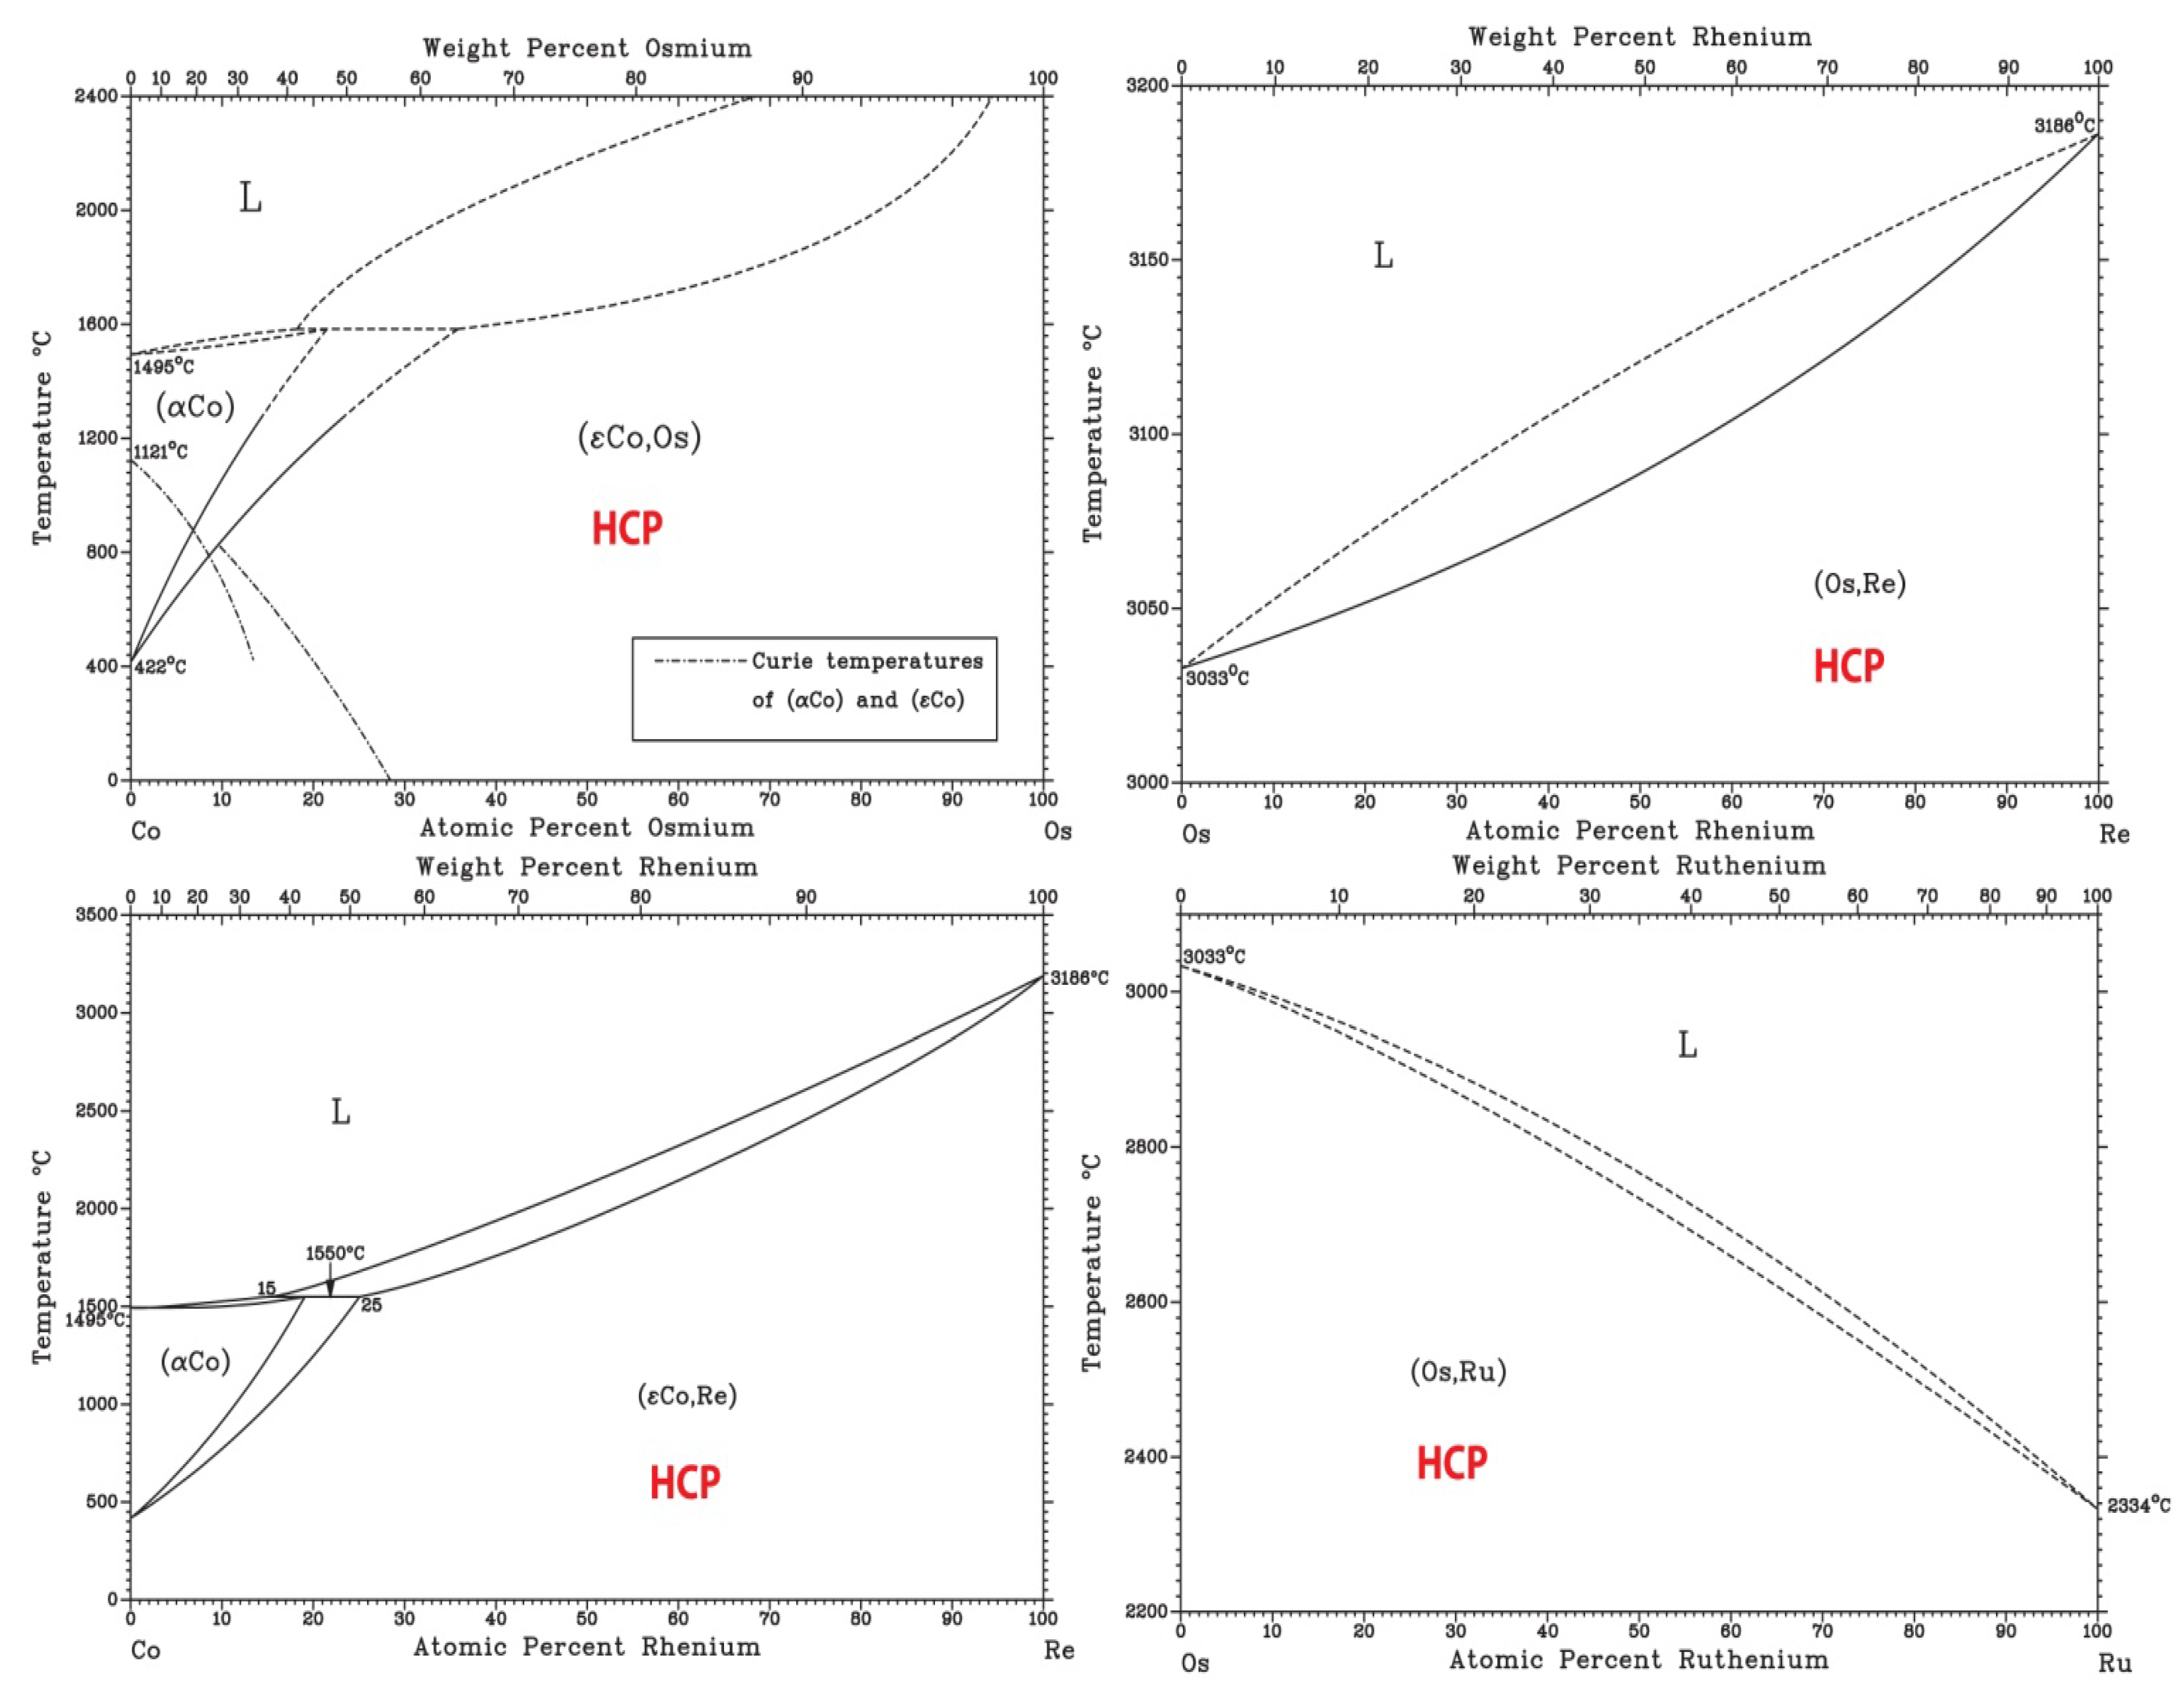
Finally, based on available binary [36] and ternary phase diagrams [26] and ongoing AIMD simulations (not shown), CoOsReRu is expected to be a single phase HCP alloy. Examination of the six end binaries [36] indicates the formation of isomorphous HCP solid solution at room temperature with no intermetallic phase formation (Figure 7). An early study on the Co-Re-Ru ternary shows formation of HCP isomorphous solid solution in the system [37].
Figure 7.
Binary phase diagrams of the Co-Os-Re-Ru quaternary system [36].
Figure 7.
Binary phase diagrams of the Co-Os-Re-Ru quaternary system [36].

4. Conclusions
The present study examined the liquid structures of three example alloys, namely Al1.3CoCrCuFeNi, HfNbTaTiZr, and CuNiPPdPt. Only HfNbTaTiZr forms a single-phase BCC solid solution. Al1.3CoCrCuFeNi consists of FCC, BCC, and B2 phases. There are four phases formed at T = 630 K in CuNiPPdPt, and HE-BMG can only be obtained upon quenching. Use of CALPHAD method to search for new FCC solid solution phases was demonstrated. Tactics in searching for new FCC and HCP slid solution phases are further illustrated based on binary and ternary phase diagrams. The following conclusions were reached:
- (1)
- Lack of preferred short-range ordering and segregation in liquid promotes solid solution formation during solidification.
- (2)
- Self-diffusion constants are mainly dictated by atomic size and weight for high-entropy solid solution compositions, while preferred interatomic interaction plays an important role for multi-phase and amorphous alloys.
- (3)
- Illustration of phase stability of example multi-component systems in the space of composition and temperature is facilitated by CALPHAD method. Guidance on alloying strategy out of CALPHAD calculations is still very meaningful although the thermodynamic databases are crude for most HEA systems.
- (4)
- Inspection of constituent phase diagrams of HEA systems suggest that single-phase solid solution often forms if extensive or isomorphous solid solution exists in all edge binaries or ternaries.
- (5)
- New single-phase FCC solid solution compositions are suggested: CoFeMnNi, CuNiPdPt, and CuNiPdPtRh.
- (6)
- For the first time, a HCP single-phase solid solution composition was suggested: CoOsReRu.
Acknowledgments
The author acknowledges support of the Innovative Processing and Technologies Program of the National Energy Technology Laboratory's (NETL) Strategic Center for Coal under the RES contract DE-FE-0004000. The author thanks Prof. Mike Widom at Carnegie Mellon University for useful discussion on AIMD simulations; Louis Santodonato and Prof. Liaw at the University of Tennessee for sharing their in situ neutron scattering results on alloy Al1.3CoCrCuFeNi. This work used the computing facility at Texas Advanced Computing Center (TACC) through Award# DMR120048 by the Extreme Science and Engineering Discovery Environment (XSEDE), which is supported by National Science Foundation grant number OCI-1053575.
Disclaimer
This report was prepared as an account of work sponsored by an agency of the United States Government. Neither the United States Government nor any agency thereof, nor any of their employees, makes any warranty, express or implied, or assumes any legal liability or responsibility for the accuracy, completeness, or usefulness of any information, apparatus, product, or process disclosed, or represents that its use would not infringe privately owned rights. Reference herein to any specific commercial product, process, or service by trade name, trademark, manufacturer, or otherwise does not necessarily constitute or imply its endorsement, recommendation, or favoring by the United States Government or any agency thereof. The views and opinions of authors expressed herein do not necessarily state or reflect those of the United States Government or any agency thereof.
Conflicts of Interest
The authors declare no conflict of interest.
References
- Yeh, J.W.; Chen, S.K.; Lin, S.J.; Gan, J.Y.; Chin, T.S.; Shun, T.T.; Tsau, C.H.; Chang, S.Y. Nanostructured high-entropy alloys with multiple principal elements: Novel alloy design concepts and outcomes. Adv. Eng. Mat. 2004, 6, 299–303. [Google Scholar] [CrossRef]
- Cantor, B.; Chang, I.T.H.; Knight, P.; Vincent, A.J.B. Microstructural development in equiatomic multicomponent alloys. Mat. Sci. Eng. A 2004, 375, 213–218. [Google Scholar] [CrossRef]
- Tong, C.J.; Chen, M.R.; Chen, S.K.; Yeh, J.W.; Shun, T.T.; Lin, S.J.; Chang, S.Y. Mechanical performance of the AlxCoCrCuFeNi high-entropy alloy system with multiprincipal elements. Metall. Mat. Trans. A 2005, 36A, 1263–1271. [Google Scholar] [CrossRef]
- Tong, C.J.; Chen, Y.L.; Chen, S.K.; Yeh, J.W.; Shun, T.T.; Tsau, C.H.; Lin, S.J.; Chang, S.Y. Microstructure characterization of AlxCoCrCuFeNi high-entropy alloy system with multiprincipal elements. Metall. Mat. Trans. A 2005, 36A, 881–893. [Google Scholar] [CrossRef]
- Lucas, M.S.; Wilks, G.B.; Mauger, L.; Munoz, J.A.; Senkov, O.N.; Michel, E.; Horwath, J.; Semiatin, S.L.; Stone, M.B.; Abernathy, D.L.; et al. Absence of long-range chemical ordering in equimolar FeCoCrNi. Appl. Phys. Lett. 2012, 100, 251907–4. [Google Scholar] [CrossRef]
- Senkov, O.N.; Wilks, G.B.; Miracle, D.B.; Chuang, C.P.; Liaw, P.K. Refractory high-entropy alloys. Intermetallics 2010, 18, 1758–1765. [Google Scholar] [CrossRef]
- Senkov, O.N.; Wilks, G.B.; Scott, J.M.; Miracle, D.B. Mechanical properties of Nb25Mo25Ta25W25 and V20Nb20Mo20Ta20W20 refractory high entropy alloys. Intermetallics 2011, 19, 698–706. [Google Scholar] [CrossRef]
- Senkov, O.N.; Scott, J.M.; Senkova, S.V.; Miracle, D.B.; Woodward, C.F. Microstructure and room temperature properties of a high-entropy TaNbHfZrTi alloy. J. Alloys Comp. 2011, 509, 6043–6048. [Google Scholar] [CrossRef]
- Chen, Y.-L.; Tsai, C.-W.; Juan, C.-C.; Chuang, M.-H.; Yeh, J.-W.; Chin, T.-S.; Chen, S.-K. Amorphization of equimolar alloys with HCP elements during mechanical alloying. J. Alloys Comp. 2010, 506, 210–215. [Google Scholar] [CrossRef]
- Zhang, Y.; Zhou, Y.J.; Lin, J.P.; Chen, G.L.; Liaw, P.K. Solid-solution phase formation rules for multi-component alloys. Adv. Eng. Mat. 2008, 10, 534–538. [Google Scholar] [CrossRef]
- Miedema, A.R.; de Boer, F.R.; Boom, R. Model predictions for the enthalpy of formation of transition metal alloys. Calphad 1977, 1, 341–359. [Google Scholar] [CrossRef]
- Guo, S.; Ng, C.; Lu, J.; Liu, C.T. Effect of valence electron concentration on stability of fcc or bcc phase in high entropy alloys. J. Appl. Phys. 2011, 109, 103505. [Google Scholar] [CrossRef]
- Kresse, G. Ab initio molecular dynamics for liquid metals. J. Non-Cryst. Solids 1995, 192, 222–229. [Google Scholar] [CrossRef]
- Ganesh, P.; Widom, M. Ab initio simulations of geometrical frustration in supercooled liquid Fe and Fe-based metallic glass. Phys. Rev. B 2008, 77, 014205. [Google Scholar] [CrossRef]
- Kao, S.-W.; Yeh, J.-W.; Chin, T.-S. Rapidly solidified structure of alloys with up to eight equal-molar elements—A simulation by molecular dynamics. J. Phys.-Cond. Matt. 2008, 20, 145214. [Google Scholar] [CrossRef]
- Kresse, G.; Hafner, J. Ab initio molecular dynamics for liquid metals. Phys. Rev. B 1993, 47, 558–561. [Google Scholar] [CrossRef]
- Kresse, G.; Furthmueller, J. Efficient iterative schemes for ab initio total-energy calculations using a plane-wave basis set. Phys. Rev. B 1996, 54, 11169–11186. [Google Scholar] [CrossRef]
- Blochl, P.E. Projector augmented-wave method. Phys. Rev. B 1994, 50, 17953. [Google Scholar] [CrossRef]
- Perdew, J.P.; Burke, K.; Ernzerhof, M. Generalized gradient approximation made simple. Phys. Rev. Lett. 1996, 77, 3865–3868. [Google Scholar] [CrossRef] [PubMed]
- Santodonato, L.J.; Zhang, Y.; Feygenson, M.; Parish, C.M.; Gao, M.C.; Weber, R.J.K.; Neuefeind, J.C.; Tang, Z. Bridging the gap between intermetallic compounds and high-entropy alloys. Nature Comm. 2013. submitted. [Google Scholar]
- Takeuchi, A.; Chen, N.; Wada, T.; Yokoyama, Y.; Kato, H.; Inoue, A.; Yeh, J.W. Pd20Pt20Cu20Ni20P20 high-entropy alloy as a bulk metallic glass in the centimeter. Intermetallics 2011, 19, 1546–1554. [Google Scholar] [CrossRef]
- Nose, S. A unified formulation of the constant temperature molecular-dynamics methods. J. Chem. Phys. 1984, 81, 511–519. [Google Scholar] [CrossRef]
- Sundman, B.; Jansson, B.; Andersson, J. Calphad-computer coupling of phase diagrams and thermochemistry. Calphad 1985, 9, 153–190. [Google Scholar] [CrossRef]
- Singh, S.; Wanderka, N.; Murty, B.S.; Glatzel, U.; Banhart, J. Decomposition in multi-component AlCoCrCuFeNi high-entropy alloy. Acta Mater. 2011, 59, 182–190. [Google Scholar] [CrossRef]
- Singh, S.; Wanderka, N.; Kiefer, K.; Siemensmeyer, K.; Banhart, J. Effect of decomposition of the Cr-Fe-Co rich phase of AlCoCrCuFeNi high entropy alloy on magnetic properties. Ultramicroscopy 2011, 111, 619–622. [Google Scholar] [CrossRef] [PubMed]
- ASM Alloy Phase Diagram Database. http://www1.asminternational.org/asmenterprise/apd/ (accessed on 22 September 2013).
- Ma, L.; Wang, L.; Zhang, T.; Inoue, A. Bulk Glass Formation of Ti–Zr–Hf–Cu–M (M=Fe, Co, Ni) Alloys. Mat. Trans. 2002, 43, 277–280. [Google Scholar] [CrossRef]
- Atomic Radii of the Elements (Data Page). Available online: http://en.wikipedia.org/wiki/Atomic_radii_of_the_elements_(data_page) (accessed on 22 September 2013).
- Hsu, C.Y.; Juan, C.C.; Chen, S.T.; Sheu, T.S.; Yeh, J.W.; Chen, S.K. Phase diagrams of high-entropy alloy system Al-Co-Cr-Fe-Mo-Ni. JOM 2013. [Google Scholar] [CrossRef]
- Zhang, C.; Zhang, F.; Chen, S.; Cao, W. Computational thermodynamics aided high-entropy alloy design. JOM 2012, 64, 939–854. [Google Scholar] [CrossRef]
- Senkov, O.N.; Zhang, F.; Miller, J.D. Phase composition of a CrMo0.5NbTa0.5TiZr high entropy alloy: Comparison of experimental and simulated data. Entropy 2013, 15, 3796–3809. [Google Scholar] [CrossRef]
- Tang, Z.; Gao, M.C.; Diao, H.; Yang, T.; Liu, J.; Zuo, T.; Zhang, Y.; Lu, Z.; Cheng, Y.; Zhang, Y.; et al. Aluminum alloying effects on lattice types, microstructures, and mechanical behavior of high-entropy alloys systems. JOM 2013. [Google Scholar] [CrossRef]
- Senkov, O.N.; Senkova, S.V.; Woodward, C.; Miracle, D.B. Low-density, refractory multi-principal element alloys of the Cr-Nb-Ti-V-Zr system: Microstructure and phase analysis. Acta Mater. 2013, 61, 1545–1557. [Google Scholar] [CrossRef]
- Senkov, O.N.; Woodward, C.F. Microstructure and properties of a refractory NbCrMo0.5Ta0.5TiZr alloy. Mat. Sci. Eng. A 2011, 529, 311–320. [Google Scholar] [CrossRef]
- Praveen, S.; Murty, B.S.; Kottada, R.S. Phase Evolution and densification behavior of nanocrystalline multicomponent high entropy alloys during spark plasma sintering. JOM 2013. [Google Scholar] [CrossRef]
- Massalski, T.B.; Subramanian, P.R.; Okamoto, H.; Kacprzak, L. Binary Alloy Phase Diagrams, 2nd ed.; ASM International: Materials Park, OH, USA, 1990; volumes 1–3. [Google Scholar]
- Savitskii, E.M.; Tylkina, M.A.; Polyakova, V.P. Equilibrium diagram of the Osmium-Rhenium-Ruthenium system. Russ. J. Inorg. Chem. 1963, 8, 74–76. [Google Scholar]
© 2013 by the authors; licensee MDPI, Basel, Switzerland. This article is an open access article distributed under the terms and conditions of the Creative Commons Attribution license (http://creativecommons.org/licenses/by/3.0/).
Share and Cite
MDPI and ACS Style
Gao, M.C.; Alman, D.E. Searching for Next Single-Phase High-Entropy Alloy Compositions. Entropy 2013, 15, 4504-4519. https://doi.org/10.3390/e15104504
AMA Style
Gao MC, Alman DE. Searching for Next Single-Phase High-Entropy Alloy Compositions. Entropy. 2013; 15(10):4504-4519. https://doi.org/10.3390/e15104504
Chicago/Turabian StyleGao, Michael C., and David E. Alman. 2013. "Searching for Next Single-Phase High-Entropy Alloy Compositions" Entropy 15, no. 10: 4504-4519. https://doi.org/10.3390/e15104504