Article

Co-Evolutionary Mechanisms of Emotional Bursts in Online Social Dynamics and Networks

by
Bosiljka Tadić
1,*,
Vladimir Gligorijević
1,
Marija Mitrović
1,2,3 and
Milovan Šuvakov
1,2
1
Department of Theoretical Physics, Jožef Stefan Institute, Jamova 39, Ljubljana 1001, Slovenia
2
Institute of Physics Belgrade, University of Belgrade, Pregrevica 118, 11080 Beograd, Serbia
3
Department of Biomedical Engineering and Computational Science, Aalto University School of Science, P.O. Box 12200, FI-00076, Finland
*
Author to whom correspondence should be addressed.
Entropy 2013, 15(12), 5084-5120; https://doi.org/10.3390/e15125084
Submission received: 4 October 2013 / Revised: 6 November 2013 / Accepted: 12 November 2013 / Published: 26 November 2013
(This article belongs to the Special Issue Complex Systems)

Abstract

:
Collective emotional behavior of users is frequently observed on various Web portals; however, its complexity and the role of emotions in the acting mechanisms are still not thoroughly understood. In this work, using the empirical data and agent-based modeling, a parallel analysis is performed of two archetypal systems—Blogs and Internet-Relayed-Chats—both of which maintain self-organized dynamics but not the same communication rules and time scales. The emphasis is on quantifying the collective emotions by means of fractal analysis of the underlying processes as well as topology of social networks, which arise and co-evolve in these stochastic processes. The results reveal that two distinct mechanisms, which are based on different use of emotions (an emotion is characterized by two components, arousal and valence), are intrinsically associated with two classes of emergent social graphs. Their hallmarks are the evolution of communities in accordance with the excess of the negative emotions on popular Blogs, on one side, and smooth spreading of the Bot’s emotional impact over the entire hierarchical network of chats, on the other. Another emphasis of this work is on the understanding of nonextensivity of the emotion dynamics; it was found that, in its own way, each mechanism leads to a reduced phase space of the emotion components when the collective dynamics takes place. That a non-additive entropy describes emotion dynamics, is further confirmed by computing the q-generalized Kolmogorov-Sinai entropy rate in the empirical data of chats as well as in the simulations of interacting emotional agents and Bots.

Graphical Abstract

1. Introduction

In statistical mechanics, the principle of maximum entropy is originally introduced as a fundamental concept that relates the equilibrium state of a thermodynamical system with the number of its microstates. Over the years, the concept has been standardly accepted in the field of information theory. In recent research, the entropy maximization is often practiced in other areas of science and technology [1]. For instance, in the case of model inference from the stochastic data, the maximum entropy principle provides coherence and self-consistency of the approach. Furthermore, beyond equilibrium statistical mechanics, the entropy maximization is a framework for understanding the dynamics. Recent progress in statistical physics of complex dynamical systems and its applications in multidisciplinary areas including social dynamics, have pointed out that generalized entropies must be considered, such as Tsallis entropy S q , q 1 [2,3,4,5]. The most general form of the entropy S ( c , d ) was derived in [6]; the available range of the exponents ( c , d ) allows for a full classification of the systems in which generalized entropies apply [6,7]. One of the prominent features of these systems is the nonlinear rate for the entropy generation or nonextensivity [3,8,9]. In the present work, the concept of generalized entropy is related to the dynamics of emotions, studied in online social systems.
Communications between users on different Web portals provides a wealth of data, which contains rich information about human dynamics online. Recently, intensive research based on these empirical data, seen as examples of complex dynamical systems in the physics laboratory, has been performed: this research contributed to quantitative study of social phenomena on Blogs [10,11], Diggs [12], Forums [13], online games [14,15], online social networks MySpace [16], Facebook [17], Twitter [18], online chats [19] and other online communication systems. By using different machine-learning methods of text analysis (a recent review of methods can be found in [20]), one can infer contents that are communicated in the text messages exchanged between users. For example, concepts as units of information carried by the message can be inferred by suitable algorithms [21]. Furthermore, by lexicon-based methods [22,23] more components of emotion can be measured, i.e., by coordinating the emotional words in the text of a message with their values in the lexicon of affective words. In this way, an emotion [24] as it is known in common life can be identified. According to Russel’s circumplex model of emotion [25], different emotions are distributed in a two-dimensional circular space, representing two emotion components—arousal (degree of reactivity) and valence (intrinsic attractiveness or aversiveness of an object, event or situation). Thus, a neutral valence and a medium arousal correspond to the emotion at the center of the circle. The empirical data about user communications, enriched by these additional attributes, make a good source for research into the role of emotion and information in online social dynamics.
While the human dynamics online can be severly influenced by real world events, it can not be considered as a mere reflection of the offline social phenomena. Statistically robust regularities have been observed that characterize online social dynamics across different communication systems. Specifically, the following features are pertinent to the present work:
  • Networks emerge dynamically via user communications. Depending on the interaction mode among users, a specific type of network architecture may appear [10,14,15,16,26,27,28,29,30]; most of the emergent networks exhibit prevailing characteristics of a social structure;
  • Nonlinear dynamics underlies user activity. Beside ubiquitous circadian cycles [31], which are immediately related with user’s real life, the action-delay (or interactivity time) is another key property of human activity that, in an intricate way, combines offline and online events. In the empirical data, regularly a broad distribution of interactivity times is found, being one of the typical features of a given Web portal [10,32]; Furthermore, several prominent characteristics of stochastic point processes [33]—long-range correlations, self-organization, clustering of events or avalanching as well as the effects of (exogenous and endogenous) driving [34,35,36]—have been studied using the high-resolution empirical data [12,37,38];
  • Contents exchanged in (text) messages, i.e., information and emotion, play a role in social dynamics. Each individual user with its online activity contributes to building up a social network, which then propagates the contents of future messages, information and emotion; consequently, often collective phenomena can be observed, e.g., bursts of emotional messages that involve many users [10,12,13,19,39,40,41,42,43].
How do these contents contribute to the social dynamics and networking? Are various rules, constraints and time scales which are imposed to user activity, relevant to the structure of emergent networks and the use of emotions? These and other open questions are currently subject of intense research activity across different science disciplines. In order to uncover possible mechanisms of emotional interactions in online communications, recently we have developed several agent-based models on networks; in particular, the interacting emotional agents on Blogs [44,45], in online social networks [46] and chats between agents and Bots [38,47] have been studied.
In this work, we present a synthesis of our recent research with a number of new results, which are based on the analysis of empirical data and agent-based simulations of Internet-Relayed-Chats (IRC) and Blogs. With a parallel analysis of the underlying dynamics in these systems, our primary focus is on distinguishing two key mechanisms of emotional connections which, presumably, apply more generally in association with two specified classes of co-evolving social networks. We also give quantitative analysis of pertinent fractal processes which support these mechanisms. This analysis unveils how the dominance of negative emotions in self-organized processes defines the evolution and lifetime of social communities on Blogs. With the simulations of chats between agents and the emotional Bots, we demonstrate how these features of the self-organized stochastic process and the evolution of network enable smooth propagation of the Bot’s emotional impact over the entire network. Furthermore, investigation of the dynamic trajectories of users and agents in the phase space of two emotion variables (arousal and valence), exhibits nonextensive dynamics of emotions and non-additive entropy in these systems; a detailed study is given for the dynamics of chats, both in the empirical data and in the data simulated by the agent-based model with emotional Bots.

2. Collective Behavior of Users on Blogs and IRC Channels

2.1. The Structure of Empirical Data of Chats and Blogs

Here, we give a comparative analysis of the empirical data from two archetype systems: Internet-Relayed-Chat channels, on one side, and Blogs, on the other. Similarity in these online communication systems is found in that they share the following features: (a) Users post text messages (comments, posts), which can be perceived by other users, who, in turn, may respond to the contents of the posted matter; (b) Unlike prevailing social networks, users have no a priori relationship; (c) During the process, user interaction via text messages (posts, comments), leads to new associations—emergence of a network—which affects future communications. In this work, we consider three sets of empirical data gathered from: (1) Ubuntu chats; data are annotated for emotional arousal and valence, which are described in [29]; (2) BBCblogs; collection method, as well as inference of the emotion valence of the data can be found in [27]; (3) discussion-driven popular posts ddDiggs, a subset of data from digg.com, described in [12].
On top of the above described features, the Chat channels and Blogs differ from each other in time scales of the underlying processes as well as in the rules and constraints that are imposed on users. Specifically,
  • the dynamics of chats is fast. A user can post a message on the channel, where it can be viewed by all currently active users; alternatively, the message can be directed to another named user or to a Bot, whose response also may arrive either directly or via the channel. On the channel new messages posted within the current time window t - T 0 are exposed, where T 0 = 2 min corresponds to around 10 recently posted messages. Due to a quick progression of events, search for old messages is not common. The data that we consider here contain information about the user who posted a message and the user to whom the message was directed, as well as the posting time and annotated emotional content (arousal and valence) of each message. Temporal resolution is at one minute. Apart from the common subject of the channel, the contents and linguistic categories of the messages are not limited by the system. Note that these are often short messages.
  • in Blogs, the pace of events is much lower than in the dynamics of chats. A limited number of users can insert main posts, whose subject categories are predetermined by the general policy. Then, a user can read the post, as well as currently existing comments on that post, and subsequently, may insert their own comment, relating it with the post itself or with a specific comment on that post. Recent posts appearing within the current time window are exposed, where T 0 2 days. However, search for older posts (and comments on them) is available and commonly occurs. Note that posts and comments often contain longer texts. In this work, we use a set of data collected from BBCblogs and Diggs. The data are annotated for emotional valence in the text of each message [12].
A systematic analysis of the emotion-annotated data suggests that the emotional contents play a significant role in building connections among users in both types of communication systems. However, the use of emotions is strikingly different. In particular, the analysis of data revealed [12,27] excessive use of negative emotions on Blogs and Diggs, which usually appears within groups of users gathered around certain popular posts. On the other hand, the data from IRC channels contain emotional messages where the negative valence in user messages appears to be well balanced with the positive valence (see also below). However, the network architecture was shown [19] to exhibit the resilience tightly correlated with the arousal of the messages exchanged along the links. In the remaining part of this section, we focus on two aspects of these communication systems: the nature of the underlying stochastic process and the structure of co-evolving social network that is associated with that process.

2.2. Two Classes of Online Social Networks from the Empirical Data

In recent years, suitable mapping of data about objects and their mutual relations onto a complex network, and subsequently using the graph theory methods has proved as advantageous for the quantitative study of complexity in physical systems; the studied examples are ranging from the cosmology [48,49], on one end, to nanonetworks involving different nanoscale objects [50,51], on the other. Within this approach in the analysis of online social dynamics data, a variety of social networks were observed in relation with different online activities of users [12,15,16,27,30,52,53,54,55,56]. Here, we use the accepted methods to construct and analyse the networks from the empirical data from Blogs and Chats; we demonstrate that, although in both systems no a priori associations among users exists and the networks grow starting from scratch, the networks that eventually emerge in these processes belong to two entirely different classes of social structures.
On Blogs (and Diggs), interactions among users are mediated by posts and comments-on-posts. Such indirect interactions are appropriately mapped onto [10,28] bipartite networks with directed and weighted links. Specifically, users, as one partition, are mutually separated via posts-and-comments, as the other partition, such that no direct link between the nodes of the same partition exists. Similar bipartite graphs are obtained in mapping the movie data [26]. In the considered data from digg.com, mapping the subset of data with discussion-driven posts, where comment-on-comment are in majority, (ddDiggs) [12], we obtain the bipartite network which is shown in Figure 1a. In this network, users group around certain popular posts, while many other posts are gradually less commented. The grouping of users around popular posts leads to the formation of dense subgraphs, which are recognized as topological communities in the network [10,27,28]. The presence of communities can be also seen by the branched structure of the maximum-flow spanning tree of the bipartite network. By definition, in this type of spanning tree, each node is connected to the remaining part of the tree by its strongest link. In the case of our bipartite graph, the strength of a link between a user-node and a post-node is determined by the number of comments of the user posted on that post. Considering the strength of the links in our bipartite network, but disregarding their directions, we obtain the maximum-flow spanning tree which is shown Figure 1b. The network flow among the nodes on the same branch is markedly larger compared with the flow between the branches (different branches roughly correspond to the weighted communities on the network).
By projection of the bipartite network onto user partition, a pair of users linked to the same post or comment become connected to each other in the projected monopartite network. Multiplicity of the link reflects the number of comments that they posted to that post (or to comments on it). The resulting (monopartite) network is symmetrical, weighted and strongly clustered; a number of such networks obtained from Blogs data and projected onto either user or post partition, have been studied in [10,27,28]. The community structure of the user-projected networks can be readily detected by the eigenvalue spectral analysis [57]; the occurrence of communities is strongly related with the weights of the links. By identifying all users within a given community, and then filtering out their actions and texts of their comments from the original data, one can find two prevailing patterns of activity [10,12,27]. Namely, in the case of less popular posts, users grouping is driven by preference towards specific subjects of the posts. On the other hand, on the popular posts with a large variety of subjects, the activity of users is dominated by emotion; users mostly express their critique of the posts and comments, which results in prevailing negative emotion valence by text analysis. By analysis of the community structure through a sequence of time windows, it has been shown [12] that in the ddDiggs data the size of a given community evolves in a strong correlation with the excess of negative comments on the related posts. The underlying mechanisms of emotional interactions will be further studied within agent-based model in the following section.
Figure 1. Top row: From ddDiggs dataset, (a) view of the bipartite network of users, represented by red circles, and posts-and-comments, blue squares and (b) its maximum-flow spanning tree. Bottom row: From Ubuntu chat channel, (c) the chat network of users and (d) maximum-flow spanning tree of the chat network.
Entropy 15 05084 g001
In the case of IRC channels, a user exchanges messages with another user or with Bot; in addition, some messages are posted on the channel. Thus, the selected subset of data where user-to-user communication is clearly marked, is suitably mapped onto a monopartite directed weighted network of users. The weight of each directed links between a pair of users represents the number of messages passed along that link. An example of an emergent network, obtained from Ubuntu chats after the first seven days (with respect to the beginning of dataset) is shown in Figure 1c. The network exhibits a hierarchical organization with a strong central core. The core represents almost a full graph, consisting of a Bot and about 40 knowledgeable users (moderators), who often respond to other user’s messages posted onto channel or directed to them, and employ the Bot. A detailed analysis of the network structure, the role that the types of messages exchanged among users play in building the network, as well as the arousal-related resilience, have been recently studied in [19,29,30]. Unlike Blogs and conventional online social networks [16], where communications mostly occur within a community, in the online chat networks, the exchange of messages almost inevitably involves the nodes within the central core. Consequently, the maximum-flow spanning tree with an almost linear structure is obtained, see Figure 1d.
For the purpose of the present work, it should be stressed that in the empirical data of chats, the reciprocity of the directed links is high and emotional valence of the exchanged messages is well balanced at the level of the entire network [19]. A slightly higher number of positive emotion messages can be attributed to the fact that most of the involved positive emotions (i.e., identified by arousal and valence in the texts of messages), have higher arousal, and thus are more likely to trigger user actions, than the involved negative emotions.

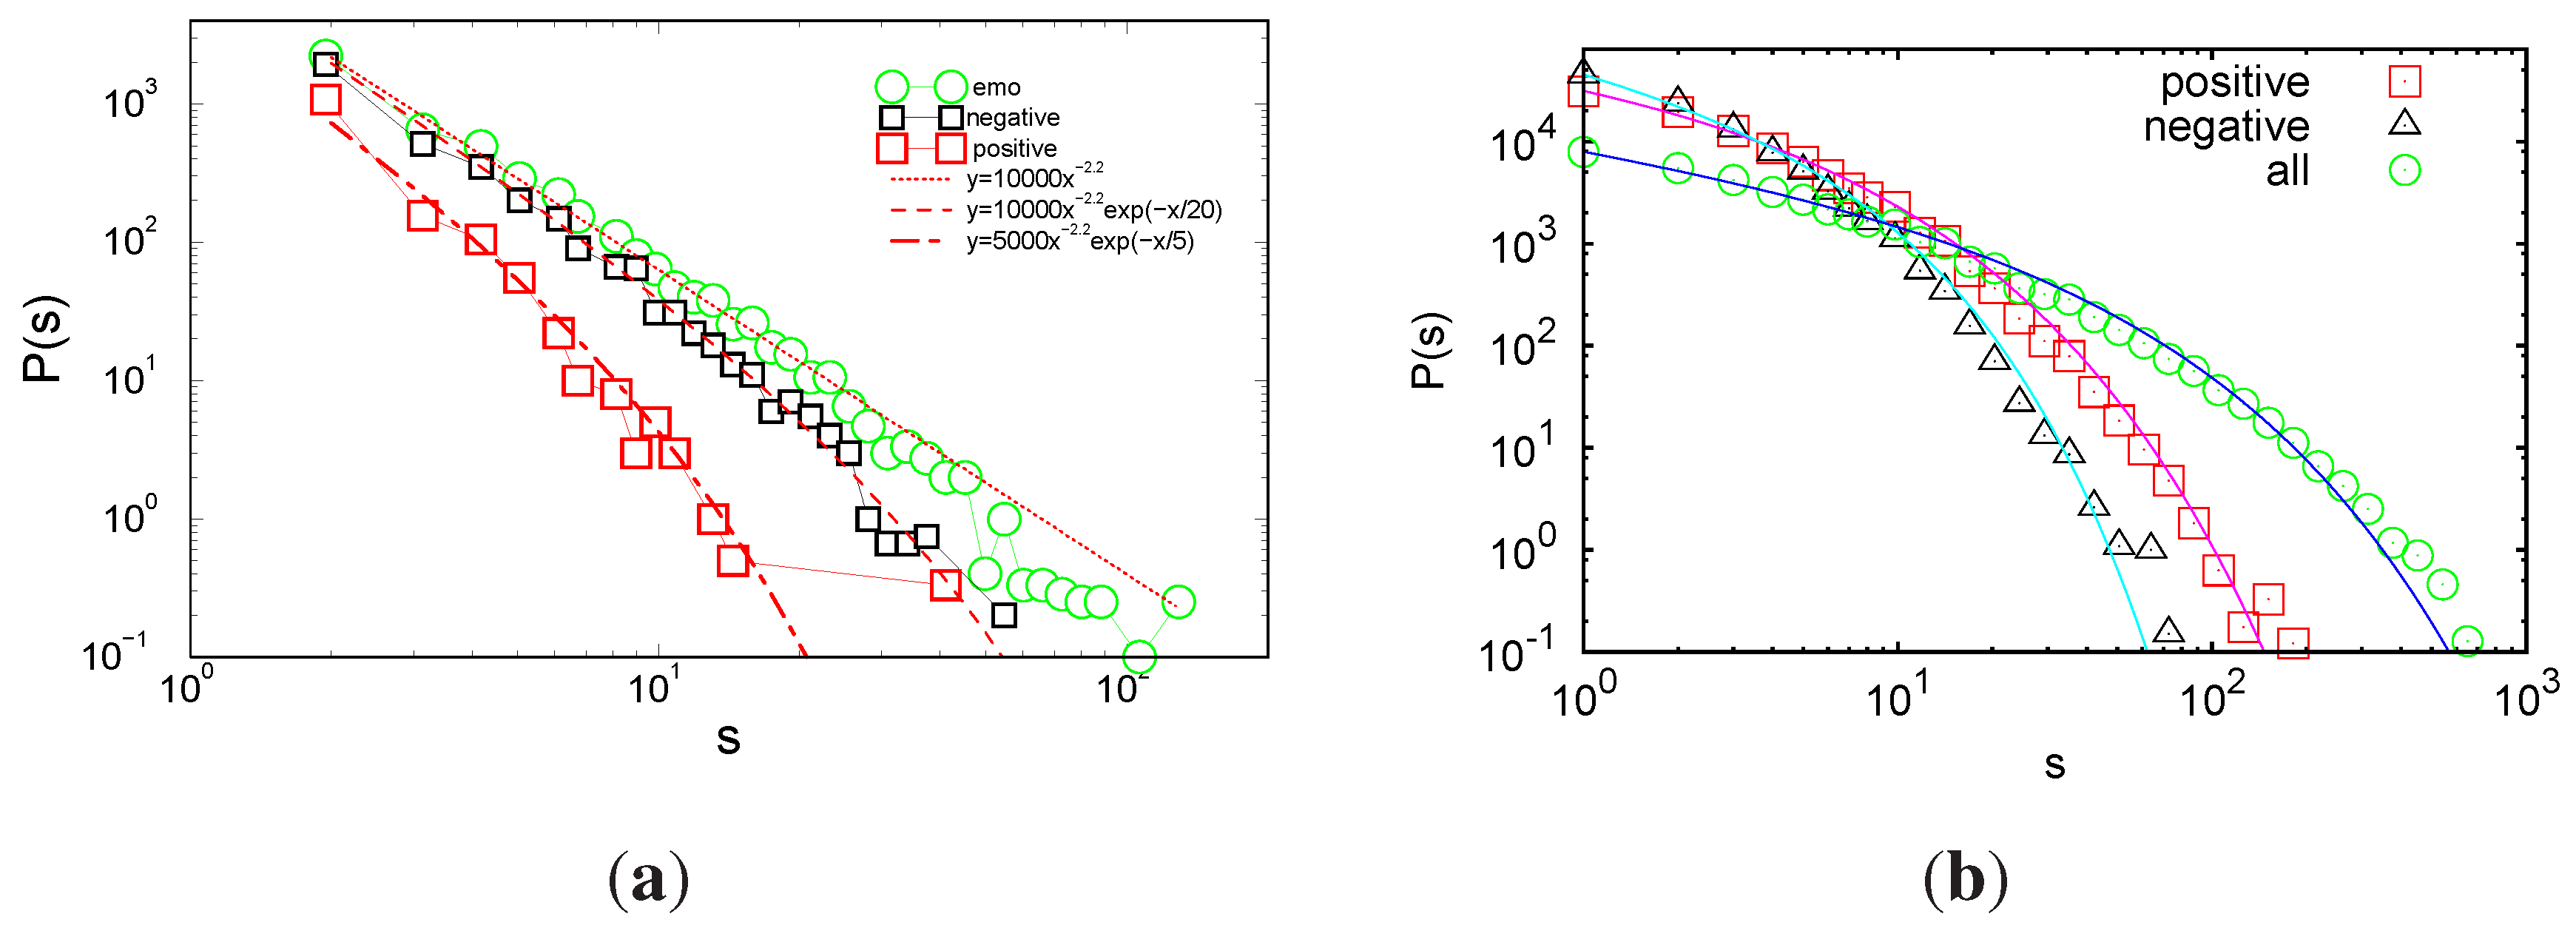
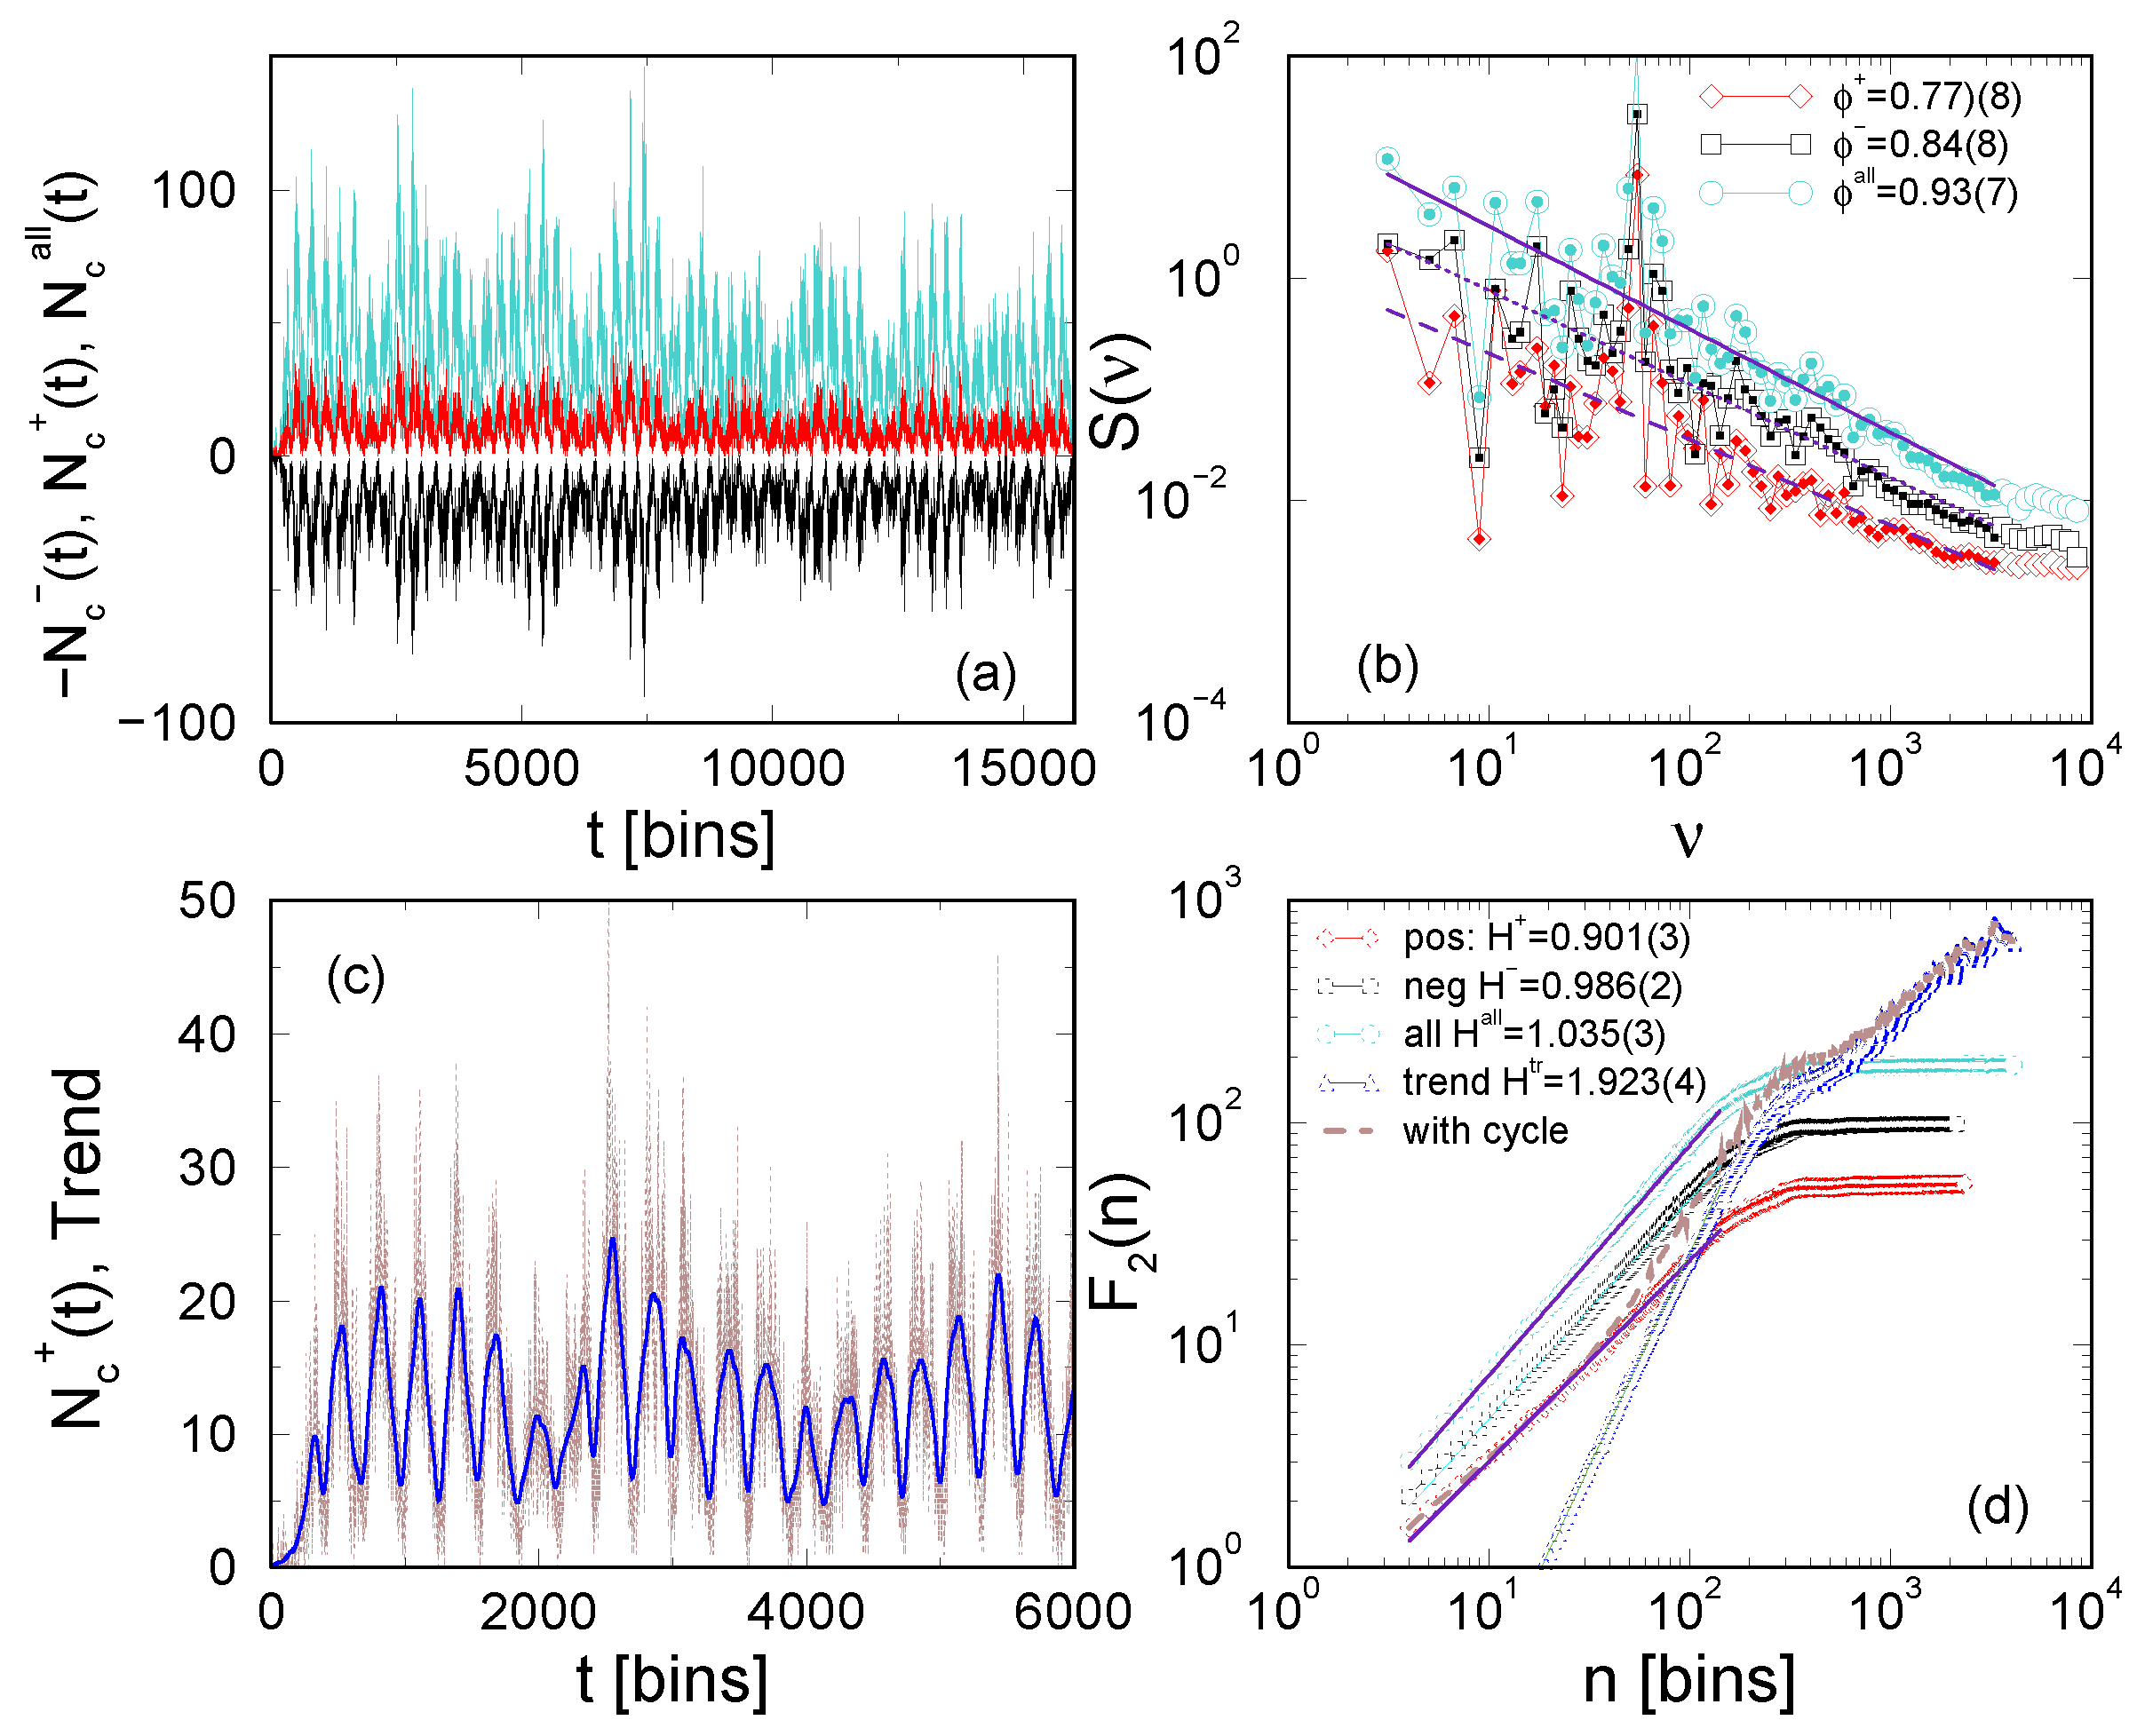
2.3. Fractal Structure of Bursting Processes with Emotional Messages in Blogs and Chats

Apart from the emergence of networks with emotion carrying links, the collective emotional behavior of users has been studied quantitatively by means of time series analysis and statistics of avalanches. The time series of messages carrying positive/negative emotion valence is constructed by selecting the number of such messages occurring within a small time bin. The avalanche (burst) of emotional messages is then identified as temporally connected sequence of events occurring above a threshold line (noise level) along the respective time series [12,34,35]. In Figure 2 the distributions of sizes of such avalanches are shown, determined from the empirical data of BBCblog and Ubuntu chats.
The dominance of messages with negative emotion valence on Blogs (similar conclusions apply to the data from ddDiggs [12]) leads to the occurrence of large avalanches. For comparison, in Figure 2a the distribution of avalanches of all messages, i.e., irrespective of their emotional contents, are also plotted. The distributions obey a power-law decay with a slope close to 2.2 and an exponential cut-off. This indicates possible closeness to a critical point (see theoretical analysis in [12]). In contrast, positive emotion avalanches are much shorter. Their distribution is dominated with the exponential decay. On the other hand, in Ubuntu chats, both positive and negative emotion avalanches appear to be of a comparable size; in both cases, the distributions are dominated by cut-off length, indicating that they are far below a critical behavior, see Figure 2b.
Figure 2. The distributions of size of the avalanches carrying emotional messages in BBCblogs (a) and in Ubuntu chats (b).
Entropy 15 05084 g002
Occurrence of avalanches is often associated with the correlations of events in the underlying stochastic processes. By fractal analysis of time series the structure of these processes can be determined and expressed by suitable quantitative measures. Here, applying detrended time series analysis, we analyse the time series carrying emotional messages in the empirical data of ddDiggs and Ubuntu chats. The results are summarized in Figure 3 and Figure 4, respectively.
Figure 3. Fractal analysis of time series in ddDiggs. (a) Time series of all messages, and messages with positive and negative (plotted with negative sign) valence. (b) Power spectrum of these time series. (c) Example of the cyclic daily trend plotted over the original time series of all messages. (d) Fluctuations F 2 ( n ) plotted against time interval n for the time series and the trend.
Entropy 15 05084 g003
Figure 4. Same as Figure 3 but for the time series obtained from Ubuntu chats data.
Entropy 15 05084 g004
In ddDiggs, large activity of users leads to strong fluctuations in the number of messages per time bin ( t b i n = 5 min). Moreover, these time series exhibit strong daily fluctuations, related with the circadian cycles of users. The number of negative emotion messages, plotted with the negative sign - N - ( t ) to avoid overlap, exceeds the number of positive emotion messages, cf. Figure 3a. The fractal structures of these time series also differ in the quantitative measures: power spectral densities and Hurst exponents. Specifically, the power spectrum, shown in Figure 3b, exhibits a strong peak, corresponding to daily cycle, however, the remaining spectrum obeys a power-law decay as S ( ν ) ν - ϕ ; the respective numerical values of the exponents (indicated on the figure) are characteristic for the stochastic point processes [33]. The exponents ϕ corresponding to the power spectrum of all messages time series and time series with negative emotion messages are approaching the limit ϕ 1 of flicker noise. Whereas, somewhat weaker correlations are found in the case of positive emotion messages.
Note that these time series are stationary, but the fluctuations around a stable average value are strongly affected by the occurrence of daily cycles (and possibly higher cycles). Therefore, in order to compute the Hurst exponent, the fluctuations of the detrended time series are considered. To remove the local trend, we use the method with overlaping intervals, described in detail in [16,38,58], which is particularly suitable for the time series with strong cycles. An example of local cyclic trend is shown in Figure 3c for the time series of all messages. For a time series h ( k ) , k = 1 , 2 , T , the profile Y ( i ) = k = 1 i ( h ( k ) - < h > ) is divided into N n segments of length n. Then the Hurst exponent H is computed as a scaling exponent of the fluctuations at time segment of length n around the cycle trend as F 2 ( n ) = ( 1 / N n ) μ = 1 N n F 2 ( μ , n ) 1 / 2 n H . Here F 2 ( μ , n ) = ( 1 / n ) i = 1 n [ Y ( ( μ - 1 ) n + 1 ) - y μ ( i ) ] 2 denotes departure of the integrated signal Y ( k , μ ) from the local trend y μ ( i ) at the segment μ.
The removal of cycles in these time series affects the size of scaling region where the Hurst exponent is computed, as shown in Figure 3d, as well as the values of Hurst exponents. Note that the cycle is quite regular resulting in a large Hurst exponent H t r e n d = 1 . 92 , which is also shown in Figure 3d. The results for the Hurst exponents of the detrended time series are found to be H 1 , i.e., much larger than in the random Brownian motion ( H B M = 1 / 2 ), suggesting strongly persistent fluctuations in all three time series on ddDiggs. Note also that, within numerical error bars, these values are compatible with the scaling relation ϕ = 2 H - 1 , which is expected in the case of self-organized stochastic processes [33].
Performing a similar analysis for the time series of messages from the empirical data of Ubuntu chats, we obtain the results which are displayed in Figure 4a–d. The obtained quantitative measures, however, indicate that we are dealing with a different stochastic point process. Here, the number of positive and the number of negative emotion messages are approximately balanced (see Figure 4a). Consequently the time series of positive and negative emotional messages fluctuate within similar ranges, and their power spectral densities have comparable slopes, i.e., ϕ a l l = 0 . 66 ± 0 . 02 , ϕ + = 0 . 55 ± 0 . 02 , and ϕ - = 0 . 50 ± 0 . 02 . Moreover, no prominent daily cycle is found. A weak seven days cycle can be determined (depicted in Figure 4c). Consequently, in the detrended time series an extended scaling region of the fluctuations is found, as shown in Figure 4d. The numerical values of the Hurst exponents are smaller, compared with the ones in ddDiggs; However, for all time series the Hurst exponents are in the range H ( 0 . 5 , 1 ) , indicating that the persistent fluctuations also occur in the dynamics of chats. Further understanding of the stochastic processes in online chats and Blogs and mechanisms underlying clustering of emotional messages are studied below within agent-based modeling approach. (See also [38]).
The above performed fractal analysis of the underlying stochastic processes in the empirical data of ddDiggs and Ubuntu chats, complements our earlier study of the empirical data for Blogs [10,28], Diggs [12] and Chats [19,29,30]. In the remaining part of this work in Section 3 and Section 4, we attempt to understand the structure and dynamics observed in these empirical data, by means of theoretical modeling. We use a simple but highly nontrivial agent-based model of the emotional agents interacting on a co-evolving network. Specifically, we aim to unravel the mechanisms behind the observed coexistence in the evolution of communities and the abundance of negative emotions on popular Diggs [12]. Furthermore, the stability of the chat processes with a well-balanced use of positive and negative emotions, that we witnessed in the empirical data of chat channels [19,29], will be examined here (by means of the simulations) against the activity of the emotional Bots. A summary of all fractal measures for a compariosn of the simulated and the empirical data will be given in the discussion in Section 5.

3. Blogging by Emotional Agents: Structure of the Co-Evolutionary Model and Simulations

In the agent-based modeling approach, the agents, representing users on a given Web portal, have certain attributes which determine their activity over time, thus affecting the course of the process. The agents establish connections over an evolving network. Hence, the activity of other agents (directly or indirectly) influences the connected agents, changing their attributes and possibly triggering their actions. The agent’s attributes are motivated by psychology profiles of users. To a large extent, user’s psychology profile determines its pattern of activity online, its interactivity time, and use of emotions. Thus the agents have to be designed in a way that can capture these relevant features of users on a specific Web portal and statistically match their activity pattern. The required minimum number of attributes can be summarized as follows [59]:
A [ i ; ( a i ( t ) , v i ( t ) ) ; p r o f i l e ; p e r s o n a l . c o n n e c t i o n s ; d e l a y . t i m e . d i s t r i b u t i o n ]
Here, agent’s ID number i and its profile (see below) are fixed by the agent’s appearance in the system; on the other side, the agent’s emotional state, which is described by two variables—arousal, a i ( t ) , and valence, v i ( t ) —vary dynamically under the influence exerted by other agents in the network, possible external noise and mere relaxation. Similarly, the agent’s personal connections on the network are updated, due to the evolution of network and the agent’s activity. The delay (or interactivity) time is an annealed variable, driven from a given distribution Δ t P ( Δ t ) after every completed action of the agent. Fixing the parameters which determine the profile of an agent is strictly related with the allowed actions, which are characteristic of the communication system in question, i.e., Blogs, Chats, or other. Specifically, in Chat channels, users differ considerably by the number of messages that they post in the entire dataset. For the ensemble of users, one can determine the distribution of the number of messages per user P ( N c ) , which, together with the ensemble averaged delay time distribution, P ( Δ t ) is a finger print of the chat channel. Thus, the profile of the agents can be fixed by the number of messages that the agent can post during the simulation time, N c i P ( N c ) , and its inclination towards personalized communications, g 0 P ( g 0 ) , which also can be inferred from the empirical data. The agent-based model of chats will be discussed in Section 4, see also [38]. Here, we will describe in more details the blogging dynamics.
In Blogs, a number of potential actions of users (and agents) are allowed, each of which is controled by a parameter (probability). For instance, the following actions can be detected [45], and the related probabilities (the distributions obtained by averaging over all users) measured in the empirical data of ddDiggs: g P ( g ) —the probability of writing a new post, else ( 1 - g ) commenting the existing posts; μ ( T 0 ) —the probability that user looks for a post older than the exposure window t - T 0 . Together with the delay time distribution P ( Δ t ) and the pace p ( t ) by which new users arrive per time bin in the ddDiggs, which are shown in Figure 5, the above set of parameters fully characterizes the empirical system in question.
In contrast to chats, in blogging dynamics the agents are in principle not limited in the number of comments that they can write during the simulation time. Rather, their heterogeneity is imposed dynamically via a finite lifetime of the posts to which the agents are connected during the evolution of the system. The lifetime of a post t P P ( t P ) is also fixed from the empirical data; t P is the distance between the time when the post appeared in the system and the last recorded comment on it [45]. Note that, due to complexity of the process, certain hidden correlations among these parameters may exist. Therefore, it is advisable to define the agent’s profiles by inferring the related quantities from the same empirical dataset, thus implicitly taking into account such correlations. In our model, the agent’s profiles are determined by fixing the probability g P ( g ) by the agent’s first appearance, and furthermore taking the delay time Δ t P ( Δ t ) , and the probability for looking at old posts with probability μ ( T 0 ) as well as the lifetime of posts t P P ( t P ) from the dataset of ddDiggs (see Table 1). Of course, the model can run for a variety of parameters far away from these empirical values, see [38,45].
Table 1. Parameters of the model that are used for the simulations.
control ofparameter & valuenature
individual maps c 1 = d 1 = 1 , c 2 = 2 . 0 , γ = 0 . 05 , a c = 0 . 5 theoretical
users & posts g P ( g ) , t P P ( t P ) , Δ t P ( Δ t ) , T 0 = 2 days ⇒ μ ( T 0 ) = 0 . 05 empirical
driving p ( t ) empirical
external influence f = 0 . 4 theoretical
Figure 5. From the ddDiggs dataset: (a) Cumulative distribution of delay times P ( Δ t ) ; Inset: distribution of weights of links from the same data; (b) Time series of new users p ( t ) .
Entropy 15 05084 g005
Having defined the agent’s profiles, as discussed above, the dynamics of interacting agents and co-evolution of the network on which they are situated is taken by dynamic update rules of the model. The general structure of the model involves the following essential steps:
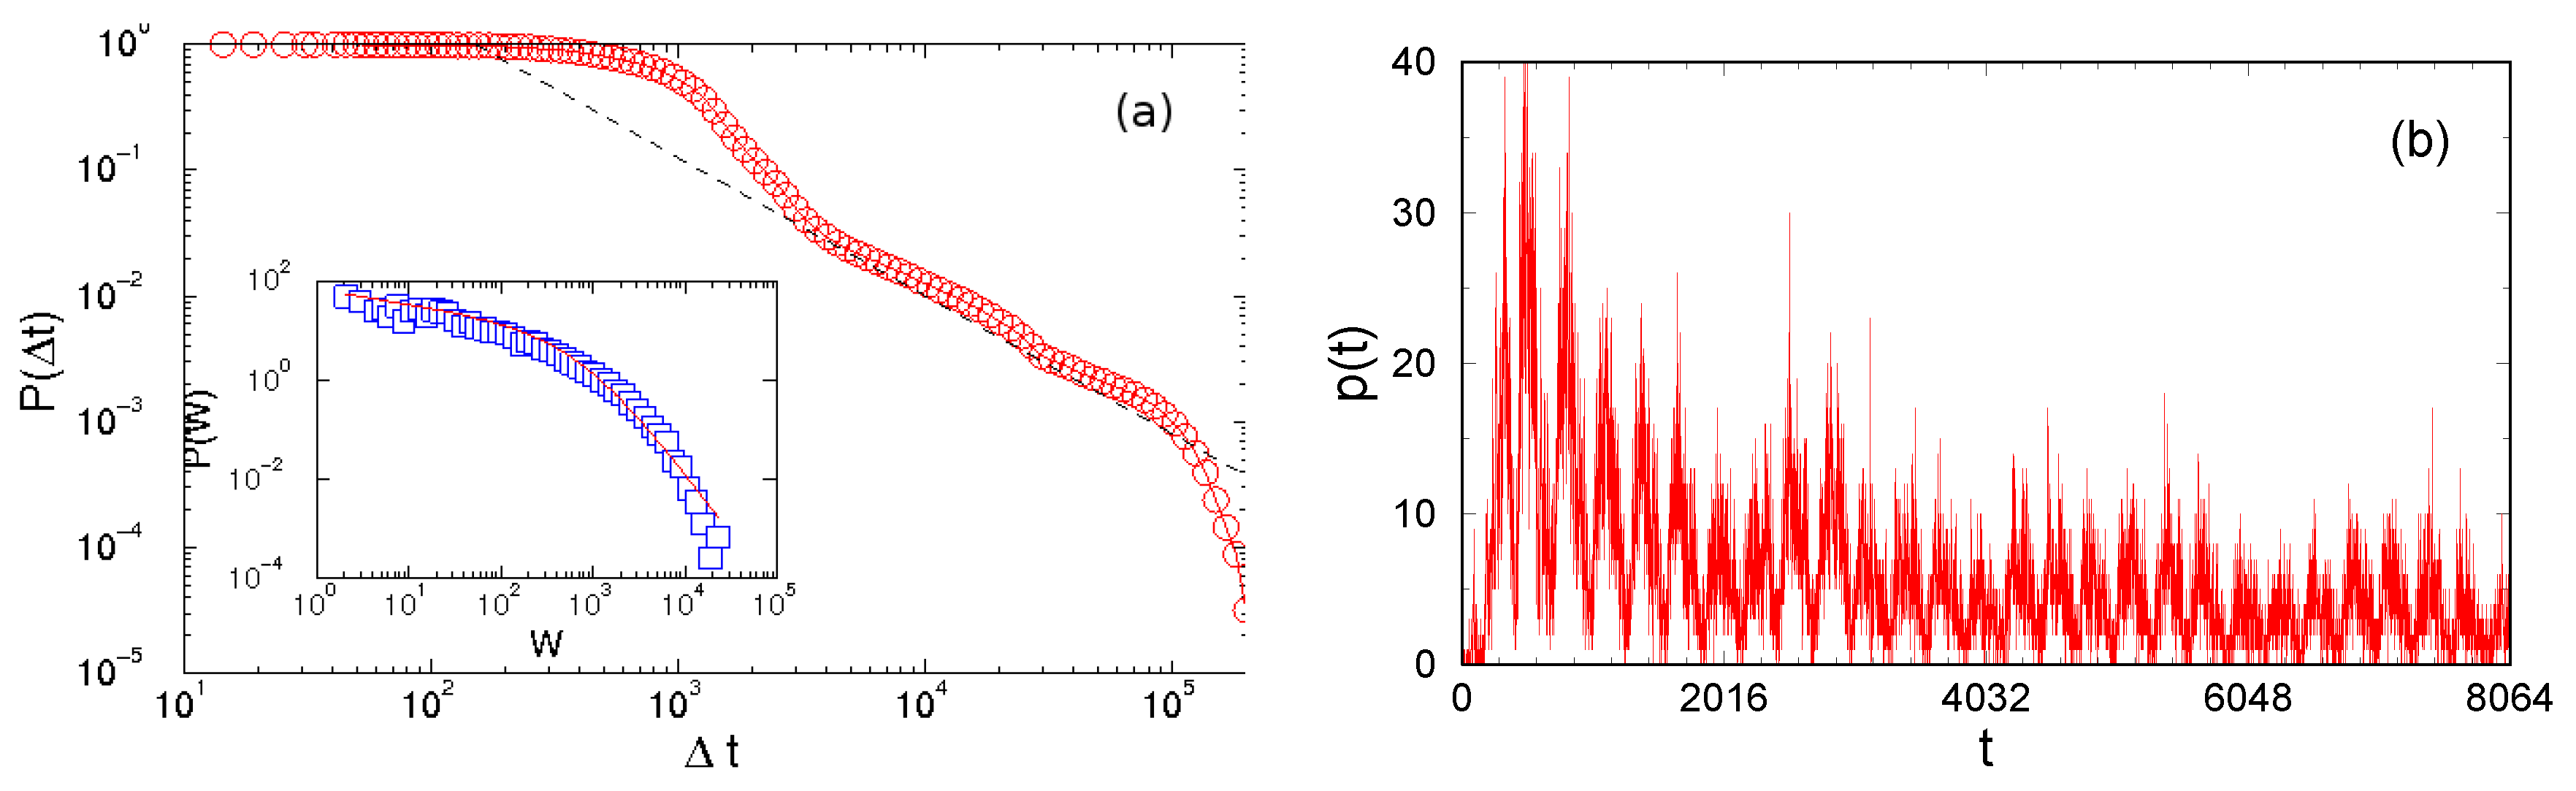
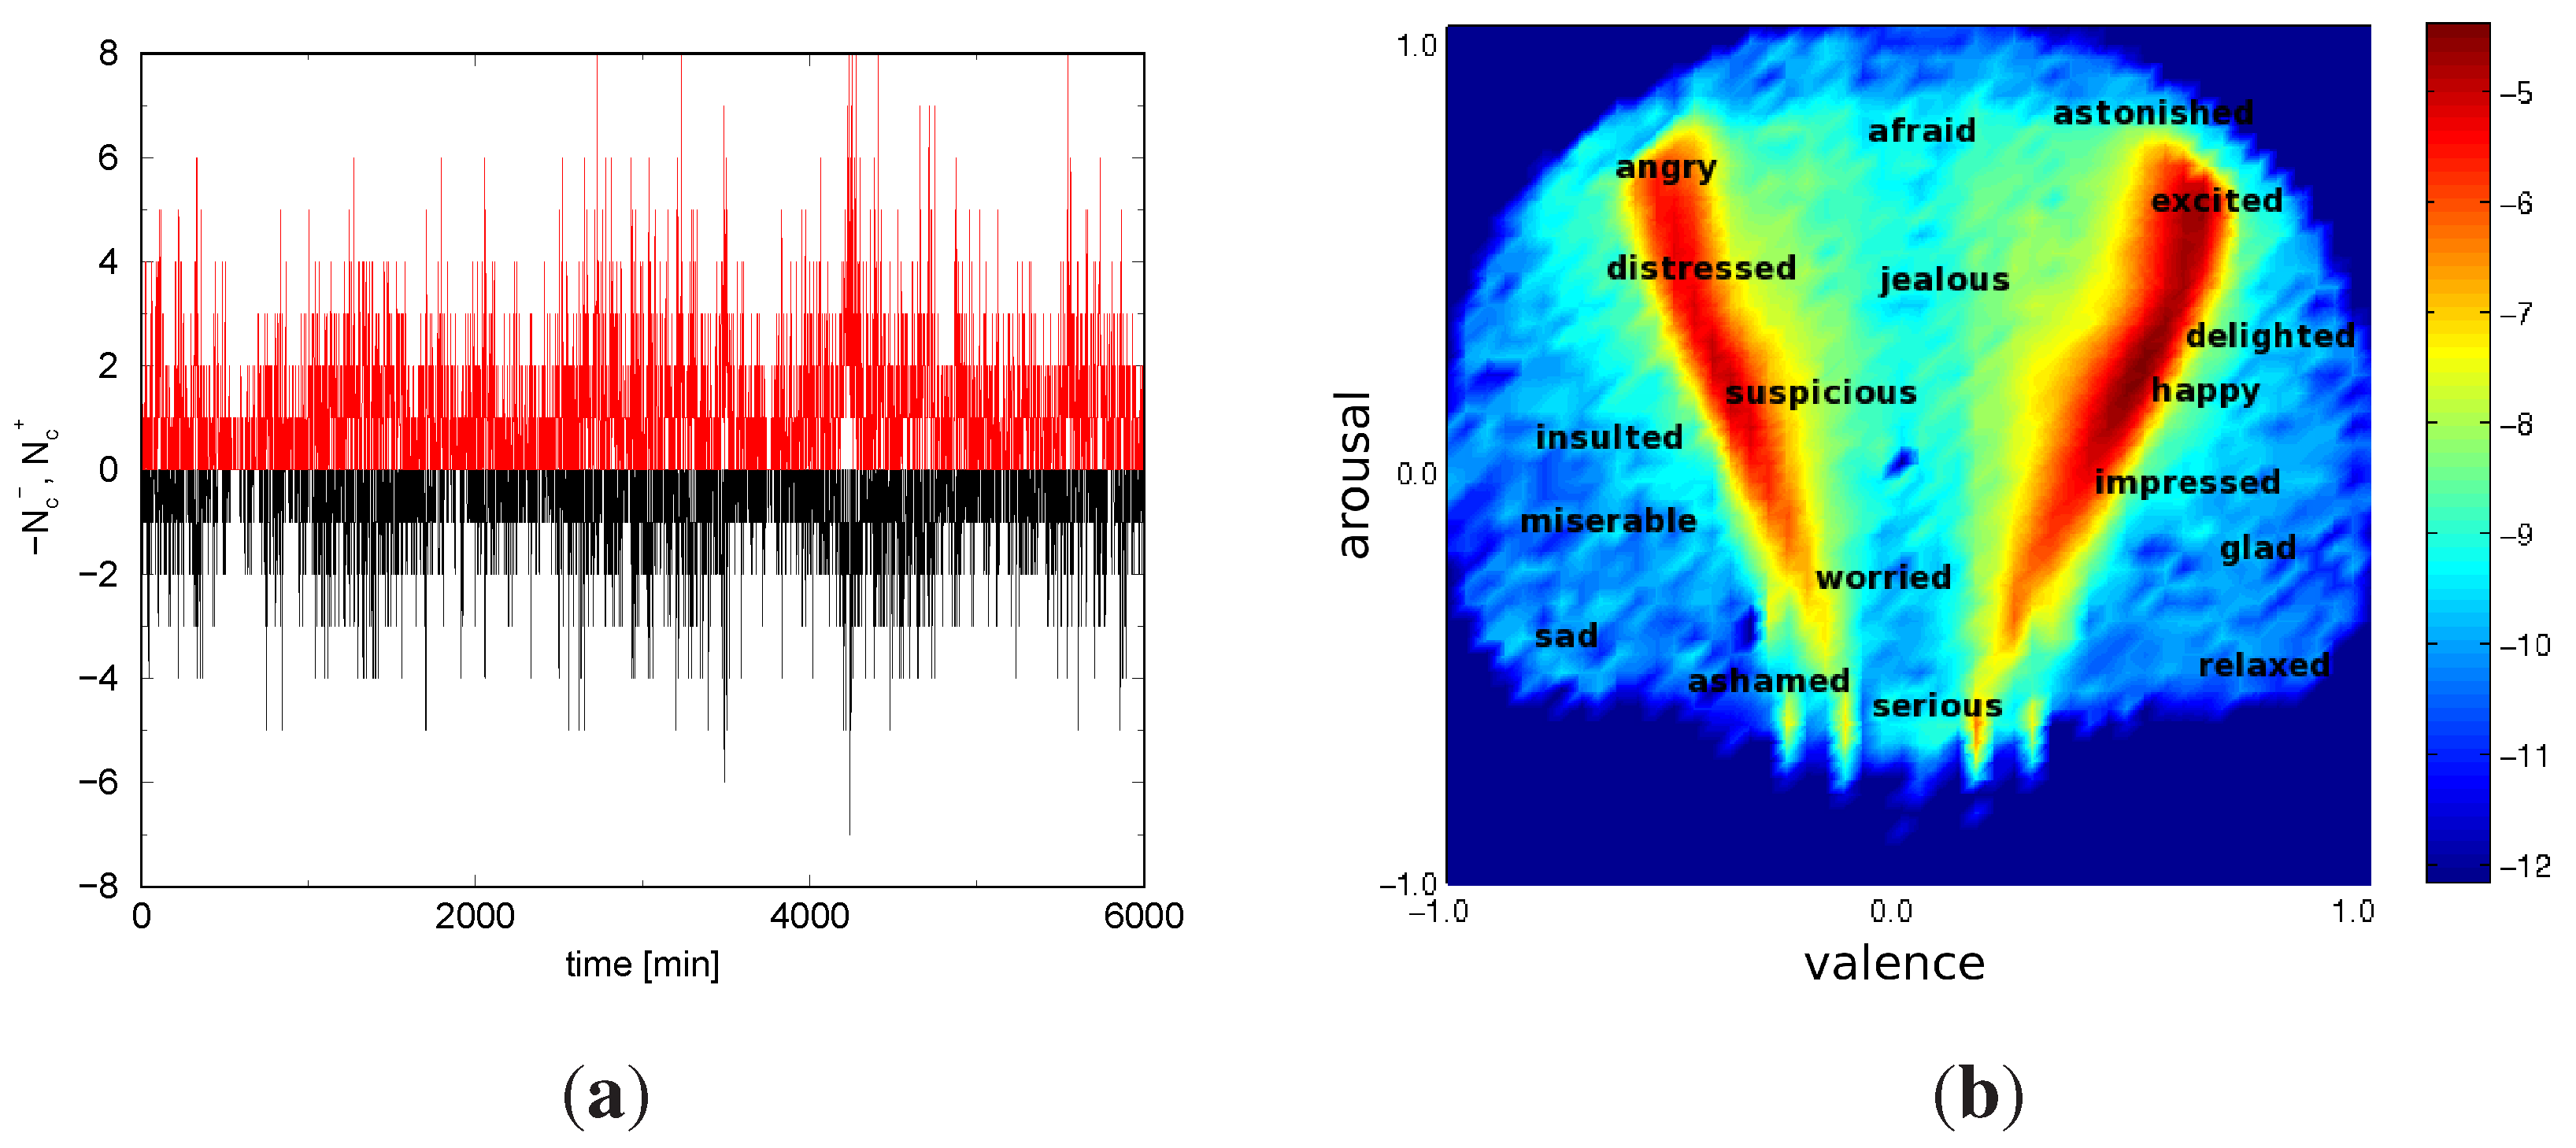
  • Driving. Starting with an empty system, at each time step t we add p ( t ) new agents; these agents become immediately active, thus potentially triggering the action of other agents in future steps. Chosing p ( t ) as the empirical time series of new users (with respect to the beginning of the dataset), has the following advantages. Firstly, the empirical time series p ( t ) introduces the daily cycles, characteristic for human activity. The p ( t ) time series from ddDiggs dataset is given in Figure 5b. Secondly, the time bin of the empirical time series sets the physical meaning of time step in the simulations; therefore, this allows a comparison of the simulated and the empirical system as well as predictions of potential future events.
  • Building influence. Agent’s activity—posting a new post or comment on an existing post—can influence emotional states of other agents who are linked to that post. The influence field for a particular agent i builds from all posts and/or comments posted within previous and current time step, to which the agent has a link A i p > 0 . The arousal field is composed from the arousals of related comments, i.e.,
    h i a ( t ) = p C ( t , t - 1 ) A i p a p C ( t ) ( 1 + v i ( t ) v p C ( t ) ) p C ( t , t - 1 ) A i p n p C ( t ) ( 1 + v i ( t ) v p C ( t ) ) ; h m f a ( t ) = p C ( t , t - 1 ) a p C ( t ) p C ( t , t - 1 ) n p C ( t )
    Here, the network area C ( t , t - 1 ) of currently active posts is identified as post on which an activity occurred in two preceding time steps. a p C ( t ) and v p C ( t ) are the total arousal and the average valence of a post p, calculated from the comments in two preceding time steps, while n p C ( t ) is the number of all comments posted on it during that time period. A i p represents the matrix elements of the network, i.e., A i p > 0 if user i is connected with the active post p, while A i p = 0 if there is no link between them at the time t when the fields are computed. Note that such links may appear as the system evolves. In Equation (2) the individual arousal fields h i a ( t ) is modified by (dis)similarity in agent’s actual valence, v i ( t ) , and the valence of recent comments on the post, v p C ( t ) . The common field h m f a ( t ) affects each active agent equally; it is given as a sum of arousals of all active posts. The valence field h i v ( t ) in Equation (6) acting on the agent i, as well as the corresponding common field h m f v ( t ) , are also determined from the contributions of all active posts at time t. In this case, however, we take into account contributions from the positive and the negative comments separately; the neutral comments do not contribute to the valence field. Depending on the current emotional state of the agent, positive and negative fields can lead to different effects [60], in particular, positive (negative) state will be influenced more with negative (positive) field, and vice versa. Here we assume that both components influence user valence, but with different strength according to the following expression:
    h i v ( t ) = 1 - 0 . 4 r i ( t ) 1 . 4 p C ( t , t - 1 ) A i p N p + ( t ) p C ( t , t - 1 ) A i p N p e m o ( t ) - 1 + 0 . 4 r i ( t ) 1 . 4 p C ( t , t - 1 ) A i p N p - ( t ) p C ( t , t - 1 ) A i p N p e m o ( t )
    where the valence polarity of the user i is given by r i ( t ) = v i ( t ) | v i ( t ) | , and N p ± ( t ) is the number of positive/negative comments written on post p in the period ( t - 1 , t ) . The normalization factor N p e m o ( t ) is defined as N p e m o ( t ) = N p + ( t ) + N p - ( t ) . Note that, in the absence of psychology-based arguments, the pre-factor 0.4 is chosen by formal reasons, i.e., to avoid a fast switching of the valence polarity (in the limiting cases: 0 or 1) as well as an artificial reduction of the phase space (if the value 0.5 is used). The mean-field contributions to the valence stem from the entire set of currently active posts C ( t , t - 1 ) , and are independent on how users are linked to them:
    h i , m f v ( t ) = 1 - 0 . 4 r i ( t ) 1 . 4 p C ( t , t - 1 ) N p + ( t ) p C ( t , t - 1 ) N p e m o ( t ) - 1 + 0 . 4 r i ( t ) 1 . 4 p C ( t , t - 1 ) N p - ( t ) p C ( t , t - 1 ) N p e m o ( t )
    However, the mean-field effects are perceived individually by each agent, depending on the polarity r i ( t ) of agent’s current valence.
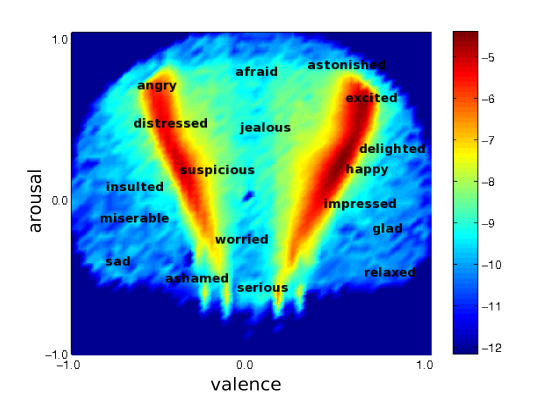
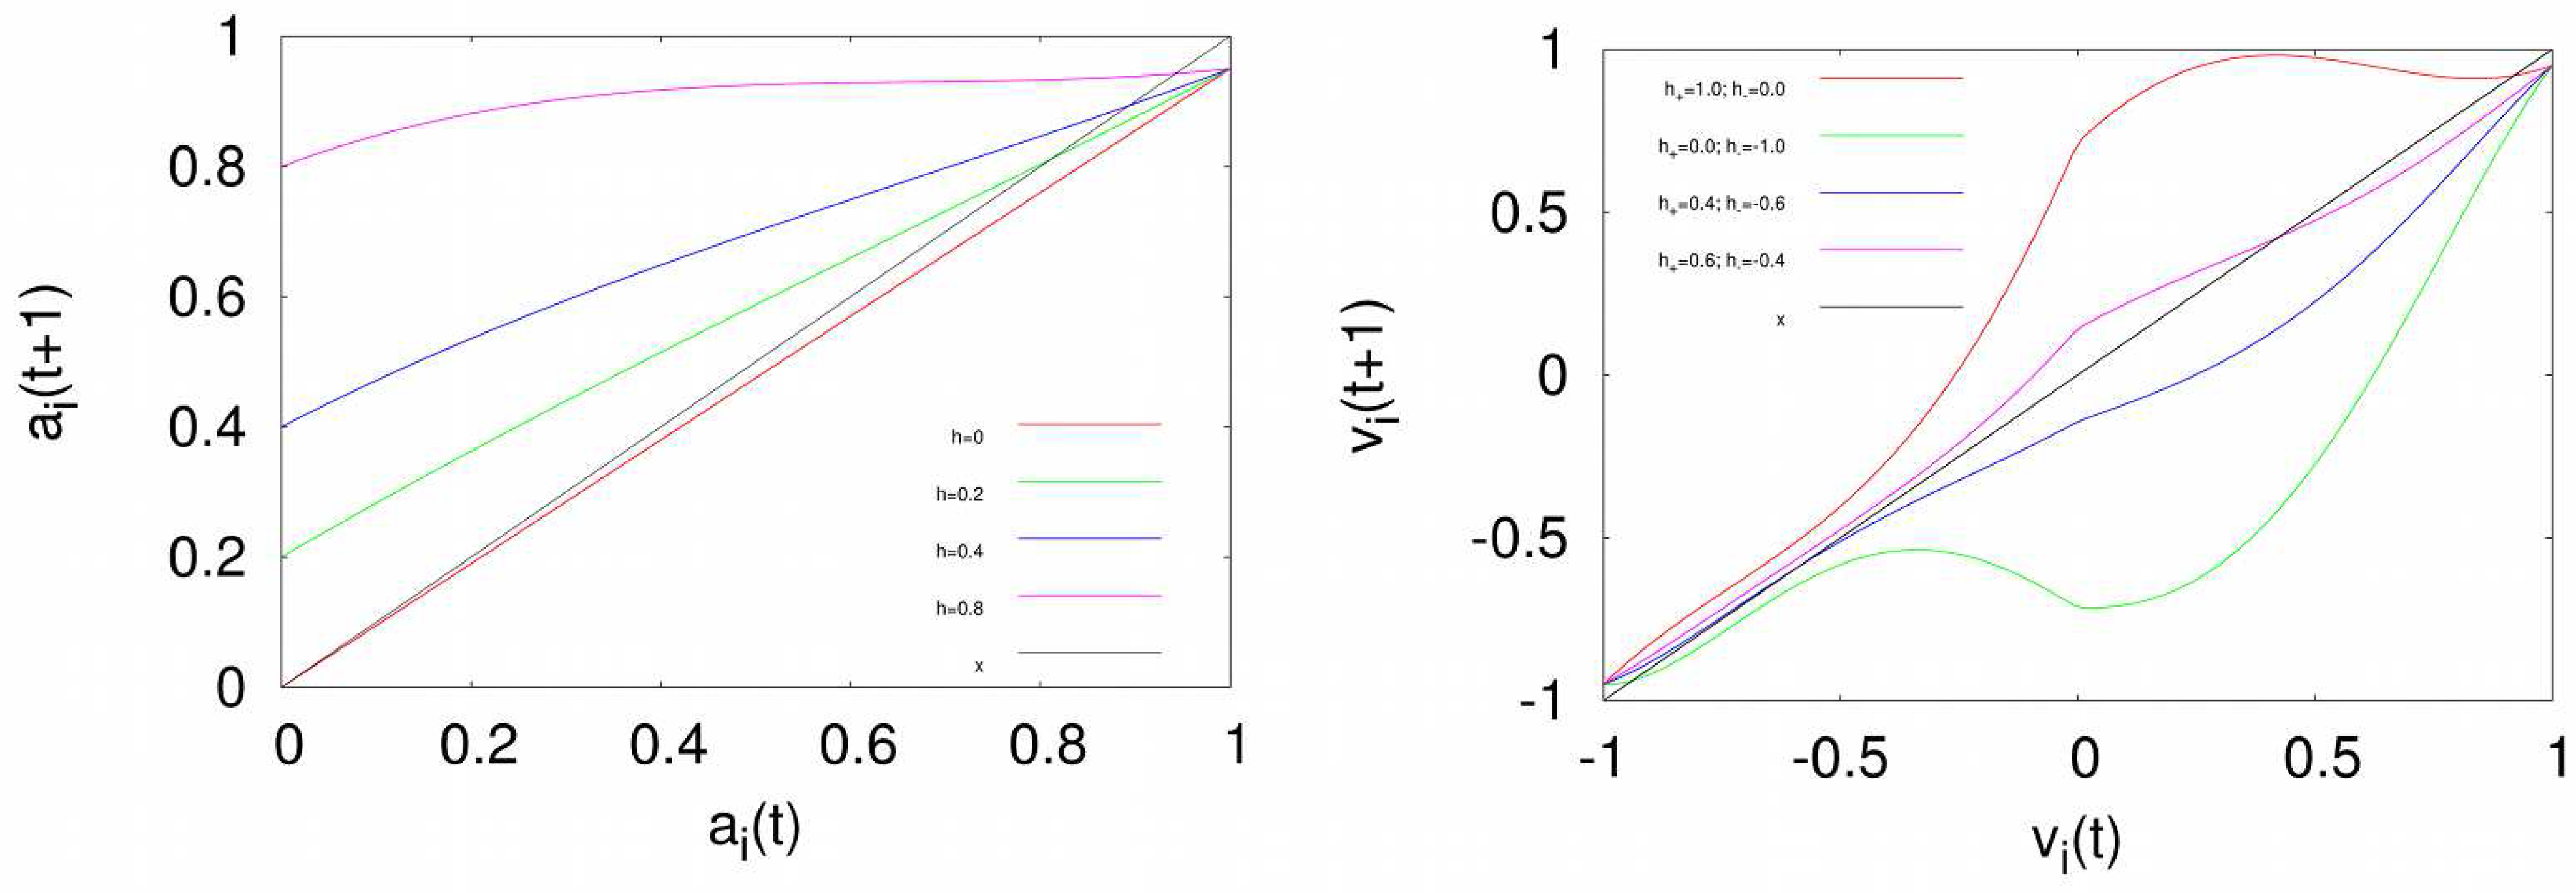
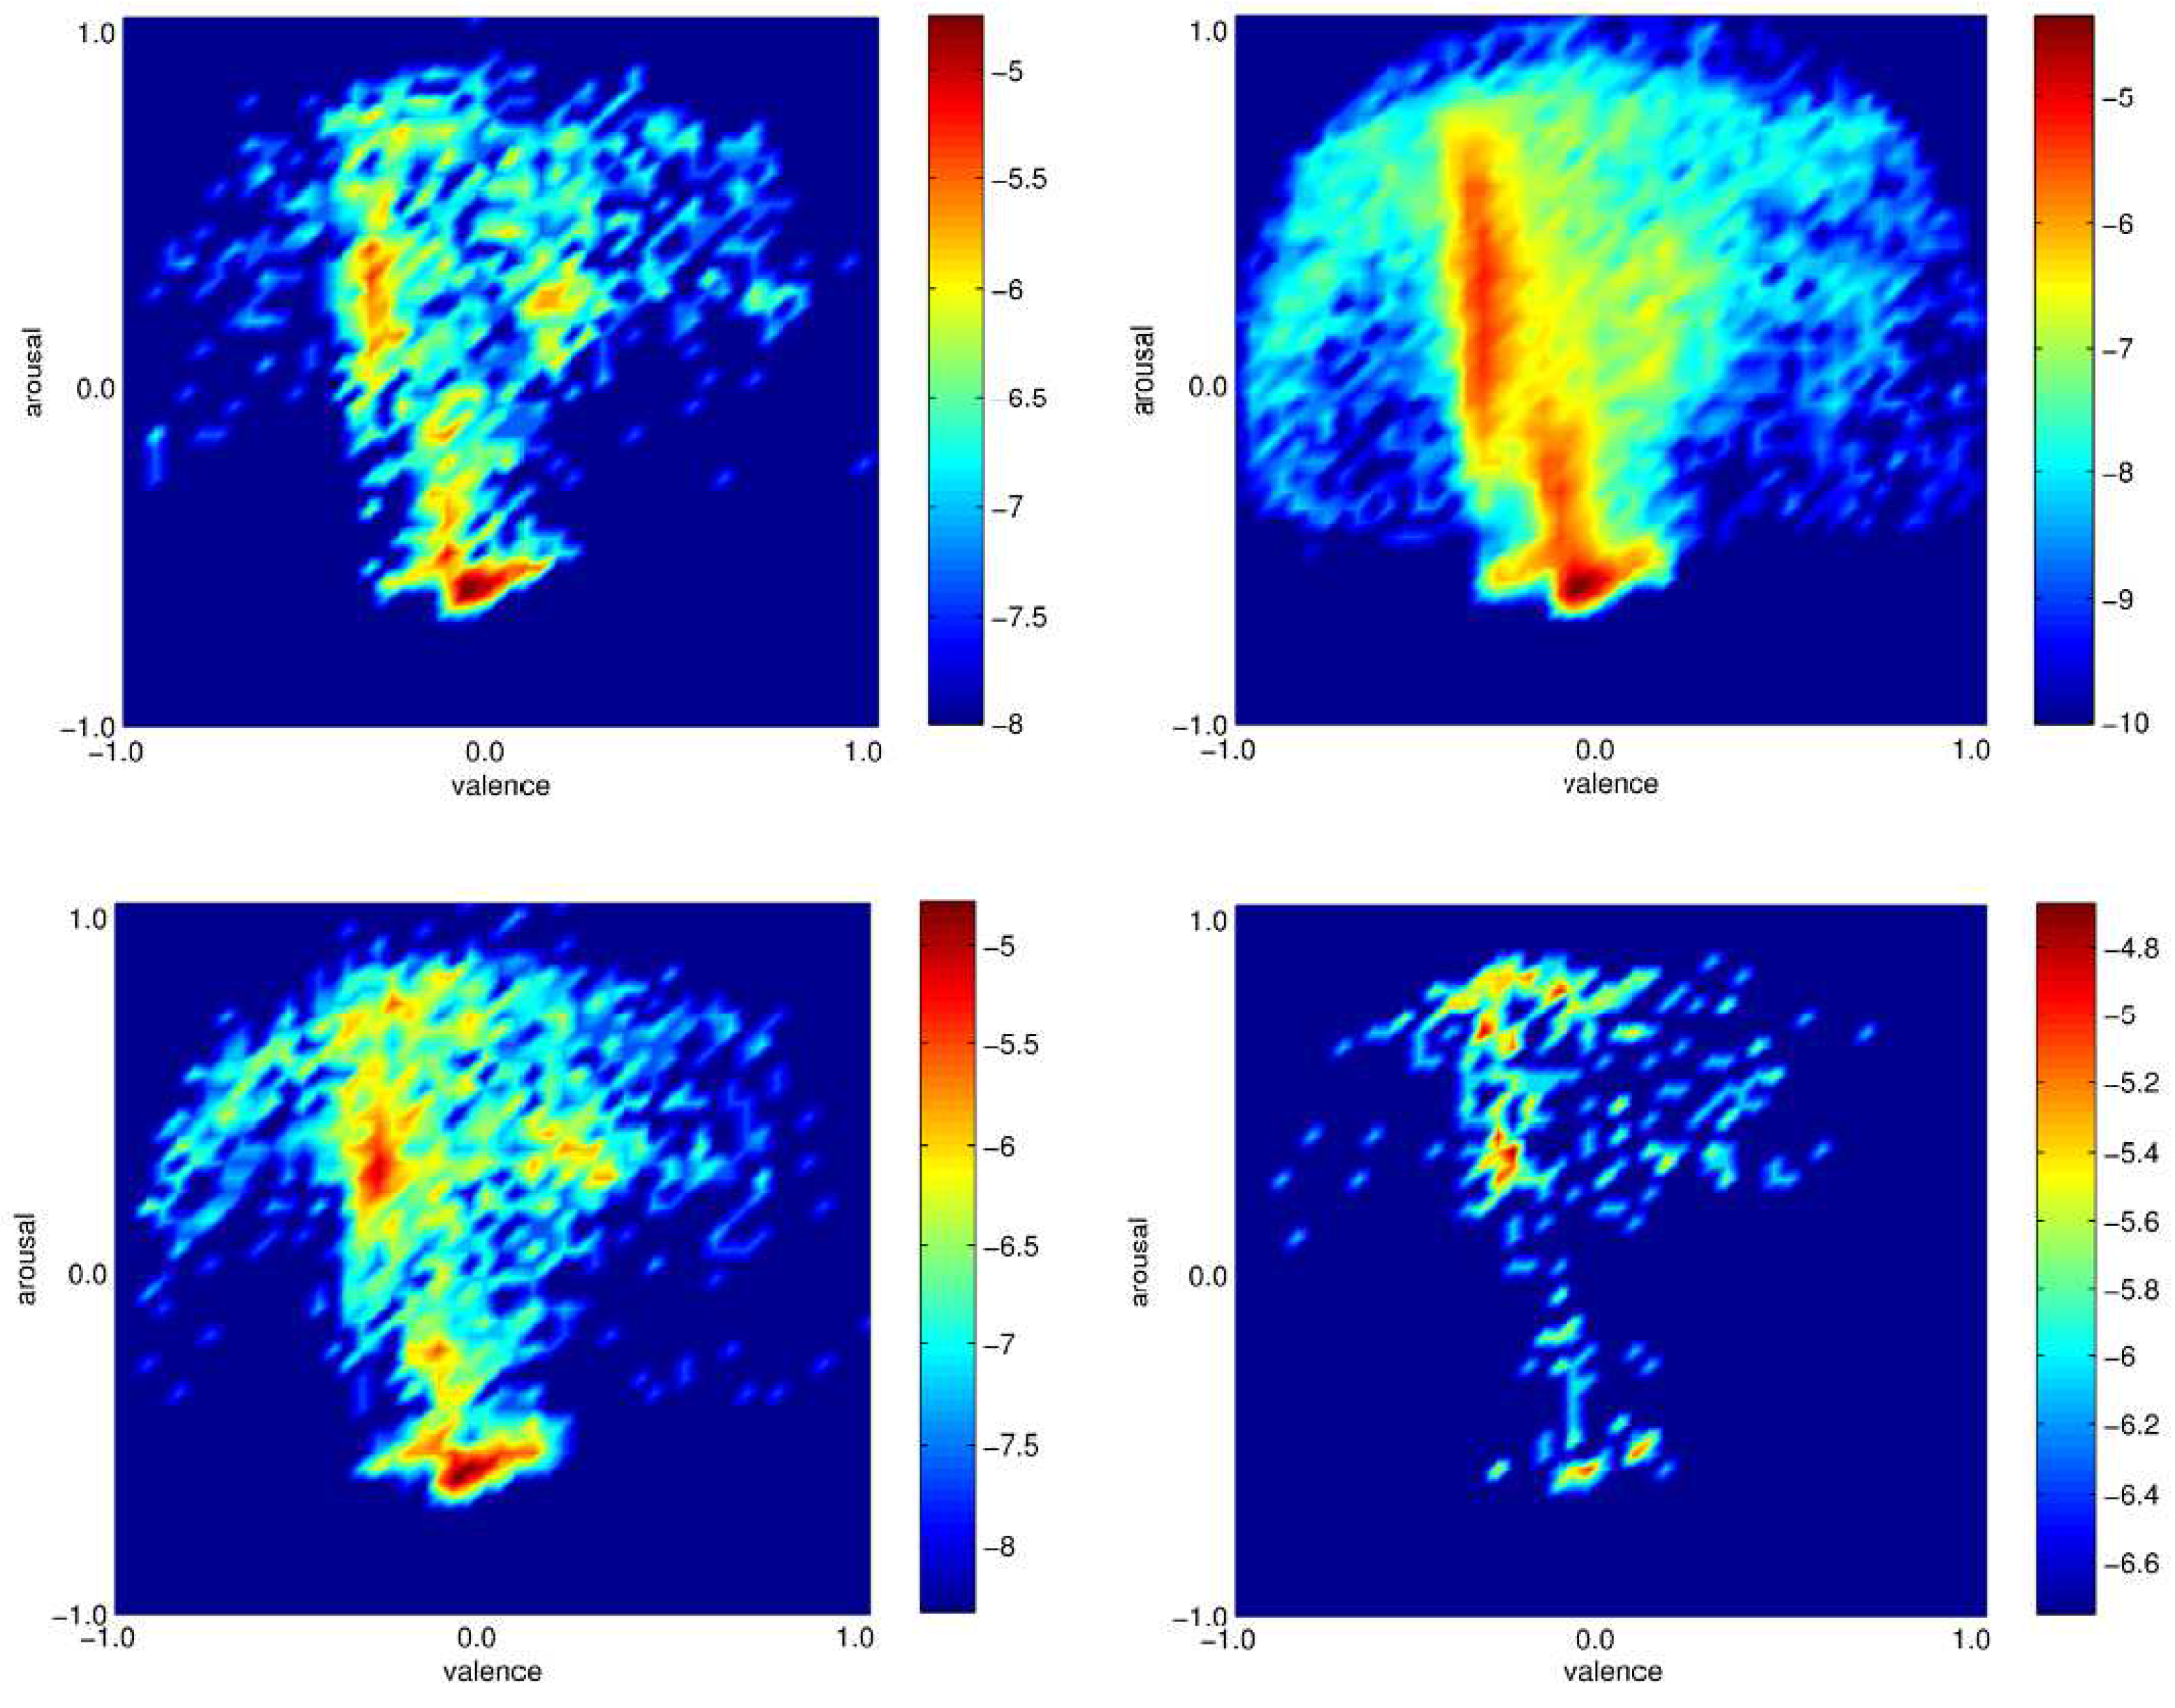
  • Update of emotion variables. When the agent’s interactivity time since previous action expires, Δ t = 0 , the agent’s arousal a i ( t ) [ 0 , 1 ] and valence v i ( t ) [ - 1 , + 1 ] are updated taking into account influence of the above fields; meanwhile, the relaxation towards zero state applies with the rates γ a and γ v . The following nonlinear maps with polynomial nonlinearities are assumed [44,45,60]:
    a i ( t + 1 ) = ( 1 - γ a ) a i ( t ) + [ h i a ( t ) + f h m f a ( t ) ] ( d 1 + d 2 ( a i ( t ) - a i ( t ) 2 ) ) ( 1 - a i ( t ) ) if   Δ t i = 0 ( 1 - γ a ) a i ( t ) otherwise
    v i ( t + 1 ) = ( 1 - γ v ) v i ( t ) + [ h i v ( t ) + f h m f v ( t ) ] ( c 1 + c 2 ( v i ( t ) - v i ( t ) 3 ) ) ( 1 - | v i | ) if   Δ t i = 0 ( 1 - γ v ) v i ( t ) otherwise
    The parameters of the nonlinear maps are selected as d 1 = c 1 = 1 , to ensure additive actions of the influence fields. Other parameters are selected such that the maps cover a large area of the phase space when the fields vary within their typical values in the simulations. In particular, we use c 2 = d 2 = 0 . 5 and γ = 0 . 05 and the fraction f = 0 . 4 of the common-field influence. The situations corresponding to typical values of the fields are shown in Figure 6.
Figure 6. Two nonlinear maps for the arousal a i ( t ) and valence v i ( t ) are plotted for a few typical values of the “influence fields”.
Entropy 15 05084 g006
  • High arousal triggers action. With a probability proportional to the agent’s updated arousal, the agent becomes active posting a new post or comment to one of the active posts in its neighbourhood on the network. In addition, with a small probability μ ( T 0 ) the agent searches for an older post and puts a new comment on that post too; thus, the old post with a new comment is brought to the exposure window again; the posts are selected preferentially according to the existing number of negative comments. The lifetime of posts is systematically updated. It is assumed that the agent’s current emotional state ( a i ( t ) and v i ( t ) ) is transfered into its posted comment.
  • Rules & Implementation. The action rules which are described above are directly motivated by user activity on the empirical systems. The decision of an agent i to chose a post p between the exposed post is parametrized by the time-dependent probability p p ( t ) = 0 . 5 ( 1 + v p C ( t ) v i ( t ) ) + N p c ( t ) p [ 0 . 5 ( 1 + v p C ( t ) v i ( t ) ) + N p c ( t ) ] , depending on the number of comments on that post N p c ( t ) and the valence similarity. Similarly, an old post is selected preferentially according to the negativity of the charge of all comments on it, with (properly normalized) probabilities p j , o l d ( t ) 0 . 5 + | Q j ( t ) | , if the charge is negative, else p j , o l d ( t ) 0 . 5 . Lifetimes of posts are systematically updated, i.e., decreased by one at every time step (already expired posts are not considered). These rules, in association with the control parameters, are implemented in program code (see the Algorithm 1). More detailes can be found in [45].
The control parameters that are introduced by the dynamic rules of the model are summarized in Table 1. They can be divided into indicated categories.
Algorithm 1 Pseudocode for Emotional Agents on the Emerging Bipartite Network
1:INPUT: Parameters p ( t ) , μ ( T 0 ) , T 0 , t m a x ; Distributions P ( Δ t ) , P ( g ) , P ( t P ) ); start User List UL, Exposed Posts List EPL, New User List NUL, Prompted User List PUL, Active User List AUL; Exposed User List EUL;
2:for all t < t m a x do
3:   for all i U L do
4:      relax user valence v i ( t ) and arousal a i ( t ) with the rate γ
5:    end for
6:   add p ( t ) new users to N U L with a i [ 0 , 1 ] , v i [ - 1 , 1 ] fix g i P ( g ) and set Δ t = 0
7:   for all i N U L do
8:       v i ( t ) and a i ( t ) update with current MF term in Equation (5) and Equation (6)
9:      move to AUL
10:    end for
11:   for all i P U L do
12:      compute personal valence and arousal fields and update a i ( t ) and v i ( t ) according to Equation (5) and Equation (6)
13:      with probability a c a i ( t ) move to AUL
14:    end for
15:   for all i A U L do
16:      with prob. g i post a new post k; fix its lifetime t k from the distribution t k P ( t )
17:      else with probability p p select a post p from EPL and make comment on it
18:      with prob. μ select additional old post preferetially with p j , o l d and make comment on it
19:    end for
20:   Update Network connections { A i p } ; Decrease lifetime of all existing posts by one
21:   Update EPL
22:   Update EUL
23:   for all i U L do
24:      if Δ t = 0 set new Δ t based on P ( Δ t )
25:      else Δ t - -
26:    end for
27:   for all i E U L do
28:      if Δ t 0 set new Δ t from P ( Δ t )
29:    end for
30:   Update PUL (all Users with Δ t = 0 )
31:   Update UL
32:   Sampling temporal quantities
33:end for
34:AMPLING
In the simulations, a number of parameters can be freely varied away from their empirical values. Variation of the fraction f of common-field contribution in Equation (5) and Equation (6) was shown to have a strong influence onto formation of communities in [45]. Here, we fix f = 0 . 4 and keep the empirical values of the above described parameters.

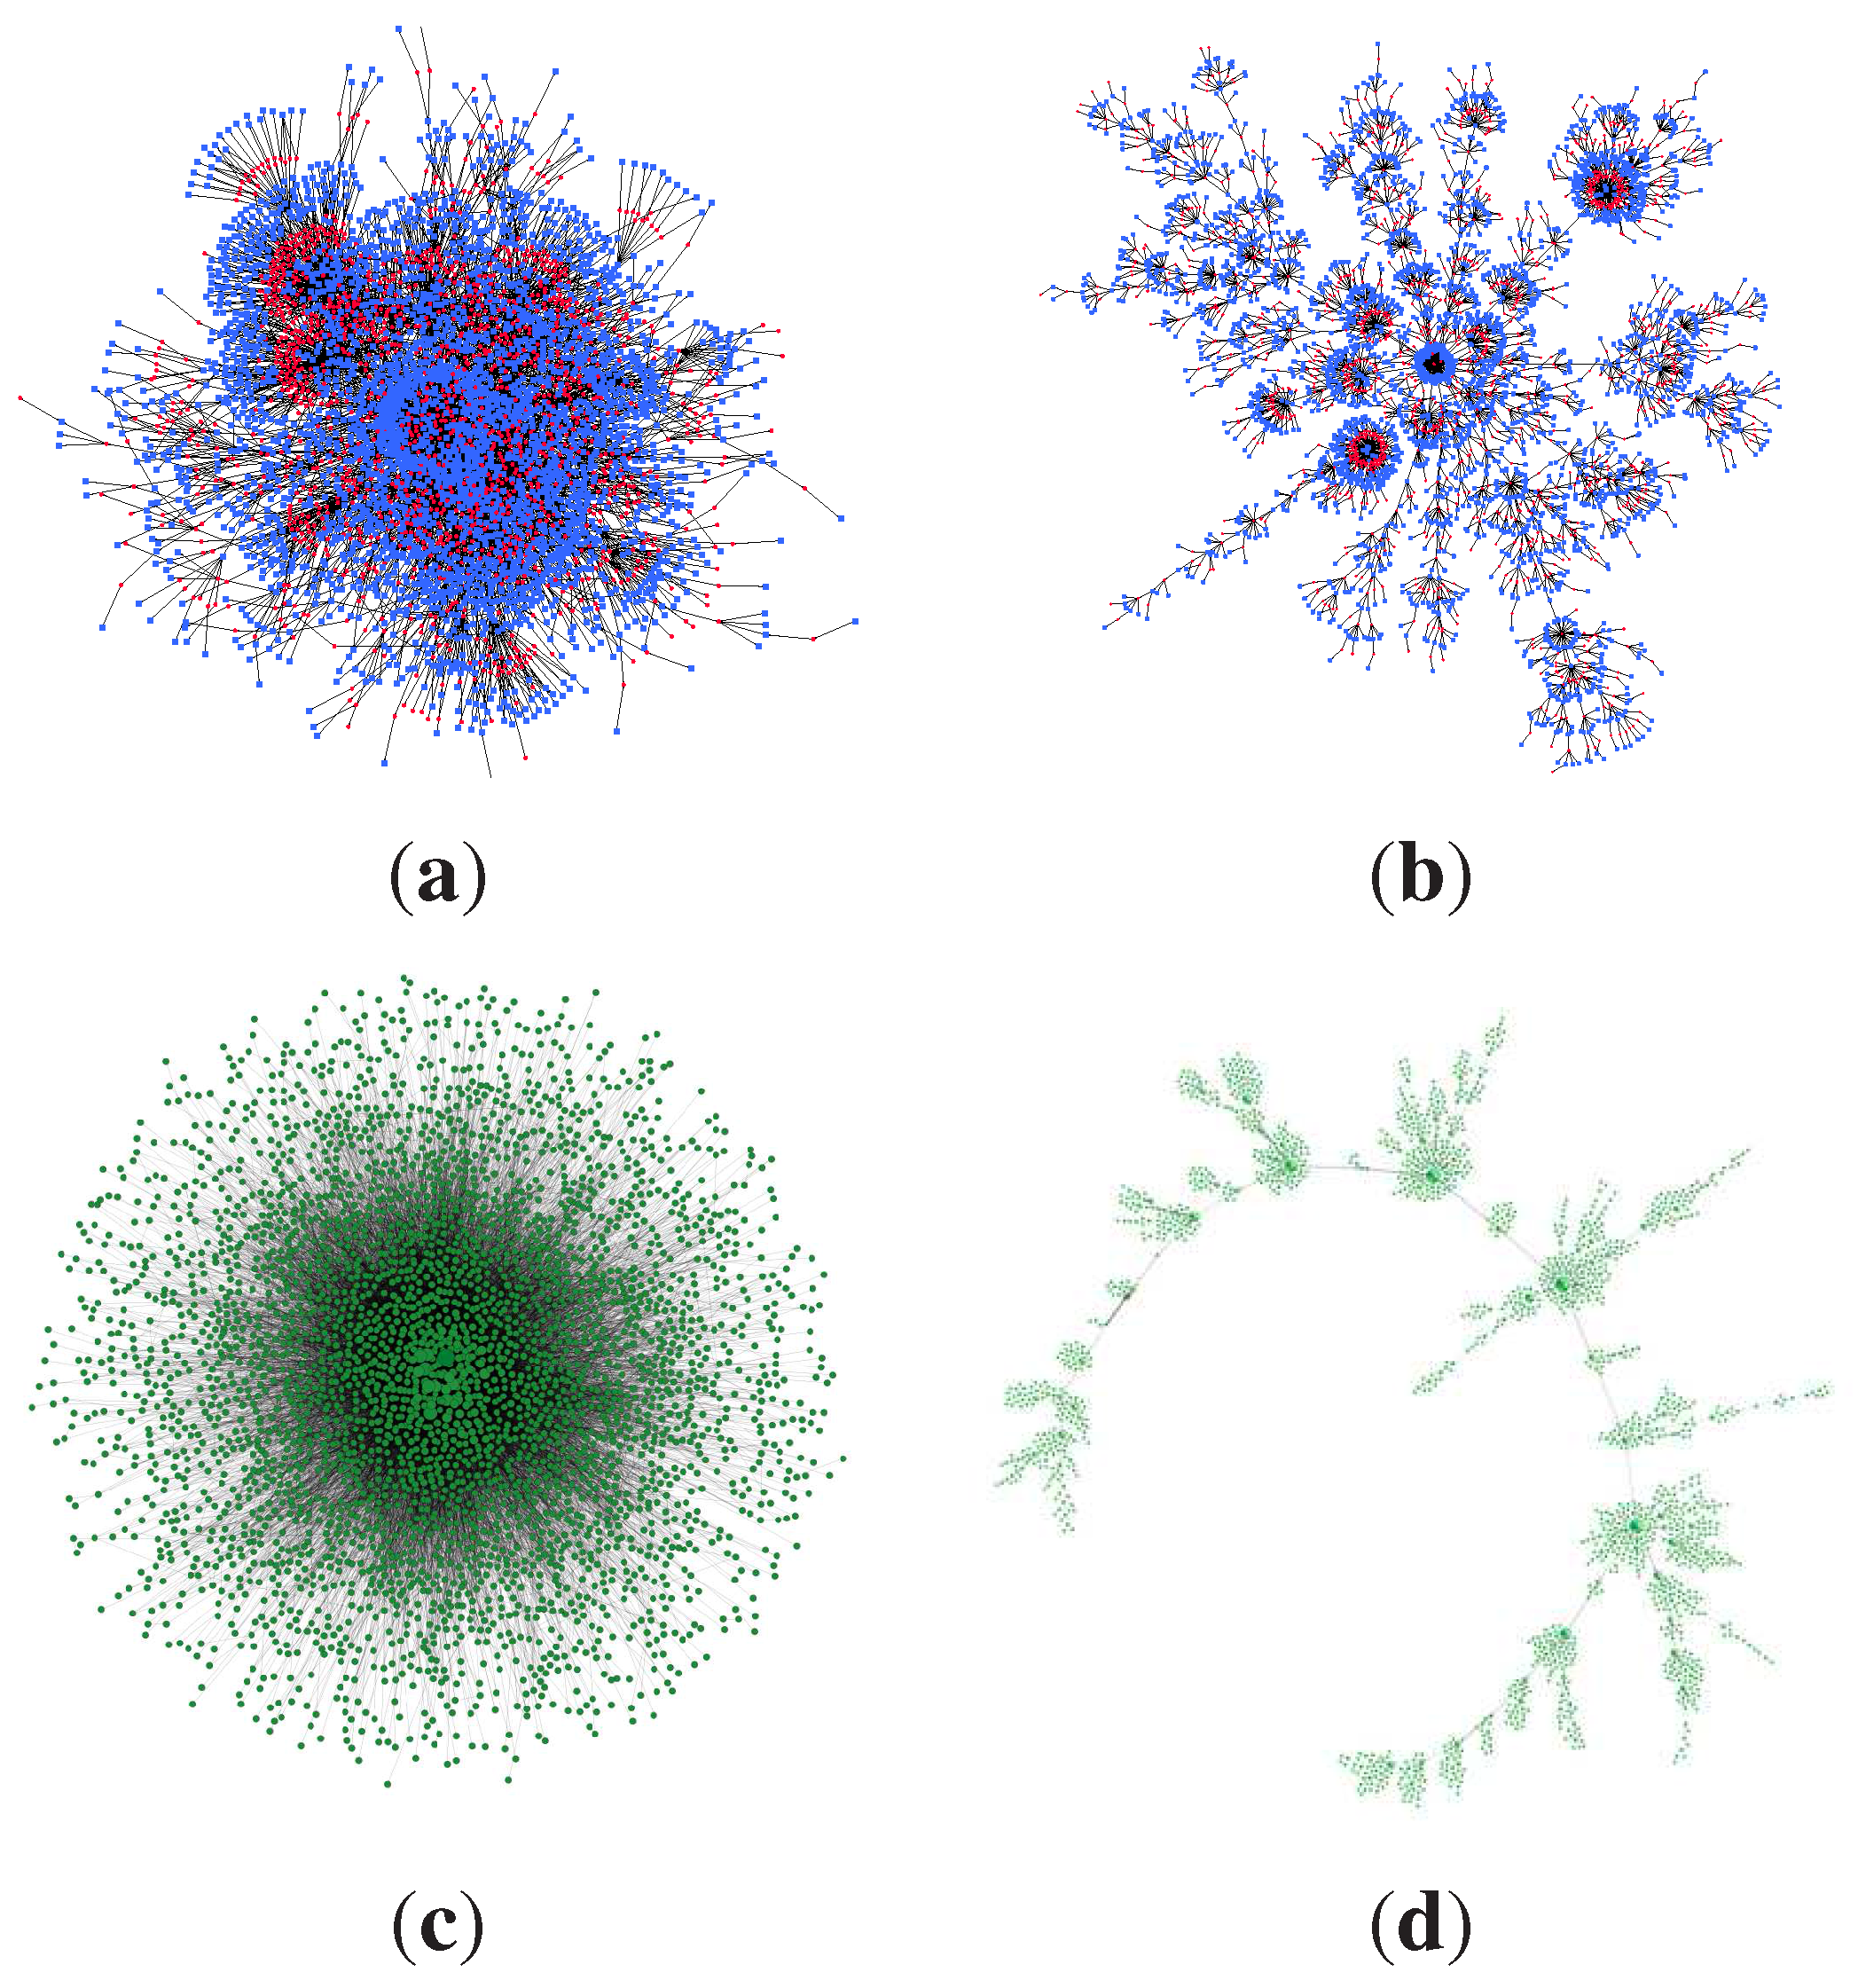
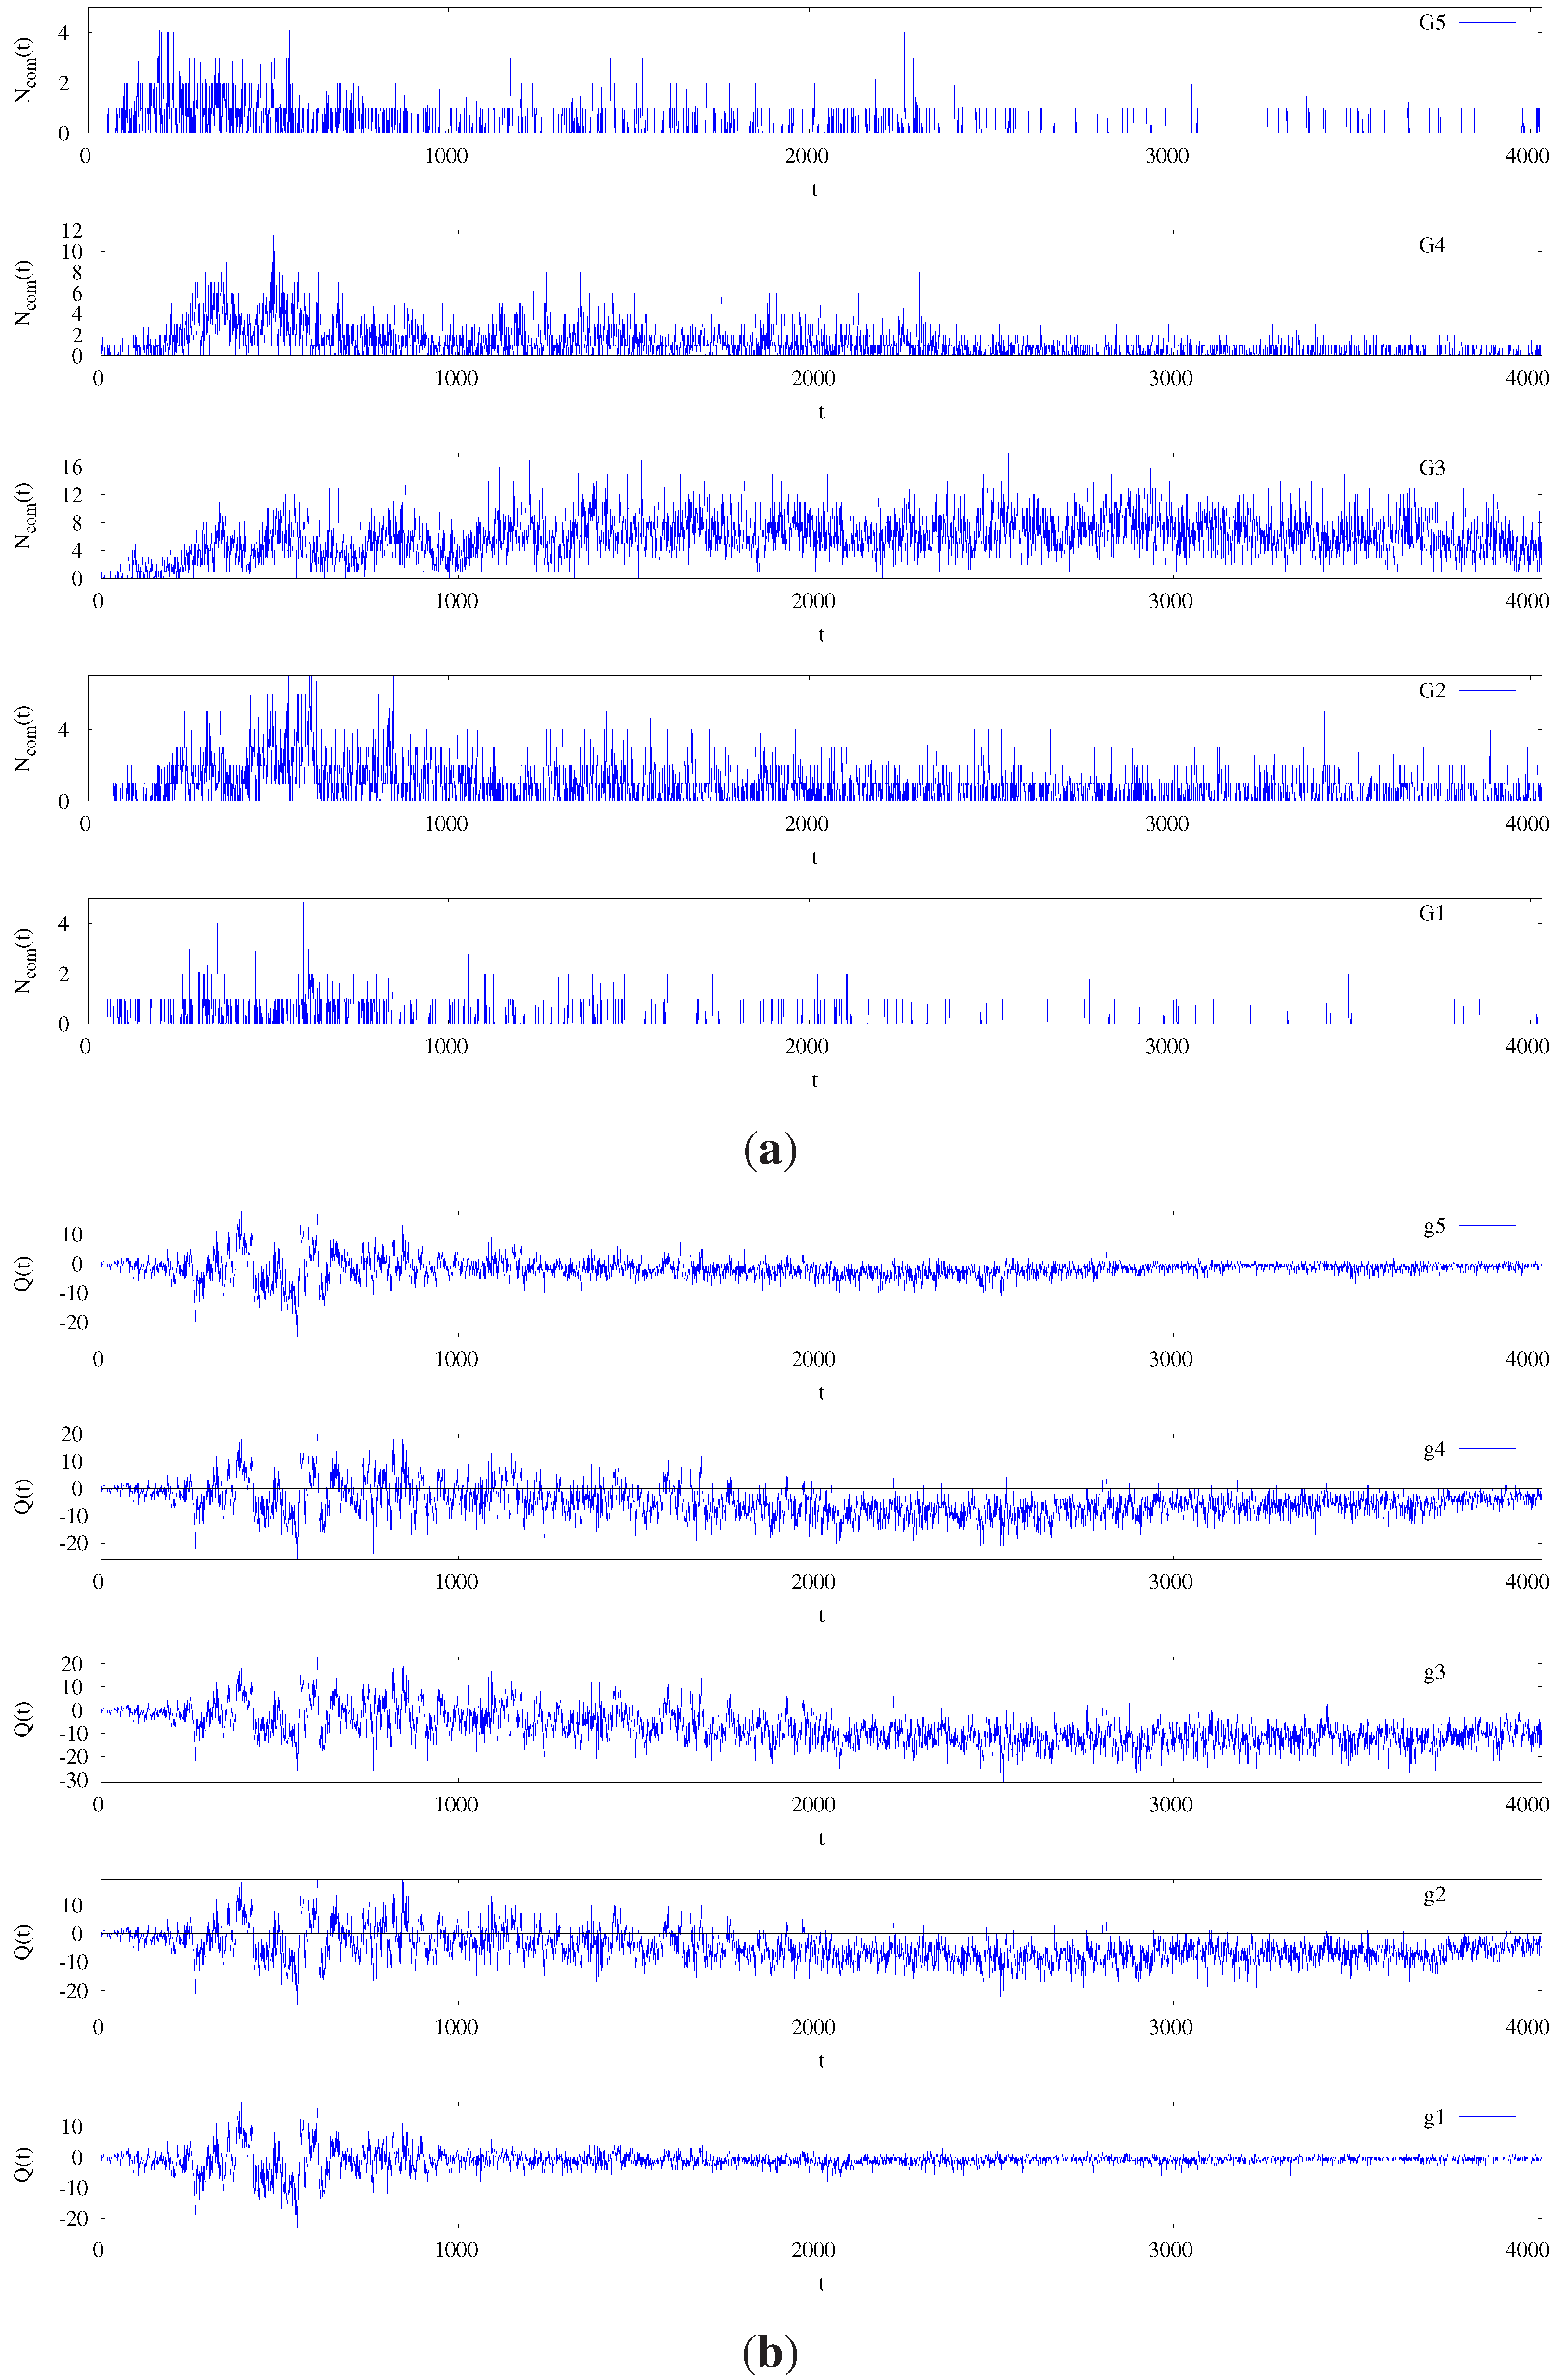
3.1. Blogging Dynamics and Emergence of Communities

In the simulations, the system is driven by adding a variable number p ( t ) new agents at each time step; the emotional states of new agents are selected randomly. The new arrived agents connect to the existing part of the evolving bipartite network, by linking to certain exposed and/or old posts which they chose to comment. According to the rules, their comments contribute to the influence fields that may trigger actions of other agents who are linked to the same active posts. It should be stressed that at each agent (user-node) different patterns of the activity are expected. They depend not only on the current network structure surrounding the agent, but also on the fact that at given time the activity might be transferred to another part of the network, i.e., due to the aging of posts and the preferences of other agents towards particular types of posts. The actions of individual agents contribute to the overall activity that can be monitored at each post and at the whole (evolving) network, as well as at the network parts, for instance the topological communities, that can be identified when the network is large enough.
Figure 7. Time-series simulated within the agent-based model of blogging. (a) The number of active users (top line), active posts (middle) and charge Q ( t ) = N + ( t ) - N - ( t ) of the emotional comments (bottom line) per time step. (b) Number of all comments (cyan), and comments carrying negative (black) and positive (red) emotion valence. (c) Power spectra and (d) Fluctuations of these time series; The values of Hurst exponents are indicated in (d).
Entropy 15 05084 g007
At every time step in the simulations, we monitor states of each agent and each post. We sample several quantities, e.g., those that can be compared with the empirical data, and other. Specifically, the fluctuations in the number of active posts, N a p ( t ) , the number of different agents that are active at these posts, N a u ( t ) , and the number of comments that they posted, N c ( t ) , at each time step are determined. Furthermore, we distinguish between the comments that carry positive (negative) valence, N ± ( t ) , and the overall charge Q ( t ) = N + ( t ) - N - ( t ) of these emotional comments. The temporal fluctuations of these quantities are shown in Figure 7; the starts of the time series are displayed, corresponding to four weeks of real time. Note that the circadian cycles of the driving signal p ( t ) are clearly reflected in time-series of the number of active agents and the number of their comments.
The simulated time series in Figure 7 can be readily compared with the respective time series from empirical data in Figure 3 and similar results in Figure 4 obtained in the dynamics of chats.
Furthermore, the bipartite network that emerge through the activity of our emotional agents on posts can be compared with the empirical one. In [45] the topology of the network of agents has been studied in full analogy with the topology of bipartite network mapped from the empirical data of the same structure, see Section 2.2 and [10,27,28]. It was found that, to a large extent, the emotional interaction among agents reproduces the structure of connections of real users at popular discussion-driven Diggs. For the discussion in this work, it is essential that these networks exhibit a community structure, much similar to the empirical system. Here, we focus on agent communities, that we determine on the monopartite agent-projection of the emergent bipartite network after 4032 time steps (two weeks) of the evolution. The network projected onto agents partition contains N U = 4572 agents; only agents with the degree larger than 5 are considered as relevant for the community formation.
In order to determine the community structure, we perform the spectral analysis of the normalized Laplacian operator [57,61] which is related to the weighted agent-projection network. Its matrix elements C i j W represent the common number of posts per pair of agents, including the multiplicity of user–post connections, which is indicated by the superscript. The Laplacian is constructed from the symmetric matrix of commons as
L i j = δ i j - C i j W ( l i l j )
where l i is the strength of agent i, defined as the sum of weights of its links. The eigenvalue spectrum of the Laplacian operator Equation (7) with the C i j W matrix related with this agent-projected weighted network, is computed. Theoretically, when the communities exists, the lowest non-zero eigenvalues of the Laplacian of Equation (7) appear separated from the rest of the spectrum and the corresponding eigenvectors are localized on the network subgraphs (communities). The eigenvector localization is visualized as a characteristic branched structure of the scatter-plot in the space of these eigenvectors. This property of the eigenvectors is then utilized to identify the nodes of the network that belong to each community [10,12,26,57]). The scatter-plot of three eigenvectors belonging to the three lowest eigenvalues of the Laplacian is shown in Figure 8a. It indicates that five agent-communities can be differentiated. These are denoted by G k , with k = 1 , 2 , , 5 corresponding to top-to-bottom branches in Figure 8a. A part of the agent-projected network with three weighted communities (out of five communities, determined above) is displayed in Figure 8b, indicating heterogeneity among the agents within each community. In the following we first identify the nodes representing the agents in each of these communities. Then we analyze how the communities actually evolved on that network in accordance with the fluctuations of emotional states of agents in the communities throughout the evolution time.
Figure 8. Communities in the emergent network of emotional blogging by agents. (a) 3-D scatter-plot of the eigenvectors indicating the community structure. (b) Close up of the agent-projected network (nodes belonging to three communities are marked by different colors, their size is proportional to the number of links): Inside each community a few very active agents can be identified.
Entropy 15 05084 g008
Having identified the agents in each of the communities, we can now track their group activity and the emotion fluctuations over time from our simulation data. The time-series of the number of comments of all agents in a given community G k are shown in Figure 9a and the emotional charge of the valence of these comments in Figure 9b. Note that a fraction of comments with the valence values close to zero in the range between ( - 0 . 01 , + 0 . 01 ) are considered as neutral, and do not contribute to the charge. The profile of the time series indicates that all communities started to grow at early stages of the network evolution. However, the activity in two communities G 1 and G 5 is gradually reduced and their growth ceased quickly after their appearance. Looking at the fluctuations of charge of the emotional comments in these two communities, we find that it is well balanced, fluctuating around zero at early times, and eventually leveling up at zero. On the other hand, in two medium-size communities, G 2 and G 4 , the activity is slowly decreasing, while the largest central community, G 3 , shows constantly large activity. Comparing the activity (number of comments) with the fluctuations in the charge of the emotional comments, we can see that in these three communities the excess negative charge settles after some time, breaking the initial balance in the charge fluctuations. In this way our model reveals the correlations between the prolonged activity and the size of a community (i.e., number of different agents), on one side, with the occurrence of the negative charge of the related comments, on the other. The co-occurrences of the negative charge Q ( t ) and the number of comments N c ( t ) in the community G 3 are also depicted by the scatter-plot in Figure 10. Here, two details are manifested: firstly, the negativity of the charge increases with the number of comments per time bin; further, the maximum frequency (larger color intensity) is regularly in the negative region of the charge axis. In contrast, other four communities show a rather symmetrical plot, cf. Figure 10. The correlation between the size of community and excess negative charge was also observed in the empirical data on Blogs and Diggs [12,27].
Figure 9. Activity and negative charge gives raise to community growth. Time series of the number of messages, N c ( t ) , (a) and charge of emotional messages, Q ( t ) , (b) within identified agent communities.
Entropy 15 05084 g009
Figure 10. Scatter-plot of activity and charge in different communities. Charge Q ( t ) plotted against the number of comments N c ( t ) per time bin for the groups G 1 , G 2 , G 3 , G 4 and G 5 (left to right). Color intensity increases with the occurrence of related ( N c ( t ) , Q ( t ) ) values.
Entropy 15 05084 g010
Another interesting feature of these communities is observed by visualizing the patterns of their activity in the phase space of the emotion variables. In order to match the emotion measures accepted in the psychology literature, the values of the arousal and valence components are mapped onto a surface enclosed by a circle (circumplex map). According to the 2-dimensional Russell’s model [25,62], each commonly known emotion, for instance, “afraid”, “astonished”, “bored”, “depressed”, “ashamed”, “enthusiastic”, “happy”, “miserable” and other, can be represented as a specific point (or a segment) on the surface. In particular, the values of the arousal and valence are mapped as follows [63]:
a = a 1 1 + z 2 , v = v 1 + z 2
where z m i n ( | a 1 | , | v | ) and a 1 2 a - 1 [ - 1 , + 1 ] .
Computing the transformed values of the arousal and the valence for each agent at all time steps when an action of that agent is recorded in our simulations, we obtain the color-plots shown in Figure 11. Different plots contain agents’ trajectories in four different communities, G 1 G 4 , which are discussed above. Specifically, the color map indicates how often a particular state on the circumplex was occupied in four of the above communities, normalized with the all actions in that community. As Figure 11 shows, the communities leave different patterns in the space of emotions. For instance, the community G 1 , that have balanced charge fluctuations, appears to cover a larger variety of the emotional states, leading to the pattern on the top left figure. A similar patter was found for community G 5 (not shown). However, when a large community is formed, it may induce large negative fields which keep the agents in the negative valence area of the circumplex map. Such a situation is shown for the community G 3 in the top right panel of Figure 11. The majority of comments in this case is centered in the area of arousal and valence where the negative emotions known as “worried”, “apathetic”, “suspicious”, “impatient”, “annoyed” are found on the circumplex map (see, for instance, [62,63] for coordinates of some other well known emotional states covered by these patterns). Plots in the bottom left and right panels of Figure 11 correspond to the communities G 2 and G 4 , respectively; in these groups, charge fluctuations are moderately negative, as discussed above.
Figure 11. Patterns of emotion-driven communities. Circumplex map of the emotional states of agents belonging to four communities, G 1 , G 2 , G 3 , G 4 , identified on the emergent network in agent-based simulations. Color map indicates occupancy of a given state, normalized by the number of messages in the community.
Entropy 15 05084 g011
In conclusion, both the analysis of empirical data [12] and agent-based simulations done here, indicate that the occurrence of communities around certain popular posts and dominance of negative emotions are universal phenomena in blogging dynamics. Unlike the case of real systems where the parameters are fixed, the simulations within agent-based model explain the underlying mechanisms. In particular, the communities can form in a self-organized manner when the external influence (represented by a common field) is comparatively low. Then the excessive use of negative emotions powers the communications at few popular posts, leading to growth of the community and its activity level. This mechanism of emotional bursts is thus typical for systems with indirect communications among users (agents) and may involve a large variety of posted subjects.
It should be stressed that, co-evolution of the dynamics and the topology is a crucial part of this phenomenon. An entirely different situation is foreseen in the online social networks, like MySpace [16], where the network has a fixed structure that is promoting the user-to-user dialogs within and across different communities. It was shown [46] that, in these social networks, appearance of a prevailing emotion valence considerably depends on the external inputs.

4. Dynamics of Chats with Emotional Bots

The relevance of emotions expressed in the text messages in the empirical chat system Ubuntu channel has been pointed out in Section 2.2 and Section 2.3 (see also [19,29,30]). The underlying mechanisms of emotional communications are explored here using the agent-based modeling approach with the emotional agents, who interact in an co-evolving chat network [38,47]. Compared with the above described agent-based model of blogging, the model for chats differs in several details. Specifically, due to a direct interaction among agents in chats, a monopartite network with directed weighted links embodies agent’s connections. The network evolves in time by addition of new p ( t ) agents per time step, by insertion of new links and/or adding weight on the existing links. Consequently, the field h i a ( t ) that influences agent’s i emotional arousal at time t, in Equation (5), is built from the messages within current time window t - T 0 , which are directed to the agent from its neighbors in the network, i.e.,
h i a ( t ) = j L i n , i a j m θ ( t m - ( t - 1 ) ) - θ ( t m - ( t - T 0 ) ) j L i n , i θ ( t m - ( t - 1 ) ) - θ ( t m - ( t - T 0 ) )
Here, a j m is the arousal of the message m arriving along the link j i from the agent j and t m indicates the creation time of the message. For the valence field h i v ( t ) , in analogy to Equation (3) in blogging dynamics, we assume that current balance of the number of positive and negative messages N i ± ( t ) can affect the agent i valence, in Equation (6), depending on polarity of its current valence r i ( t ) = s g n ( v i ( t ) ) . Specifically,
h i v ( t ) = 1 - 0 . 4 r i ( t ) 1 . 4 N i p ( t ) N i e m o ( t ) - 1 + 0 . 4 r i ( t ) 1 . 4 N i n ( t ) N i e m o ( t )
where N i p ( t ) and N i n ( t ) are the number of positive and negative messages, respectively, which are directed to agent i within the current time window, i.e., N i p , n ( t ) = j L i n , i | s g n ( v j m ( t ) ) ± 1 | 2 θ ( t m - ( t - 1 ) ) - θ ( t m - ( t - T 0 ) ) , and N e m o ( t ) = N p ( t ) + N n ( t ) . In addition, the common fields, which may affect all agents equally, h m f a ( t ) and h m f v ( t ) are computed in a similar manner but observing that the summation in the Equation (9) and Equation (10) is adequately changed, i.e., j S , where S is the set of all currently active messages, including the messages which are posted on the channel and not directed to any specified agent.
The agent’s profile is determined by fixing the number of messages N c P ( N c ) that the agent can post during the simulation time as well as its attitude towards direct communication with other agents, given by the empirical probability g P ( g ) . Both distributions P ( N c ) and P ( g ) , as well as the delay times P ( Δ t ) and the time series p ( t ) are inferred from the same empirical data of Ubuntu channel, which are analysed in Section 2 (see also [38]). In the chat dynamics, beside ordinary agents the presence of Bots and moderators is considered. Motivated by the rules of Ubuntu channel, certain number of moderators N m is defined and their profiles adjusted according to their function. In particular, the moderators have no limits to the number of messages and their delay times are derived from another empirical distribution, which, on average, provides shorter delays. Otherwise, the dynamics of their emotions is governed by the same Equation (5) and Equation (6) as for all other agents. The moderators also can employ the Bot by passing a fraction ϵ of new messages to its list. On the other hand, the Bot in our model has a fixed emotion. Also, the Bot can have different patterns of communication, i.e., sending a message directly to the involved agent, or posting the message to the channel. Furthermore, unlike the agents and moderators, who always have a finite delay time to the next action, the Bot can reply instantly to all agents accumulated on its list in the previous time step.
The Bots are algorithms, which are often implemented at IRC channels and serve different functions. For instance, the Bot in Ubuntu channel, when prompted by the moderators, gives a predefined answer to the concerned user. In the world of emotional agents in our model, the Bot has predefined emotion. Therefore, when the Bot is active, i.e., according to the model rules, its message to an agent carries the emotional content which is identical with the Bot’s emotion. Other versions of the emotional Bots, e.g., Bots with “human-like” characteristics have also been considered [38].
Apart from the parameters which are inferred from the empirical dataset, in the simulations presented in this work we used the following values for the parameters γ = 0 . 1 and 0.3; ϵ = 0.5 or 0.1; f = 0.4. The interested reader can find a more detailed description of the rules and parameters of the agent-based model of online chats with Bots as well as its numerical implementation in references [38,47]. Here, we focus on the chat dynamics in the presence of Bots, whose activity enables the mechanisms for emotional bursts. For this purpose, we first summarize the fractal features of the process occurring in the absence of Bots. Then we demonstrate how such processes are altered when Bots with emotional profile are active and communicating with a limited number of agents. Finally, allowing the emotional Bots unrestricted communication with agents, we examine the chat process by focusing on nonextensivity features. In order to point out the effects of emotional Bots in the dynamics, the relevant quantitative measures are compared with the case when the Bot is neutral or inactive, as well as with the equivalent quantities determined directly from the empirical data.

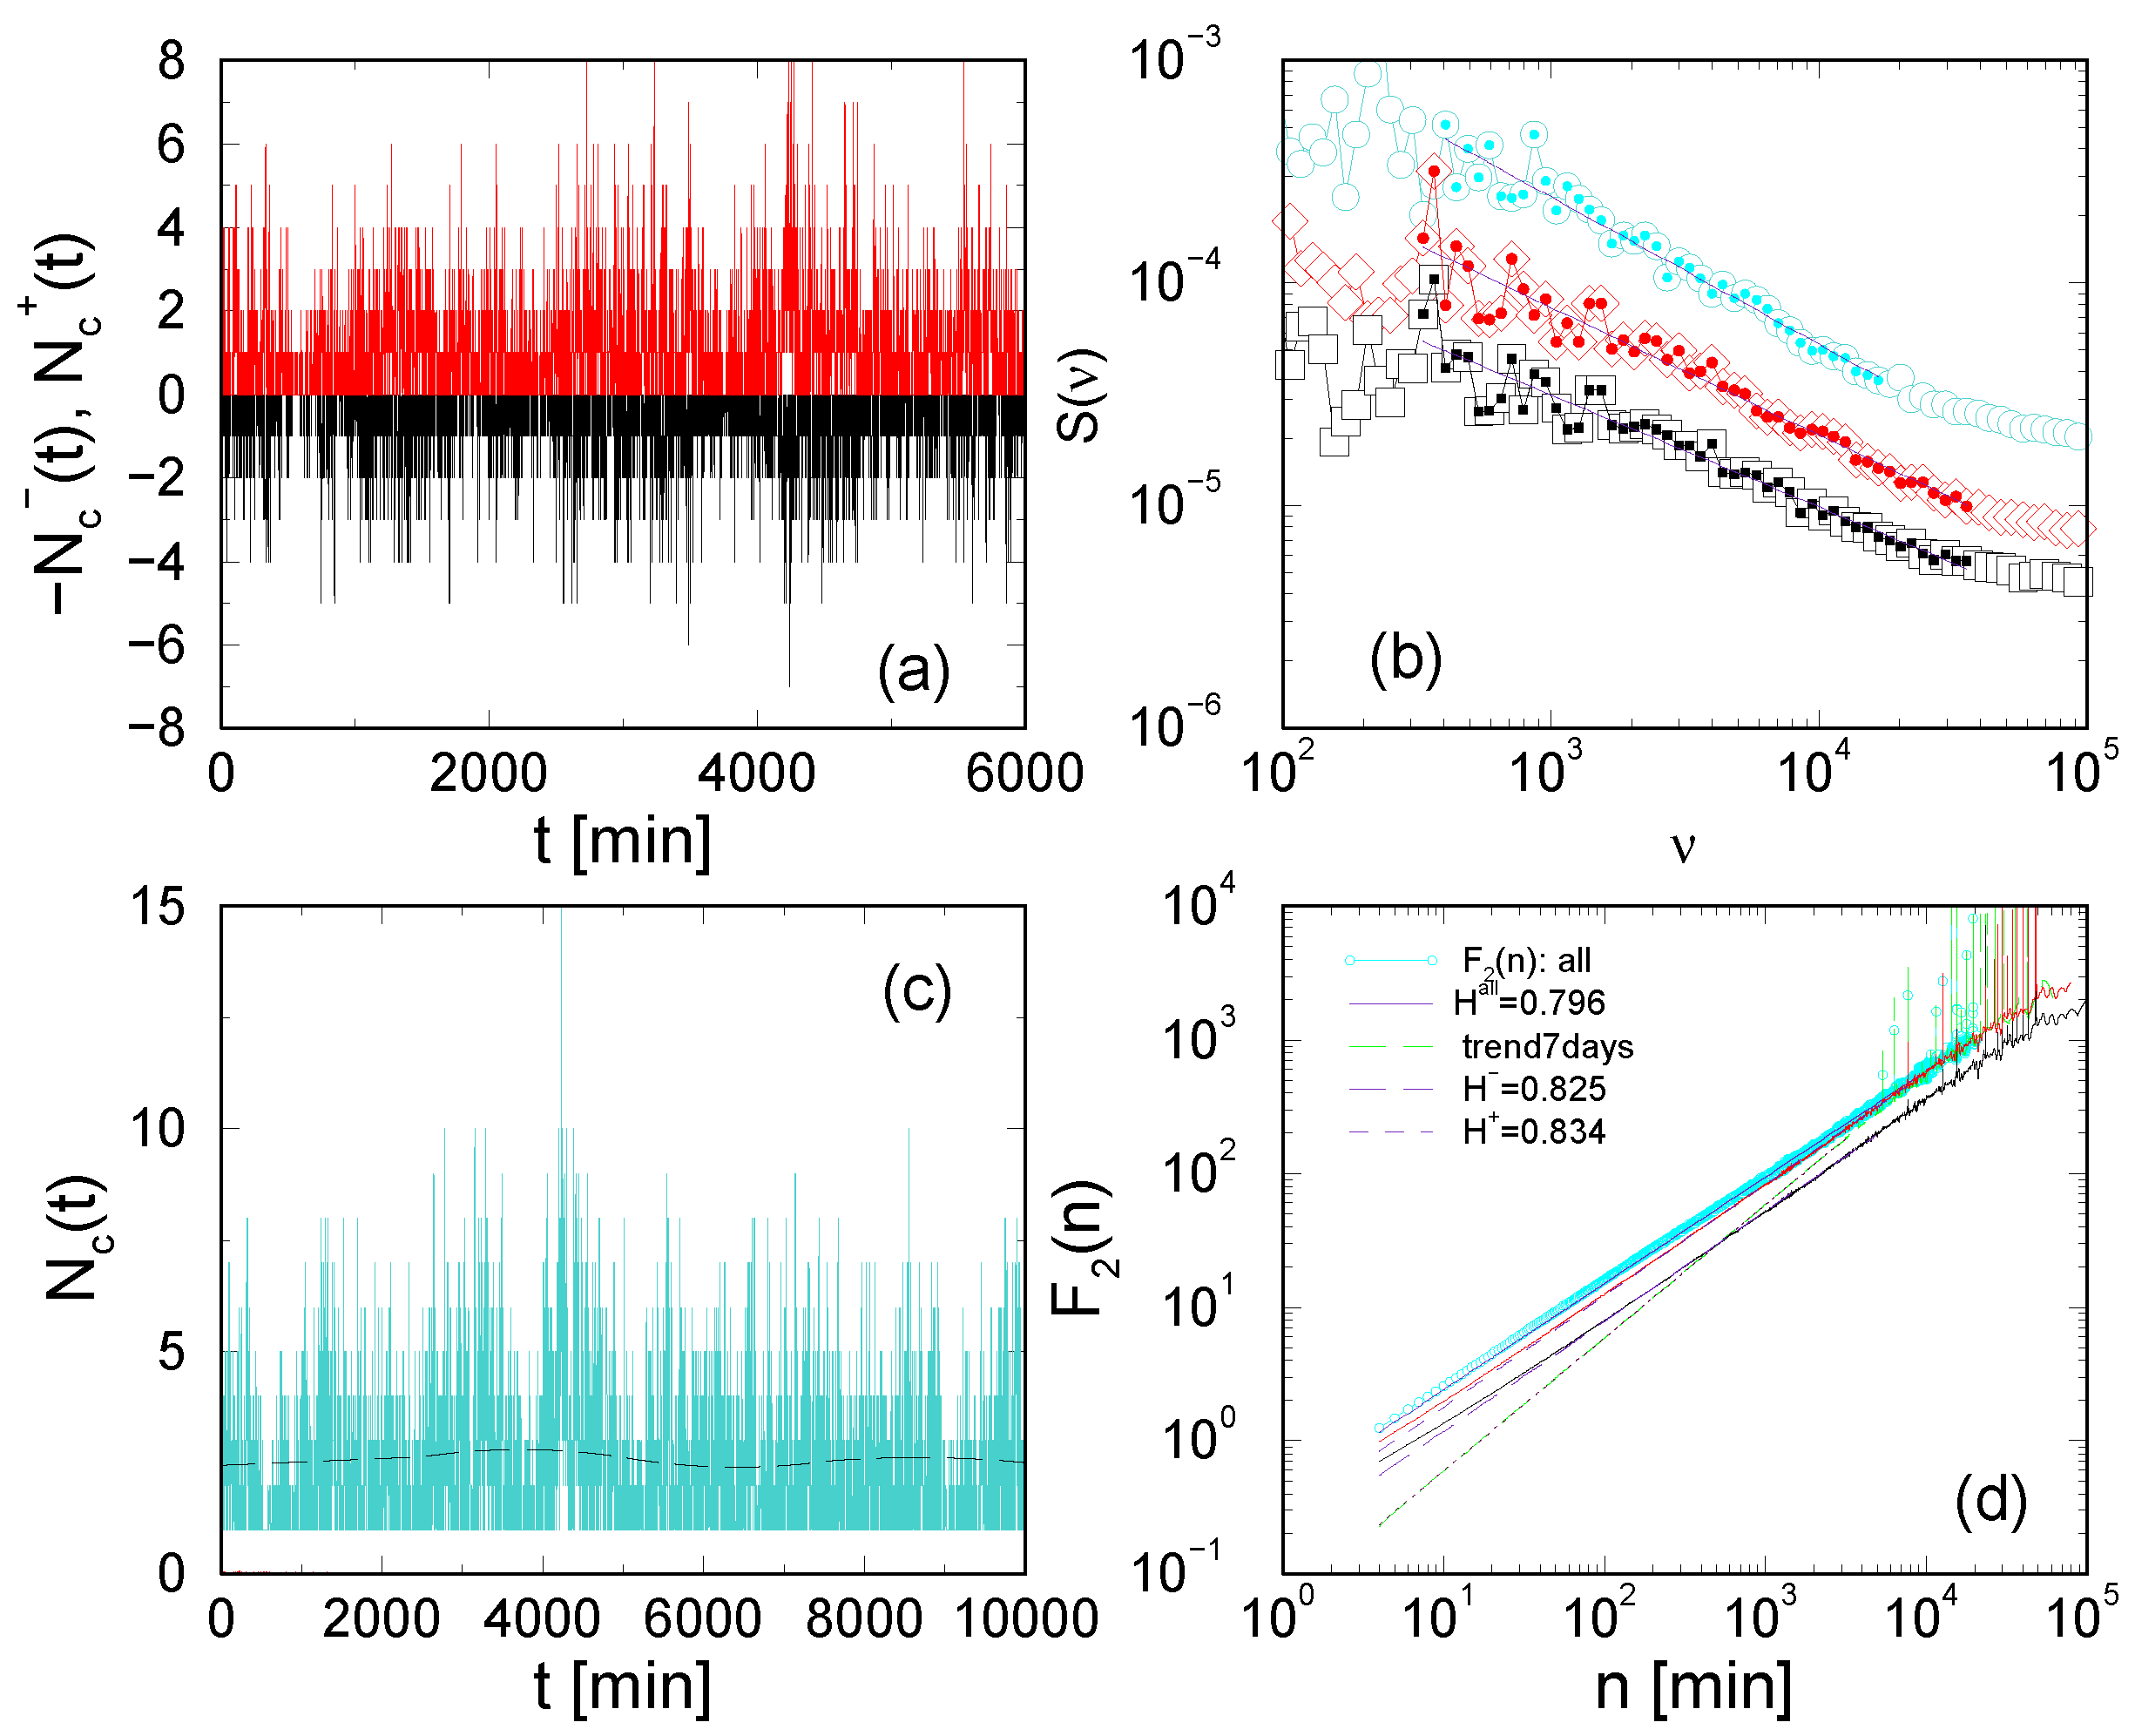
4.1. Fractal Time Series Analysis of Chats in the Absence of Bots

In the absence of emotional Bots, the simulations lead to the balanced use of positive and negative emotions. The time series of the number of messages carrying positive N + ( t ) and negative N - ( t ) emotion valence are shown in Figure 12a. The fractal time series analysis in [38] revealed the occurrence of long-range correlations, avalanches and persistent fluctuations around a cyclic trend. For instance, when no moderators are present N m = 0 , the self-organized dynamics of chats among the emotional agents is characterized by the scaling exponents for the time series with positive and negative emotion messages, respectively: ϕ + = 1 . 06 ± 0 . 06 and ϕ - = 1 . 19 ± 0 . 06 , for the power spectrum; the scaling exponents τ s + = 1 . 34 ± 0 . 03 and τ s - = 1 . 83 ± 0 . 04 , for the avalanche sizes, and γ S T + = 1 . 47 and γ S T - = 1 . 23 , for the avalanche shape; H + = 0 . 94 ± 0 . 02 and H - = 0 . 97 ± 0 . 01 , for the Hurst exponent [38]. Compared with the values H ± = 0 . 83 , ϕ ± = 0 . 62 in Figure 4, which are obtained from the empirical data (where a Bot is present but is emotionally neutral), we may conclude that the simulated system of emotional agents without Bots maintains a bit stronger temporal correlations.
Figure 12. Patterns of emotional balance and clustering in chats. (a) Time series of the number of messages with positive and negative emotion valence. (b) Color-coded plot of the emotional states of agents in simulated chats shown on circumplex map, where also some known emotions are marked.
Entropy 15 05084 g012
Moreover, the balanced use of positive and negative emotions is reflected in the phase space pattern in Figure 12b; the trajectories of all agents symmetrically fill the left v < 0 and the right v > 0 section of the circumplex map. However, when the arousal is also considered in accordance with the valence, it appears that both on positive and negative valence side certain areas of the phase space (implying particular emotions) are more often used than the others. Compared with the community-induced pattern of emotions in blogging dynamics, Figure 11, the symmetrical pattern in Figure 12b suggests an entirely different mechanism of emotion clustering in the dynamics of chats. We will return to the discussion of the phase space trajectories in Section 4.3.

4.2. Response of Agents’ Network to the Activity of Emotional Bots

When the Bot with a given emotional profile is activated in the chat system, the interactions among emotional agents may be altered. In [38] it has been argued that namely the fractal nature of chat process is the basis on which the emotional Bots can build their influence on agents and eventually polarize the mood on the entire chat network. In the remaining part of this chapter, we consider the impact that the activity of different emotional Bots have on the self-organized process of chats. The Bot with an emotional function can be implemented in different ways. Here, we consider two types of emotional Bots, specifically:
  • Bots with a fixed emotion, e.g., “enthusiastic” (posBot), and “ashamed” (negBot); the Bots can interact with anyone of the agents who seek such interaction, according to the model rules; every message from the Bot to an agent carries Bot’s fixed emotion. The effects of these Bots will be studied in detail in Section 4.3.
  • Experimental Bots ExpBot with a fluctuating but predominantly positive (negative) emotion and contact with a limited number of agents. Motivated by an experiment where the emotional Bot communicates with 91 isolated users [64], here we consider these experimental Bots as part of the agent’s networked environment [65]. Hence, we fix 91 agents with whom the Bot communicates by exchanging emotional messages. The Bot uses the same sequence of emotional messages (identified by their arousal and valence) to each of the 91 agents exactly as in the experiment. In contrast to the experimental situation, the agents in the numerical experiment can interact with other agents in the network. Moreover, their communication with the Bot is regulated with the rules of the model, i.e., they use accumulated emotional influence and respond with a time delay, etc. When a sequence of Bot’s messages is exhausted, it starts again from the beginning. The Bot remains emotionally neutral in communication with all other agents in the network.
Due to the interaction among agents, the emotional impact of ExpBot on the fixed 91 agents propagates through the network. In the effect, the system slowly builds the emotional charge Q ( t ) = N + ( t ) - N - ( t ) which coincides with the dominant emotion of the Bot, cf. Figure 13a–d. The time series of charge of emotional messages on the entire network in the presence of two experimental Bots are shown in Figure 13b,d. In lower panels of Figure 13a,c we display the fluctuations of valence in the sequence of messages that the agents communicate to the Bot (Bot’s messages are excluded). Comparing these fluctuations with the fluctuations of charge in Figure 13a,b, it is apparent that an excess of positive valence in the messages exchanged with the Bot coincides with the appearance of prevailing positive charge in the entire network. Similarly, in Figure 13c,d, the valence fluctuations in presence of negative Bot correlates with the tendency towards prevailing negative charge in the network of agents.
The fractal characteristics of time series in the presence of emotional Bots are altered compared with the situation without Bots. In Figure 13e the fluctuations of the time series of emotional messages and their charge around local cyclic trend are shown. In particular, the Hurst exponents for the positive emotion messages in the presence of a positive Bot H + + = 0 . 78 ± 0 . 02 , and negative messages in the presence of a negative Bot are H - - = 0 . 76 ± 0 . 02 , are smaller than the corresponding Hurst exponents in the absence of emotional Bots, studied in Section 4.1. (Here, the first index stands for the Bot’s emotion while the second index indicates the polarity of agents’ messages.) The fluctuation of the charge in both cases roughly follows a weak cycle, leading to a similar exponent, H Q , ± = 0 . 85 ± 0 . 02 . The cycle is quite irregular, having Hurst exponent H t r e n d 1 ; it is possibly related with the frequency of Bot’s actions.
Building a polarized mood, i.e., a predominant emotion polarity (either positive or negative), of all agents is much more effective in the presence of emotional Bots with fixed emotion posBot and negBot, which have unlimited access to agents in the network. In this case, by affecting the connections among agents, the emotional Bots influence the growth of the network itself [30]. Their effects are studied in terms of bi-layered structure of the network, where the layers of positive and negative connections (i.e., valence of the exchanged messages) among agents are distinguished. For illustration, a small network grown in the presence of posBot is shown in Figure 14. Different structure of connections with a dominant positive layer is apparent. Several multiplexity measures have been accepted to characterize the layered structure of networks [15,66,67], specifically: link overlap between different layers, node degree correlations, as well as node degree rank correlations. These quantitative measures are computed considering the positive and the negative layer in our chat networks, which are grown in the presence of posBot and negBot. The results revealed [30] that, in the presence of emotional Bots, a specific agent participates building the network structure in a different manner than in the absence of Bots or when an emotionally neutral Bot is present. In the following section the effects of emotional Bots onto the dynamics of chats will be investigated from the point of view of nonextensive statistics [2,68].
Figure 13. Network of agents builds emotional response to experimental Bots. In the presence of experimental Bot with positive (a–b) and negative (c–d) dominant emotion and limited access to agents: Valence of agent’s messages to the Bot (lower panels) and charge of the entire system of agents (upper panels). Here, Bot’s messages are excluded. (e) Fluctuations of the detrended time series of emotional messages, the charge, and the trend.
Entropy 15 05084 g013
Figure 14. Layered structure of chat network. The layers with positive valence and negative valence links are shown in the network (a) emerging by simulations in the presence of positive emotion Bot “enthusiastic” and (b) from the empirical data of Ubuntu channel.
Entropy 15 05084 g014

4.3. Nonextensivity of the Emotion Dynamics
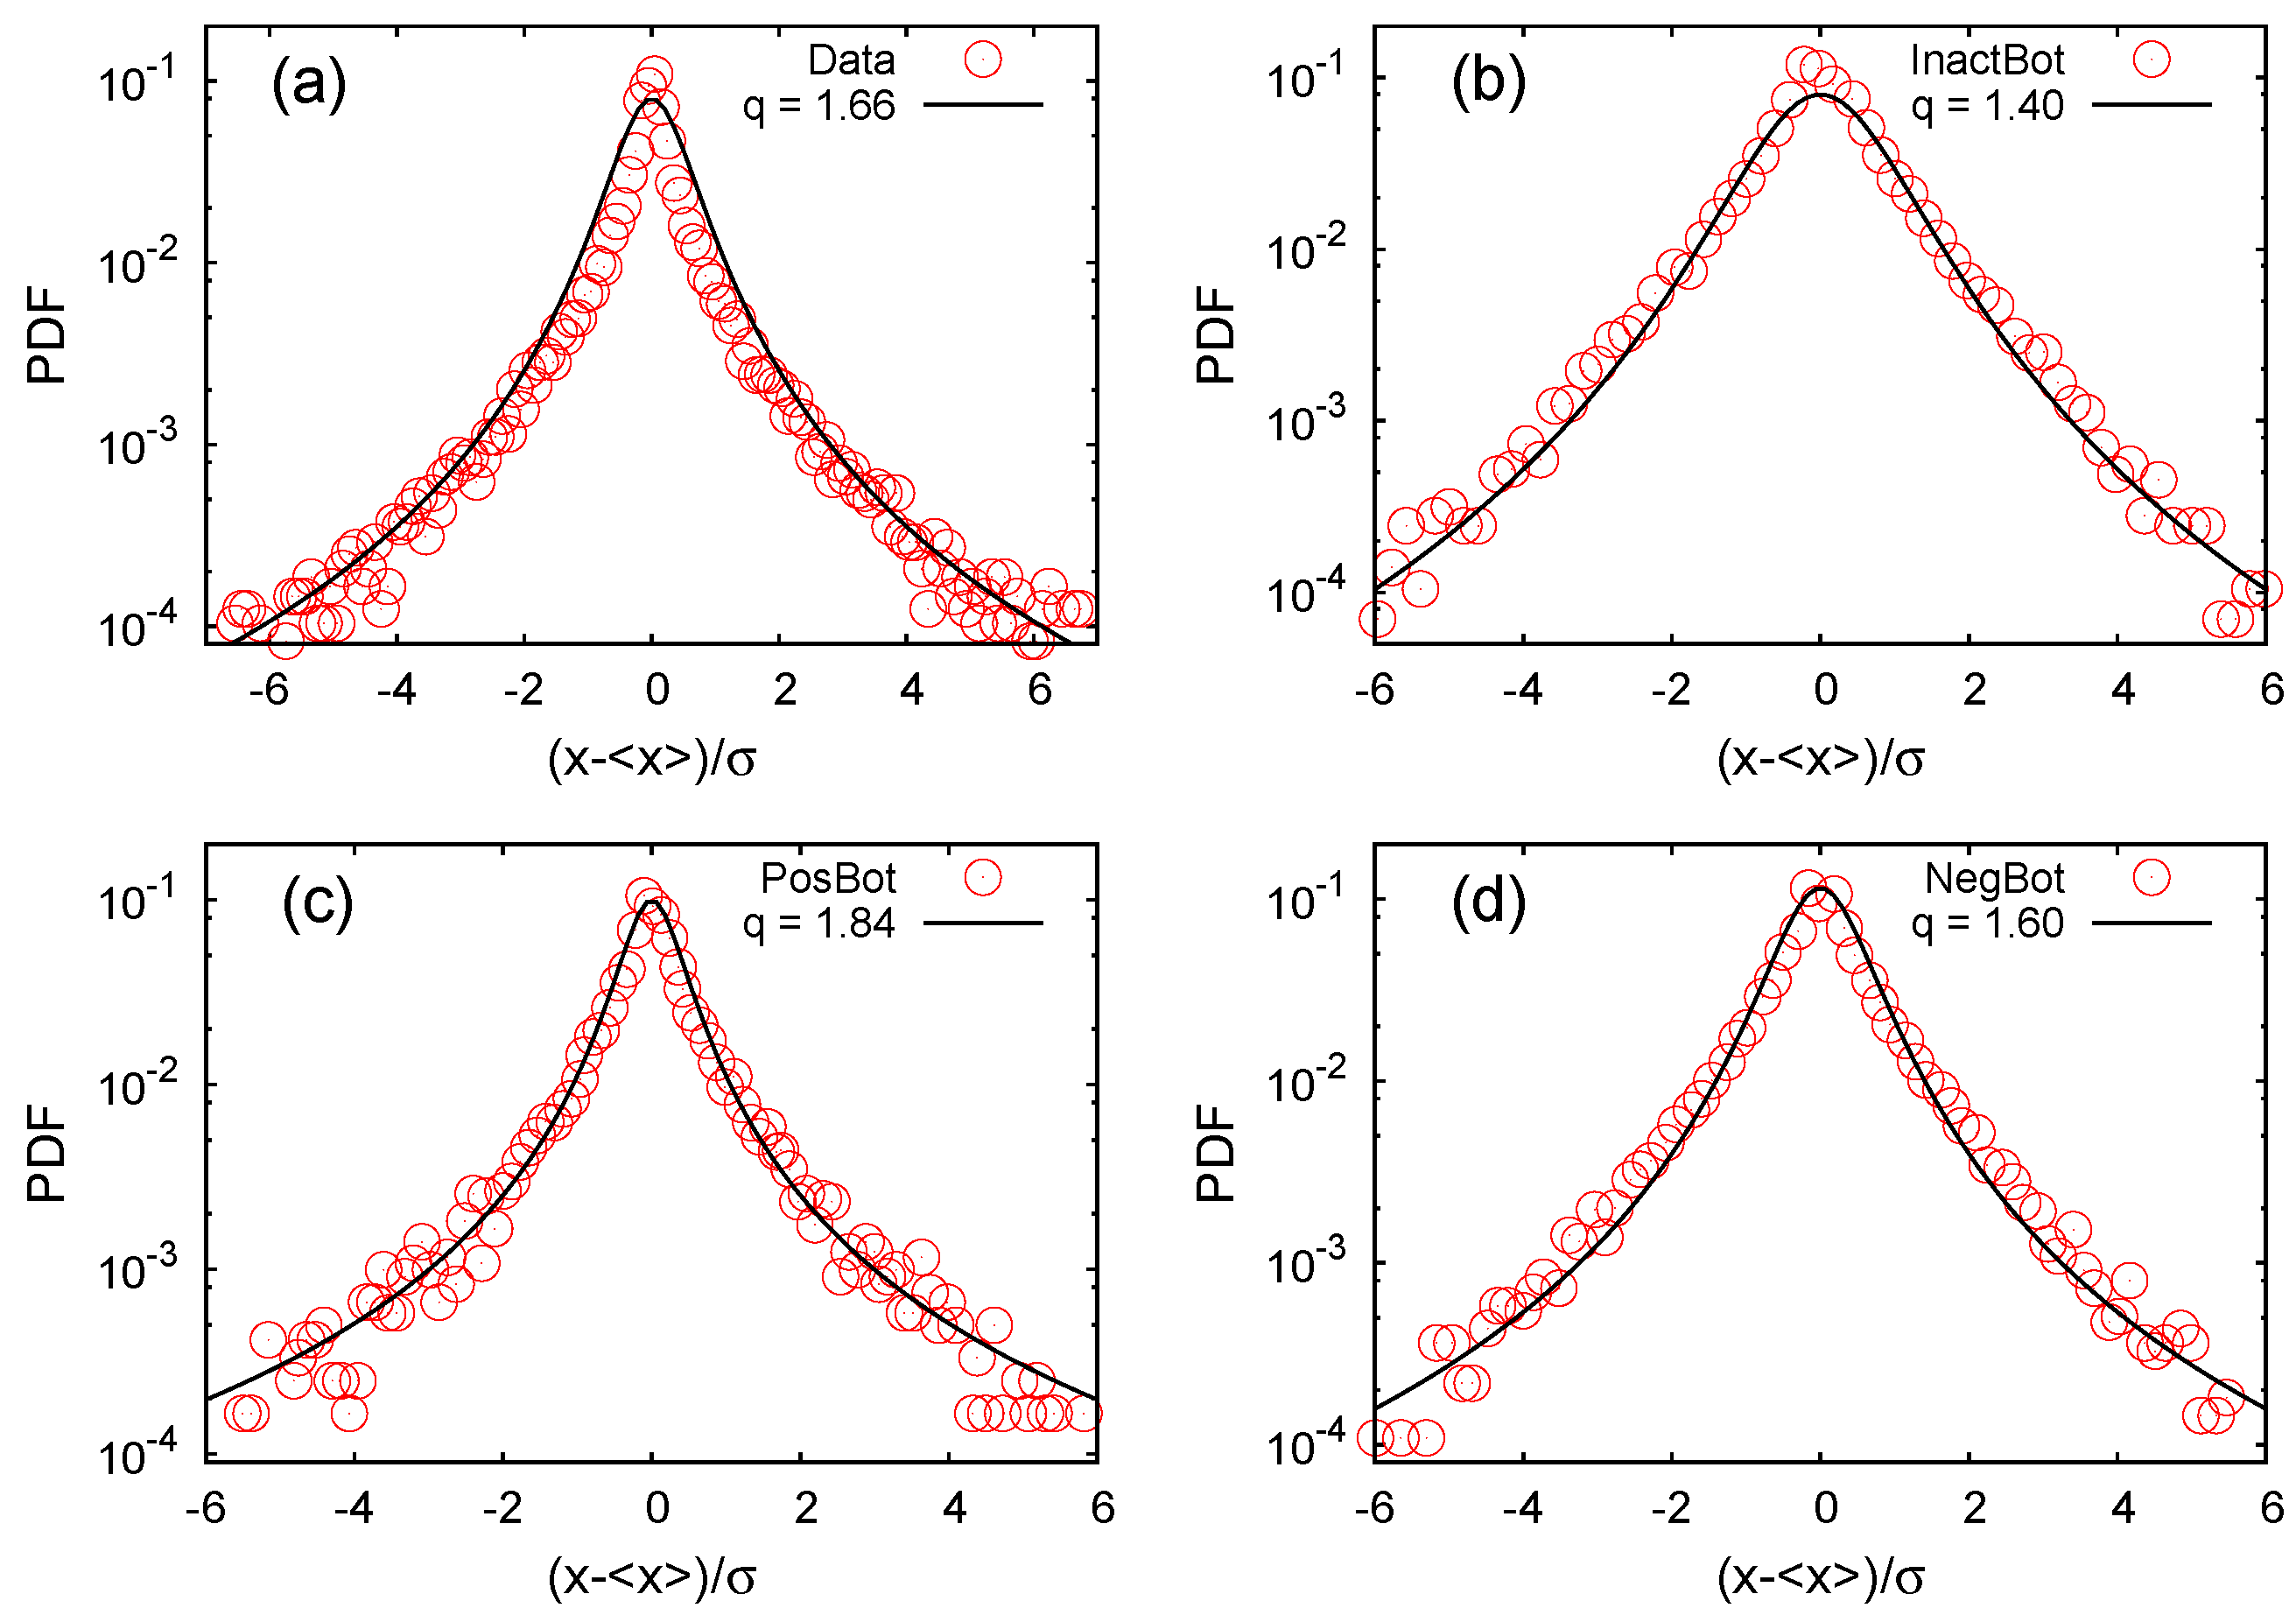
In the agent-based simulations of Section 4, the system of interacting emotional agents on a growing network evolves towards states of higher complexity. As the above fractal anlaysis of time series shows, these states are characterized by long-range temporal correlations, persistence and clustering of events (avalanching). Moreover, the agent trajectories unevenly occupy the phase space of emotional variables, cf. Figure 12. In this type of systems [7], observing the entropy generation with a non-constant rate or nonextensivity may serve as a measure of complexity [3]. For the quantitative analysis within nonextensive statistical mechanics, however, a non-additive entropy needs to be considered [2,3,4,7,8], for instance q-generalized Tsallis entropy,
S q = k 1 - i = 1 W p i q q - 1 ( i = 1 W p i = 1 ; k > 0 )
for a discrete set of probabilities p i . It has been recognized that, for q 1 the non-additive entropy S q is compatible with a class of power-law probability functions and hierarchical or multifractal geometry (see [2] and references therein). Specifically, the probability distribution P ( X ) corresponding to the maximum entropy S q when the first moment is fixed X is given by q-exponential [69,70,71]
P ( X ) = C 1 - ( 1 - q ) X X 0 1 q - 1
Similarly, when the first moment vanishes but the second moment X 2 is known, the entropy maximizing distribution is given by q-Gaussian,
P ( X ) = A 1 - ( 1 - q ) X 2 X 0 2 1 q - 1
These types of distributions were found in many complex dynamical systems [6,72,73,74,75]. Consequently, the Kolmogorov-Sinai (KG) entropy rate, which is used in nonlinear dynamical systems to characterize the rate at which information about the phase space trajectories is produced [76,77], is generalized by using the non-additive entropy, S q , [2,78], i.e.,
K q = lim t lim W lim N S q ( t ) t
In our case W indicates the number of boxes in the partition of ( v , a ) phase space, and N is the total number of points in the phase-space that evolves over time. The partitioning of ( v , a ) phase-space allows us to define a set of probabilities p i ( t ) = N i ( t ) N , where N i is the number of points within i t h box. Therefore, the generalized Tsallis entropy S q ( t ) can be calculated according to Equation (11) for a given value of the parameter q. Varying q-values, the entropy growth with time changes. Hence, for a specific value of the parameter q = q * the entropy rate becomes constant, i.e., the generalized non-additive entropy becomes extensive [2,78]. The set of q-values, associated with different quantities, characterize the system’s nonextensivity class. Note that these parameters are expected to be intrinsically related [2].
In the remaining part of this section we will use the concepts of nonextensive statistical mechanics to determine several quantities from the simulated chat dynamics and from the empirical chat data. In particular, we consider:
  • Time series of avalanche sizes s k , where k = 1 , 2 , denotes successive avalanches obtained from the time series of all messages. Then the difference between sizes of successive avalanches or return of avalanche size X k s k + 1 - s k is computed; the results are plotted on a histogram. The case of avalanches from empirical data and from simulated data in the presence of emotional Bots and inactive Bot are shown in Figure 15. For better comparison, in each panel, respectively, along x-axis we plot the deviation from its average value X - X , normalized by the standard deviation σ of the respective time series. The curves in each panel are fitted by q-Gaussian distributions of Equation (13), with q > 1 , which are listed in the caption of Figure 15.
Figure 15. q-Gaussian distribution of avalanche size returns. Probability density function (PDF) of the rescaled avalanche size returns, X k = s k + 1 - s k , in empirical data of Ubuntu chats (a), and agent-based simulations: silenced Bot (b), positive Bot (c) and negative Bot (d). Solid lines are fits using q-Gaussian distribution of Equation (13), where q = 1 . 66 ± 0 . 09 (a), q = 1 . 4 ± 0 . 2 (b), q = 1 . 84 ± 0 . 06 (c) and q = 1 . 6 ± 0 . 1 (d).
Entropy 15 05084 g015
  • Return times of trajectories to a specified section of the phase space. It serves as a suitable quantitative measure of the reduction of phase space in self-organized processes [7,68,79,80]. The distributions of return times are averaged over trajectories of all agents in the simulations. Considering the arousal and valence of all messages in the simulated data with silenced Bot and with two emotional Bots as well as in the messages of all users in the empirical data, the results for the return-time distributions which are shown in Figure 16a–c are obtained. In the case of the empirical data, the distributions are fitted with the q-exponential distribution Equation (12), with q = 1 . 52 . It is interesting to note that, the distribution from the simulated data with a silenced Bot, in the region of small return times is fitted with the same expression. For long times, however, an exponential function fits the data, suggesting a larger amount of randomness in the simulated dynamics in comparison with the empirical data. On the other hand, when the emotional Bots are present, the entire distribution is modified and can be approximated by a power-law distribution with an exponential cut-off, cf. Figure 16c.
Figure 16. Trajectories in the phase space of emotional variables. The distribution of return times to a given area of phase space in online chats from the empirical Ubuntu data (a) and from agent-based simulations with silenced Bot (b) and two emotional Bots (c).
Entropy 15 05084 g016
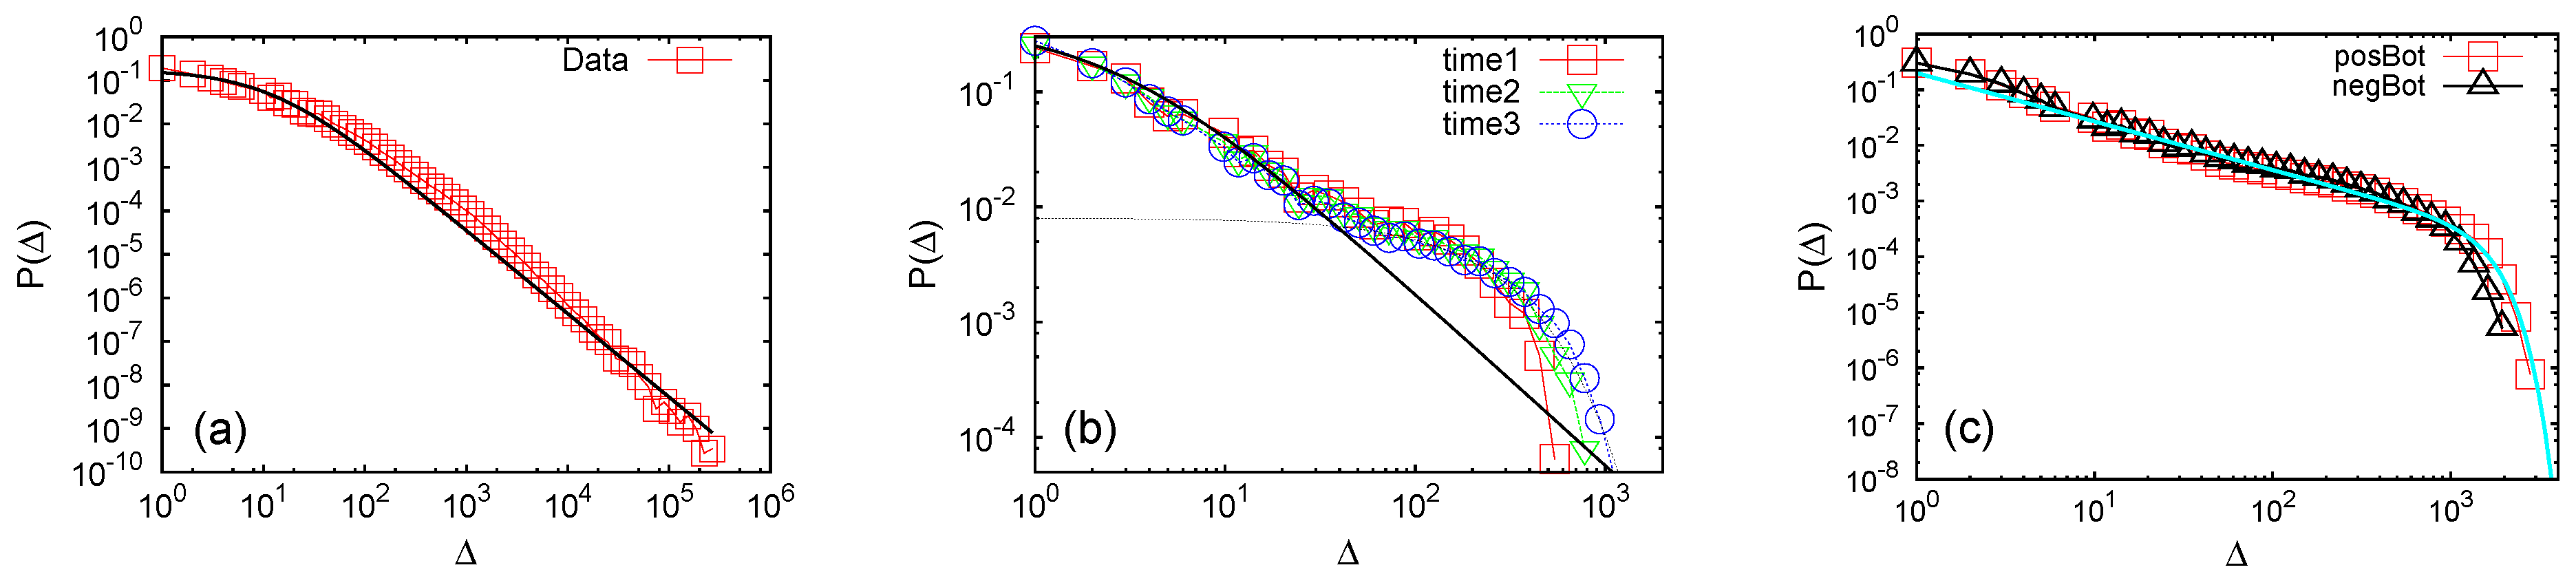
  • Furthermore, when the messages carrying positive and negative emotions are considered separately, the return times to the respective phase space sections differ already in the empirical data. Specifically, the distribution in the case of messages with negative emotion valence has a larger cut-off length X 0 = 117 ± 12 , compared with X 0 = 6 . 4 ± 0 . 4 , for the positive emotion; on the other hand, the tails have similar slopes (within numerical error bars), leading to q = 1 . 50 ± 0 . 02 and q = 1 . 47 ± 0 . 15 for the positive and negative section of the phase space, respectively. The results are shown in Figure 17a. However, in the presence of emotional Bots, the return time distributions differ considerably, depending on the polarity of messages with respect to the Bot’s emotion. In particular, when the positive Bot is present, the return time distribution of positive emotion messages exhibits a power-law decay; on the other hand, the negative messages rather reflect a random process, compatible with an exponential distribution, cf. Figure 17c. Exactly the opposite situation is found in the case of the negative Bot, which is shown in Figure 17d. The situation with an emotionally neutral Bot is depicted inFigure 17b. In this case the differences between positive and negative valence areas are smaller, but the overall tendency resembles the case with the positive Bot.
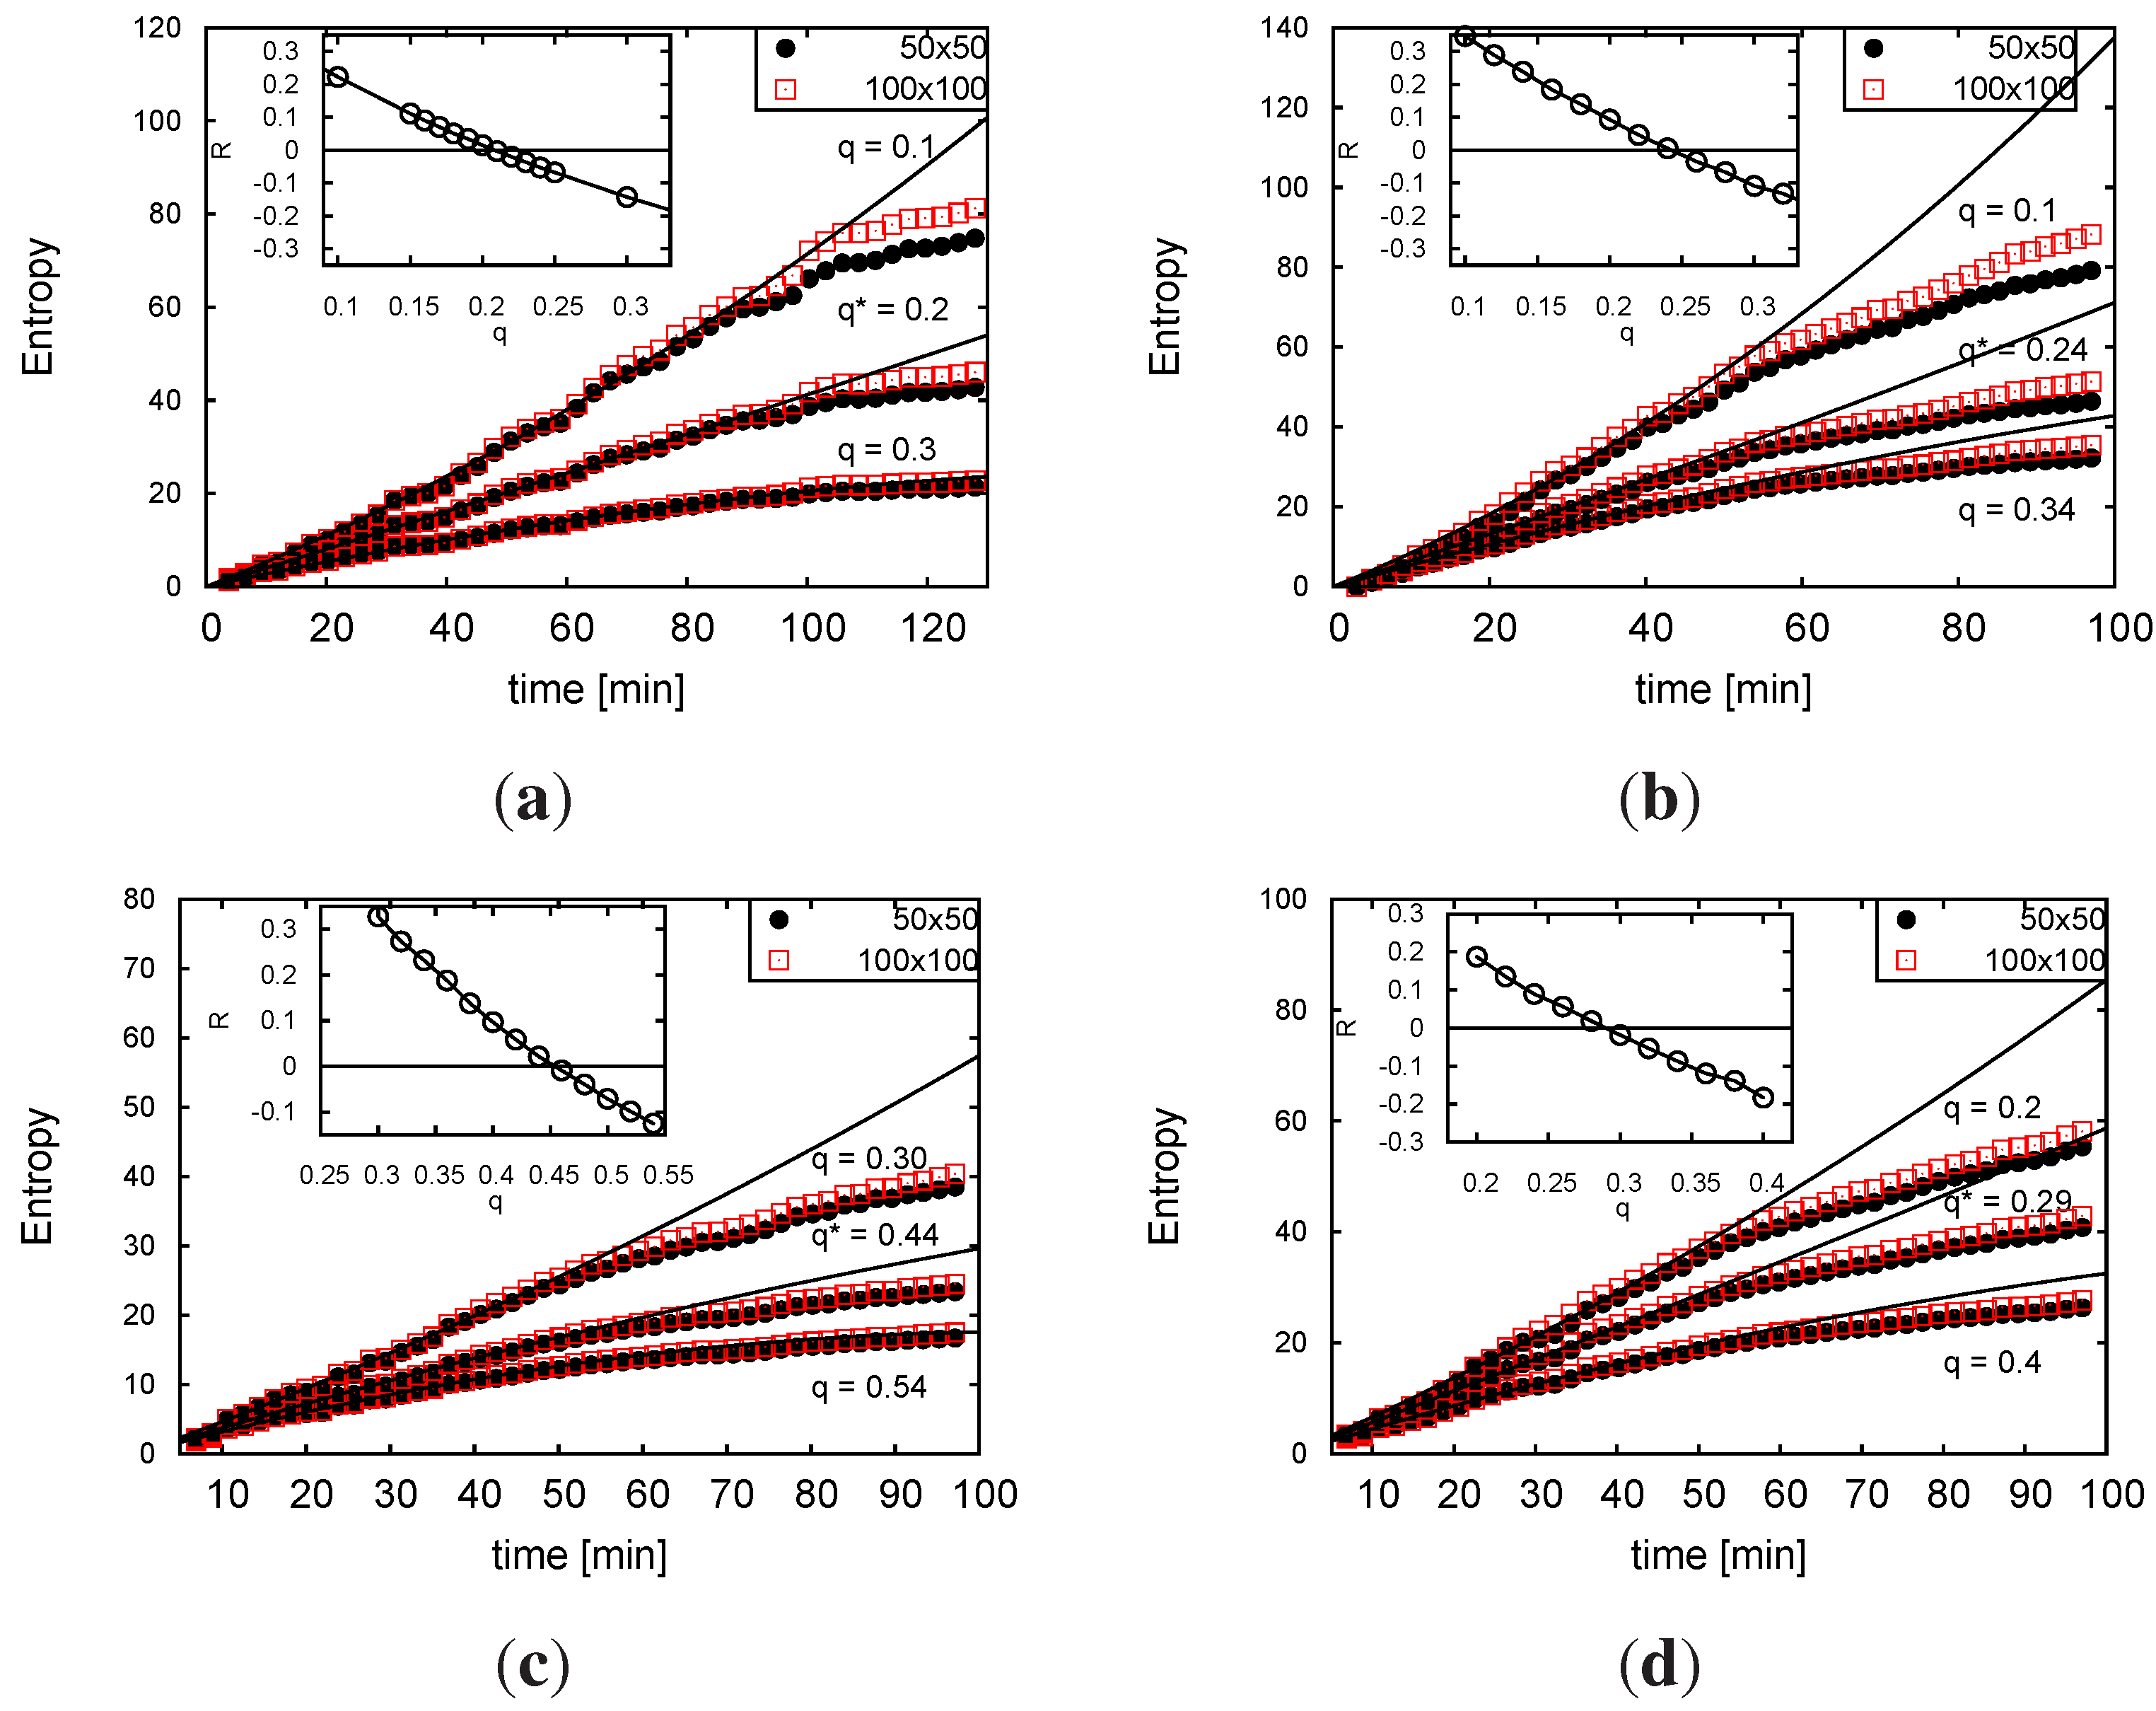
  • The q-generalized Kolmogorov-Sinai entropy rate of Equation (14), is determined by computing the generalized entropy S q ( t ) via Equation (11) for a fixed q and a given partition of the phase space. Then, by varying the parameter q, the rate by which the entropy increases per time step is determined as the slope of the curve S q ( t ) vs. t, see Figure 18. Following [1,78], the value of q = q * at which the growth becomes linear (i.e., entropy extensive) is determined. Precisely, assuming a polynomial dependence of entropy, S q ( t ) = A + B t + C t 2 , in the time interval [ t 1 , t 2 ] , the nonlinear coefficient can be found as R = C ( t 1 + t 2 ) / B . Then q * corresponds to the point where R ( q ) vanishes, as it is shown in the insets to Figure 18. Note that the values q * < 0 . 5 are obtained both in the case of empirical data and data from agent-based simulations, suggesting strong non-additivity of the entropy in the dynamics of emotional chats.
Figure 17. Trajectories in the positive and negative valence regions. The distribution of return times to a given area of phase space with positive and negative valence in online Chats: from the emotion-annotated messages in the empirical data of Ubuntu chats (a) and from agent-based simulations with neutral Bot (b) positive Bot (c) and negative Bot (d).
Entropy 15 05084 g017
Figure 18. Generalized Kolmogorov-Sinai entropy for online chats. S q ( t ) for different values of nonextensivity parameter q plotted against time. Results obtained from empirical data of Ubuntu chats (a) or agent-based simulations with silenced Bot (b) and for the active positive Bot (c) and negative Bot (d). ϵ = 0 . 1 , γ = 0 . 3 . Open and filled symbols are used for two different partitions of the phase space.
Entropy 15 05084 g018

5. Summary and Conclusions

Modern research approaches on quantitative analyses of online communications data have exposed two major features of social dynamics: (a) online social phenomena possess their own regularities that are not mere images of offline social behavior; (b) similarity in the observed collective behavior pertains, to a certain extent, across diverse online communication systems. These findings induct a clear need for better understanding the underlying dynamics and distinguishing the mechanisms at work, which may lead to recognizable social phenomena at a large scale.
In this work, we have addressed these problems by means of data analysis and agent-based modeling. We have demonstrated how different use of emotions in circumstances of online communications are associated with two key mechanisms in the self-organized dynamics, which affect both the emerging social structures and the nature of collective behavior on them. Specifically, by studying two prototype systems—Blogs and IRC channels—we have recognized two distinct classes of the active mechanisms underlying co-evolution of the network structure and emotion propagation, which leads to emotional bursts. Their principal characteristics are summarized here.
  • Excessive-negativity—Popularity—Local-communities: These mechanisms arise in the conditions of indirect interaction between users, which are mediated by posted texts; they involve excessive use of negative emotions (critique), which power the evolution of communities; the self-organized process is highly persistent and it is distinguished by strong clusterings of emotional events; spontaneous breaking into communities occur, leading to popularity of certain posts, which can be tuned by varying the level of external influence;
  • High-arousal—Susceptibility—Global-hierarchy: Such mechanisms are characteristic for knowledge sharing dynamics via direct contacts between users. Disparity on the level of knowledge (activity) between users inevitably leads to a hierarchical structure of connections. The process is self-organized but with a moderate persistence and subcritical avalanches; emotional commitment with a high arousal is relevant. However, typically balanced positive and negative emotional valence, together with the hierarchical structure of the network, makes the system highly susceptible for external emotional influence or activity of Bots.
Furthermore, performed a comparative analysis of the empirical data, where the presence of emotions is recognized, with the agent-based modeling, where the interactions among agents are chiefly emotional, but the profile of agents is statistically similar with the profile of users in the respective empirical data, enables us to quantify the role of emotions in these communication systems. A detailed study of topology of the networks emerging in emotional blogging by agents has been made in [45]. It has been shown that global topology of the bipartite, as well as the projected monopartite structures, have statistically similar characteristics as the networks constructed from the empirical data of ddDiggs. The number of communities can be influenced [45] by varying the parameter f, the mean-field fraction in Equation (5) and Equation (6). A similar analysis, which is conducted for the networks emerging in the emotional chats of agents in the presence of a neutral Bot in [30], revealed that salient features of the empirical chat networks (including its disassortative mixing) are well reflected in the simulated data. In this work, we have further extended these studies; specifically, we have examined the fractal stochastic processes in real systems (from their empirical data) in comparison with the processes simulated by the corresponding agent-based model. The obtained quantitative measures of these fractal processes are summarized in the Table 2.
These results suggest that a similar collective emotional behavior occurs in both agent-based simulations and the related empirical data. Accordingly, the quantitative measures for the temporal correlations, avalanching and persistence of the fluctuations indicate that we deal with the same type of stochastic point processes. On the other hand, the quantitative differences between the corresponding scaling exponents, shown in the Table 2, indicate to what amount the emotions play a role in the particular system. For instance, the time series of the emotional messages in the simulated dynamics of chats exhibits stronger temporal correlations and slightly larger persistence than the similar series in the empirical system Ubuntu channel. Therefore, we may conclude that the model slightly exaggerates the role of emotions, as compared with the real chat channel. However, in the case of blogging dynamics, the situation is just the reverse. The temporal correlations and persistence are even greater in the emotional messages of the empirical system ddDiggs than in the simulated data with the emotional interactions among agents. These findings further reinforce the conclusions, obtained in Section 3.1 and in the empirical data of [12], that the occurrence of communities at popular posts is powered by an excessive use of negative emotions.
Table 2. Summary of the scaling exponents which characterize the fractality of dynamics of blogs and online chats, from the empirical data and the related agent-based modeling.
ddDiggs data popular postsABM blogging by emotional agentsUbuntu channel data of online chatsABM emotional chats with a neutral Bot
ϕ a 0.93(7)1.18(11)0.66(2)0.84(6)
ϕ + 0.77(8)1.25(11)0.55(2)1.06(8)
ϕ - 0.84(8)0.80(11)0.50(2)1.19(8)
H a 1.035(3)0.854(3)0.796(5)0.907(1)
H + 0.901(3)0.775(3)0.834(2)0.942(2)
H - 0.966(2)0.809(5)0.825(3)0.971(2)
Even though the identified mechanisms are typical for the dynamics in Blogs and IRC channels, respectively, we expect that they apply more commonly, i.e., in accordance with the associated type of social structure co-evolving in the same self-organized process. It should be stressed that the entirely different mechanisms are at work when the network is fixed, such as in the case online social network MySpace, where the communities of “friends” already exist and the messages are exchanged directly from user to user [16]. It was shown that in such direct communications often positive emotions prevail [16], however, both negative and positive emotions may become dominant in the dialogs, depending on the external input [46].
One of our main emphases in this work was on the nature of self-organized processes in IRC channels and Blogs when the emotions are involved. Our quantitative analysis of these processes led to the following conclusions. Firstly, the fractal structure of the underlying self-organized process is compatible with the active mechanism of the use of emotions and the type of emergent social network. Hence, the fractal characteristics of the process can be seen as the hallmark of the dynamical system. Secondly, by means of several quantitative measures, we have made evident that these processes of emotional interactions follow a generalized extensive entropy. Thirdly, these fractal characteristics of the process as well as the co-evolution of the social network allow smooth spreading of the Bot’s impact over the entire social structure. The Bot’s activity changes the quantitative measures of the process and causes bi-layered network structure of the emotion-carrying links. Therefore, by measuring namely these characteristics of the self-organized process and the co-evolving network one can reveal the behavior of an (emotional) Bot in the system and can estimate its effectiveness. These findings shed a new light onto complexity of online social dynamics. We hope that they may contribute to establishing a more robust classification of the social phenomena on the Web as well as to initiate more theoretical and empirical research along these lines.

Acknowledgments

We are grateful for support from program P1-0044 by the Research Agency of the Republic of Slovenia and from the European Community’s program FP7-ICT-2008-3 under grant no 231323. M.S. would also like to thank for support from projects OI171037 and III41011 of the Republic of Serbia.

Conflicts of Interest

The authors declare no conflict of interest.

References

  1. Pressé, S.; Ghosh, K.; Lee, J.; Dill, K.A. Principles of maximum entropy and maximum caliber in statistical physics. Rev. Mod. Phys. 2013, 85, 1115–1141. [Google Scholar] [CrossRef]
  2. Tsallis, C. The nonadditive entropy sq and its applications in physics and elsewhere: Some remarks. Entropy 2011, 13, 1765–1804. [Google Scholar] [CrossRef]
  3. Bialek, W.; Nemenman, I.; Tishby, N. Complexity through nonextensivity. Physica A 2001, 302, 89–99. [Google Scholar] [CrossRef]
  4. Tsallis, C. Introduction to Nonextensive Statistical Mechanics : Approaching A Complex World; Springer: New York, NY, USA, 2009. [Google Scholar]
  5. Hanel, R.; Thurner, S.; Gell-Mann, M. Generalized entropies and logarithms and their duality relations. Proc. Natl. Acad. Sci. USA 2012, 109, 19151–19154. [Google Scholar] [CrossRef] [PubMed]
  6. Hanel, R.; Thurner, S. A comprehensive classification of complex statistical systems and an ab initio derivation of their entropy and distribution functions. Eur. Lett. 2011, 93, 20006. [Google Scholar] [CrossRef]
  7. Hanel, R.; Thurner, S. When do generalized entropies apply? How phase space volume determines entropy. Eur. Lett. 2011, 96, 50003. [Google Scholar] [CrossRef]
  8. Gell-Mann, M.; Tsallis, C. (Eds.) Nonextensive Entropy : Interdisciplinary Applications; Oxford University Press: Oxford, UK, 2004.
  9. Zaripov, R.G. Group, geometry and algebra of nonextensive entropies in complex systems. J. Phys. Conf. 2012, 394, 012001. [Google Scholar] [CrossRef]
  10. Mitrović, M.; Tadić, B. Bloggers behavior and emergent communities in blog space. Eur. Phys. J. B 2010, 73, 293–301. [Google Scholar] [CrossRef]
  11. Dodds, P.; Harris, K.; Koloumann, I.; Bliss, C.; Danforth, C. Temporal patterns of happiness and information in a global social network: Hedonometric and Twitter. 2011, arXiv:1101.5120v3. [Google Scholar]
  12. Mitrović, M.; Paltoglou, G.; Tadić, B. Quantitative analysis of bloggers’ collective behavior powered by emotions. J. Stat. Mech. Theor. Exp. 2011, 2011, P02005. [Google Scholar] [CrossRef]
  13. Chmiel, A.; Sobkowicz, P.; Sienkiewicz, J.; Paltoglou, G.; Buckley, K.; Thelwall, M.; Holyst, J. Negative emotions boost user activity at BBC forum. Physica A 2011, 390, 29362944. [Google Scholar] [CrossRef]
  14. Szell, M.; Thurner, S. Measuring social dynamics in a massive multiplayer online game. Soc. Networks 2010, 32, 313–329. [Google Scholar] [CrossRef]
  15. Szell, M.; Lambiotte, R.; Thurner, S. Multirelational organization of large-scale social networks. Proc. Natl. Acad. Sci. USA 2010, 107, 13636–13641. [Google Scholar] [CrossRef] [PubMed]
  16. Šuvakov, M.; Mitrović, M.; Gligorijević, V.; Tadić, B. How the online social networks are used: Dialogues-based structure of MySpace. J. R. Soc. Inter. 2012, 10, 20120819. [Google Scholar] [CrossRef] [PubMed]
  17. Ferrara, E.; Meo, P.D.; Fiumara, G.; Provetti, A. The role of strong and weak ties in facebook: A community structure perspective. 2012, arXiv:1203.0535. [Google Scholar]
  18. González-Bailón, S.; Borge-Holthoefer, J.; Rivero, A.; Moreno, Y. The dynamics of protest recruitment through an online network. Sci. Rep. 2011, 1, No. 197. [Google Scholar] [CrossRef] [PubMed]
  19. Gligorijević, V.; Skowron, M.; Tadić, B. Structure and stability of online chat networks built on emotion-carrying links. Physica A 2013, 392, 538–543. [Google Scholar] [CrossRef]
  20. Calvo, R.; D’Mello, S. Affect detection: An interdisciplinary review of models, methods, and their applications. IEEE Trans. Affect. Comput. 2010, 1, 18–37. [Google Scholar] [CrossRef]
  21. Fortuna, B.; Grobelnik, M.; Mladenic, D. OntoGen. Available online: http://ontogen.ijs.si/ (accessed on 4 October 2013).
  22. Paltoglou, G.; Gobron, S.; Skowron, M.; Thelwall, M.; Thalmann, D. Sentiment Analysis of Informal Textual Communication in Cyberspace; Springer LNCS State-of-the-Art Survey; Springer: Heidelberg, Germany, 2010; pp. 13–23. [Google Scholar]
  23. Paltoglou, G.; Theunis, M.; Kappas, A.; Thelwall, M. Prediction of valence and arousal in forum discussions. IEEE Trans. Affect. Comput. 2011, 4, 106–115. [Google Scholar] [CrossRef]
  24. Coan, J.A.; Allen, J.J.B. (Eds.) The Handbook of Emotion Elicitation and Assessment; Series in Affective Science; Oxford University Press: Oxford, UK, 2007.
  25. Russell, J.A. A circumplex model of affect. J. Pers. Soc. Psychol. 1980, 39, 1161–1178. [Google Scholar]
  26. Grujić, J.; Mitrović, M.; Tadić, B. Mixing Patterns and Communities on Bipartite Graphs on Web-Based Social Interactions. In Proceedings of 16th International Conference on Digital Signal Processing, Santorini, Greece, 5–7 July 2009; pp. 1–8.
  27. Mitrović, M.; Paltoglou, G.; Tadić, B. Networks and emotion-driven user communities at popular blogs. Eur. Phys. J. B 2010, 77, 597–609. [Google Scholar]
  28. Mitrović, M.; Tadić, B. Emergence and Structure of Cybercommunities. In Handbook of Optrimization in Complex Networks: Theory and Applications; Thai, M.M., Pardalos, P., Eds.; Springer: Berlin, Germany, 2012; pp. 209–227. [Google Scholar]
  29. Gligorijević, V.; Skowron, M.; Tadić, B. Directed Networks of Online Chats: Content-Based Linking and Social Structure. In Proceedings of 8th International Conference on Signal Image Technology and Internet Based Systems (SITIS), Naples, Italy, 25–29 November 2012; pp. 725–730.
  30. Gligorijević, V.; Šuvakov, M.; Tadić, B. Building Social Networks of Online Chats with Users, Agents and Bots. In Complex Networks and their Applicatiobs (SITIS 2012); Cherifi, H., Ed.; Cambridge Scholars Publishing: Newcastle, UK, 2013; pp. 251–274. [Google Scholar]
  31. Malmgren, R.D.; Stouffer, D.B.; Campanharo, A.S.L.O.; Amaral, L.A. On universality in human correspondence activity. Science 2009, 325, 1696–1700. [Google Scholar] [CrossRef] [PubMed]
  32. Vázquez, A.; Oliveira, J.G.; Dezsö, Z.; Goh, K.I.; Kondor, I.; Barabási, A.L. Modeling bursts and heavy tails in human dynamics. Phys. Rev. E 2006, 73, 036127. [Google Scholar] [CrossRef] [PubMed]
  33. Lowen, S.; Teich, M. Estimation and simulation of fractal stochastic point processes. Fractals 1995, 3, 183–210. [Google Scholar] [CrossRef]
  34. Tadić, B. Nonuniversal scaling behavior of barkhausen noise. Phys. Rev. Lett. 1996, 77, 3843–3846. [Google Scholar] [CrossRef] [PubMed]
  35. Spasojević, D.; Bukvić, S.; Milošević, S.; Stanley, G. Barkhausen noise: Elementary signals, power laws, and scaling relations. Phys. Rev. E 1996, 54, 2531–2546. [Google Scholar] [CrossRef]
  36. Dhar, D. Theoretical studies of self-organized criticality. Physica A 2006, 369, 29–70. [Google Scholar] [CrossRef]
  37. Thurner, S.; Szell, M.; Sinatra, R. Emergence of good conduct, scaling and zipf laws in human behavioral sequences in an online world. PLoS One 2012, 7, e29796. [Google Scholar] [CrossRef] [PubMed]
  38. Tadić, B.; Šuvakov, M. Can human-like bots control Collective mood: Agent-based simulations of online chats. J. Stat. Mech. Theor. Exp. 2013. [Google Scholar] [CrossRef]
  39. Fowler, J.H.; Christakis, N.A. Dynamic spread of happiness in a large social network: Longitudinal analysis over 20 years in the Framingham Heart Study. Br. Med. J. 2008, 337, a2338. [Google Scholar]
  40. Dodds, P.; Danforth, C. Measuring the happiness of large-scale written expression: Songs, blogs, and presidents. J. Happiness Stud. 2009, 11, 441–456. [Google Scholar] [CrossRef]
  41. Johnson, N.F.; Xu, C.; Zhao, Z.; Ducheneaut, N.; Yee, N.; Tita, G.; Hui, P.M. Human group formation in online guilds and offline gangs driven by a common team dynamic. Phys. Rev. E 2009, 79, 066117. [Google Scholar] [CrossRef] [PubMed]
  42. Giles, M. A world of connections—A special report on social networking. The Economist 2010, 16. [Google Scholar]
  43. Gonzalez-Bailon, S.; Banchs, R.; Kaltenbrunner, A. Emotional reactions and the pulse of public opinion: Measuring the impact of political events on the sentiment of online discussions. 2010, arXiv:1009.4019. [Google Scholar]
  44. Mitrović, M.; Tadić, B. Patterns of emotional blogging and emergence of communities: Agent-based model on bipartite networks. 2011, arXiv.org/abs/1110.5057. [Google Scholar]
  45. Mitrović, M.; Tadić, B. Dynamics of bloggers’ communities: Bipartite networks from empirical data and agent-based modeling. Physica A 2012, 391, 5264–5278. [Google Scholar] [CrossRef]
  46. Šuvakov, M.; Garcia, D.; Schweitzer, F.; Tadić, B. Agent-based simulations of emotion spreading in online social networks. 2012, arXiv.org/abs/1205.6278. [Google Scholar]
  47. Šuvakov, M.; Tadić, B. Agent-based simulations of online chats with moderators and emotional Bots. 2013. in preparation. [Google Scholar]
  48. Bogojević, A.; Balaž, A.; Belić, A. Scaling exponents and phase separation in a nonlinear network model inspired by the gravitational accretion. Physica D 2013, 255, 52–57. [Google Scholar] [CrossRef]
  49. Krioukov, D.; Kitsak, M.; Sinkovits, R.S.; Rideout, D.; Meyer, D.; Boguña, M. Network cosmology. Sci. Rep. 2012, 2. [Google Scholar] [CrossRef] [PubMed]
  50. Živković, J.; Tadić, B. Nanonetworks: The graph theory framework for nanoscale systems. Nanoscale Sys. Math. Mod. Theory Appl. 2013, 2, 30–48. [Google Scholar] [CrossRef]
  51. Šuvakov, M.; Tadić, B. Topology of Cell-Aggregated Planar Graphs; Alexandov, V.N., van Albada, G.D., Sloot, P.M.A., Dongarra, J., Eds.; Lecture Notes in Computer Science Part III; Springer: New York, NY, USA, 2006; Volume 3993, pp. 1098–1105. [Google Scholar]
  52. Szell, M.; Thurner, S. Measuring social dynamics in a massive multiplayer online game. Soc. Networks 2010, 32, 313–329. [Google Scholar] [CrossRef]
  53. Guimerà, R.; Danon, L.; Díaz-Guilera, A.; Giralt, F.; Arenas, A. Self-similar community structure in a network of human interactions. Phys. Rev. E 2003, 68, 065103. [Google Scholar] [CrossRef] [PubMed]
  54. Onela, J.; Saramaki, J.; Hyvönen, J.; Szabo, G.; de Menezes, M.; Kaski, K.; Barabási, A.L.; Kertesz, J. Analysis of large-scale weighted networks of one-to-one human communications. New J. Phys. 2007, 9. [Google Scholar] [CrossRef]
  55. Cattuto, C.; Barrat, A.; Baldassarri, A.; Schehr, G.; Loreto, V. Collective dynamics of social annotation. Proc. Natl. Acad. Sci. USA 2009, 106, 10511–10515. [Google Scholar] [CrossRef] [PubMed]
  56. Ugander, J.; Karrer, B.; Backstrom, L.; Marlow, C. The anatomy of the facebook social graph. 2011, arXiv:1111.4503v1. [Google Scholar]
  57. Mitrović, M.; Tadić, B. Spectral and dynamical properties in classes of sparse networks with mesoscopic inhomogeneities. Phys. Rev. E 2009, 80, 026123. [Google Scholar] [CrossRef] [PubMed]
  58. Hu, J.; Gao, J.; Wang, X. Multifractal analysis of sunspot time series: The effects of the 11-year cycle and Fourier truncation. J. Stat. Mech. Theor. Exp. 2009, 2009, P02066. [Google Scholar] [CrossRef]
  59. Tadić, B. Modeling Behavior of Web Users as Agents with Reason and Sentiment. In Advances in Computational Modeling Research: Theory, Developments and Applications; Kora, A.B., Ed.; Novapublishing: New York, NY, USA, 2013; pp. 177–186. [Google Scholar]
  60. Schweitzer, F.; Garcia, D. An agent-based model of collective emotions in online communities. Eur. Phys. J. B 2010, 77, 533–545. [Google Scholar] [CrossRef]
  61. Dorogovtsev, S.N.; Goltsev, A.V.; Mendes, J.F.; Samukhin, A.N. Spectra of complex networks. Phys. Rev. E 2003, 68, 046109. [Google Scholar] [CrossRef] [PubMed]
  62. Scherer, K. What are emotions? And how can they be measured? Soc. Sci. Inf. 2005, 44, 695–729. [Google Scholar] [CrossRef]
  63. Ahn, J.; Gobron, S.; Silvestre, Q.; Thalmann, D. Asymmetrical Facial Expressions Based on an Advanced Interpretation of Two-dimensional Russell’s Emotional Model. In Proceedings of ENGAGE 2010, Zermatt, Switzerland, 13–15 September 2010.
  64. Skowron, M.; Rank, S.; Theunis, M.; Sienkiewicz, J. The Good, the Bad and the Neutral: Affective Profile in Dialog System-User Communication. In Proceedings of the 4th International Conference on Affective Computing and Intelligent Interaction, Memphis, TN, USA, 9–12 October 2011; Springer: Berlin/Heidelberg, Germany, 2011; Volume Part I, ACII’11, pp. 337–346. [Google Scholar]
  65. Tadić, B.; Gligorijević, V.; Skowron, M.; Šuvakov, M. The dynamics of emotional chats with Bots: Experiment and agent-based simulations. 2013. prepared for submission. [Google Scholar]
  66. Lee, K.M.; Kim, J.Y.; Cho, W.K.; Goh, K.I.; Kim, I.M. Correlated multiplexity and connectivity of multiplex random networks. New J. Phys. 2012, 14, 033027. [Google Scholar] [CrossRef]
  67. Cardillo, A.; Gómez-Gardeñes, J.; Zanin, M.; Romance, M.; Papo, D.; del Pozo, F.; Boccaletti, S. Emergence of network features from multiplexity. Sci. Rep. 2013, 3. [Google Scholar] [CrossRef] [PubMed]
  68. Tsallis, C. Entropic nonextensivity: A possible measure of complexity. Chaos Soliton. Fract. 2002, 13, 371–391. [Google Scholar] [CrossRef]
  69. Tsallis, C. Nonextensive statistical mechanics, anomalous diffusion and central limit theorems. Milan J. Math. 2005, 73, 145–176. [Google Scholar] [CrossRef]
  70. Thurner, S. Statistical Mechanics of Complex Networks. In Structural Analysis of Complex Networks: From Biology to Linguistics; Dehmer, M., Emmert-Streib, F., Eds.; Wiley: New York, NY, USA, 2009; pp. 23–45. [Google Scholar]
  71. Soares, D.J.B.; Tsallis, C.; Mariz, A.M.; Silva, L.R.D. Preferential attachment growth model and nonextensive statistical mechanics. Eur. Lett. 2005, 70, 70–76. [Google Scholar] [CrossRef]
  72. Caruso, F.; Pluchino, A.; Latora, V.; Vinciguerra, S.; Rapisarda, A. Analysis of self-organized criticality in the Olami-Feder-Christensen model and in real earthquakes. Phys. Rev. E 2007, 75, 055101. [Google Scholar] [CrossRef] [PubMed]
  73. Thurner, S.; Hanel, R. The entropy of non-ergodic complex systems—a derivation from first principles. Int. J. Mod. Phys. 2012, 16, 105–115. [Google Scholar] [CrossRef]
  74. Thurner, S.; Kyriakopoulos, F.; Tsallis, C. Unified model for network dynamics exhibiting nonextensive statistics. Phys. Rev. E 2007, 76, 036111. [Google Scholar] [CrossRef] [PubMed]
  75. Thurner, S.; Tsallis, C. Nonextensive aspects of self-organized, scale-free, gas-like networks. Eur. Lett. 2005, 72, 197–203. [Google Scholar] [CrossRef]
  76. van Beijeren, H.; Dorfman, J.R.; Posch, H.A.; Dellago, C. Kolmogorov-Sinai entropy for dilute gases in equilibrium. Phys. Rev. E 1997, 56, 5272–5277. [Google Scholar] [CrossRef]
  77. Eckmann, J.P.; Ruelle, D. Ergodic theory of chaos and strange attractors. Rev. Mod. Phys. 1985, 57, 617–656. [Google Scholar] [CrossRef]
  78. Tirnakli, U.; Ananos, G.F.; Tsallis, C. Generalization of the Kolmogorov-Sinai entropy: logistic-like and generalized cosine maps at the chaos threshold. Phys. Lett. A 2001, 289, 51–58. [Google Scholar] [CrossRef]
  79. Tsallis, C.; Brigatti, E. Nonextensive statistical mechanics: A brief introduction. Continuum Mech. Therm. 2004, 16, 223–235. [Google Scholar] [CrossRef]
  80. Levnajić, Z.; Tadić, B. Self-organization in trees and motifs of two-dimensional chaotic maps with time delay. J. Stat. Mech. Theor. Exp. 2008, 2008, P03003. [Google Scholar] [CrossRef]

