Energy Potential Mapping: Visualising Energy Characteristics for the Exergetic Optimisation of the Built Environment


Abstract
:1. Introduction
1.1. Motivation

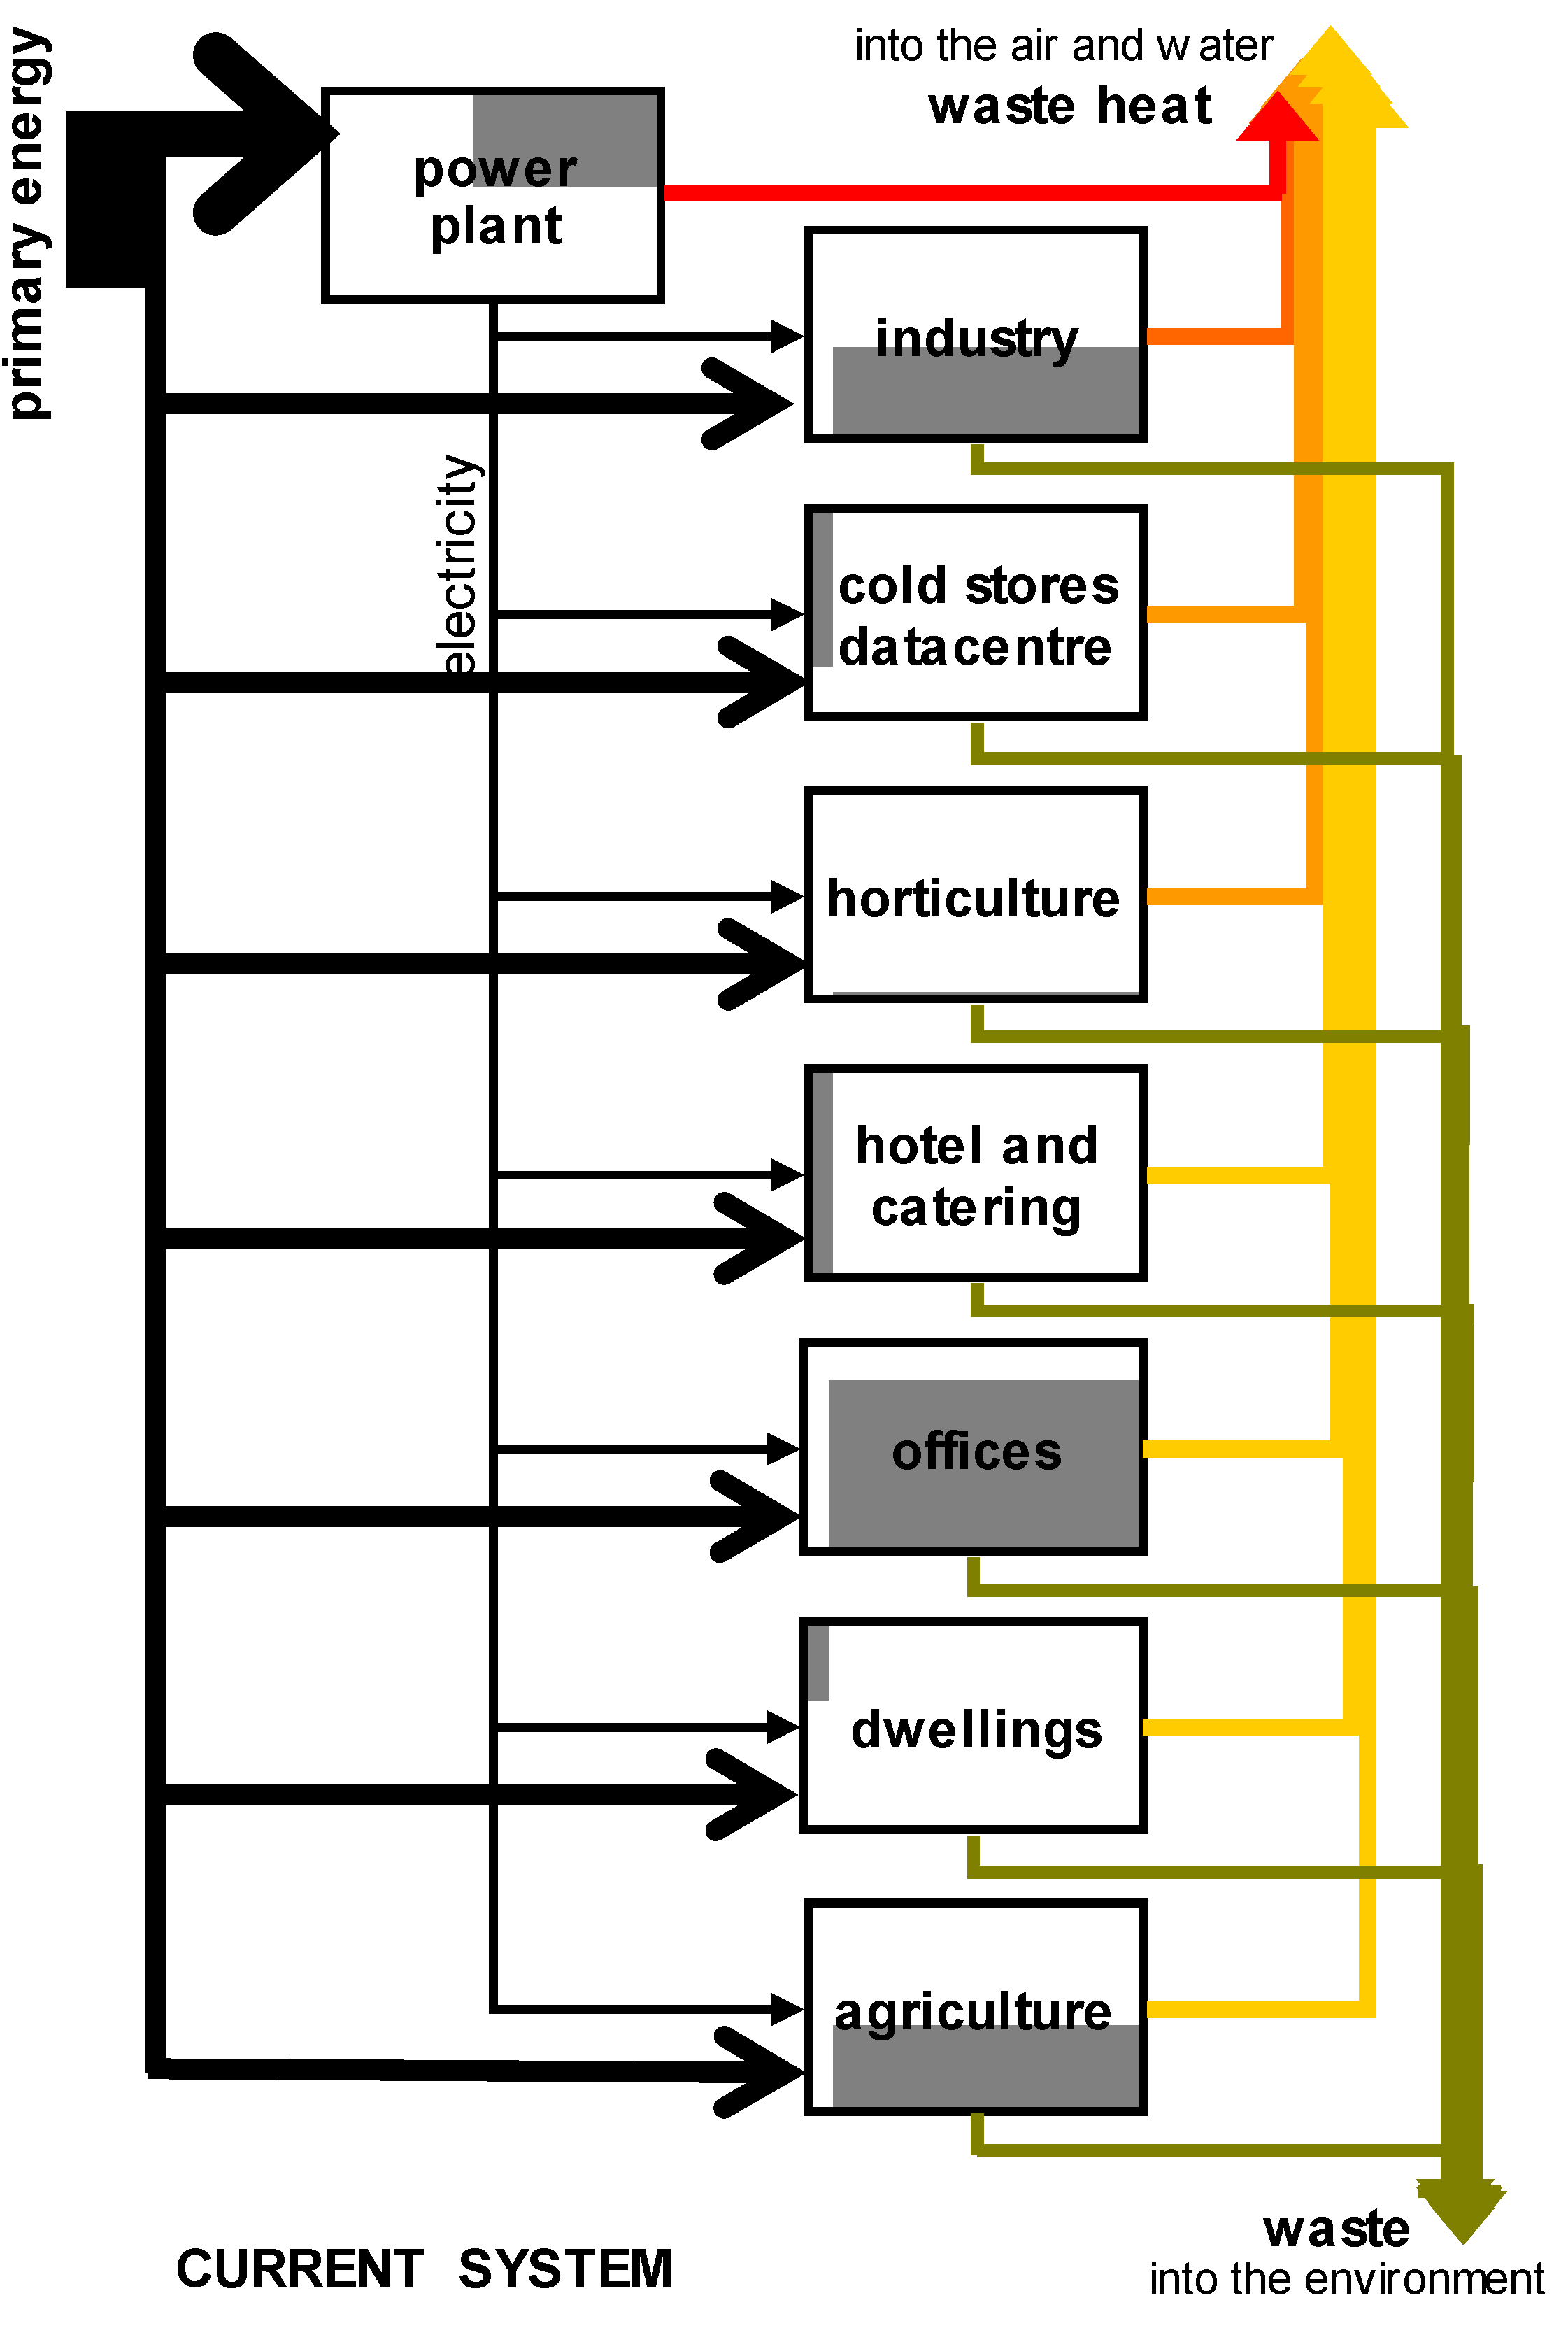
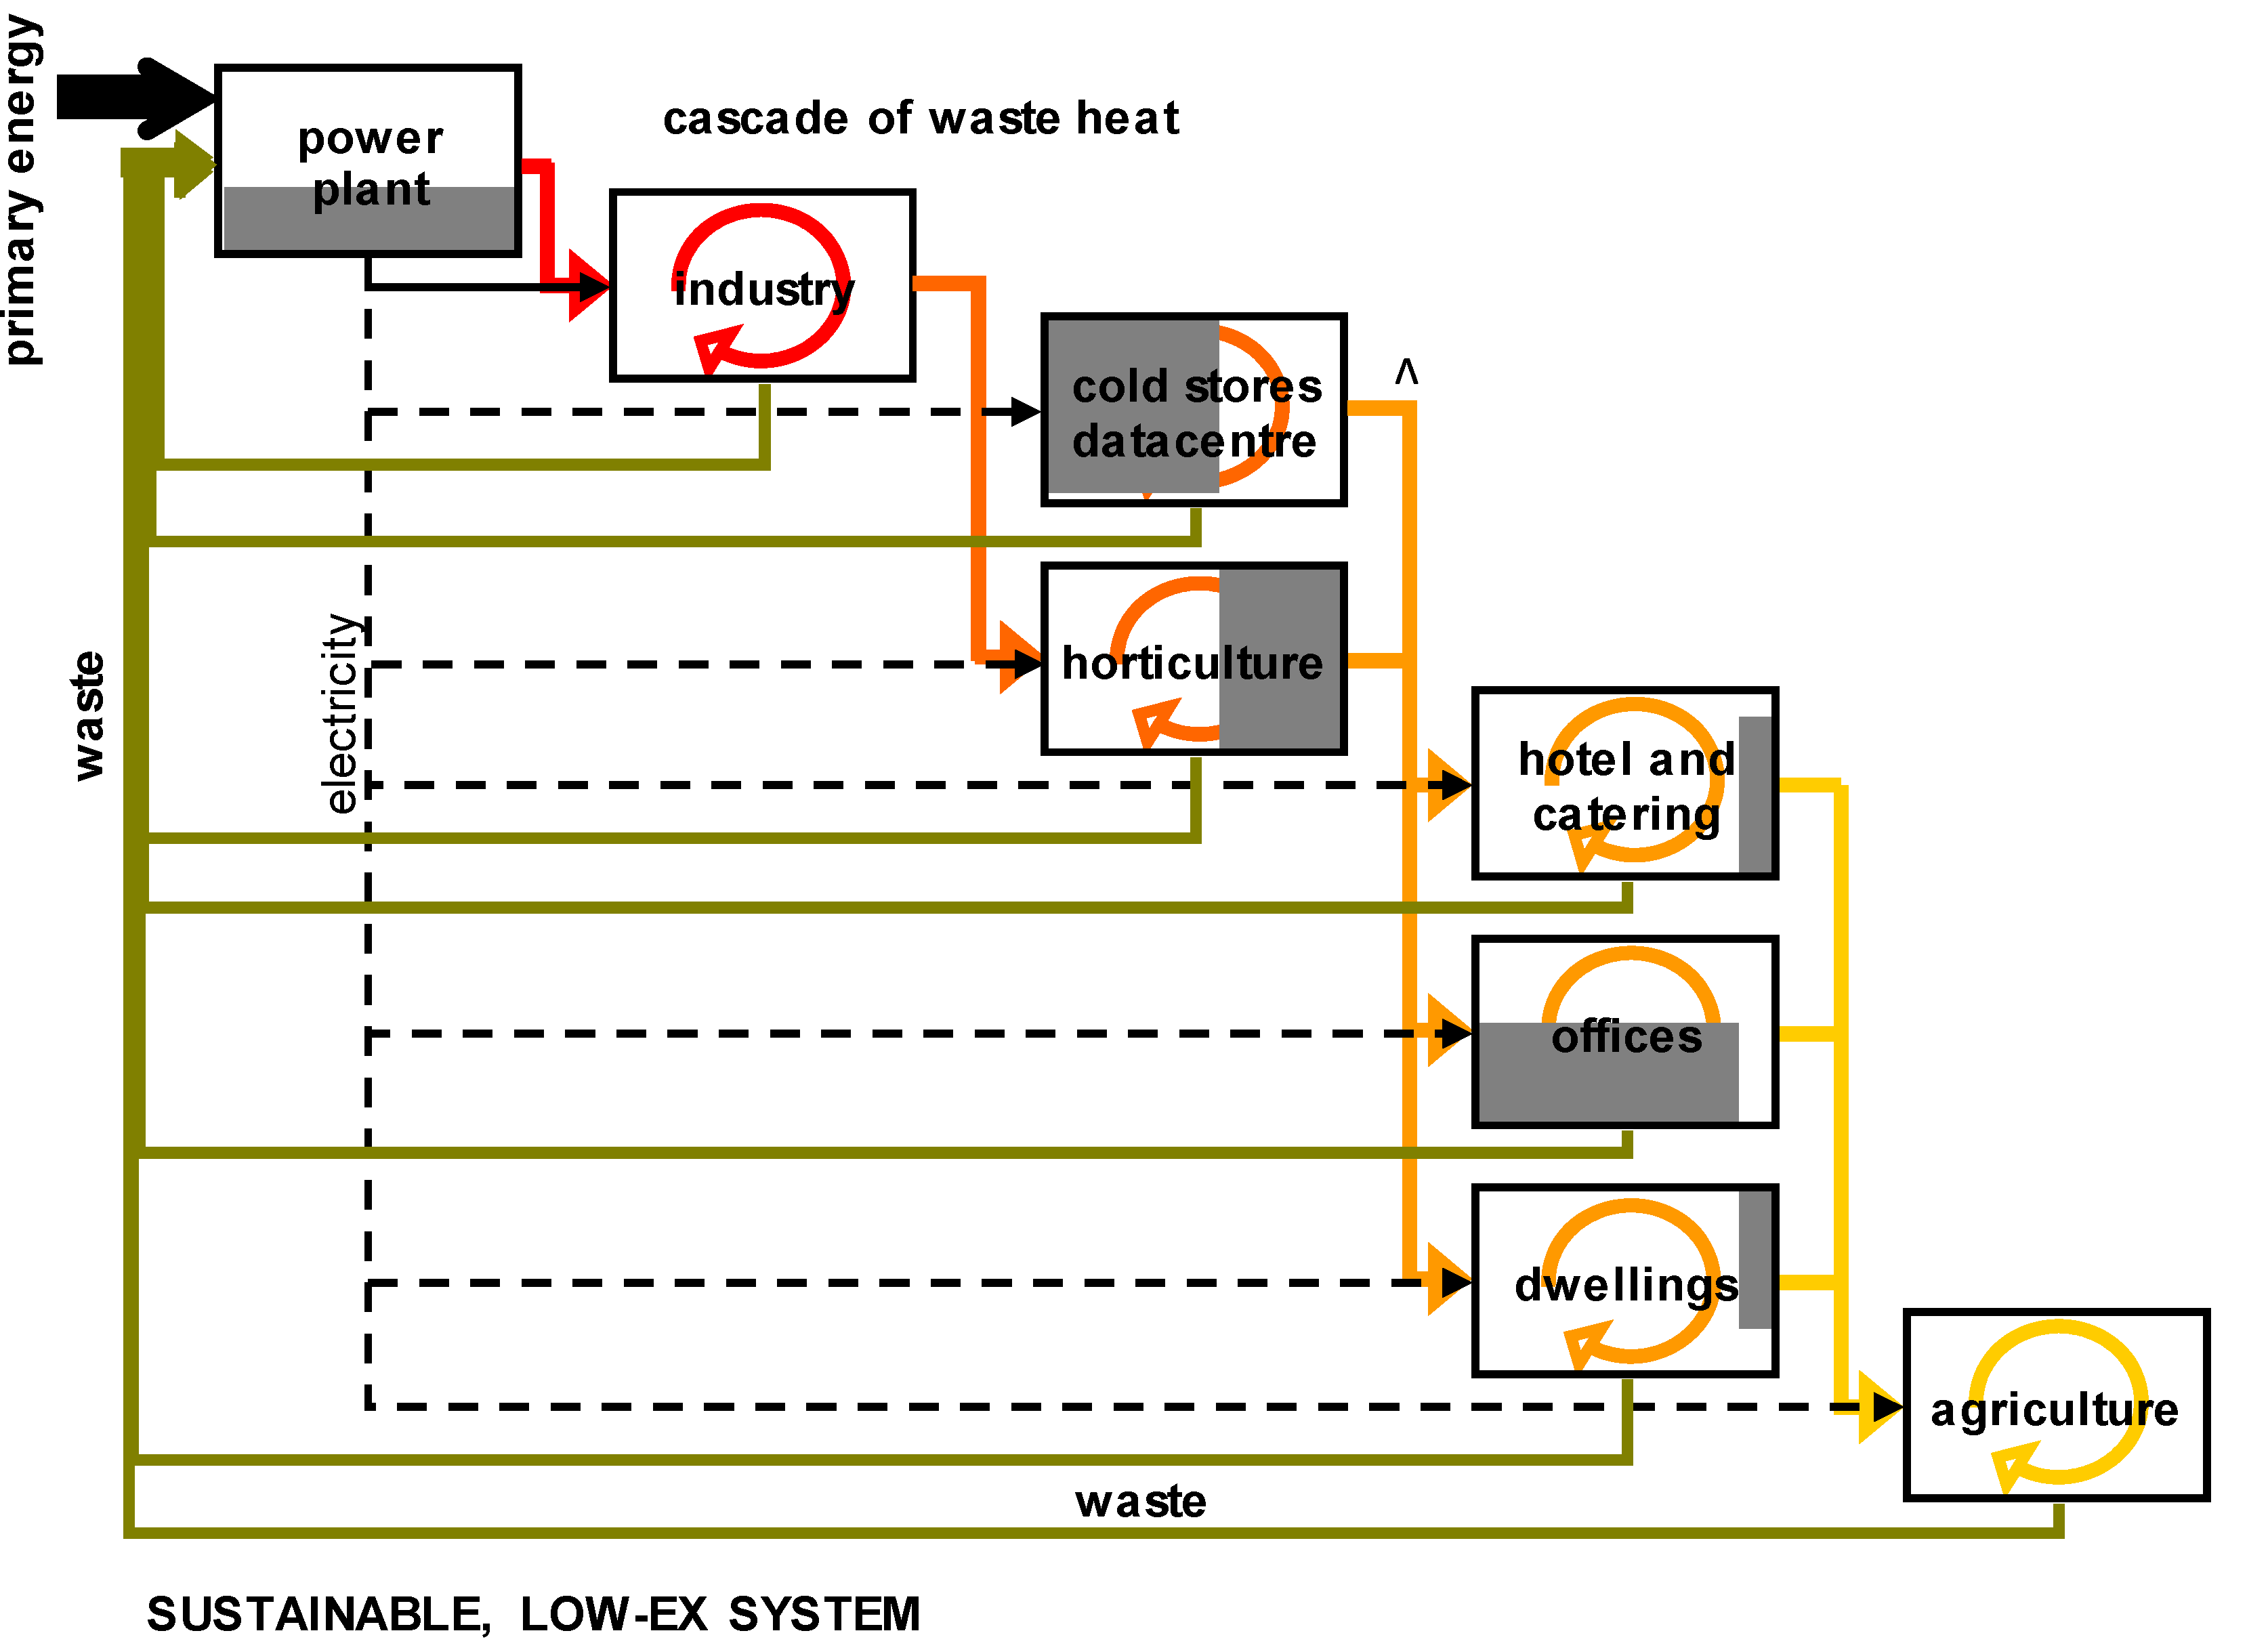
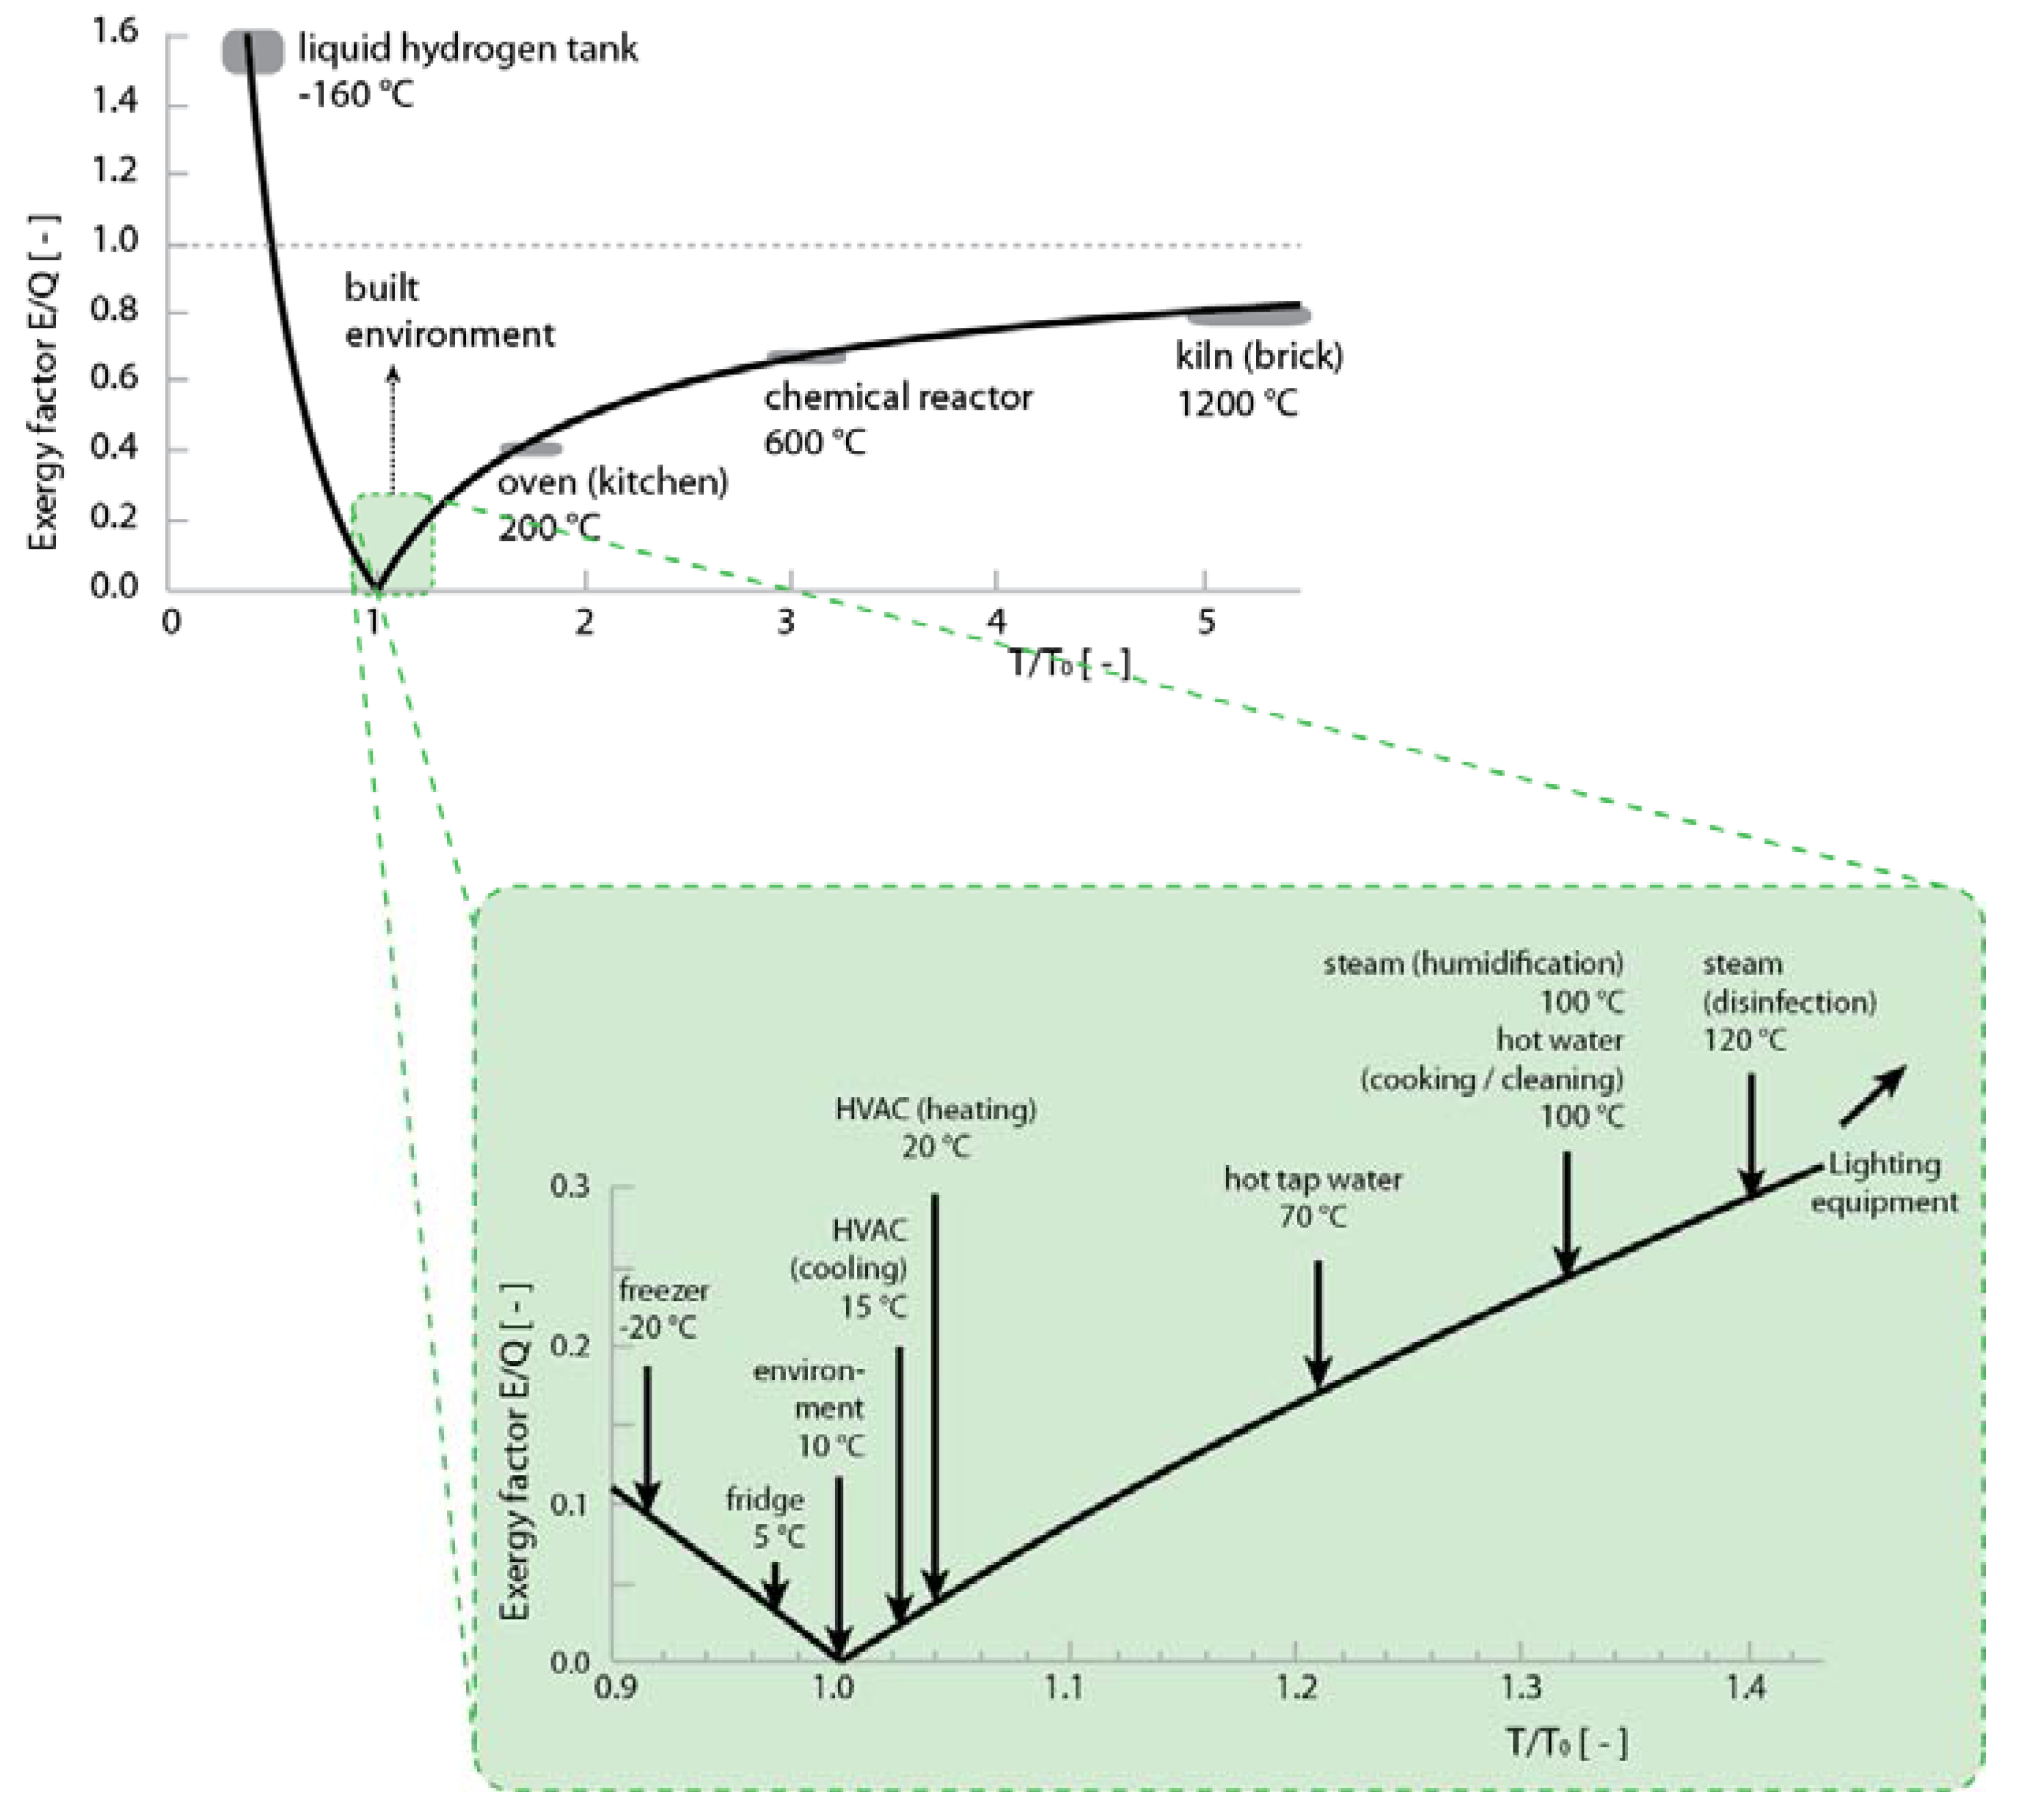
1.2. Energy Cascades and Low-ex Design
1.3. Missing Knowledge
2. Methodology
2.1. General Method
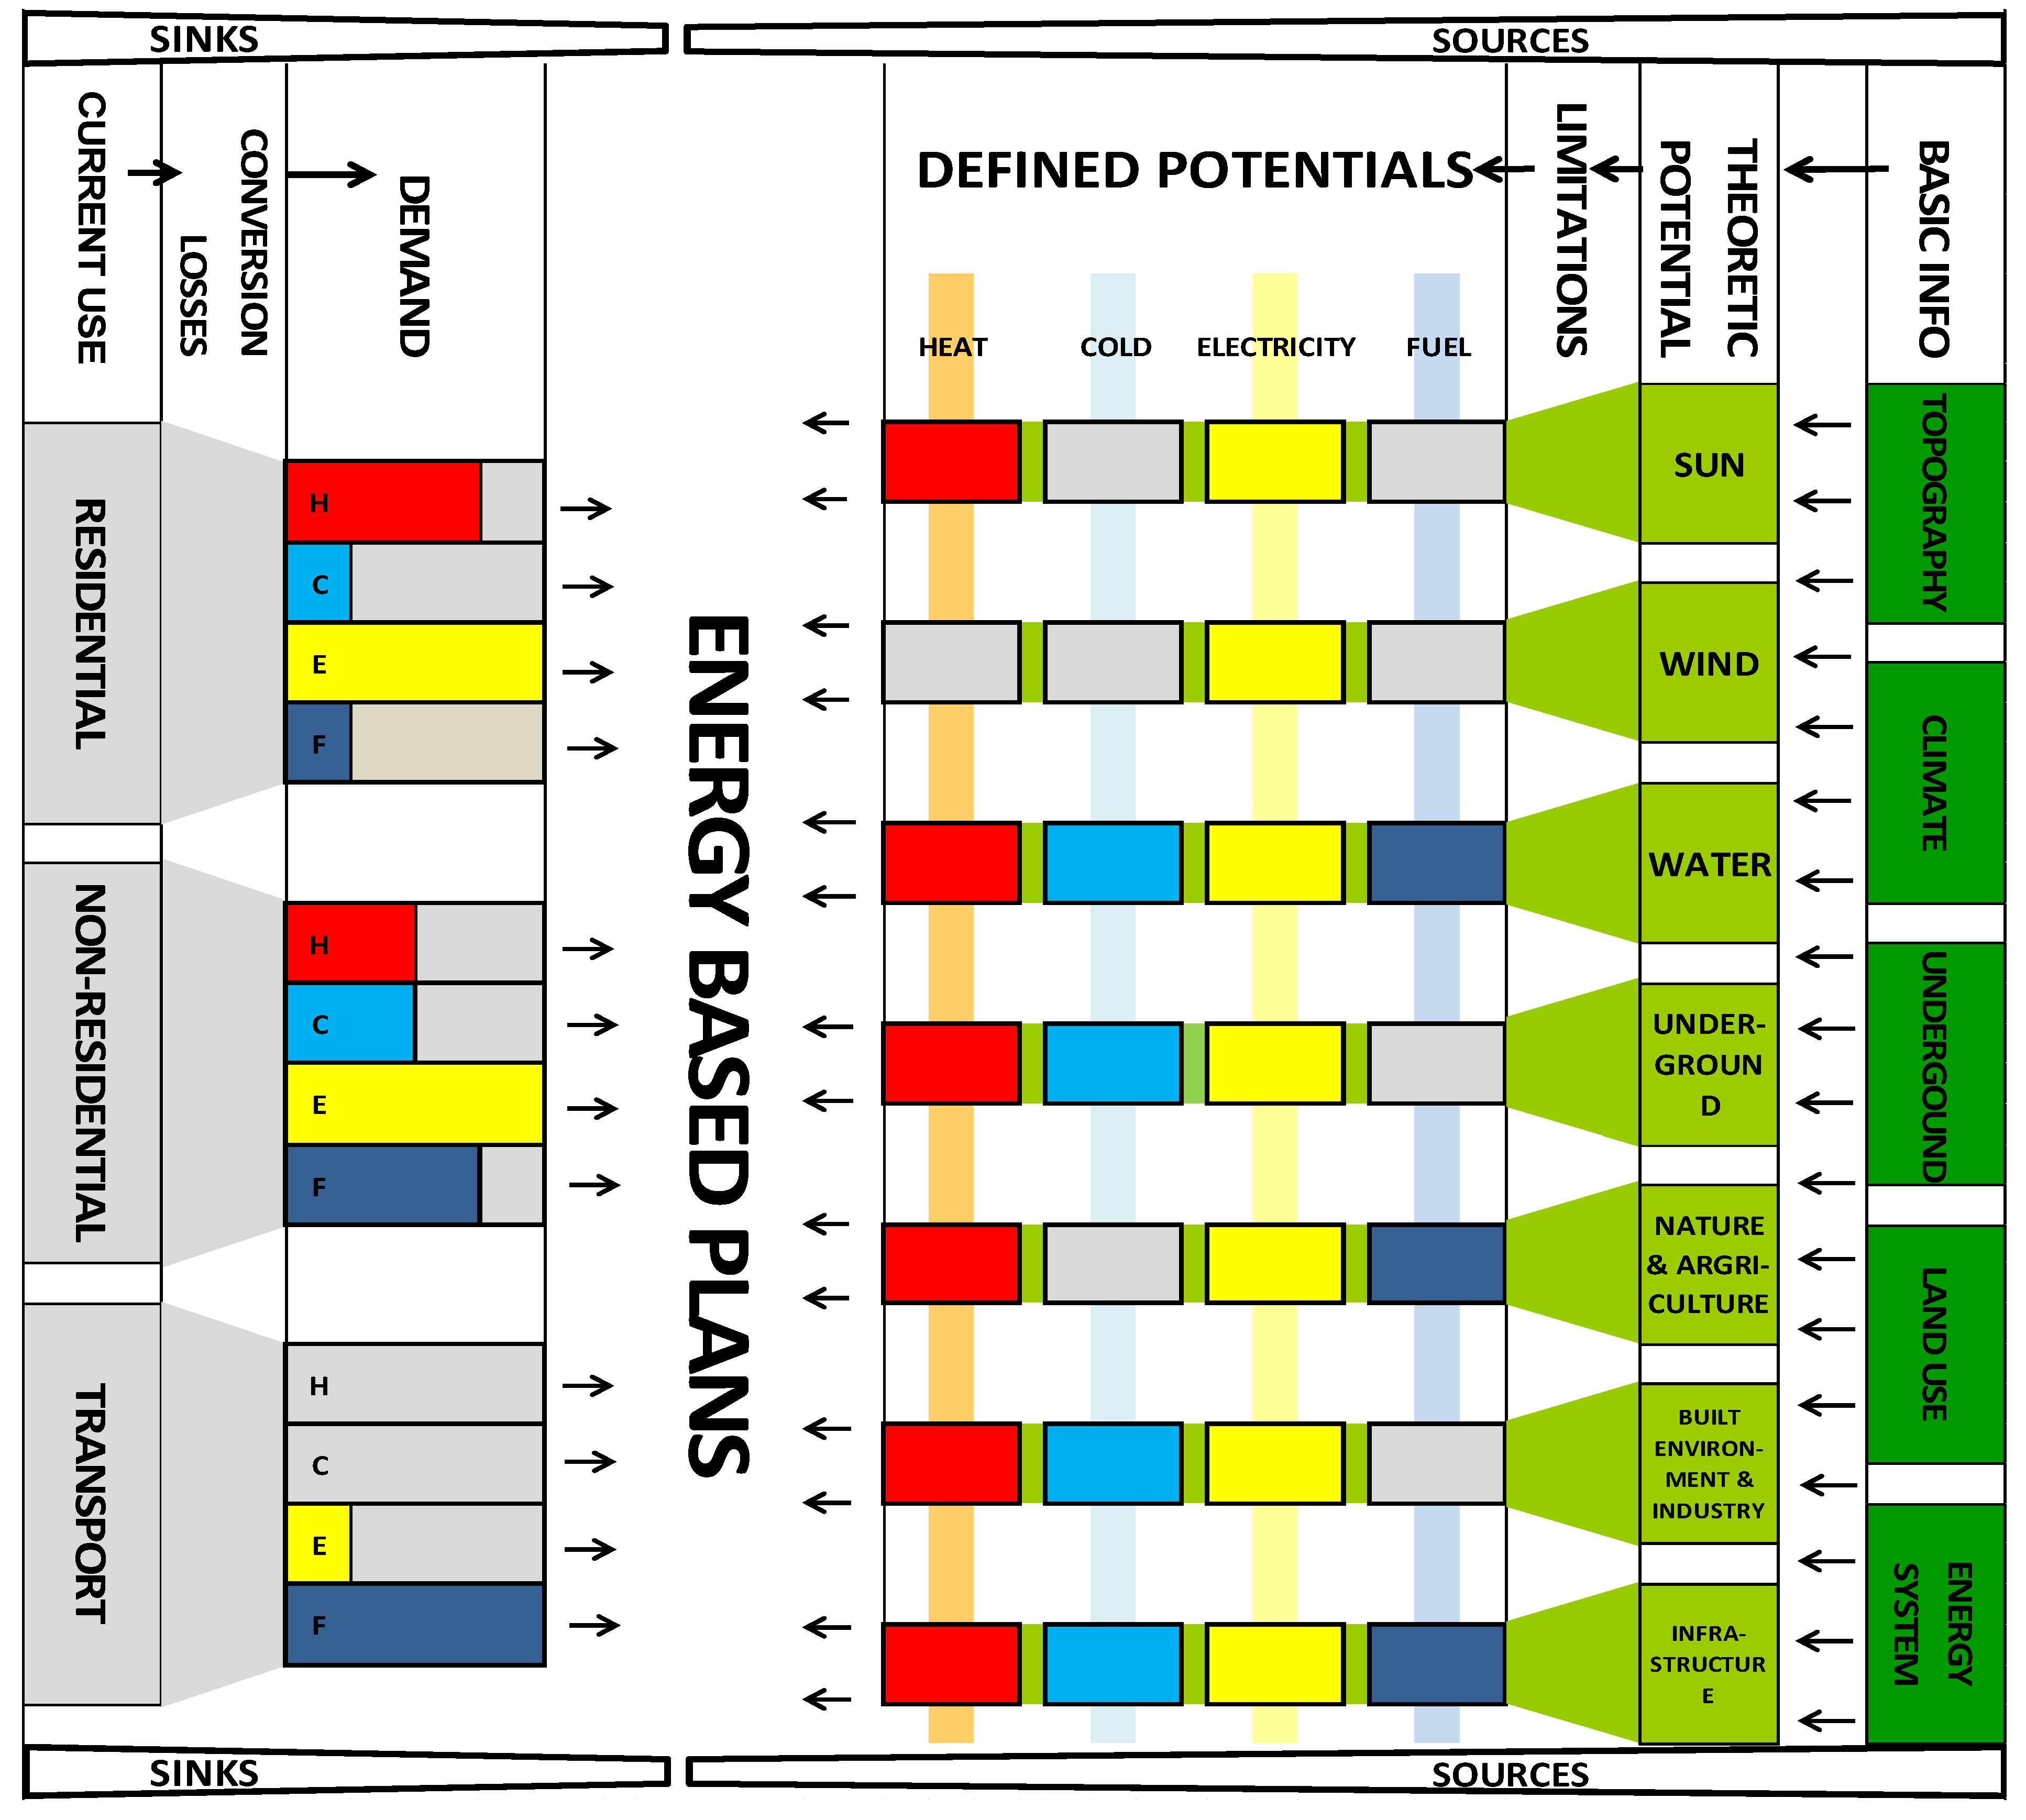
2.1.1. Input
2.1.2. Energy Conversion Techniques
2.1.3. Determining the Spatial Yield
2.1.4. Output
2.1.5. Visualisation
3. Case Studies
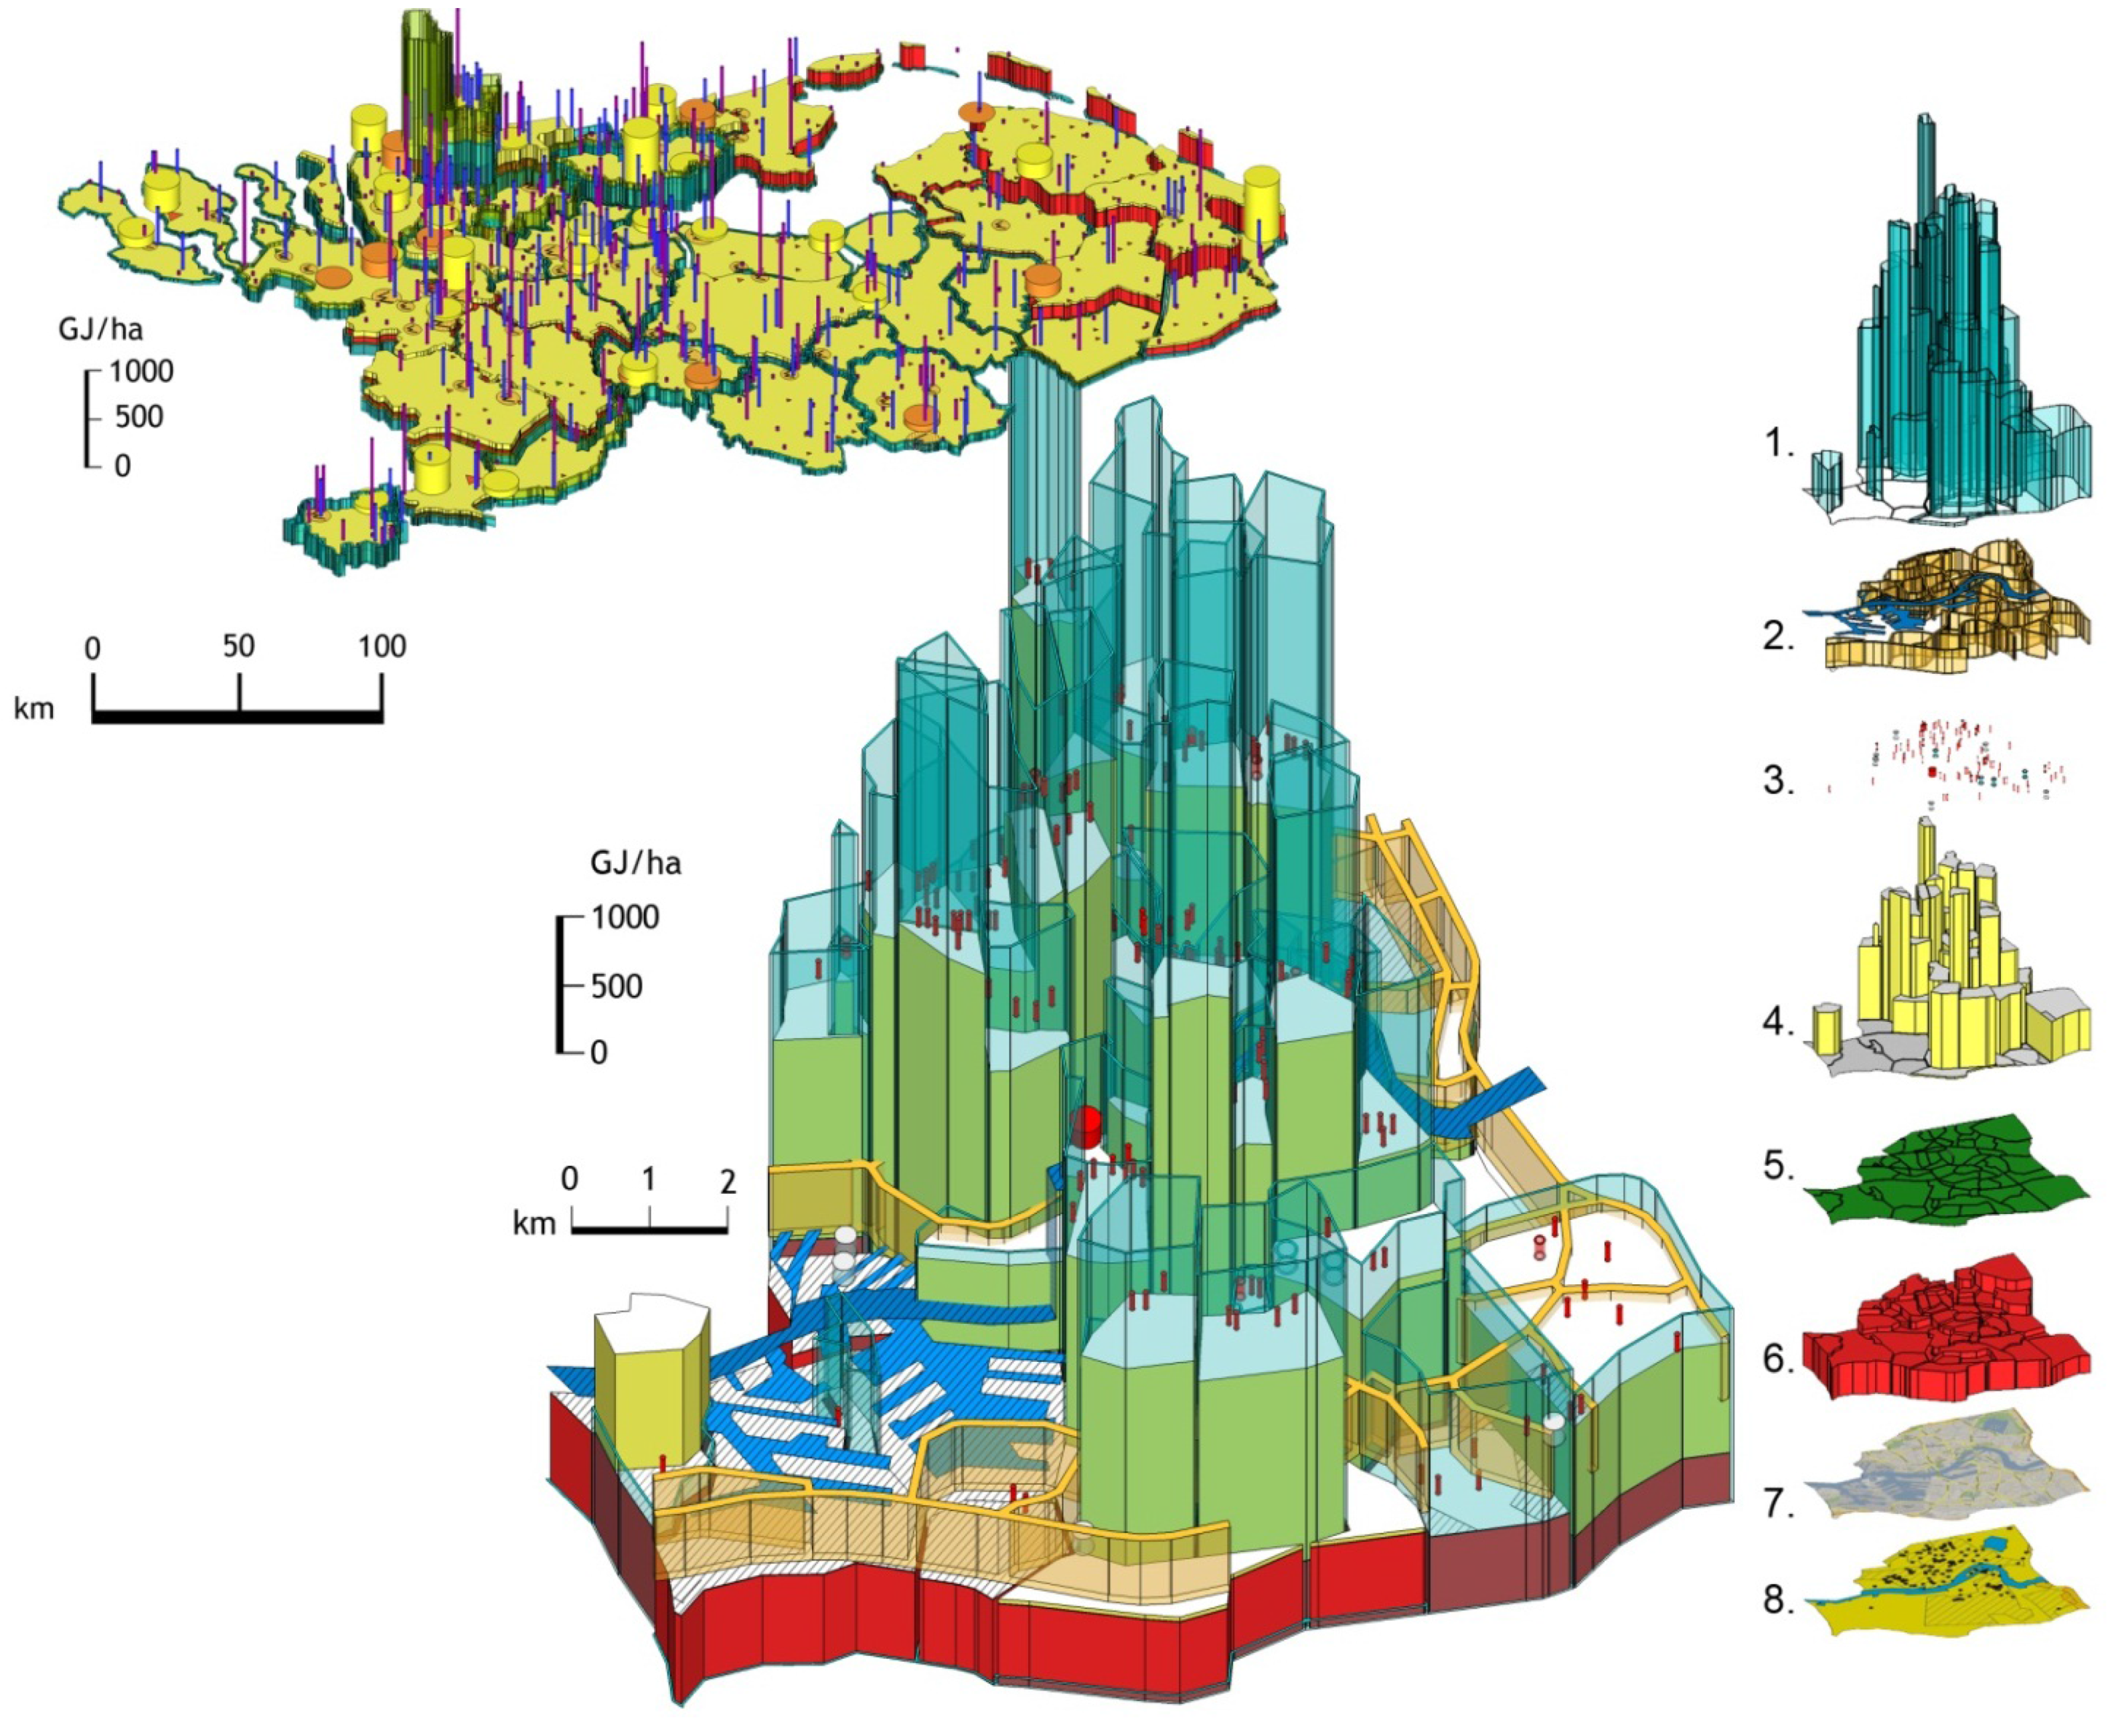
3.1. Heat Maps


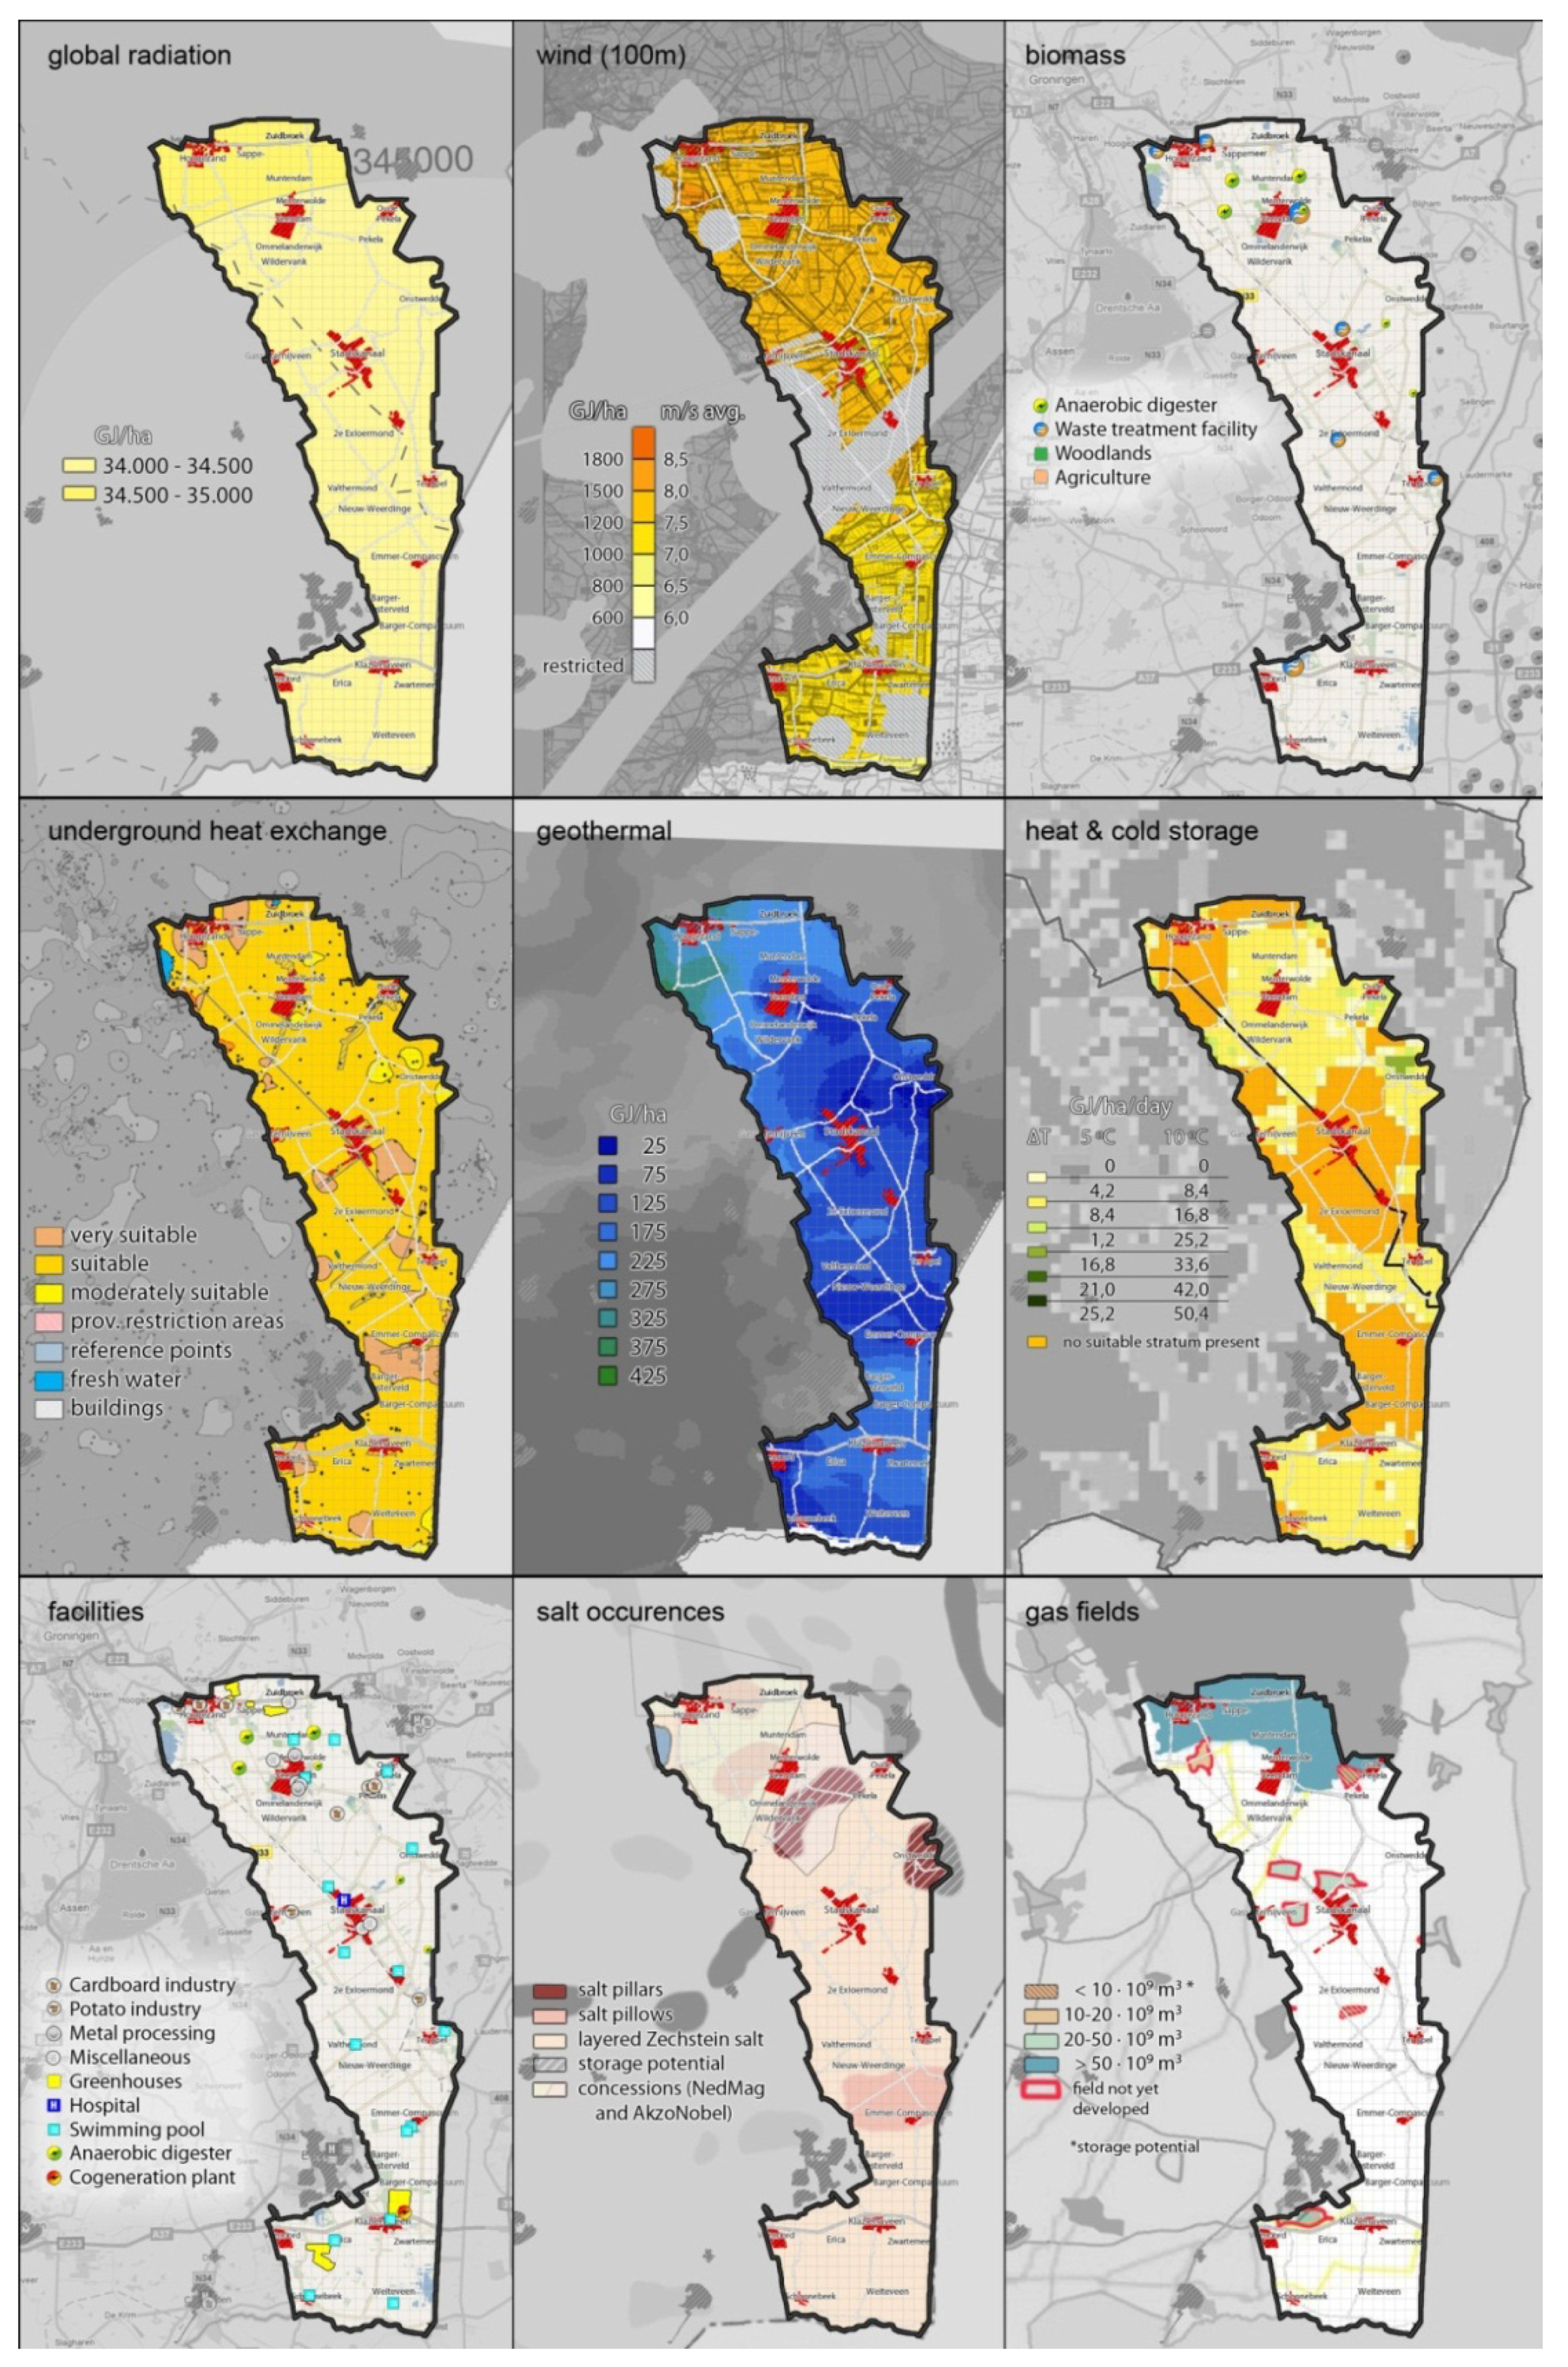
3.2. The Veenkoloniën

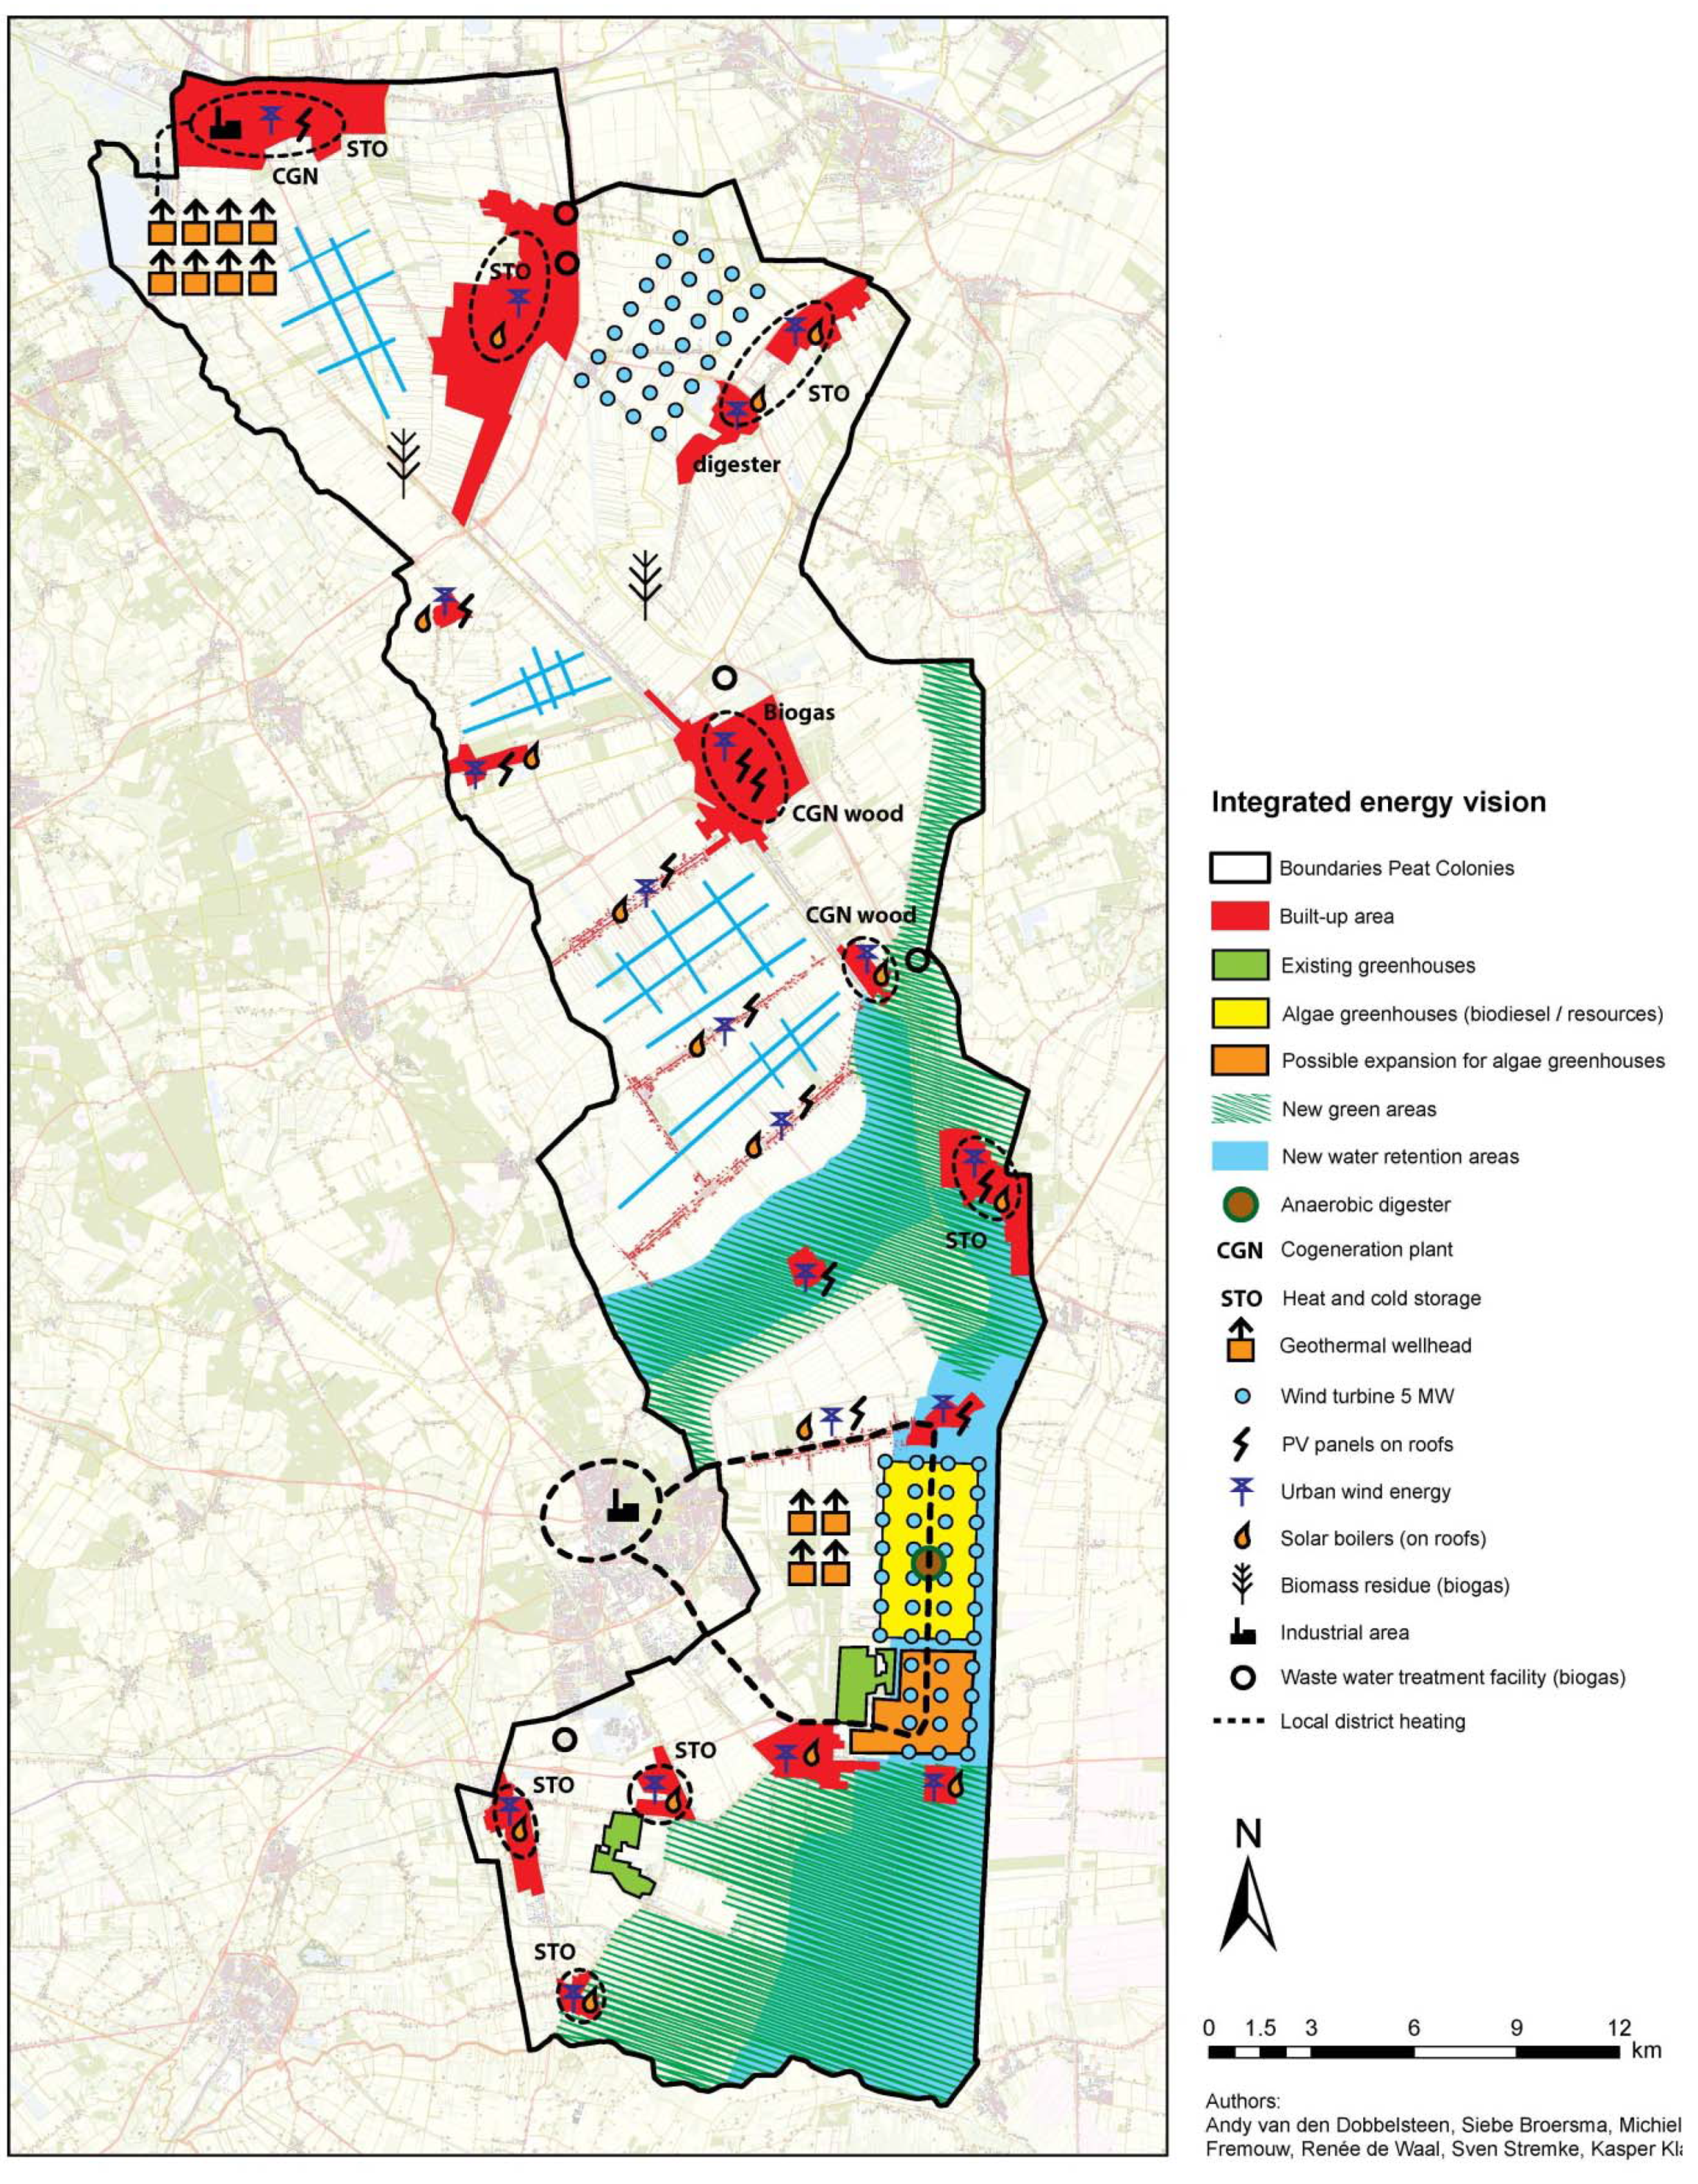
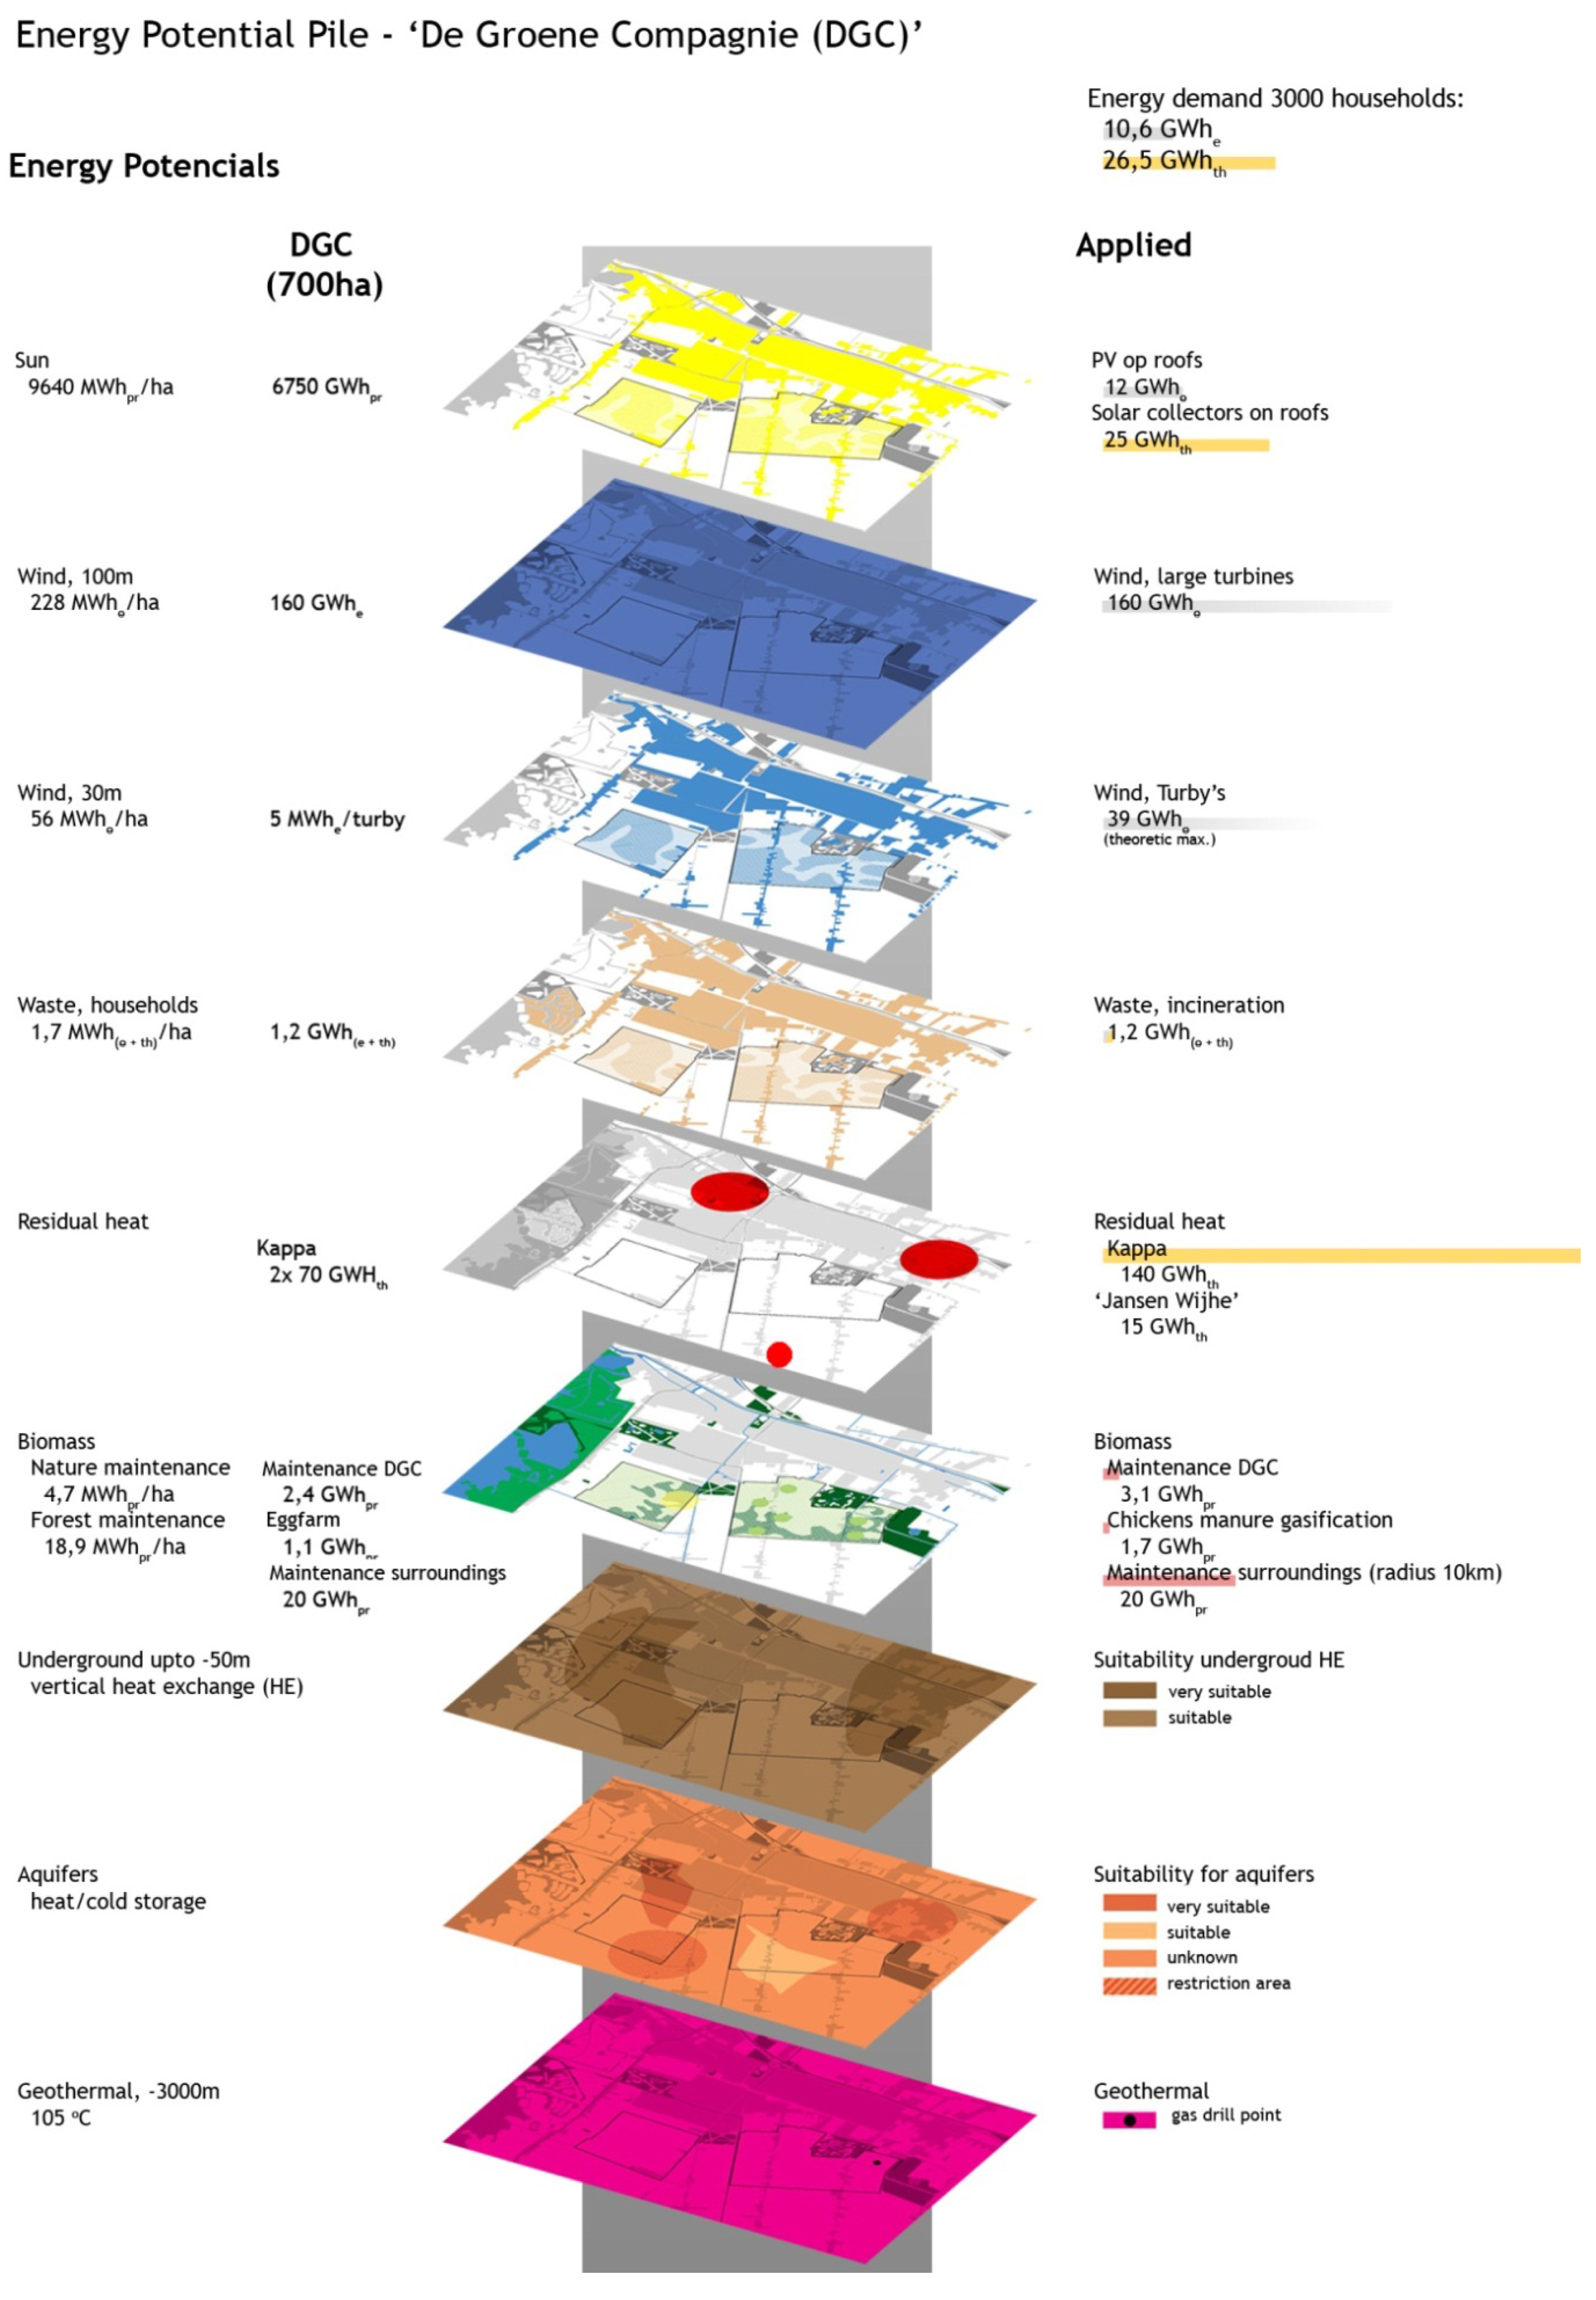
3.3. De Groene Compagnie
4. Discussion and Outlook
References and Notes
- van den Dobbelsteen, A.; Jansen, S; van Timmeren, A.; Roggema, R. Energy Potential Mapping –A systematic approach to sustainable regional planning based on climate change, local potentials and exergy. In Proceedings of the CIB. World Building Congress 2007, CIB/CSIR, Cape Town, South Africa, 2007.
- Dobbelsteen, A.; van den Broersma, S.; Stremke, S. Energy Potential Mapping for Energy-Producing Neighbourhoods. Int. J. Sustain. Build. Technol. Urban. Dev. 2011, 014, 170–176. [Google Scholar] [CrossRef]
- Broersma, S.; Fremouw, M.; van den Dobbelsteen, A. 'Heat Mapping the Netherlands - Laying the foundations for energy-based planning'. In Proceedings SB11 Helsinki World Sustainable Building Conference (CD-Rom), Helsinki, Finland, 18–21 October 2011.
- Cullen, J.; Allwood, J.M. Theoretical efficiency limits for energy conversion devices. Energy 2010, 35, 2059–2069. [Google Scholar] [CrossRef]
- MacKay, D. Sustainable Energy—Without the Hot Air, version 3.5.2; UIT: Cambridge, UK, 2008; pp. 203–213. [Google Scholar]
- International Energy Agency. Energy Technology Perspectives; OECD/IEA; O Paris, France, 2008; Volume 2, pp. 530–531. [Google Scholar]
- Shukuya, M. Exergy concept and its application to the built environment. Building Environment 2009, 44, 1545–1550. [Google Scholar] [CrossRef]
- Müller-Kraenner, M. Energy Security; UNESCO Publishing/Earthscan: London, UK, 2008; pp. xi, 3–6, 11–12. [Google Scholar]
- Intergovernmental Panel on Climate Change. Fourth Assessment Report: Climate Change 2007 (AR4), synthesis report, Topic 2: causes of change; Cambridge University Press: Cambridge, UK and New York, NY, USA, 2007; p. 2. [Google Scholar]
- van den Dobbelsteen, A. Energy Potential Mapping. In The Architecture Annual 2006–2007; Bekkering, H., ten Doeschate, A., Hauptmann, D., den Heijer, A., Knaack, U., van Manen, S., Eds.; 010 Publishers: Rotterdam, Netherlands, 2008; pp. 76–81. [Google Scholar]
- De Vaan, C. Wat is duurzaam wonen? Een onderlinge vergelijking tussen verschillende duurzaamheidsindicatoren. MSc thesis, Eindhoven University of Technology, Eindhoven, The Netherlands, 2007; p. 20. [Google Scholar]
- Gommans, L. Gebiedsgerichte energetische systeemoptimalisatie, een onderzoek naar de mogelijkheden voor een duurzame regionale energietransitie. PhD Thesis, Delft University of Technology, Delft, The Netherlands, 2012. [Google Scholar]
- Çomaklı, K.; Yüksel, B.; Çomaklı, Ö. Evaluation of energy and exergy losses in district heating network. J. Appl. Therm. Eng. 2004, 24, 1009–1017. [Google Scholar] [CrossRef]
- Stremke, S.; van den Dobbelsteen, A.; Koh, J. Exergy landscapes: exploration of second-law thinking towards sustainable landscape design. Int. J. Exergy 2011, 8, 148–174. [Google Scholar] [CrossRef]
- Sciubba, E.; Wall, G. A brief commented history of exergy from the beginnings to 2004. Int. J. Thermodyn. 2007, 10, 1–26. [Google Scholar]
- Valero, A.; Usón, S.; Torres, C. Application of thermoeconomics to industrial ecology. Entropy 2010, 12, 591–612. [Google Scholar] [CrossRef]
- Nakamura, S.; Kondo, Y. Waste Input-Output Analysis Concepts and Application to Industrial Ecology (Eco-Efficiency in Industry and Science); Springer: New York, NY, USA, 2009. [Google Scholar]
- Voivontas, D.; Assimacopoulos, D.; Mourelatos, A. Evaluation of renewable energy potential using a GIS decision support system. Int. J. Renew. Energy 1998, 13, 333–344. [Google Scholar] [CrossRef]
- Ramachandraa, T.; Shruthi, B. Spatial mapping of renewable energy potential. Renew. Sustain. Energy Rev. 2007, 11, 1460–1480. [Google Scholar] [CrossRef]
- Broersma, S.; Fremouw, M.; van den Dobbelsteen, A. Warmtekaarten – Nederlandse warmtekarakteristieken in kaart gebracht; (in Dutch). Delft University of Technology, Faculty of Architecture, 2010. [Google Scholar]
- Broersma, S.; Fremouw, M.; van den Dobbelsteen, A.; Stremke, S. Duurzame energiebeelden voor de Veenkoloniën; (in Dutch). Delft University of Technology, Faculty of Architecture: Delft, The Netherlands, 2011. [Google Scholar]
- Broersma, S.; van den Dobbelsteen, A.; van der Grinten, B.; Stremke, S. Energiepotenties Groningen - Energiepotentiestudie De Groene Compagnie; (in Dutch). Delft University of Technology, Faculty of Architecture: Delft, The Netherlands, 2009. [Google Scholar]
© 2013 by the authors; licensee MDPI, Basel, Switzerland. This article is an open access article distributed under the terms and conditions of the Creative Commons Attribution license (http://creativecommons.org/licenses/by/3.0/).
Share and Cite
Broersma, S.; Fremouw, M.; Dobbelsteen, A.V.d. Energy Potential Mapping: Visualising Energy Characteristics for the Exergetic Optimisation of the Built Environment. Entropy 2013, 15, 490-506. https://doi.org/10.3390/e15020490
Broersma S, Fremouw M, Dobbelsteen AVd. Energy Potential Mapping: Visualising Energy Characteristics for the Exergetic Optimisation of the Built Environment. Entropy. 2013; 15(2):490-506. https://doi.org/10.3390/e15020490
Chicago/Turabian StyleBroersma, Siebe, Michiel Fremouw, and Andy Van den Dobbelsteen. 2013. "Energy Potential Mapping: Visualising Energy Characteristics for the Exergetic Optimisation of the Built Environment" Entropy 15, no. 2: 490-506. https://doi.org/10.3390/e15020490