Article

Phase Composition of a CrMo0.5NbTa0.5TiZr High Entropy Alloy: Comparison of Experimental and Simulated Data

1
Air Force Research Laboratory, Materials and Manufacturing Directorate, Wright-Patterson AFB, OH 45433, USA
2
CompuTherm, LLC, 437 S. Yellowstone Dr., Madison, WI 53719, USA
*
Author to whom correspondence should be addressed.
Entropy 2013, 15(9), 3796-3809; https://doi.org/10.3390/e15093796
Submission received: 7 August 2013 / Revised: 2 September 2013 / Accepted: 9 September 2013 / Published: 12 September 2013
(This article belongs to the Special Issue High Entropy Alloys)

Abstract

:
Microstructure and phase composition of a CrMo0.5NbTa0.5TiZr high entropy alloy were studied in the as-solidified and heat treated conditions. In the as-solidified condition, the alloy consisted of two disordered BCC phases and an ordered cubic Laves phase. The BCC1 phase solidified in the form of dendrites enriched with Mo, Ta and Nb, and its volume fraction was 42%. The BCC2 and Laves phases solidified by the eutectic-type reaction, and their volume fractions were 27% and 31%, respectively. The BCC2 phase was enriched with Ti and Zr and the Laves phase was heavily enriched with Cr. After hot isostatic pressing at 1450 °C for 3 h, the BCC1 dendrites coagulated into round-shaped particles and their volume fraction increased to 67%. The volume fractions of the BCC2 and Laves phases decreased to 16% and 17%, respectively. After subsequent annealing at 1000 °C for 100 h, submicron-sized Laves particles precipitated inside the BCC1 phase, and the alloy consisted of 52% BCC1, 16% BCC2 and 32% Laves phases. Solidification and phase equilibrium simulations were conducted for the CrMo0.5NbTa0.5TiZr alloy using a thermodynamic database developed by CompuTherm LLC. Some discrepancies were found between the calculated and experimental results and the reasons for these discrepancies were discussed.
PACS Codes:
81.05.Bx; 81.30.-t

1. Introduction

A new, high-entropy alloying strategy for the development of high strength and high-temperature alloys has been recently proposed [1,2]. In contrast to conventional alloys, which are usually based upon one principal element, high entropy alloys (HEAs) are multi-principal element alloys (e.g., AlCoCrCuFeNi), containing five or more elements at near equiatomic concentrations. High configurational entropy of mixing of the alloying elements is believed to stabilize the more ductile disordered solid-solution phases relative to the brittle intermetallic phases. This strategy is based upon the simple thermodynamic argument that random solid-solutions of multi-principal alloying elements will have higher mixing entropies than intermetallic compounds, and will therefore tend to be more stable (i.e., they have a lower Gibbs free energy of formation, ΔG = ΔH − TΔS). Since the concept of HEAs was first introduced less than a decade ago, many studies have been carried out to verify this new strategy for alloy design and some HEAs having excellent engineering properties, such as high strength, good ductility, and resistance to corrosion, oxidation, and wear, have been developed [3,4,5,6,7,8].
The design and development of HEAs is built upon the fact that high configuration entropy makes a significant contribution to the phase stability of random mixed disordered solution phases. However, the stability of a phase is determined by its Gibbs energy, which includes contributions from both enthalpy and entropy. The microstructure of an alloy is therefore the result of stability competition among variety of phases in the system. Phase diagrams, which are referred as the road maps for materials design, provide essential information on the phase stability at a given alloy chemistry and temperature. While most of the binary phase diagrams and some ternary sections have been determined via experimental approach, and they can be found in the literatures and handbooks, this is not the case for multi-component systems. Determination of multi-component phase diagrams solely by experimental approaches is obviously not feasible due to the tremendous amount of work involved. In recent years, integration of the calculation of phase diagrams (CALPHAD) approach with key experiments has been used as an effective approach in the determination of complicated multi-component phase diagrams [9]. The essence of the CALPHAD approach is to develop a thermodynamic database for a multi-component system using experimental data from the constituent binaries and ternaries. This database is then used to calculate the phase stability of the multi-component system. The CALPHAD approach has been successfully applied to the design of traditional alloys based on one key element. In this case, the thermodynamic database needs to be validated only at the corner of the key element. At the same time, to successfully design HEAs that are based on several multiple principal elements, the multi-component thermodynamic database must be developed and validated for the entire composition space, which is a very challenging task.
In this work, a thorough analysis of the microstructure, phase composition and chemical composition of phases in a CrMo0.5NbTa0.5TiZr refractory high entropy alloy was conducted in as-solidified and annealed conditions. The experimental results were compared with the results of solidification and phase equilibrium simulations conducted for this alloy. The purpose of this study was to see if a currently available extensive thermodynamic database can predict the correct topology of phase equilibria in the multi-principal component alloy and to understand the limitations of this database for use in the design of HEAs.

2. Experimental and Modeling Approaches

The CrMo0.5NbTa0.5TiZr alloy was prepared by vacuum arc melting of the pure elements. The alloy composition is given in Table 1. The as-solidified alloy was hot isostatically pressed (HIPd) at 1450 °C for 3 h inside a chamber filled with high purity argon at the pressure of 207 MN/m2. After HIP, the alloy was cooled to 50 °C at the cooling rate of 20 °C/min with simultaneous pressure release. Details of the alloy preparation and HIP processing are described in [7]. To study the microstructure/phase stability, the HIPd alloy was annealed at 1000 °C for 100 h. The crystal structure was identified with the use of a Rigaku X-ray diffractometer, using Cu Kα radiation and the 2θ range of 5° to 140°. The microstructure and phases were analyzed with the use of a scanning electron microscope (SEM) Quanta 600F (FEI, North America NanoPort, Hillsboro, OR, USA) equipped with a backscatter electron (BSE), energy-dispersive X-ray spectroscopy (EDS), and electron backscatter diffraction (EBSD) detectors. The quantitative microstructure measurements were conducted using Fovea-Pro software by Reindeer Graphics, Inc. (Asheville, NC, USA).
Solidification simulations and phase equilibrium calculations were performed using the PandatTM [10] software and PanTi [11] thermodynamic database developed by CompuTherm LLC. PandatTM is a software package for the calculation of thermodynamic properties and phase equilibria of multi-component, multi-phase systems. PanTi database is a thermodynamic database for multi-component titanium alloys.
Table 1. Chemical composition (in at.%) of the CrMo0.5NbTa0.5TiZr alloy produced by vacuum arc melting.
ElementCrMoNbTaTiZr
Composition18.3910.0421.8411.8619.4018.48

3. Results

3.1. Experimental Results

3.1.1. Microstructure in the As-Solidified Condition

In the as-solidified condition, the alloy has a typical dendritic structure (Figure 1a). In the BSE mode, the dendrites are bright and inter-dendritic regions are dark. The average size of the dendrite cells measured on 2D cross-sections is dD = 34 ± 3 µm. Higher magnification images reveal the presence of two phases, with different Z contrasts, in the inter-dendritic regions (Figure 1b). One phase has a grey color and is present in the form of continuous channels between the dendrites. Another phase is noticeably darker and is present in the form of round-shaped particles inside the channels. The average particle size is dP = 3.8 ± 0.4 μm. The different Z contrast is apparently due to different element composition of these constituents. The Z contrast also reveals the element segregation inside the dendrites (Figure 1b). The EDS analysis shows that the dendrites are enriched with Mo, Nb and Ta, the inter-dendritic channels are enriched with Ti and Zr, and the dark particles are heavily enriched with Cr (Figure 2, Table 2). X-ray diffraction of the solidified alloy confirms the presence of three phases (Figure 3a). The dendrites are identified as a body centered cubic (BCC1) phase, with the lattice parameter a = 325.5 ± 0.1 pm, the inter-dendritic channels are the BCC2 phase, with a = 338.6 ± 0.4 pm, and the particles inside the channels are the cubic Laves phase, with a = 733.4 ± 0.2 pm. The volume fractions of these phases are 42 ± 3%, 27 ± 2% and 31 ± 2%, respectively. The morphologies and the spatial distributions of the phases suggest that the BCC1 phase solidified first in the form of dendrites, while the BCC2 and Laves phases (inter-dendritic regions) were formed during the last stages of solidification, possibly due to eutectic reaction.
Figure 1. BSE images of the microstructure of the CrMo0.5NbTa0.5TiZr high entropy alloy in the as-solidified condition: (a) dendritic structure, (b) inter-dendritic region consisting of the BCC2 and Laves phases.
Entropy 15 03796 g001
Figure 2. Segregation of the alloying elements in different phases of the CrMo0.5NbTa0.5TiZr alloy: (a) Cr (Laves), (b) Ta (BCC1), (c) Ti (BCC2) and (d) Zr (BCC2 and Laves). The brightness increases with an increase in the element concentration.
Entropy 15 03796 g002aEntropy 15 03796 g002b
Table 2. Volume fractions, Vf, and compositions (in at.%) of the phases in the as-solidified CrMo0.5NbTa0.5TiZr alloy. Experimental data.
PhaseVfCrMoNbTaTiZr
BCC10.428.920.430.814.916.09.0
BCC20.276.71.219.82.830.239.3
Laves0.3136.98.113.54.810.726.0
Figure 3. X-ray diffraction patterns of the CrMo0.5NbTa0.5TiZr alloy in (a) as-solidified, (b) HIPd at 1450 °C, 207 MPa for 3 h and (c) annealed at 1000 °C for 100 h conditions.
Entropy 15 03796 g003

3.1.2. Microstructure of the Heat Treated Alloy

Typical microstructure of the alloy after HIP at 1450 °C for 3 h is shown in Figure 4. After the HIP processing the bright BCC1 dendrite particles become coarser and more round relative to the as-solidified condition. The average equivalent diameter of these particles is 75 μm and the average aspect ratio is 1.54. The particle diameter follows a log-normal distribution (Figure 5). The BCC1 particles have a shell with a darker contrast due to reduced amounts of Cr and Mo and enrichment with Ti, relative to the particle core (Figure 4b). The BCC2 and Laves phases are still present between the BCC1 particles, inside inter-dendritic regions. The average size of the Laves particles increased to dP = 8.0 ± 0.4 μm. The volume fractions of the BCC1, BCC2 and Laves phases are 67%, 16% and 17%, respectively. Due to the reduced volume fractions of the BCC2 and Laves phases (relative to the as-solidified condition), the X-ray Braggs peak intensities from these phases decrease (Figure 3b). The lattice parameter of the BCC1 phase slightly decreases (a = 324.8 ± 0.2 pm), BCC2 phase increases (a = 341.0 ± 1.0 pm) and Laves phase increases (a = 740.0 ± 0.5 pm) after HIP. Considerable broadening of the Braggs peaks after HIP processing may indicate HIP-induced super-saturation of the BCC1 phase with alloying elements.
Annealing at 1000 °C for 100 h does not change the size and morphology of the BCC1 phase particles. However, precipitation of fine Laves particles occurs inside the BCC1 phase (Figure 6). These particles are round-shaped, their average size is ~0.3–0.4 μm and they consume ~22% of the BCC1 particles. Together with these particles, the volume fraction of the Laves phase increases to ~32% and that of the BCC1 phase decreases to ~52%. The proportion of the BCC2 and Laves phases in the regions between the BCC1 particles does not change after annealing and the volume fraction of the BCC2 phase is ~16%. The X-ray diffraction pattern of the annealed alloy is shown in Figure 3c. The Braggs peaks from the BCC1 phase become sharper, likely due to equilibration of the composition of this phase, and the intensities of the peaks from the Laves phase increase (relative to the HIP condition).
Figure 4. BSE images of the microstructure of the CrMo0.5NbTa0.5TiZr high entropy alloy after HIP at 1450 °C for 3 h.
Entropy 15 03796 g004
Figure 5. Distribution of the BCC1 particles by logarithm of the equivalent diameter (in μm). HIPd condition.
Entropy 15 03796 g005
The compositions of the different phases, per EDS analysis, after HIP processing and after annealing at 1000 °C are shown in Table 3 and Table 4, respectively. In the HIP condition, the BCC1 phase particles are enriched with Mo, Nb and Ta and depleted of Cr and Zr. Similar to the as-solidified condition, the BCC2 phase is enriched with Ti and Zr; and the Laves phase is enriched with Cr. After annealing at 1000 °C for 100 h, the BCC1 phase becomes more depleted of Cr and also loses ~4% of Ta, due to precipitation of fine Laves particles inside this phase. The compositions of the BCC2 and Laves phases inside inter-dendritic regions are not affected by the annealing. The newly formed fine Laves particles have the intermediate composition between that of BCC1 (inside which they precipitate) and that of originally present Laves particles (see Table 4).
Figure 6. BSE image of the microstructure of the CrMo0.5NbTa0.5TiZr alloy after annealing at 1000 °C for 100 h.
Entropy 15 03796 g006
Table 3. Volume fractions, Vf, and compositions (in at.%) of the phases in the CrMo0.5NbTa0.5TiZr alloy after HIPing at 1450 °C for 3 h. Experimental data.
PhaseVfCrMoNbTaTiZr
BCC10.6713.214.326.816.819.19.8
Shell6.79.927.014.128.114.2
BCC20.163.10.618.73.833.240.6
Laves0.1740.76.312.17.010.823.1
Table 4. Volume fractions, Vf, and compositions (in at.%) of the phases in the CrMo0.5NbTa0.5TiZr alloy after annealing at 1000 °C for 100 h.
PhaseVfCrMoNbTaTiZr
BCC10.528.115.730.312.822.210.9
BCC20.162.11.120.43.630.542.2
Laves*0.1738.57.912.15.410.425.7
Laves**0.1522.413.219.49.915.219.9
*Particles adjacent to the BCC2 phase; **Particles formed inside the BCC1 phase.

3.2. Modeling

3.2.1. Solidification Simulation (Scheil Model)

Solidification simulation was performed for the CrMo0.5NbTa0.5TiZr alloy using Scheil model. The Scheil simulation is used to reasonably describe the casting process, and it assumes infinitely fast diffusion in liquid phase, no diffusion in solid phases, and equilibrium condition at the liquid/solid interface. Figure 7a shows the fraction of solid as a function of temperature, and Figure 7b shows the fraction of each phase as a function of temperature during solidification. The simulation indicates that solidification starts by formation of a BCC phase. Only a single BCC1 phase and liquid are present when temperature decreases from 2604 °C to 1391 °C (Figure 7). In the temperature range of 1391–1337 °C, an eutectic-type reaction, Liquid → BCC2 + Laves, occurs.
Figure 7. (a) The fraction of solid and (b) fractions of different phases as a function of temperature during solidification of the CrMo0.5NbTa0.5TiZr alloy. Simulated results.
Entropy 15 03796 g007
The concentration of the alloying elements in the BCC phase greatly depends on the temperature range where the BCC phase forms (Figure 8). About 17% of the BCC phase (likely the core regions of the dendrites), which solidified at temperatures from 2604 °C to ~2050 °C, are enriched with Cr, Mo and Ti and depleted by Nb, Ta and Zr. About 66% of this phase, solidified at temperatures from 2050 °C to 1391 °C, are enriched with Nb and Zr and depleted by Mo. Finally, the BCC2 phase formed during the eutectic reaction is heavily enriched with Zr and depleted of Mo and Ti. The Laves phase, formed during the eutectic reaction is essentially a two-component phase consisting of Cr and Zr, with a small (~0.8%) amount of Ti. Its composition is almost temperature-independent.
The average concentration cij of element i in a phase j after solidification was calculated using the following equation:
c i j = T j 1 T j 2 c i j ( T ) v ˙ j ( T ) d T
where v ˙ j ( T ) d T is the volume fraction of the phase j solidified in the temperature range (T+dT) and cij(T) is the concentration of element i in the phase j formed at temperature T. The calculated average concentrations of the BCC1, BCC2 and Laves phases after Scheil solidification are shown in Table 5. According to this simulated data, the alloy consists of 83% BCC1, 12% BCC2 and 5% Laves phases. The composition of the BCC1 phase is close to the average alloy composition, while the BCC2 phase is heavily enriched with Zr and depleted of Mo. The Laves phase is essentially a two-component Cr2Zr phase containing a small amount of Ti.
Figure 8. Calculated elemental concentrations (a) in the liquid phase and (b) in the BCC phase formed at different temperatures during solidification of the CrMo0.5NbTa0.5TiZr alloy (Scheil simulation).
Entropy 15 03796 g008
Table 5. Volume fractions, Vf, and average compositions (in at.%) of the phases formed during non-equilibrium solidification. Scheil simulation.
PhaseVfCrMoNbTaTiZr
BCC10.8317.511.821.110.922.016.7
BCC20.1217.80.220.57.712.641.2
Laves0.0565.70.00.00.00.833.5

3.2.2. Simulation of Equilibrium Phases

The simulated equilibrium diagram of the CrMo0.5NbTa0.5TiZr alloy is shown in Figure 9. According to this diagram, a single-phase BCC1 region is present at temperatures from 1270 °C to 1640 °C, i.e., just below the solvus temperature, the Laves phase forms from the BCC1 phase by a solid-state reaction at temperatures below 1270 °C, and the BCC2 phase forms from the BCC1 phase at temperatures below 643 °C, without noticeable change in the fraction of the Laves phase. Therefore, the thermodynamic simulation suggests that this alloy in the equilibrium condition does not have eutectic reaction, and the BCC2 and Laves phases precipitate from the BCC1 phase independently. There is a wide temperature range, from 643 °C to 1270 °C, where two phases, BCC1 and Laves, are present and the BCC2 phase is absent. The volume fractions and the compositions of the equilibrium phases at two temperatures, 1000 °C and 600 °C are given in Table 6 and Table 7, respectively. T = 1000°C corresponds to the annealing temperature and T = 600 °C corresponds to the condition at which the calculated and experimentally determined volume fractions of the phases are approximately equal. Only two phases, BCC1 and Laves, at the volume fractions of 80% and 20%, respectively, are present at 1000 °C, and three phases, BCC1, BCC2 and Laves, at the volume fractions of 52%, 19% and 29%, are present at 600 °C. At both temperatures, the Laves phase is essentially binary, Cr2Zr phase.
Figure 9. Equilibrium phase diagram of the CrMo0.5NbTa0.5TiZr high entropy alloy, in accord to thermodynamic analysis using PanTi database.
Entropy 15 03796 g009
Table 6. Volume fractions, Vf, and compositions (in at.%) of the equilibrium phases at 1000 °C. Thermodynamic simulation.
PhaseVfCrMoNbTaTiZr
BCC10.808.412.525.012.524.816.8
Laves0.2066.50.00.00.00.633.0
Table 7. Volume fractions, Vf, and compositions (in at.%) of the equilibrium phases at 600 °C. Thermodynamic simulation.
PhaseVfCrMoNbTaTiZr
BCC10.520.2814.132.517.125.410.6
BCC20.191.214.417.26.236.224.8
Laves0.2966.60.00.00.00.033.4

4. Discussion

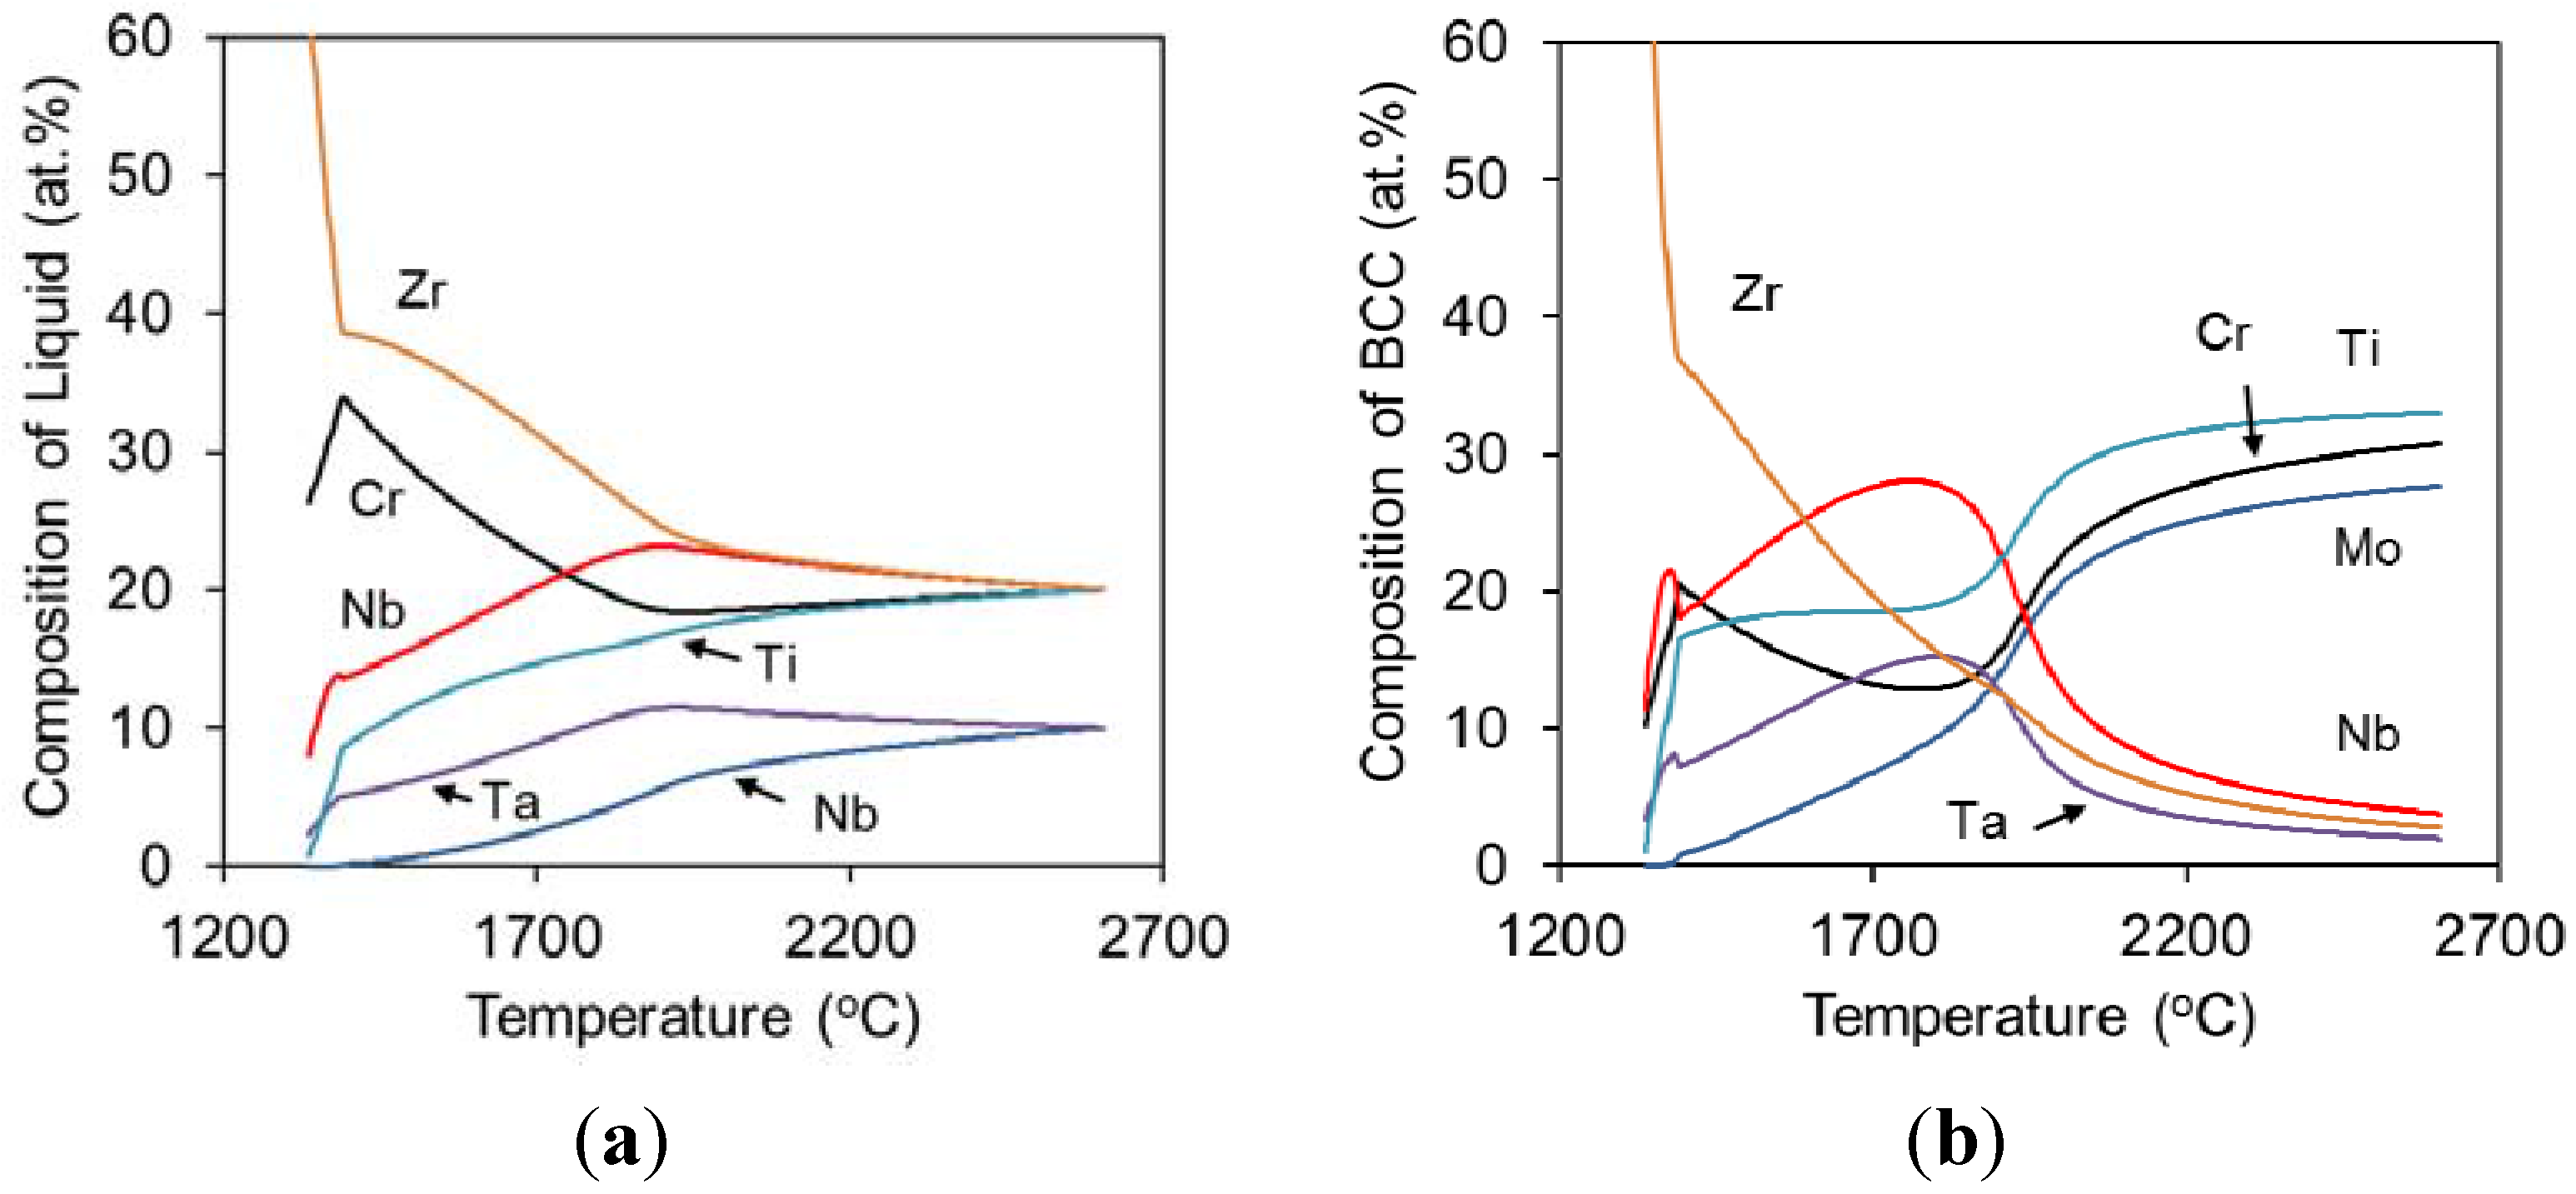
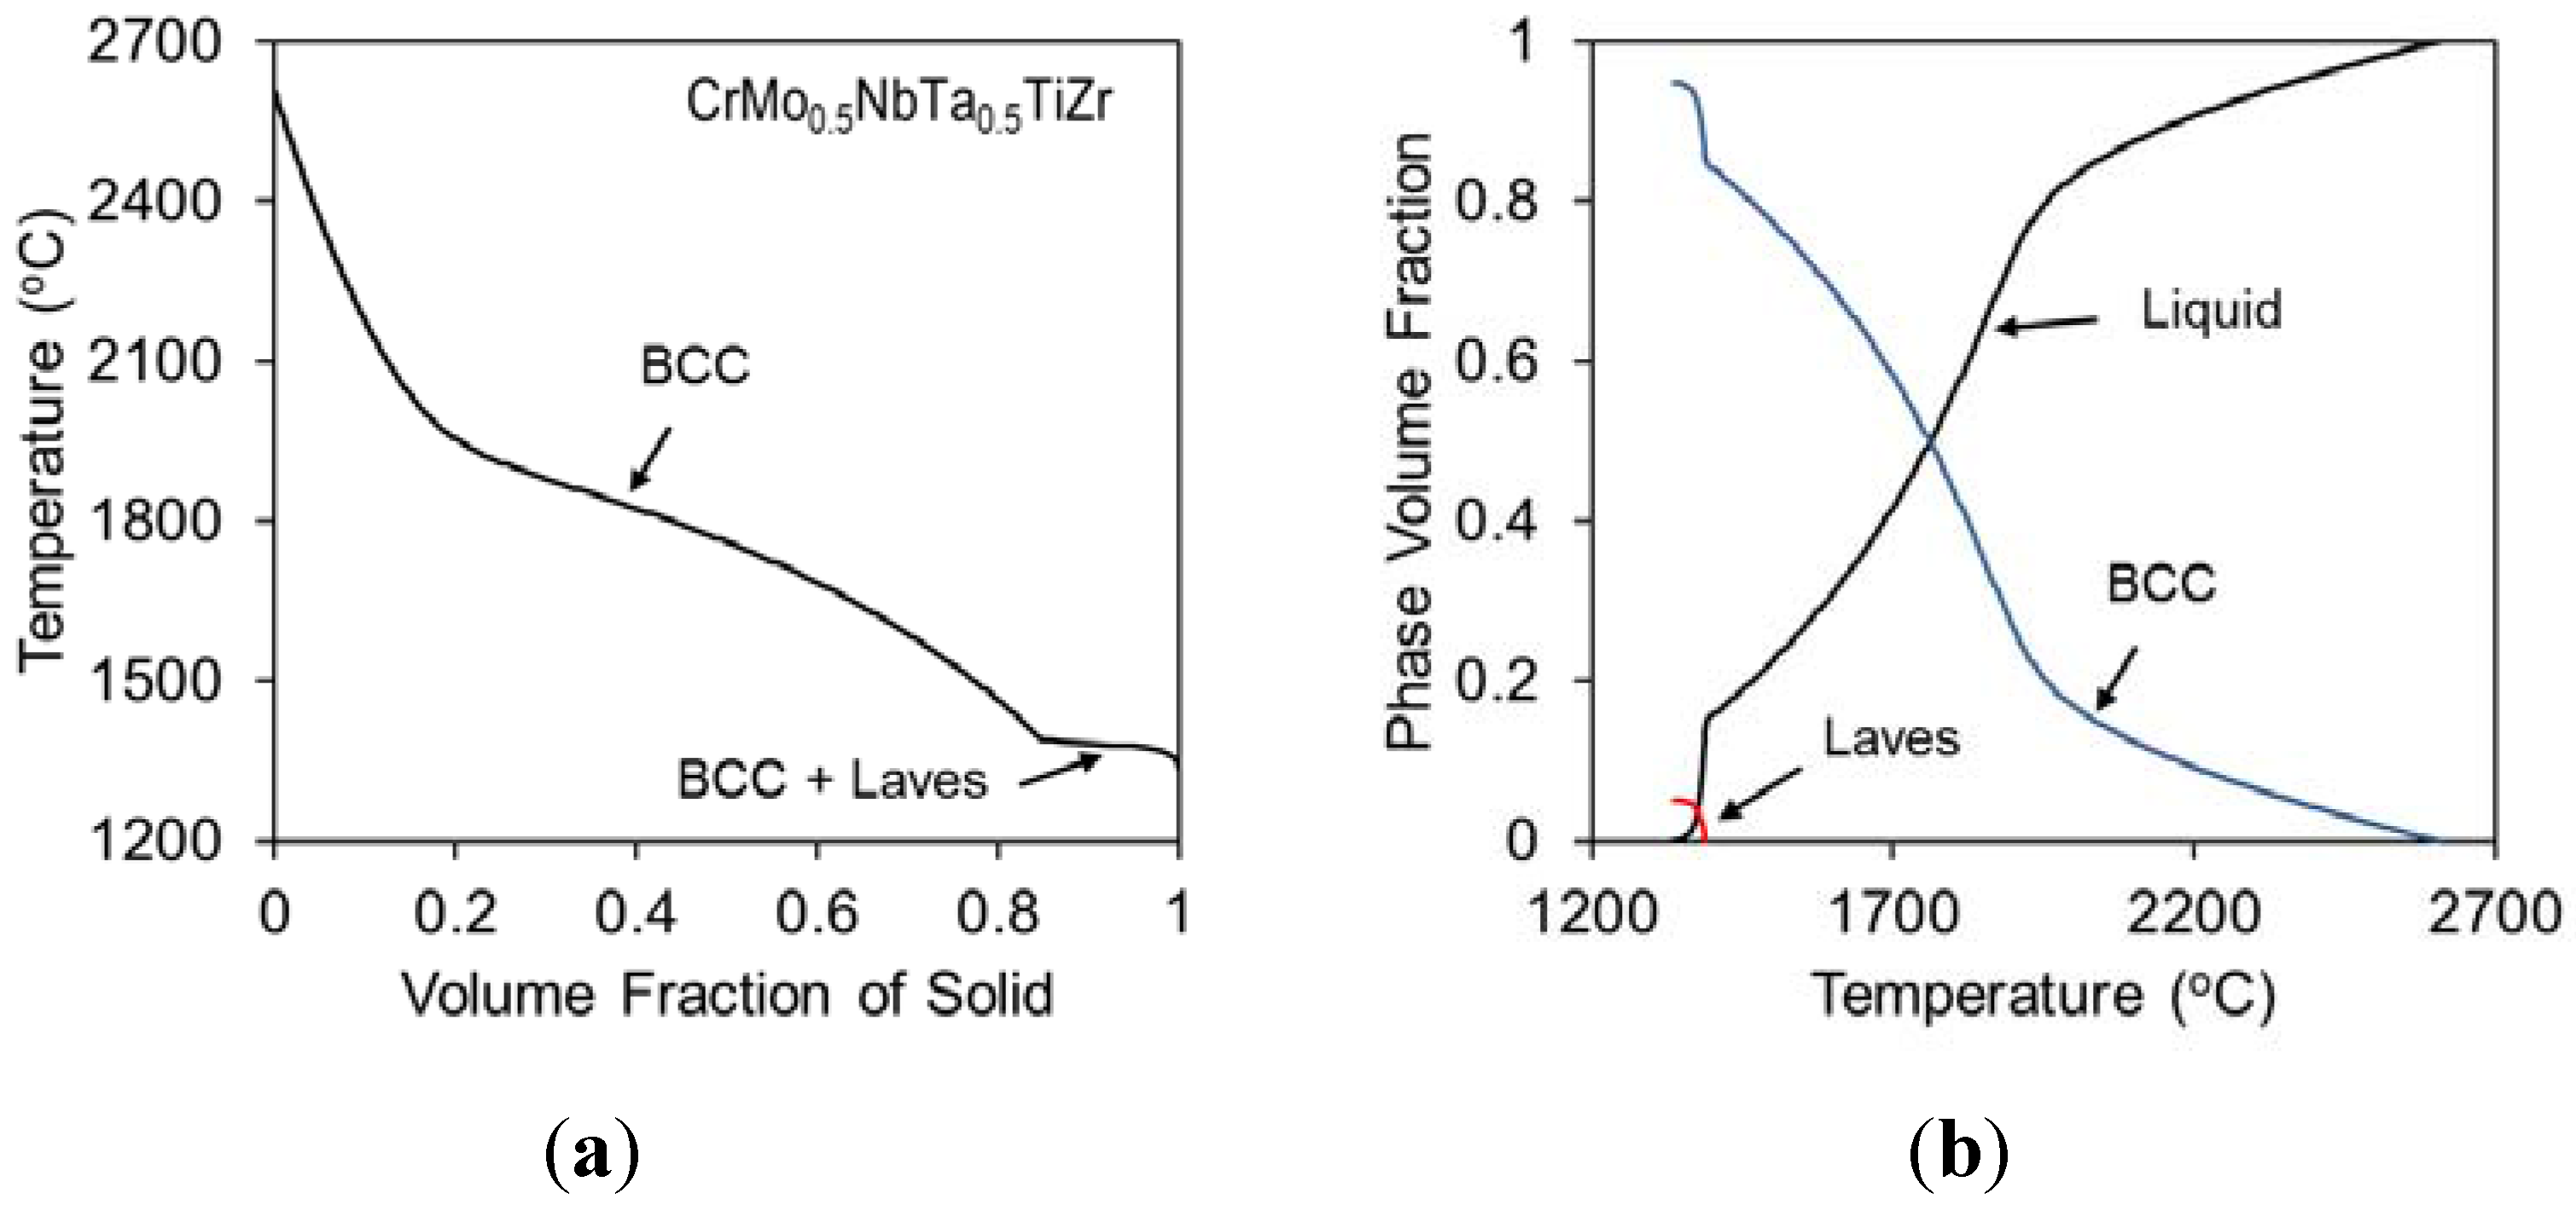
Solidification simulation (Scheil model) results showing the presence of the eutectic reaction with the formation of the BCC2 and Laves phases in the CrMo0.5NbTa0.5TiZr high entropy alloy seem to support the experimental observations and explain the morphology of the microstructure, with the mixture of the BCC2 and Laves phases forming a continuous network between the BCC1 (dendrite) particles (see Figure 4). However, the observed and predicted volume fractions of the phases are quite different. The experimental data shows 42% of BCC1, 27% of BCC2 and 31% of Laves phases in the as-solidified alloy, while Scheil simulation predicts 83% BCC1, 12% BCC2 and 5% Laves. The Scheil model satisfactorily predicts an increased concentration of Zr in the BCC2 phase, however it fails to predict enrichment of the BCC1 phase with Mo, Nb and Ta (compare Table 2 and Table 5). The model also incorrectly predicts considerably higher amounts of Zr in BCC1 and Cr in the BCC1 and BCC2 phases. The simulated Laves phase is essentially binary Cr2Zr phase containing very small amount (~0.8%) Ti. The experimental results however indicate that this phase is multicomponent and it contains other alloying elements at rather large concentrations, varying from 8.1% for Mo to 13.5% for Nb, which partially replace Cr and Zr in the binary Laves phase. It is likely that the lack of predicting high solubility of the alloying elements in the Cr2Zr Laves phase is the main reason that the solidification simulation calculates considerably smaller amount of the Laves phase.
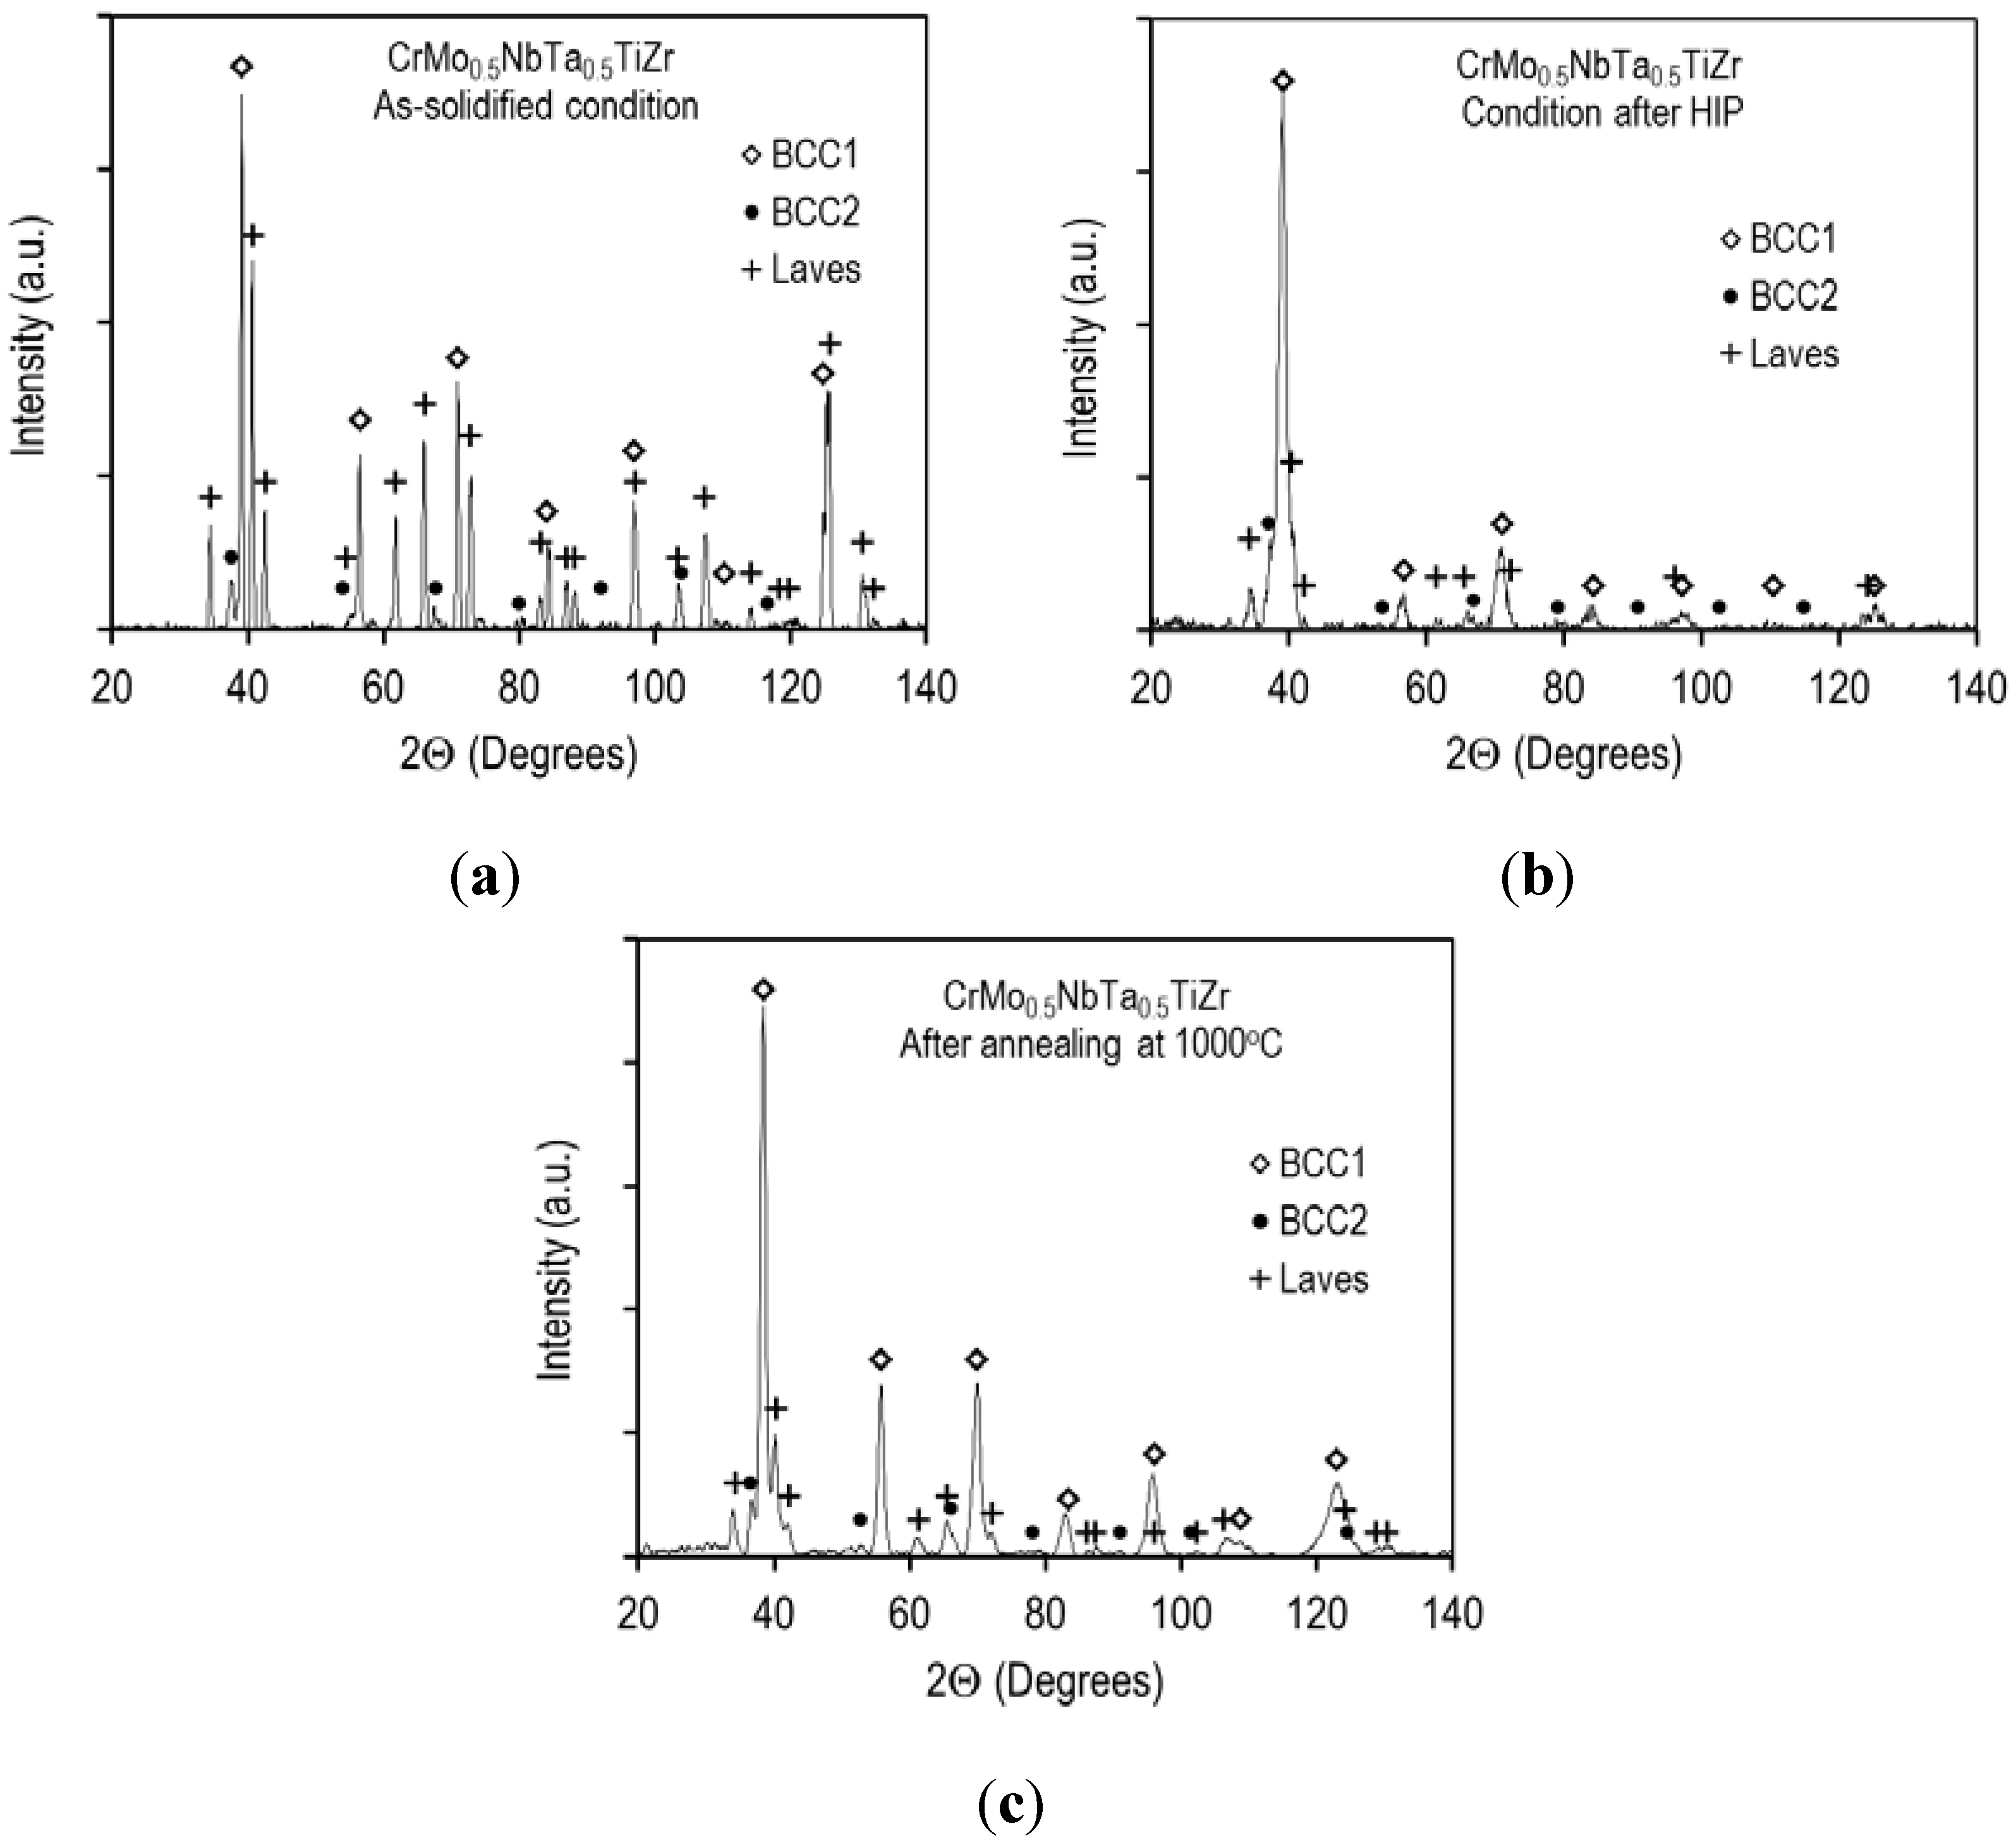
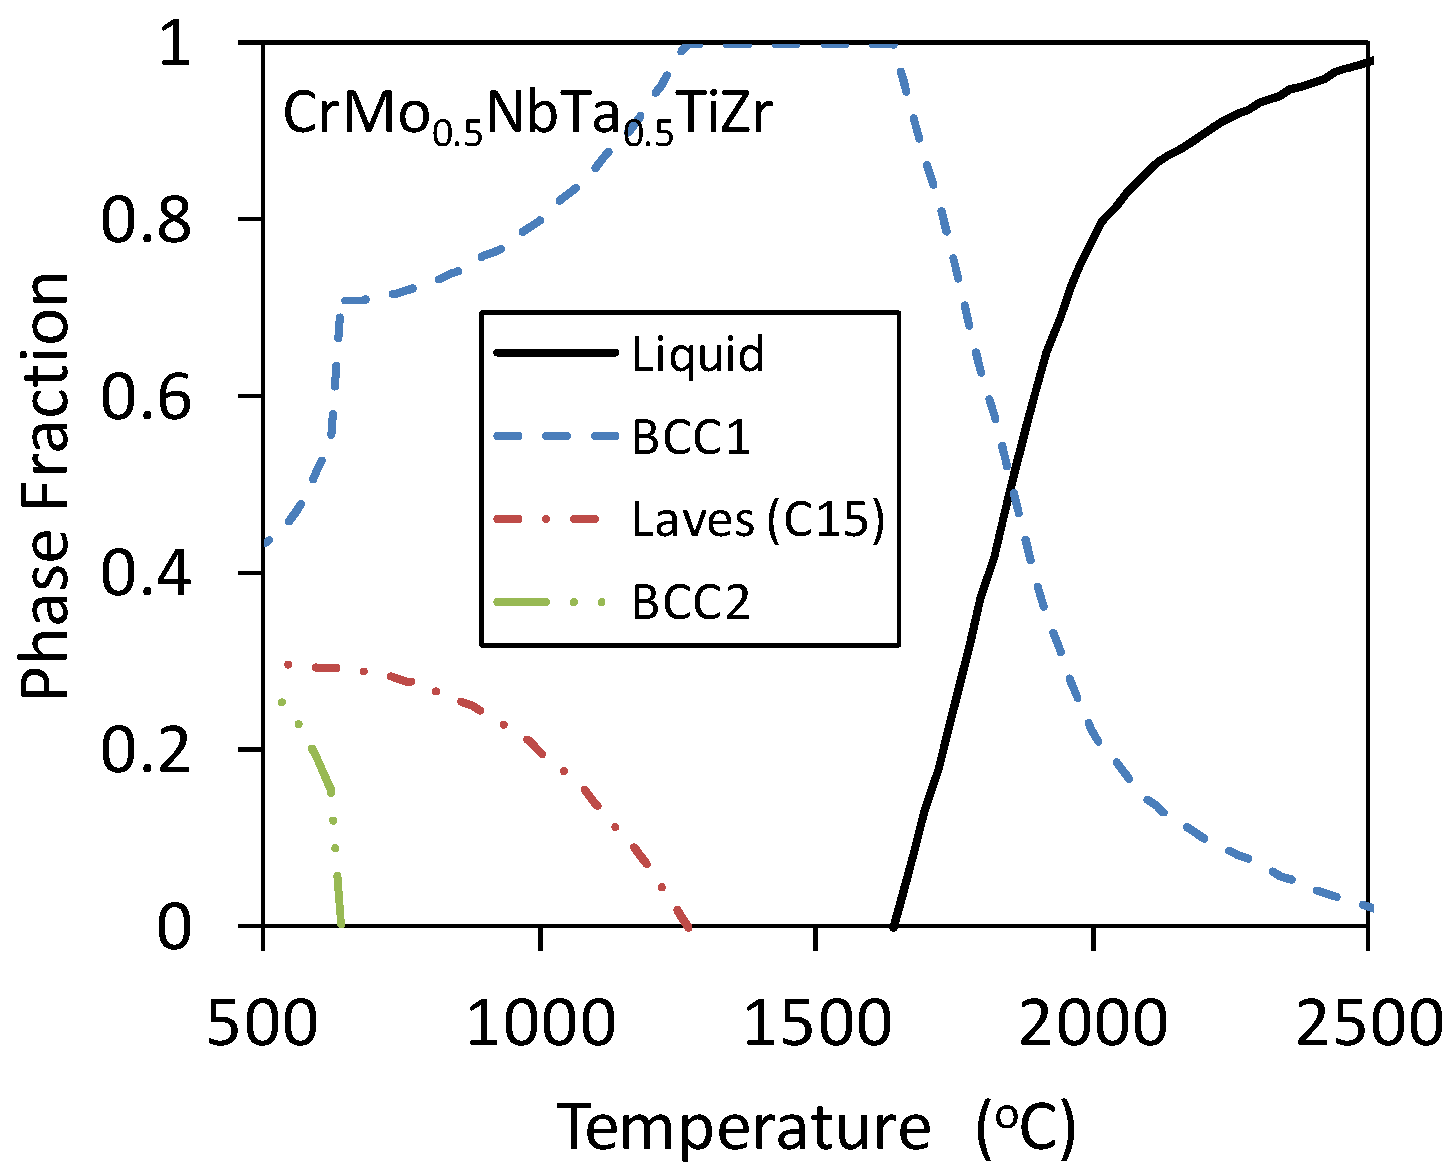
The experimental results seem to largely disagree with the simulated equilibrium phase diagram. In accord to this diagram, the alloy must have a single-phase BCC1 structure at T = 1450 °C and two-phase, BCC1 and Laves, structure at T = 1000 °C. However, all three phases BCC1, BCC2 and Laves are present both after HIP at 1450 °C for 3 h and after annealing at 1000 °C for 100 h. The main difference between the HIPd and annealed samples is a higher volume fraction of the Laves phase, at the same volume fraction of the BCC2 phase, in the annealed sample, due to additional precipitation of fine Laves phase particles inside the BBC1 phase. This observation indicates that the volume fraction of the Laves phase in the alloy increases with a decrease in temperature due to partial decomposition of the BCC1 phase, which is supported by the simulated data. Due to this decomposition, the BCC1 phase becomes more depleted with Cr. The modeling of equilibrium phases however predicts 80% of the BCC1 phase and 20% of the Laves phase at T = 1000 °C, while the experimental results show 52% BCC1, 16% BCC2 and 32% Laves phases after annealing at 1000 °C for 100 h. The main difference is again in incorrect prediction of the composition of the Laves phase.
The discrepancies found between the calculated results and the experimental data suggest that the current PanTi thermodynamic database, which was developed for titanium-based alloys and validated at the Ti-rich corner, is not valid in the entire composition space of the Cr-Mo-Nb-Ta-Ti-Zr system and cannot be used to predict the phase stability of alloys with near equiatomic concentrations. This thermodynamic database was developed by the CALPHAD approach [12,13,14]. Thermodynamic descriptions for all the key binaries and some key ternaries were developed in this database. On the basis of these descriptions, a reliable account of a higher order system at the Ti-corner was obtained via the extrapolation method [15]. Model parameters for the subsystems higher than ternaries are usually not considered in the construction of a conventional multi-component database. This is because although interactions between binary components are strong, they are weaker among ternary components, and the interactions in higher order subsystems become negligibly weak [14,16]. The PanTi thermodynamic database developed by this way enables calculation of the phase diagrams for multi-component Ti-based systems that are experimentally unavailable.
In spite of only constituent binaries and ternaries are considered, the number of subsystems need to be assessed is still large. There are C n 2 constituent binaries and C n 3 constituent ternaries in an n components system, which represent 10 binaries and 10 ternaries in a five-component system, and 45 binaries and 120 ternaries in a ten-component system. The large number of subsystems and the lack of experimental data make the development of “complete” thermodynamic database that can be applied to the entire composition space for a system with more than 10 components extremely difficult. It is due to this reason that most of currently available databases were developed and validated at the key component corner. Although they are quite useful for correct prediction and understanding of the phase equilibria and microstructures in the key-component based alloys, the currently available databases require additional adjustments before they can be successfully applied to multi-principle component alloys. How to apply the CALPHAD approach in aiding the design of HEAs was discussed by Zhang et al. [17]. In particular, in order to develop a thermodynamic database that is valid in the entire composition region for the Cr-Mo-Nb-Ta-Ti-Zr system, 15 constituent binaries and 20 constituent ternaries need to be assessed. These constituent binaries and ternaries are listed in Table 8 and Table 9. In the current PanTi database, all the constituent binaries listed in Table 8 were assessed, while only the Ti-X-Y ternaries (X and Y represent other elements in the system) at the Ti-corner were assessed. In order to have a complete database for this six-component system, thermodynamic descriptions for all the 20 ternaries listed in Table 9 need to be developed.
Table 8. Constituent binaries in the Cr-Mo-Nb-Ta-Ti-Zr system.
Cr-MoCr-NbCr-TaCr-TiCr-Zr
Mo-NbMo-TaMo-TiMo-ZrNb-Ta
Nb-TiNb-ZrTa-TiTa-ZrTi-Zr
Table 9. Constituent ternaries in the Cr-Mo-Nb-Ta-Ti-Zr system.
Cr-Mo-NbCr-Mo-TaCr-Mo-TiCr-Mo-ZrCr-Nb-Ta
Cr-Nb-TiCr-Nb-ZrCr-Ta-TiCr-Ta-ZrCr-Ti-Zr
Mo-Nb-TaMo-Nb-TiMo-Nb-ZrMo-Ta-TiMo-Ta-Zr
Mo-Ti-ZrNb-Ta-TiNb-Ta-ZrNb-Ti-ZrTa-Ti-Zr

5. Conclusions

Microstructure and phase composition of a CrMo0.5NbTa0.5TiZr high entropy alloy were studied in the as-solidified condition and after heat treatment at 1450 °C for 3 h and 1000 °C for 100 h.
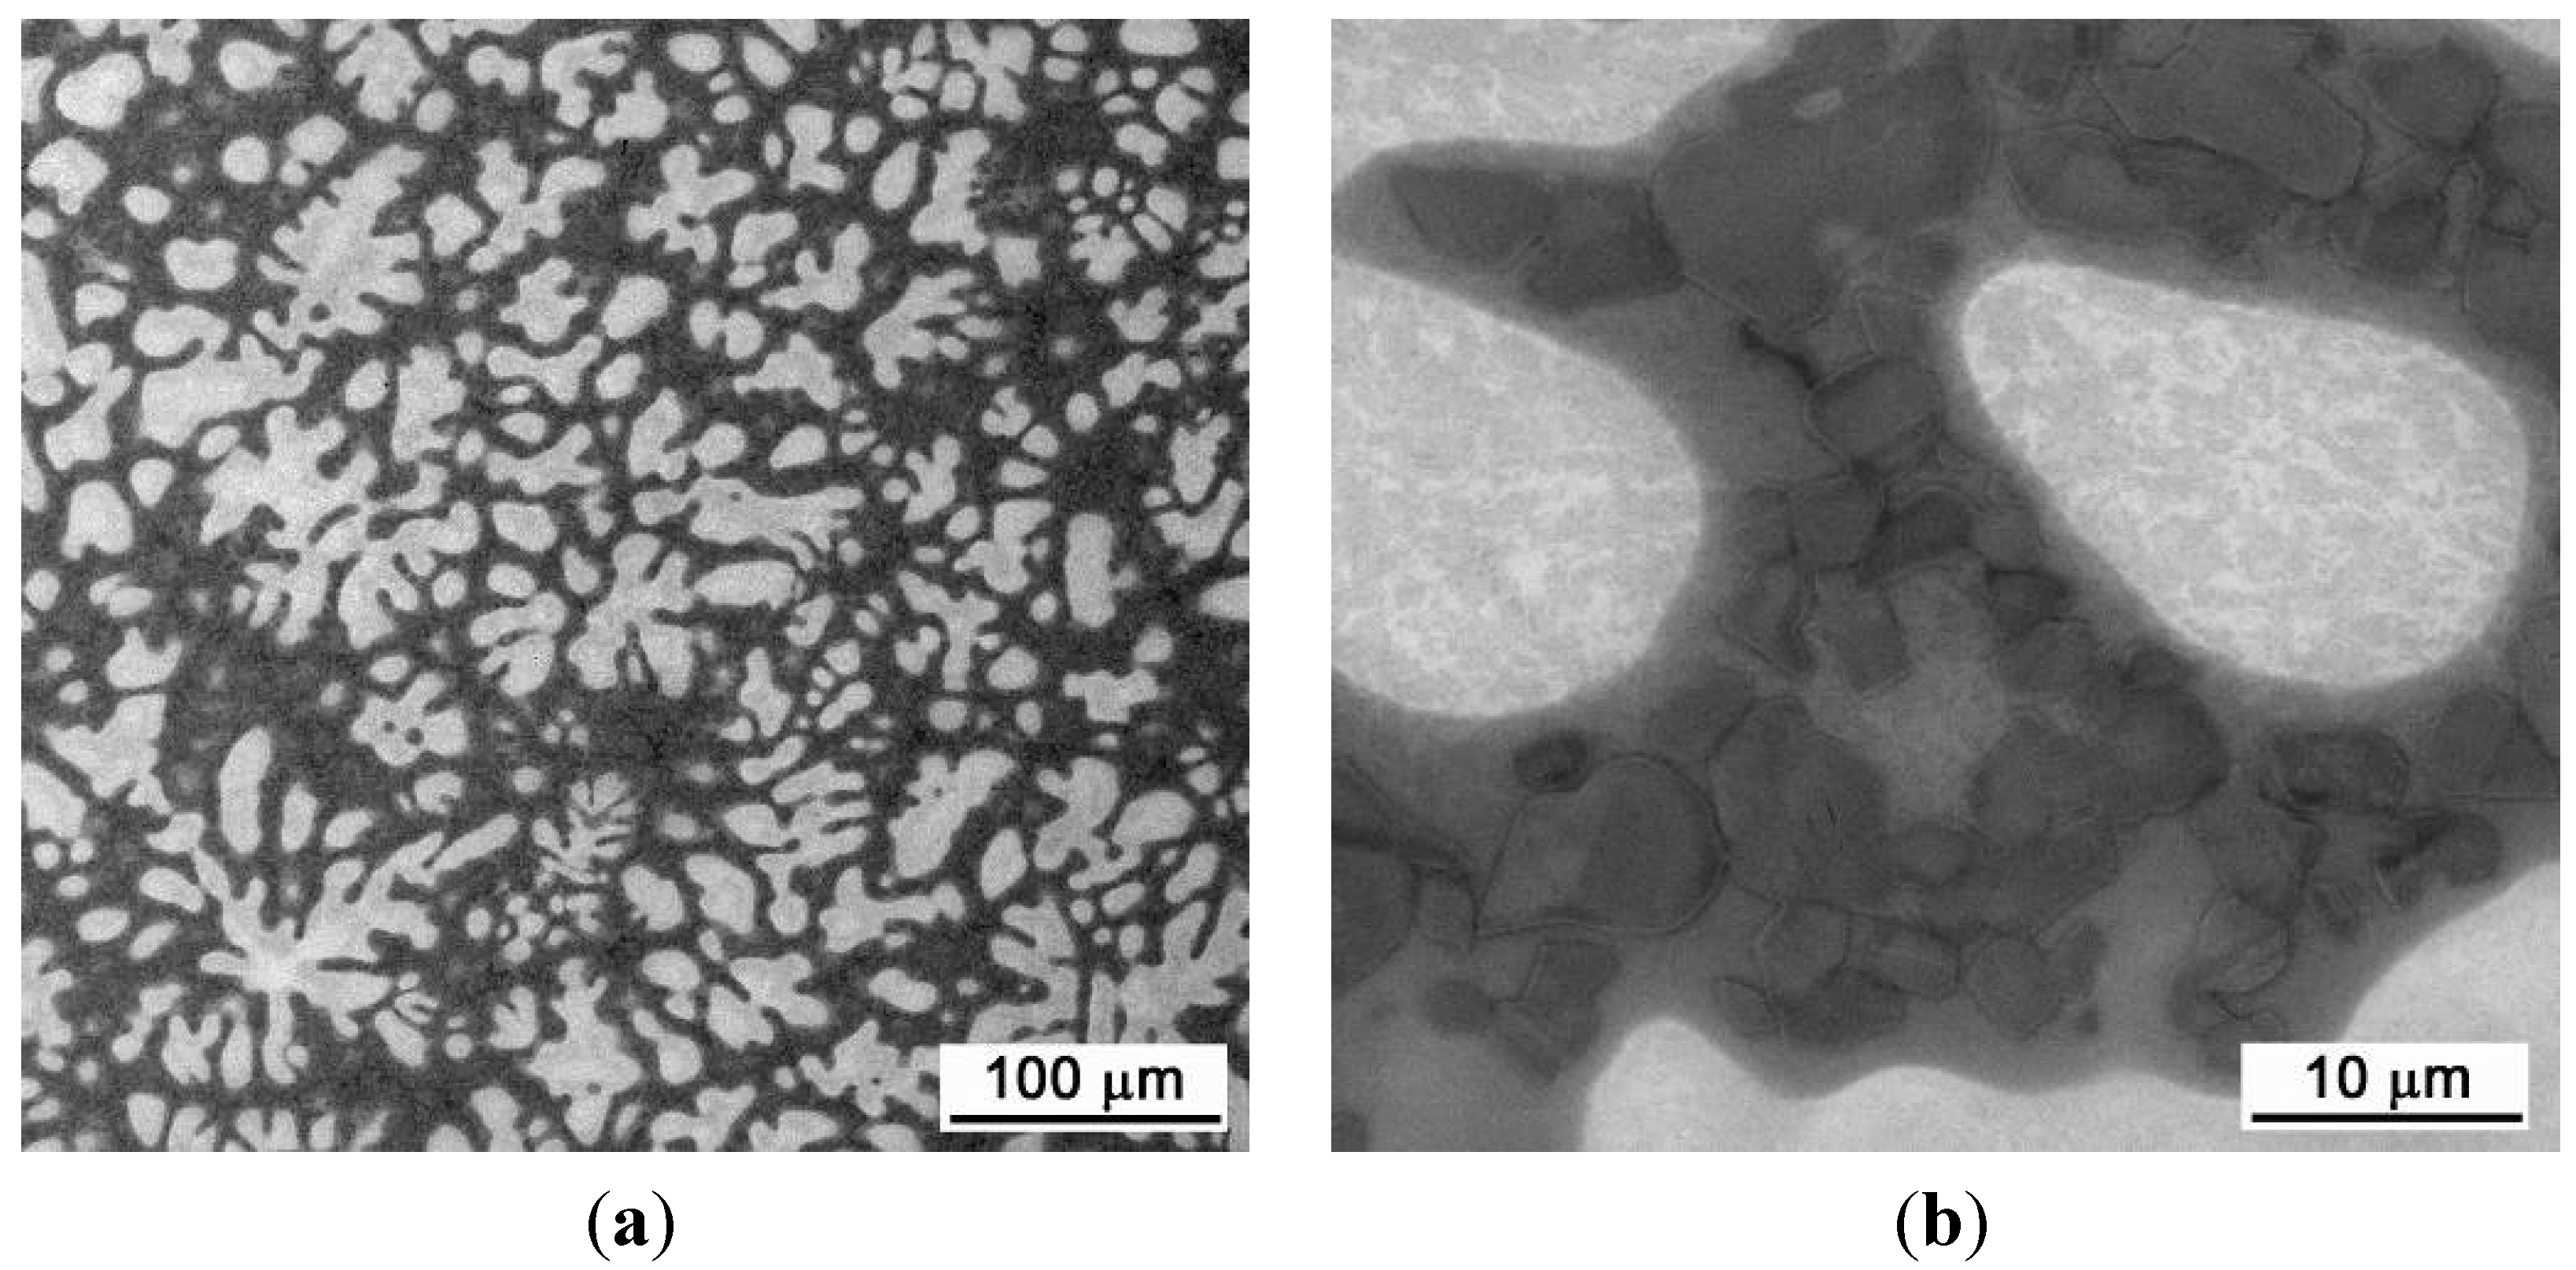
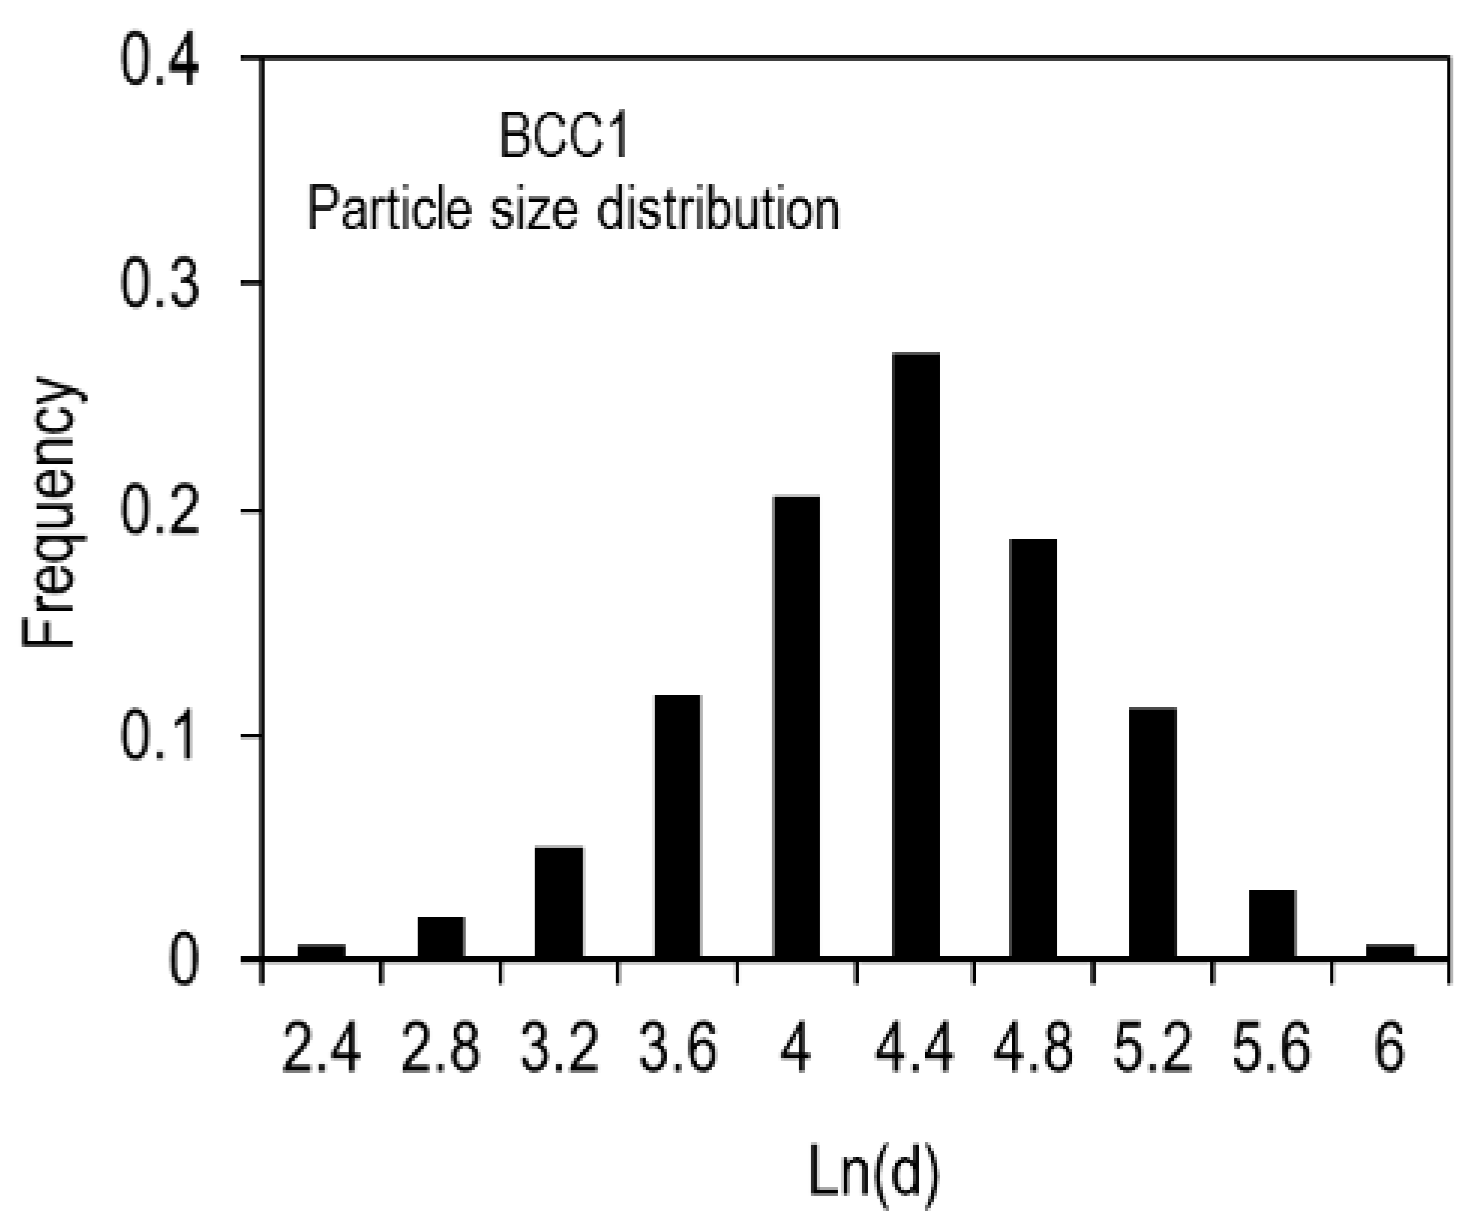
In the as-solidified condition, the alloy consists of three phases, two of which have disordered BCC crystal structures and the third has an ordered cubic Laves phase. The BCC1 phase solidifies first in the form of dendrites enriched with high-melting-temperature elements, Mo, Ta and Nb, and its volume fraction is 42%. The BCC2 and Laves phases likely solidify by eutectic-type reaction filling inter-dendritic regions. The volume fractions of these phases are 27% and 31%, respectively. The BCC2 phase is enriched with Ti and Zr and the Laves phase is heavily enriched with Cr and slightly with Zr. In addition to Cr and Zr, the Laves phase also contains other alloying elements, with the total amount of 37.1%
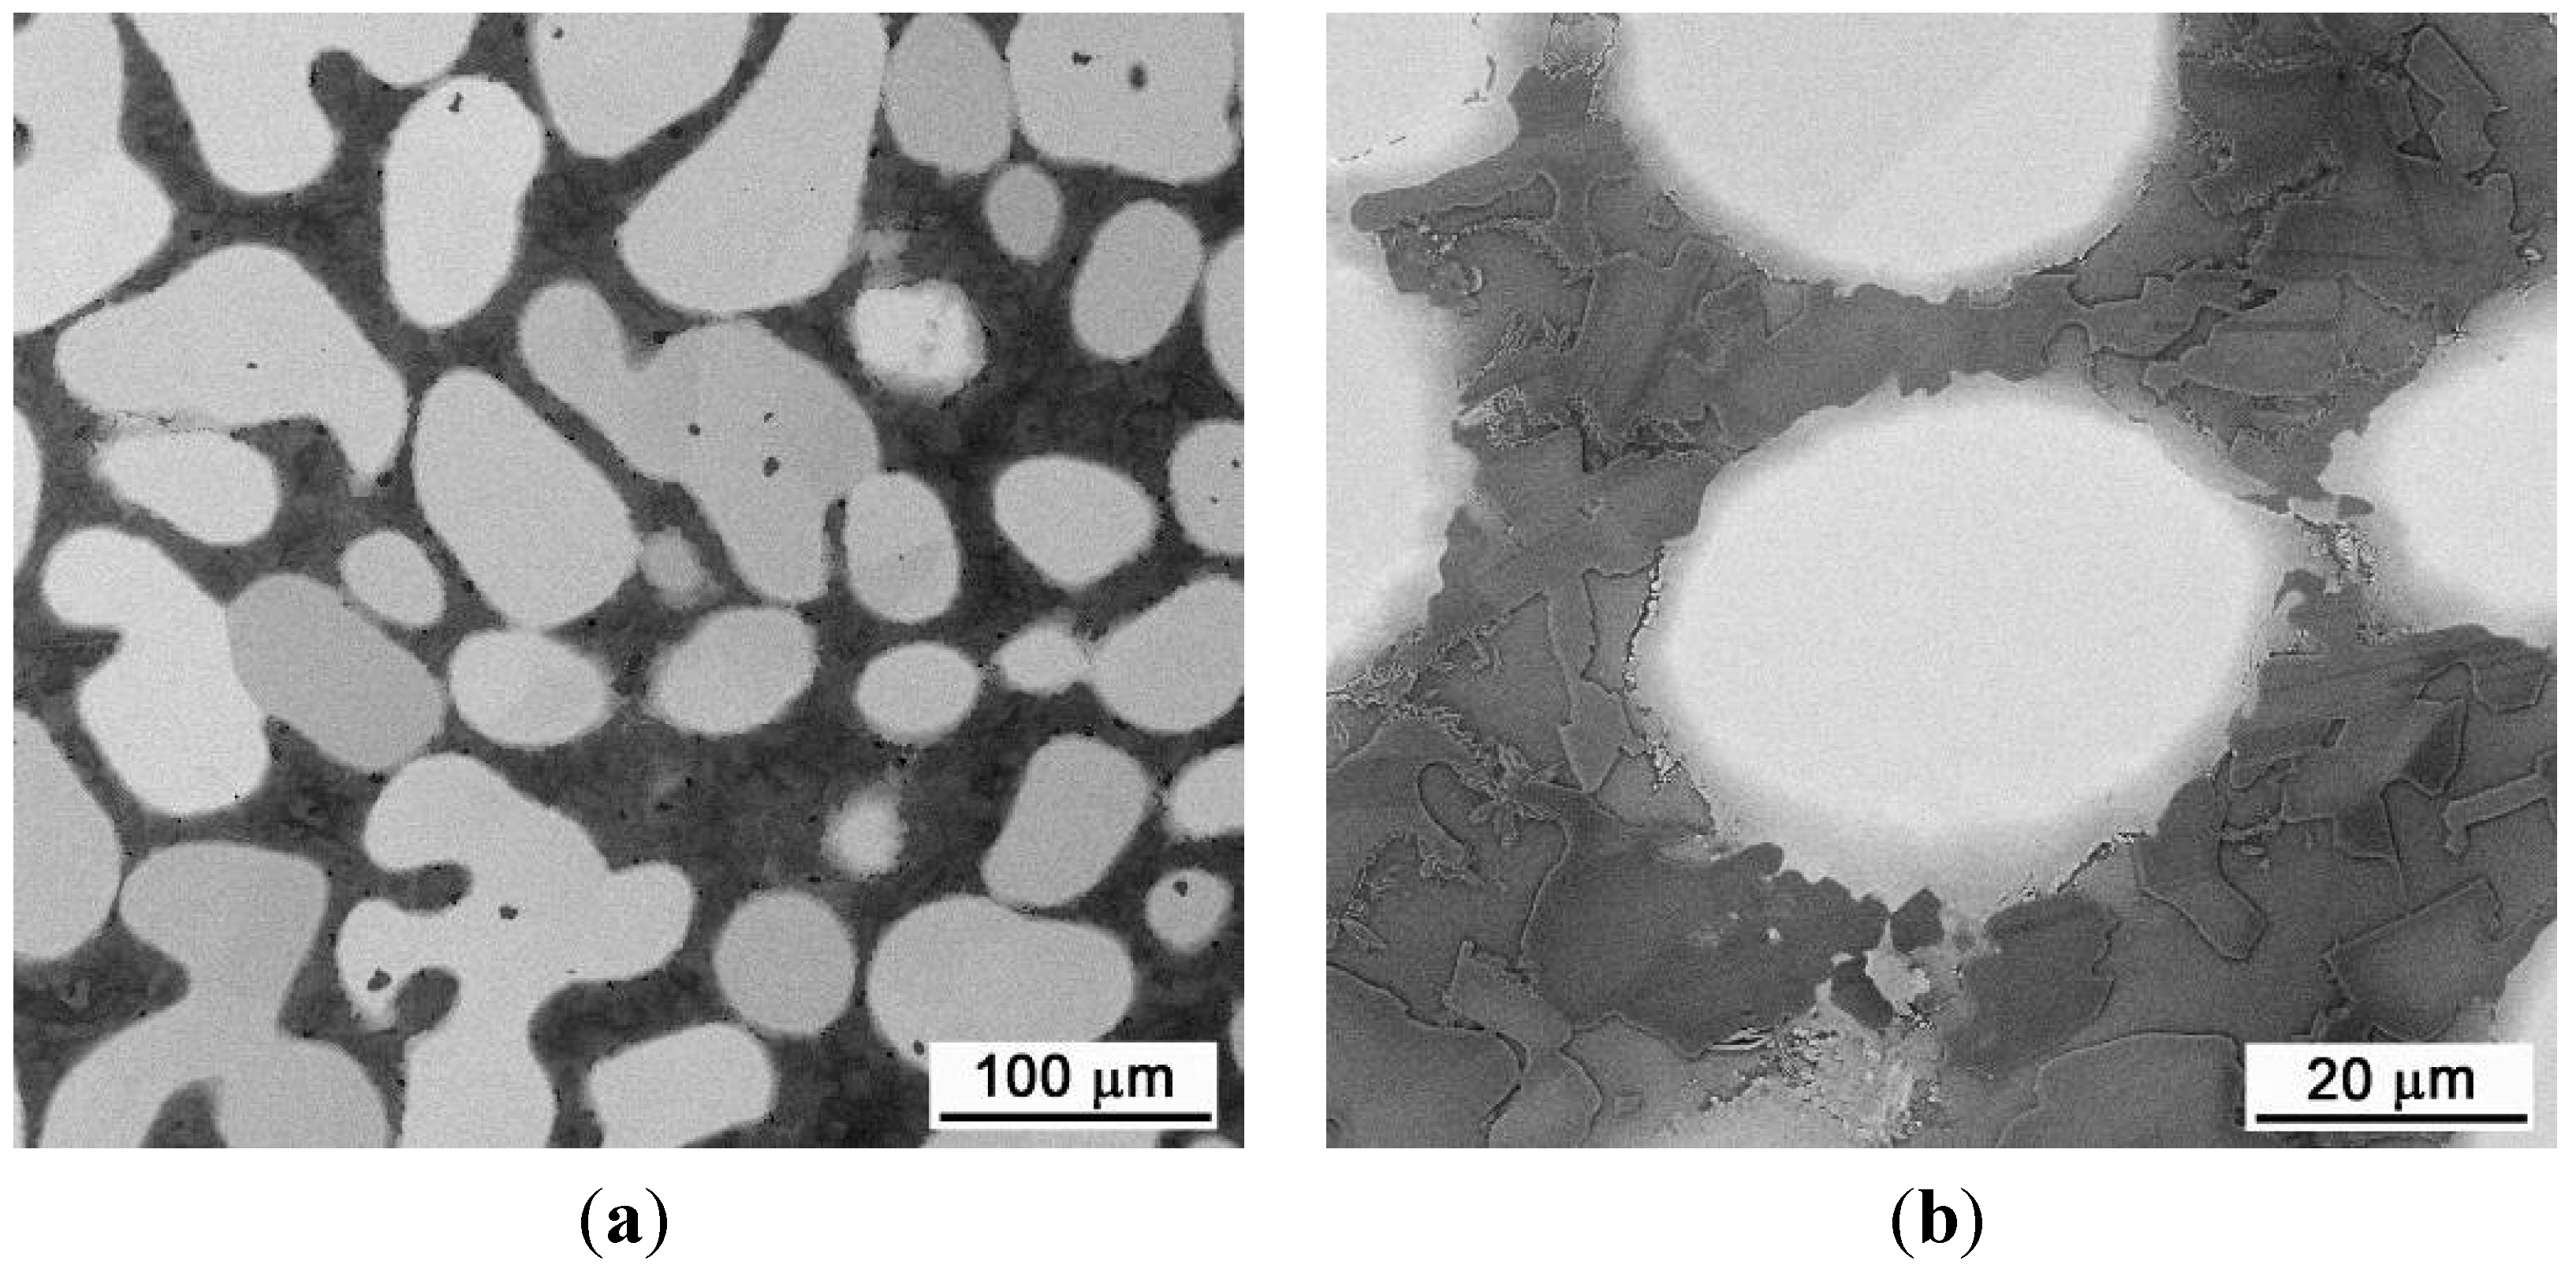
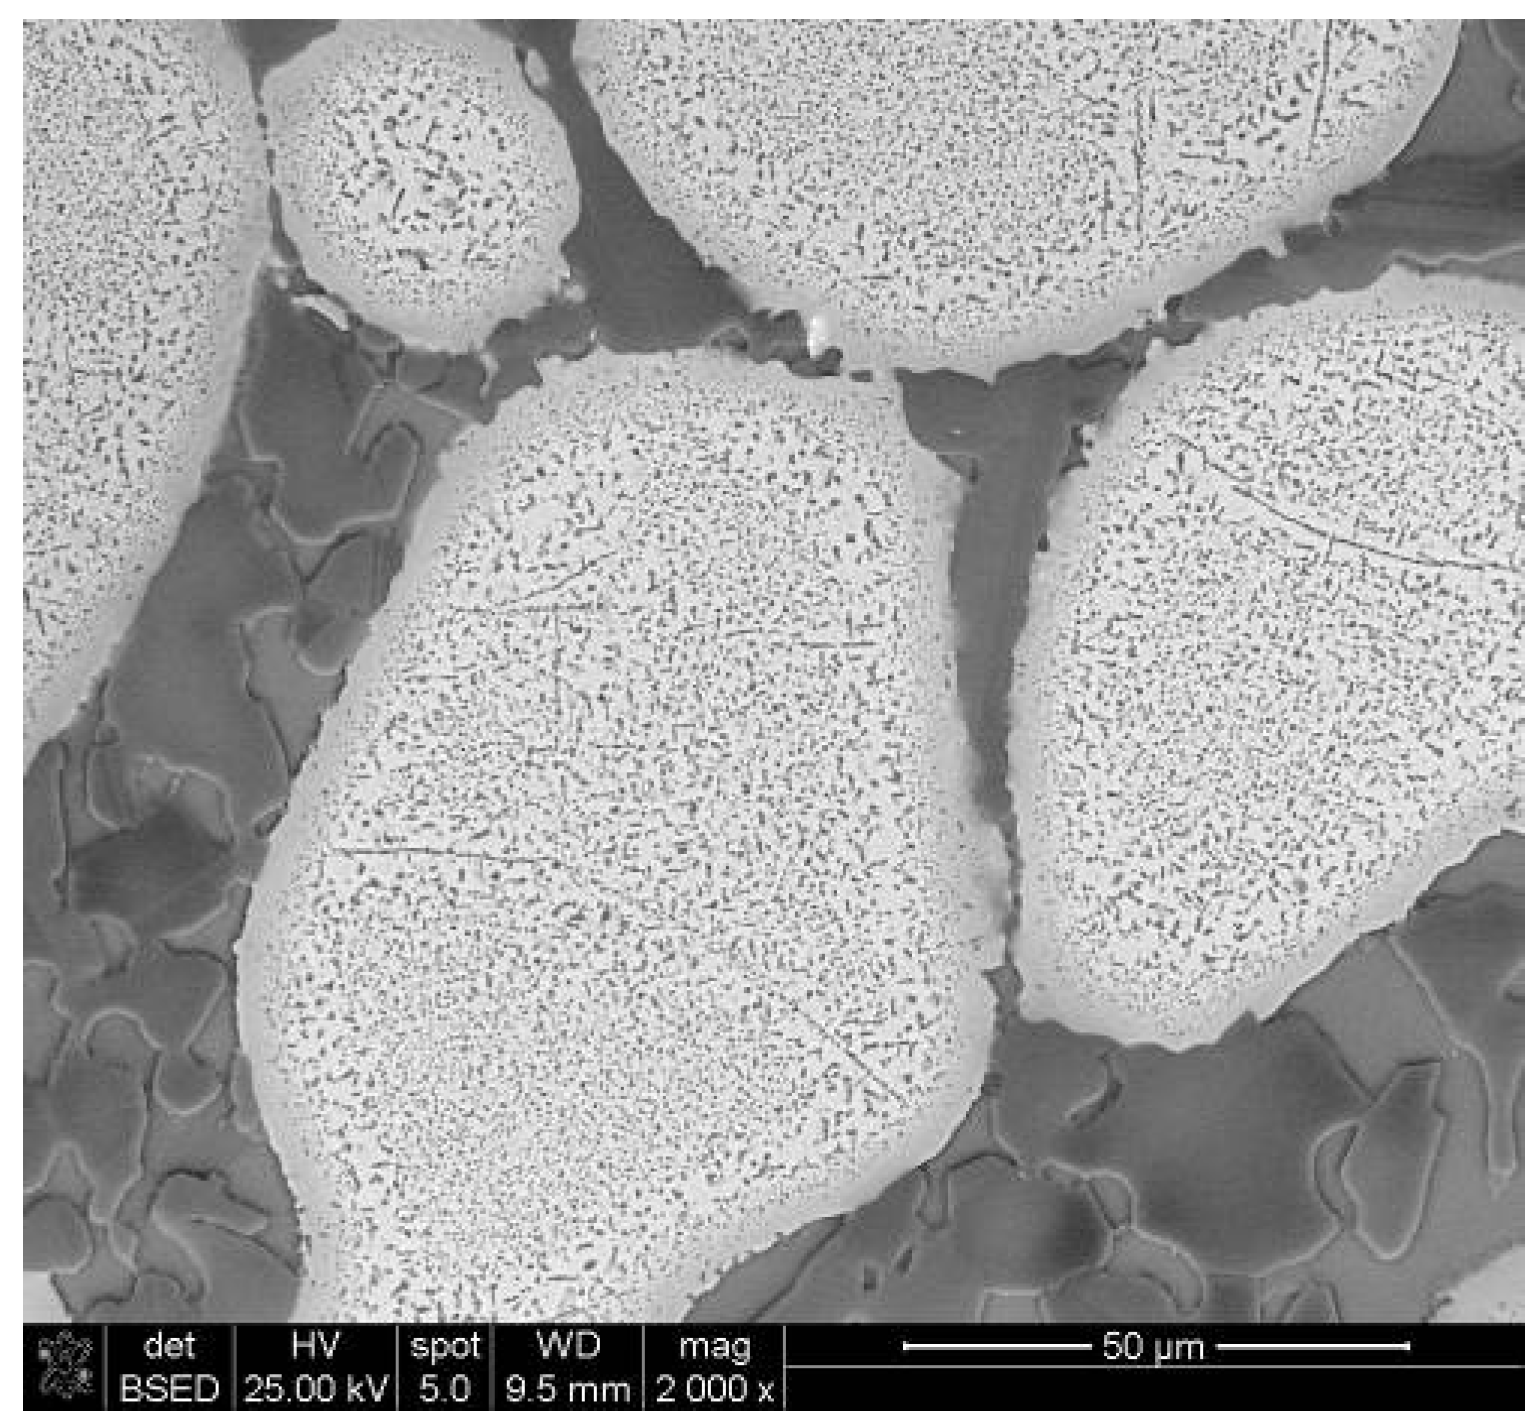
HIP at 1450 °C for 3 h results in coagulation of the BCC1 dendrites into round-shaped particles and in an increase in the volume fraction of the BCC1 phase to 67%. The volume fractions of the BCC2 and Laves phases decrease to 16% and 17%, respectively. These volume fraction changes cause re-distributions of the alloying elements between the phases. For example, the concentration of Cr in the BCC1 phase increases and in the BCC2 phase decreases. However the main tendency observed for the as-solidified condition remains: the BCC1 phase retains enriched with Mo, Nb and Ta, BCC2 phase is enriched with Ti and Zr and the Laves phase is enriched with Cr.
Annealing at 1000 °C for 100 h, conducted after the HIP processing, results in precipitation of fine, submicron-sized Laves particles inside the BCC1 phase, which causes a decrease in the concentration of Cr and Ta in the BCC1 phase and a decrease in the volume fraction of this phase. After annealing the alloy consists of 52% BCC1, 16% BCC2 and 32% Laves phases.
Thermodynamic analyses of the solidification process and phase equilibria in the CrMo0.5NbTa0.5TiZr alloy were carried out using the thermodynamic database developed by the CALPHAD approach. Discrepancies were found between the calculated results and the experimental data. It was concluded that the current PanTi database, that was initially developed for the Ti-rich alloys, cannot be applied to the multi-principal alloy compositions, far away from the Ti-rich corner. A complete thermodynamic database for the Cr-Mo-Nb-Ta-Ti-Zr six-component system needs to be developed to understand the phase equilibria in this system and guide the design of refractory HEAs based on this system.

Acknowledgments

Discussions with D. Dimiduk, D. Miracle, J. Tiley, C. Woodward are recognized. Financial support through the Air Force contract No. FA8650-10-D-5226 is appreciated.

Conflicts of Interest

The authors declare no conflict of interest.

References and Notes

  1. Yeh, J.W. Recent progress in high-entropy alloys. Ann. Chim.-Sci. Mat. 2006, 31, 633–648. [Google Scholar] [CrossRef]
  2. Yeh, J.W.; Chen, Y.L.; Lin, S.J.; Chen, S.K. High-entropy alloys—a new era of exploitation. Mater. Sci. Forum 2007, 560, 1–9. [Google Scholar] [CrossRef]
  3. Lee, C.P.; Chen, Y.Y.; Hsu, C.Y.; Yeh, J.W.; Shih, H.C. Enhancing pitting corrosion resistance of AlXCrFe1.5MnNi0.5 high-entropy alloys by anodic treatment in sulfuric acid. Thin Solid Films 2008, 517, 1301–1305. [Google Scholar] [CrossRef]
  4. Chuang, M.H.; Tsai, M.H.; Wang, W.R.; Lin, S.J.; Yeh, J.W. Microstructure and wear behavior of AlXCo1.5CrFeNi1.5TiY high-entropy alloys. Acta Mater. 2011, 59, 6308–6317. [Google Scholar] [CrossRef]
  5. Senkov, O.N.; Wilks, G.B.; Miracle, D.B.; Chuang, C.P.; Liaw, P.K. Refractory high entropy alloys. Intermetallics 2010, 18, 1758–1765. [Google Scholar] [CrossRef]
  6. Senkov, O.N.; Wilks, G.B.; Scott, J.M.; Miracle, D.B. Mechanical properties of Nb25Mo25Ta25W25 and V20Nb20Mo20Ta20W20 refractory high-entropy alloys. Intermetallics 2011, 19, 698–706. [Google Scholar] [CrossRef]
  7. Senkov, O.N.; Woodward, C. Microstructure and properties of a refractory NbCrMo0.5Ta0.5TiZr alloy. Mater. Sci. Eng. A 2011, 529, 311–320. [Google Scholar] [CrossRef]
  8. Senkov, O.N.; Senkova, S.V.; Dimiduk, D.M.; Woodward, C.; Miracle, D.B. Oxidation behavior of a refractory NbCrMo0.5Ta0.5TiZr alloy. J. Mater. Sci. 2012, 47, 6522–6534. [Google Scholar] [CrossRef]
  9. Chang, Y.A.; Cao, H.B.; Chen, S.L.; Zhang, F.; Yang, Y.; Cao, W.S.; Wu, K.S. Phase equilibria. In ASM Handbook on Fundamentals of Modeling for Metals Processing; Furrer, D.U., Semiatin, S.L., Eds.; ASM Internat.: Materials Park, OH, USA, 2009; Volume 22A, pp. 443–457. [Google Scholar]
  10. Cao, W.; Chen, S.L.; Zhang, F.; Wu, K.; Yang, Y.; Chang, Y.A.; Schmid-Fetzer, R.; Oates, W.A. PANDAT software with PanEngine, PanOptimizer and PanPrecipitation for multi-component phase diagram calculation and materials property simulation. Calphad 2009, 33, 328–342. [Google Scholar] [CrossRef]
  11. Zhang, F.; Xie, F.Y.; Chen, S.L.; Chang, Y.A.; Furrer, D.; Venkatesh, V. Predictions of titanium alloy properties using thermodynamic modeling tools. J. Mater. Eng. Perf. 2005, 14, 717–721. [Google Scholar] [CrossRef]
  12. Kaufman, L. Computer Calculation of Phase Diagrams; Academic Press: New York, NY, USA, 1970. [Google Scholar]
  13. Saunders, N.; Miodownik, A.P. CALPHAD: A Comprehensive Guide, 1st ed.; Pergamon: Oxford, UK, 1998. [Google Scholar]
  14. Chang, A.; Chen, S.L.; Zhang, F.; Yan, X.Y.; Xie, F.Y.; Schmid-Fetzer, R.; Oates, W.A. Phase diagram calculation: past, present and future. Progr. Mater. Sci. 2004, 49, 313–345. [Google Scholar] [CrossRef]
  15. Chou, K.C.; Chang, Y.A. A study of ternary geometrical models. Ber. Bunsenges. Phys. Chem. 1989, 93, 735–741. [Google Scholar] [CrossRef]
  16. Kattner, U.R. Thermodynamic modeling of multicomponent phase equilibria. JOM 1997, 49, 14–19. [Google Scholar] [CrossRef]
  17. Zhang, F.; Zhang, C.; Chen, S.L.; Zhu, J.; Cao, W.; Kattner, U. An understanding of high entropy alloy from phase diagram calculation. Calphad 2013. submitted for publication. [Google Scholar]

