1. Introduction
This paper principally describes high-entropy (H-E) alloys [
1] and bulk metallic glasses (BMGs) [
2], together with relevant high-entropy bulk metallic glasses (HE-BMGs) [
3,
4,
5,
6,
7] by focusing on entropy as well as enthalpy from thermodynamic quantaties. The H-E alloys and BMGs are classified into the same alloy group in point that they are formed into a solid solution, although they have completely different crystallographic structures. Specifically, H-E alloys are formed into a simple crystalline structure of bcc, fcc or their mixiture, whereas BMGs are into a glassy phase. One might think that the H-E alloys and BMGs have not been developed under the same alloy design because of their diffrence in structure. On the contrary, H-E alloys and BMGs have been developed by focusing on the common three factors [
2] in their alloy designs: (1) the number of elements (N), (2) difference in atomic size, and (3) mixing enthalpy (Δ
Hmix). The first factor numerically defines the H-E alloys as equi-atomic or near equi-atomic multicomponent alloys with elements of five or more (N
5), whereas most of the BMGs are as N
3, excepting for a couple of binary alloys, such as Cu-Zr [
8,
9] and Ni-Nb [
10] BMGs. The second factor in H-E alloys is not limited by definition but broad enough to cover the second Inoue’s rule for BMGs. On the other hand, the third factor for the H-E alloys is also not defined, and BMGs principally requires them to posses negative values of Δ
Hmix for the atomic pairs of the constituent elements. Thus, the first to third factors in the alloy design for H-E alloys and BMGs can be dealt with numerical and thermodynamic quantaties to see their correlations and differences.
The H-E alloys and BMGs are also deeply involved in another thermodynamic quantity—entropy. Specifically, the H-E alloys are characterized by configurational entropy (
Sconfig.). In reality, H-E alloys are named after the following aspects that
Sconfig. is maximized at the equi-atomic composition in a system and that equi-atomic alloys exhibit
Sconfig./
R = ln N where
R the gas constant. More precisely, the latter aspect is used for defining H-E alloys directly with thermodynamic formula,
Sconfig./
R ln 5 (~1.61 [
11]), according to the requirement N
5. On the other hand, a mismatch entropy (
Sσ) can be used for BMGs for describing the difference in atomic size among the constituent elements, whereas an alternative parameter for
Sσ for the H-E alloys is Delta parameter (
δ) [
12]. By utilizing thermodynamic and numerical quantaties, such as Δ
Hmix,
Sconfig and
δ, the stabilities of crystalline H-E alloys with disordered solid solutions have been analyzed in such a set of formulae of Δ
Sconfig R > 1.61, δ < 4.6, and –2.6856δ – 2.54 < Δ
Hmix/kJmol
−1 < −1.28δ + 5.44, as reported by Zhang and Zhou [
11]. These numerical applicability with thermodynamic and numerical quantaties for forming H-E alloys are of great useful for alloy design of H-E alloys, together with the other precious analyses given by Ng
et al. [
13] for an Al
0.5CoCrCuFeNi H-E alloy for its thermo-mechanical treatments combined with thermodynamic calculations, and by Cunliffe
et al. [
14] for their discussions of forming-abilities of H-E alloys and amorphous phase for a (TiZrNbCu)
1−xNi
x system. Thus, the authors herewith focus on an inportant aspect that the H-E alloys and BMGs are sufficiently described by numerical and thermodynamic quantaties in their alloy designs. Hence, one can utilise numerical and thermodynamic descriptions when developing more new H-E alloys and BMGs, leading to the drastic increase in the number of alloys found in two decades to date. Furthermore, increasing the number of alloys greatly contributes to data mining and resultant statistic analysis of H-E alloys and BMGs as well as HE-BMGs. This analysis indicates that one can distingush H-E alloys, BMGs and HE-BMGs by paying attentions to the fundamental differences in characteristics between H-E alloys and BMGs. Here, the fundamental differences include the following aspects that the H-E alloys are crystalline alloys whereas the BMGs are glassy alloys and that the atomic size difference among the constituent elmenets are small for the crystalline H-E alloys with disordered solid solutions and large for BMGs. These aspects lead to no intersections of their alloys in the Δ
Hmix–
δ diagram. Under these circumstances, the authors, however, expect that unprecedented new alloys may be found in the analyses of characterizing the H-E alloys and BMGs. They are new HE-BMGs or new H-E alloys with Δ
Hmix and
δ values which apart from the conventional ones in the Δ
Hmix–
δ diagram.
The purpose of the present paper is to clarify the features of H-E alloys, BMGs and HE-BMGs by focusing on entropies and other numerical and thermodynamic quantities with the help of statistical analysis for these alloys.
2. Calculation Methods
The effect of atomic size differences on the formation of BMGs was evaluated with mismatch entropy (
Sσ) by referring to a concept proposed by Mansoori
et al. [
15]. In the orginal literature [
15], Mansoori
et al. proposed an equation of state for the mixture of hard spheres based on an averaging process over the two results of the solution of the Percus–Yevik integral equation for the mixture of hard spheres. It should be noted that
Sσ can be calculated as functions of atomic diameters (
di) of the i-th constituent element and a parameter (
ζ) that relates to packing fraction
ρ where
ζ = 1 / ( 1 −
ρ). The actual formulations used for calculating
Sσ are shown in Equations (1) to (5) where
kB is the Boltzmann constant and dimentionless parameters y
i’s (i = 1 to 3) have a relationship y
1 + y
2 + y
3 = 1 [
15]. The formulations in Equations (2) to (5) used in the present work and our early study [
16] are different from those in the original literature [
15]. In calculating, a system including hard spheres of atoms was considered under
ρ = 0.64 for dense random packing structure that includes amorphous alloys, metallic glasses and BMGs. The details of the calculation were acquired from the original literature [
15] where the mixing entropies consisting of four terms of ideal gas-, concentration-, packing- and misfit-term were taken into account. In the present study, only the misfit term
Sσ was considered to describe the entropy of mixing concerning the differences in atomic radii. The values of
di’s were acquired from literature [
17].
Besides, configuration entropy (
Sconfig.) and mismatch entropy were also calculated in the present study. The
Sconfig. was calculated on the basis of the fundamental knowledge on thermodynamics for counting the number of cases to distribute the solute and solvent atoms in a hypothetical lattice. Specifically,
Sconfig. is given by Equation (6), with a gas constant (
R) and a fraction of the i-th elements in the alloy with N elements. The equi-atomicity principle of the H-E alloys makes it possible to describe the increase in
Sconfig. with increasing N, as shown in Equation (7) [
1].
On the other hand, Δ
Hmix was computed based on Miedema’s empirical method [
18] using Equation (8). Equation 8 exhibits the parabolic nature of Δ
Hmix as a function of c
i, which is an approximated description for Δ
Hmix given in the original literature [
18] in order to calculate Δ
Hmix simply and comprehensively. The
δ was calculated based on Equation (9) using the average atomic radius from that of the constituent elements shown in Equation (10) [
12].
3. Results and Discussion
First, the effect of atomic size differences on the formation of BMGs was evaluated with
Sσ/
kB for Zr-Al-Ni and La-Al-Ni alloys where the atomic radius (
ri) of La, Zr, Al and Ni were acquired from literature [
17]:
rLa = 0.182 nm,
rZr = 0.162 nm,
rAl = 0.143 nm and
rNi = 0.125 nm. One can expect that Zr-Ni and La-Ni sub-binary systems exhibit the greatest difference in atomic radius in Zr-Al-Ni and La-Al-Ni systems, respectively, according to these
ri’s.
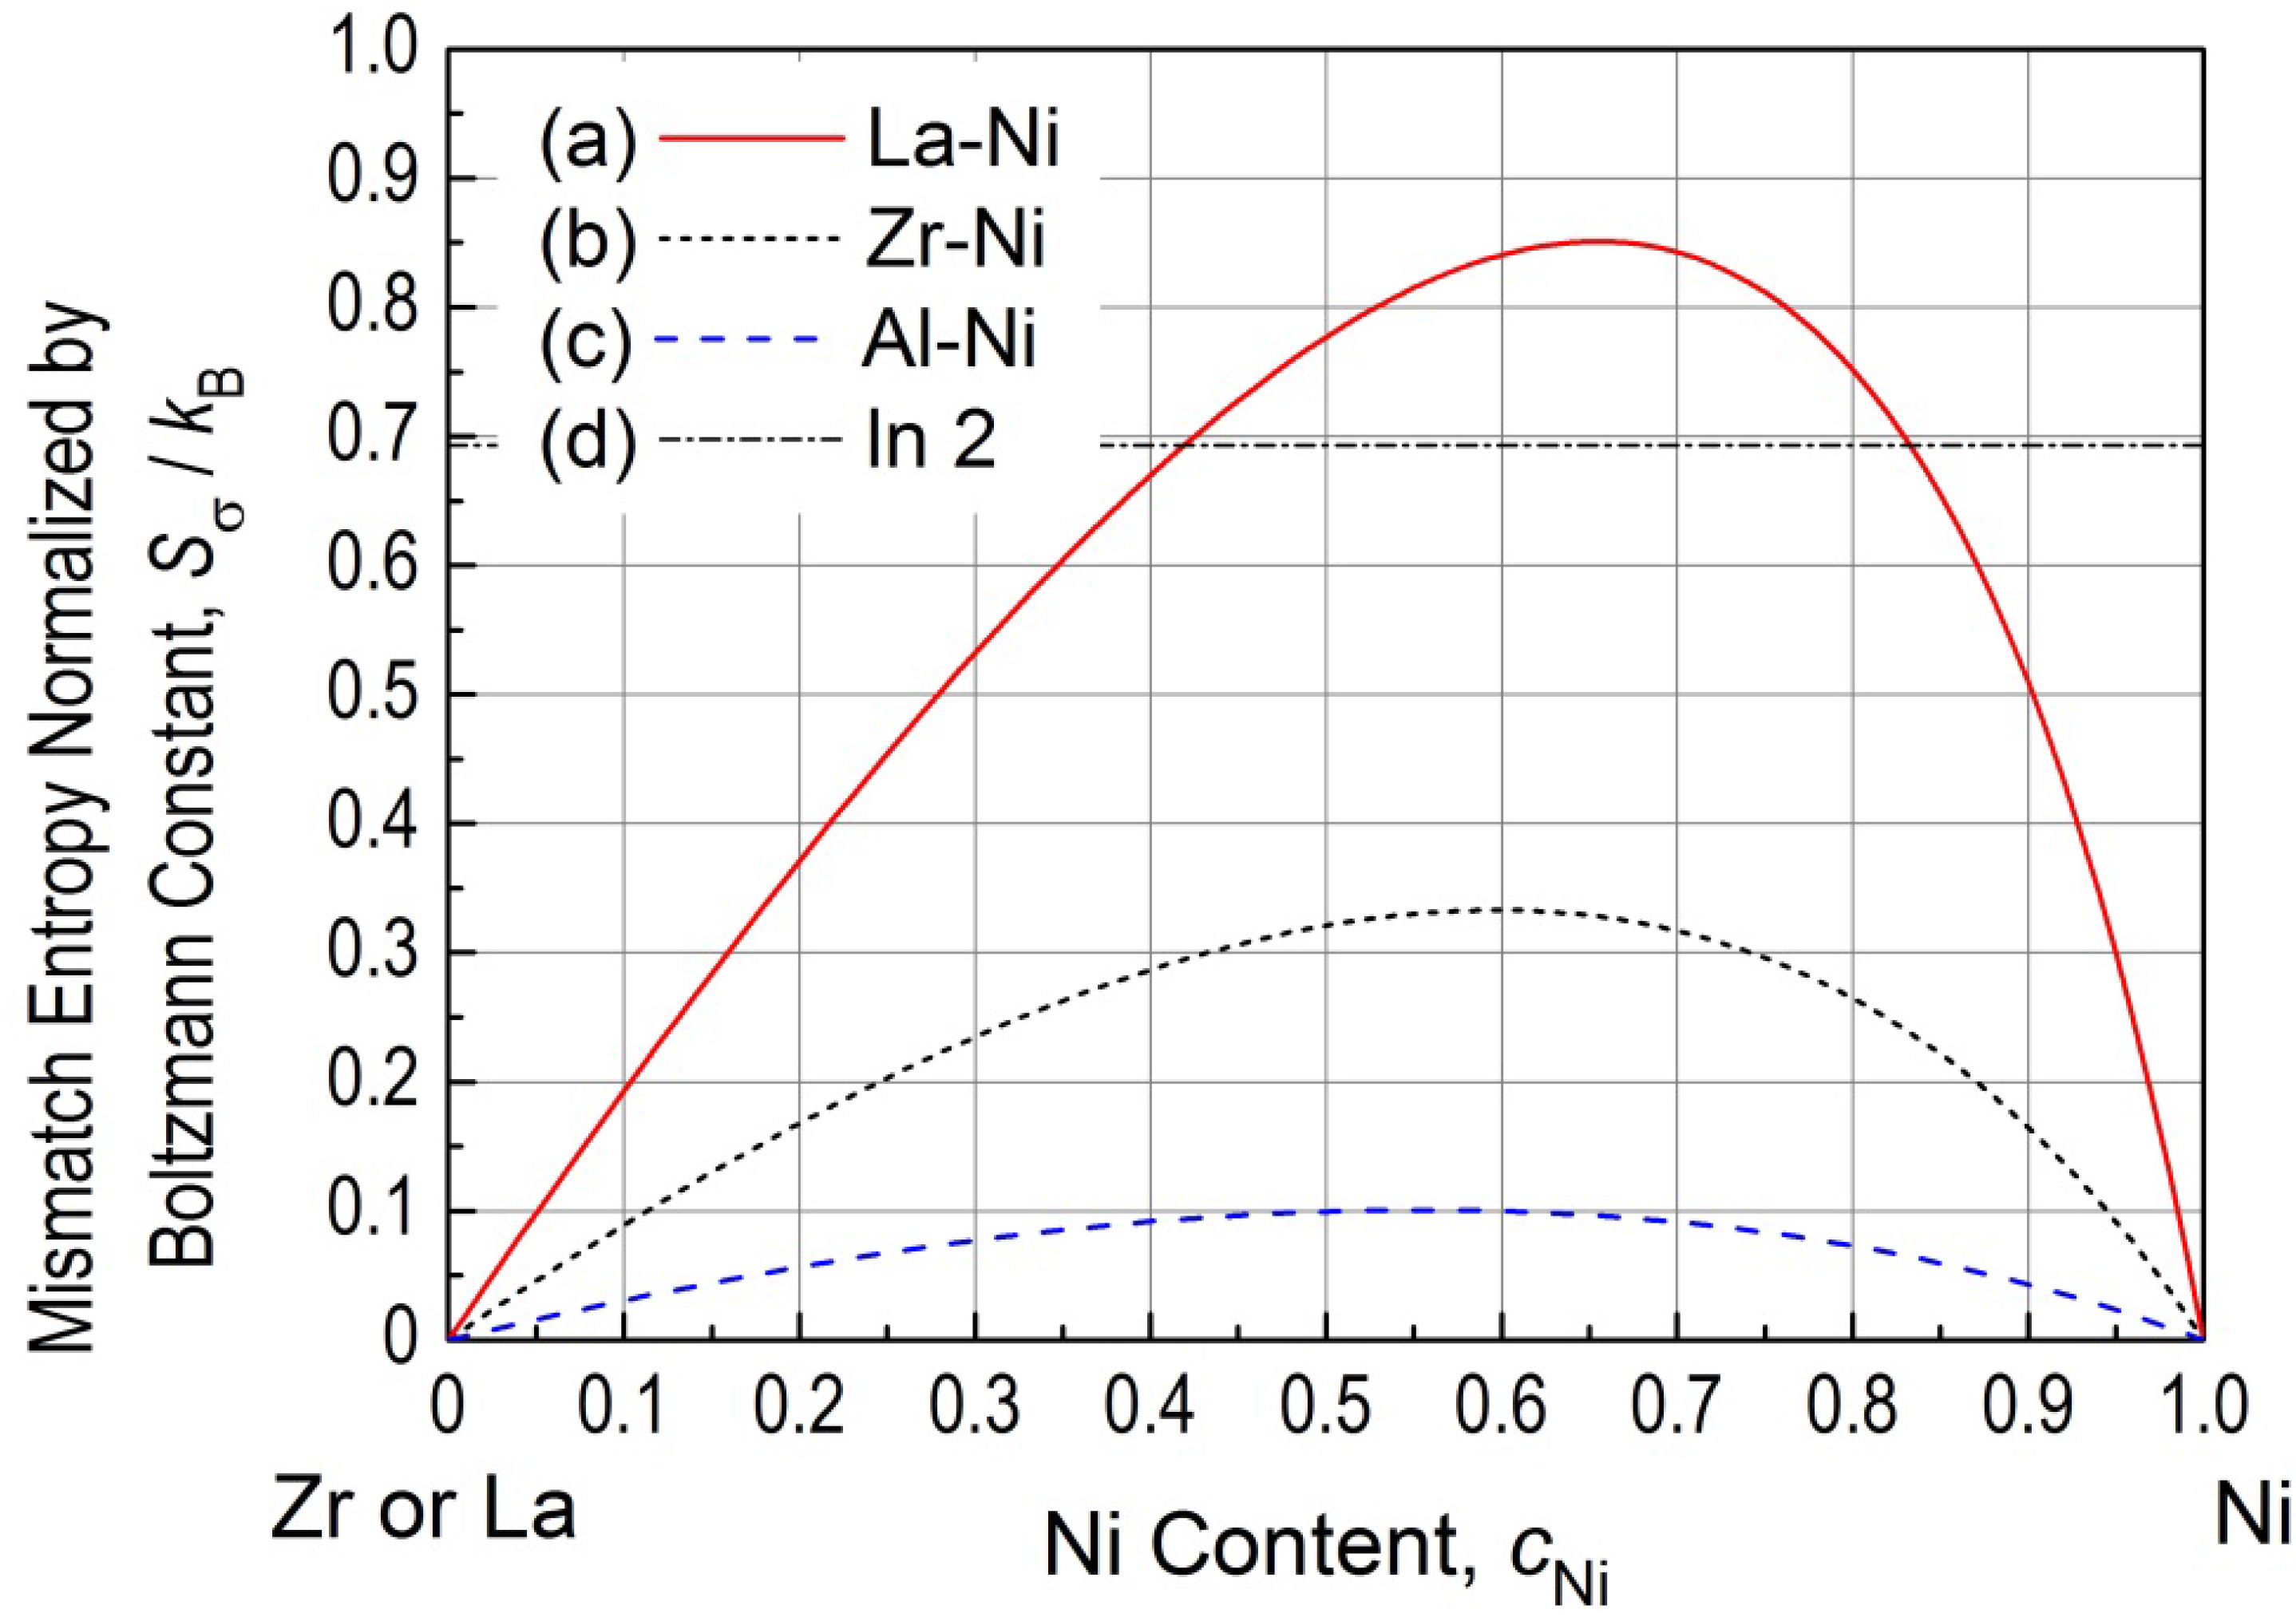
Figure 1 demonstrates the changes in
Sσ/
kB for (a) La-Ni, (b) Zr-Ni and (c) Al-Ni systems as a function of Ni content, together with (d) a line of ln 2 for comparison. All the three curves (a–c) show asymmetry against the equi-atomic composition (
cNi = 0.5), indicating that the effect of a case for smaller atoms embedded in an atomistic environment of larger atoms are not the same to that of the opposite case. The three curves exhibit the maximum values at (c
Ni,
Sσ/
kB) = (0.65, 0.851) for La-Ni, (0.60, 0.333) for Zr-Ni and (0.55, 0.101) for Al-Ni systems, indicating that atomic size effect is greater when the larger atoms of La, Zr or Al are solved as solution atoms in a Ni matrix with smaller atomic radius as a major atom. A possible explanation for this can be given when considering the opposite case of Ni as a minor and La, Zr or Al as major: The Ni atom will be placed at a interstitial site of the larger atoms, reducing the randomness of atomic arrangements of larger atoms in a system. Here, it should be noted that La-Ni system exhibits
Sσ/
kB values larger than ln 2 at
cNi ranging 0.42 to 0.82. The value of ln 2 is drawn in (d) with the broken dot line, and corresponds to
Sconfig./
kB at the equi-atomic composition for a binary alloy according to Equation (7) for N = 2. Thus, it should be noted that the La-Ni alloy near c
Ni ~ 0.5 possesses considerably as large
Sσ/
kB as the order of
Sconfig./
kB resulting from the atomic size differences only. This is an important aspect for BMG systems with appropriate large atomic size differences. The effect of atomic size difference is also important for the H-E alloy, but this effect can be ignored, since H-E alloys usually possess smaller atomic size differences than BMGs. In reality, some of the H-E alloys contains Ni and Al, but the maximum values is obtained at (
cNi,
Sσ/
kB) (0.55, 0.101), which is approximately 15% of ln 2. Thus,
Figure 1 suggests that both
Sσ/
kB and
Sconfig./
kB contributes for the formation of BMGs, whereas
Sconfig./
kB contributes greatly than
Sσ/
kB for H-E alloys. The limited contribution of
Sσ/
kB for H-E alloys with disordered solid solutions could be explained by the Hume-Rothery rules [
19] for forming solid solutions, which restrict the allowable maximum atomic size difference between solvent and solute elements in a solid solution. Specific explanations for stabilizing H-E alloys and destabilizing intermetallic compounds were given by Li
et al. [
20]. that
Sconfig. ~ 1.61R is almost the same magnitude to the melting entropy of most intermetallic compounds (about
R–2
R) and by Hu
et al. [
21]. that incorporation of Y element to an AlCoCrCuNiTi alloy resulted in forming intermetallic compounds due to the high chemical activity of Y element. Furthermore, it should be noted that competition between
Sσ/
kB and
Sconfig./
kB can also make the composition of the mostly-stable solid solution deviate from absolute equi-atomic composition that maximizes
Sconfig./
kB. This competition sometimes results in that the optimization of compositions is required for H-E alloys from complete equi-atomic compositions.
Figure 1.
Mismatch entropy normalized by Boltzmann constant (Sσ/kB) for La-Ni, Zr-Ni and Al-Ni binary systems. The broken-dot line exhibits Sσ/kB = ln 2, which corresponds to the value of Sconfig./kB at the equi-atomic composition for a binary alloy.
Figure 1.
Mismatch entropy normalized by Boltzmann constant (Sσ/kB) for La-Ni, Zr-Ni and Al-Ni binary systems. The broken-dot line exhibits Sσ/kB = ln 2, which corresponds to the value of Sconfig./kB at the equi-atomic composition for a binary alloy.
A peculiar feature of
Sσ/
kB for multicomponent system with more than two elements is that the maximum value of the
Sσ/
kB,
Sσ/
kB|
max, is habitually given in a sub-binary side with the maximum and minimum atomic radii in a composition diagram. In other words, the addition of any elements with intermediate radii cannot exceed the
Sσ/
kB|
max in the sub-binary alloy comprising the elements with the largest and smallest atomic radii.
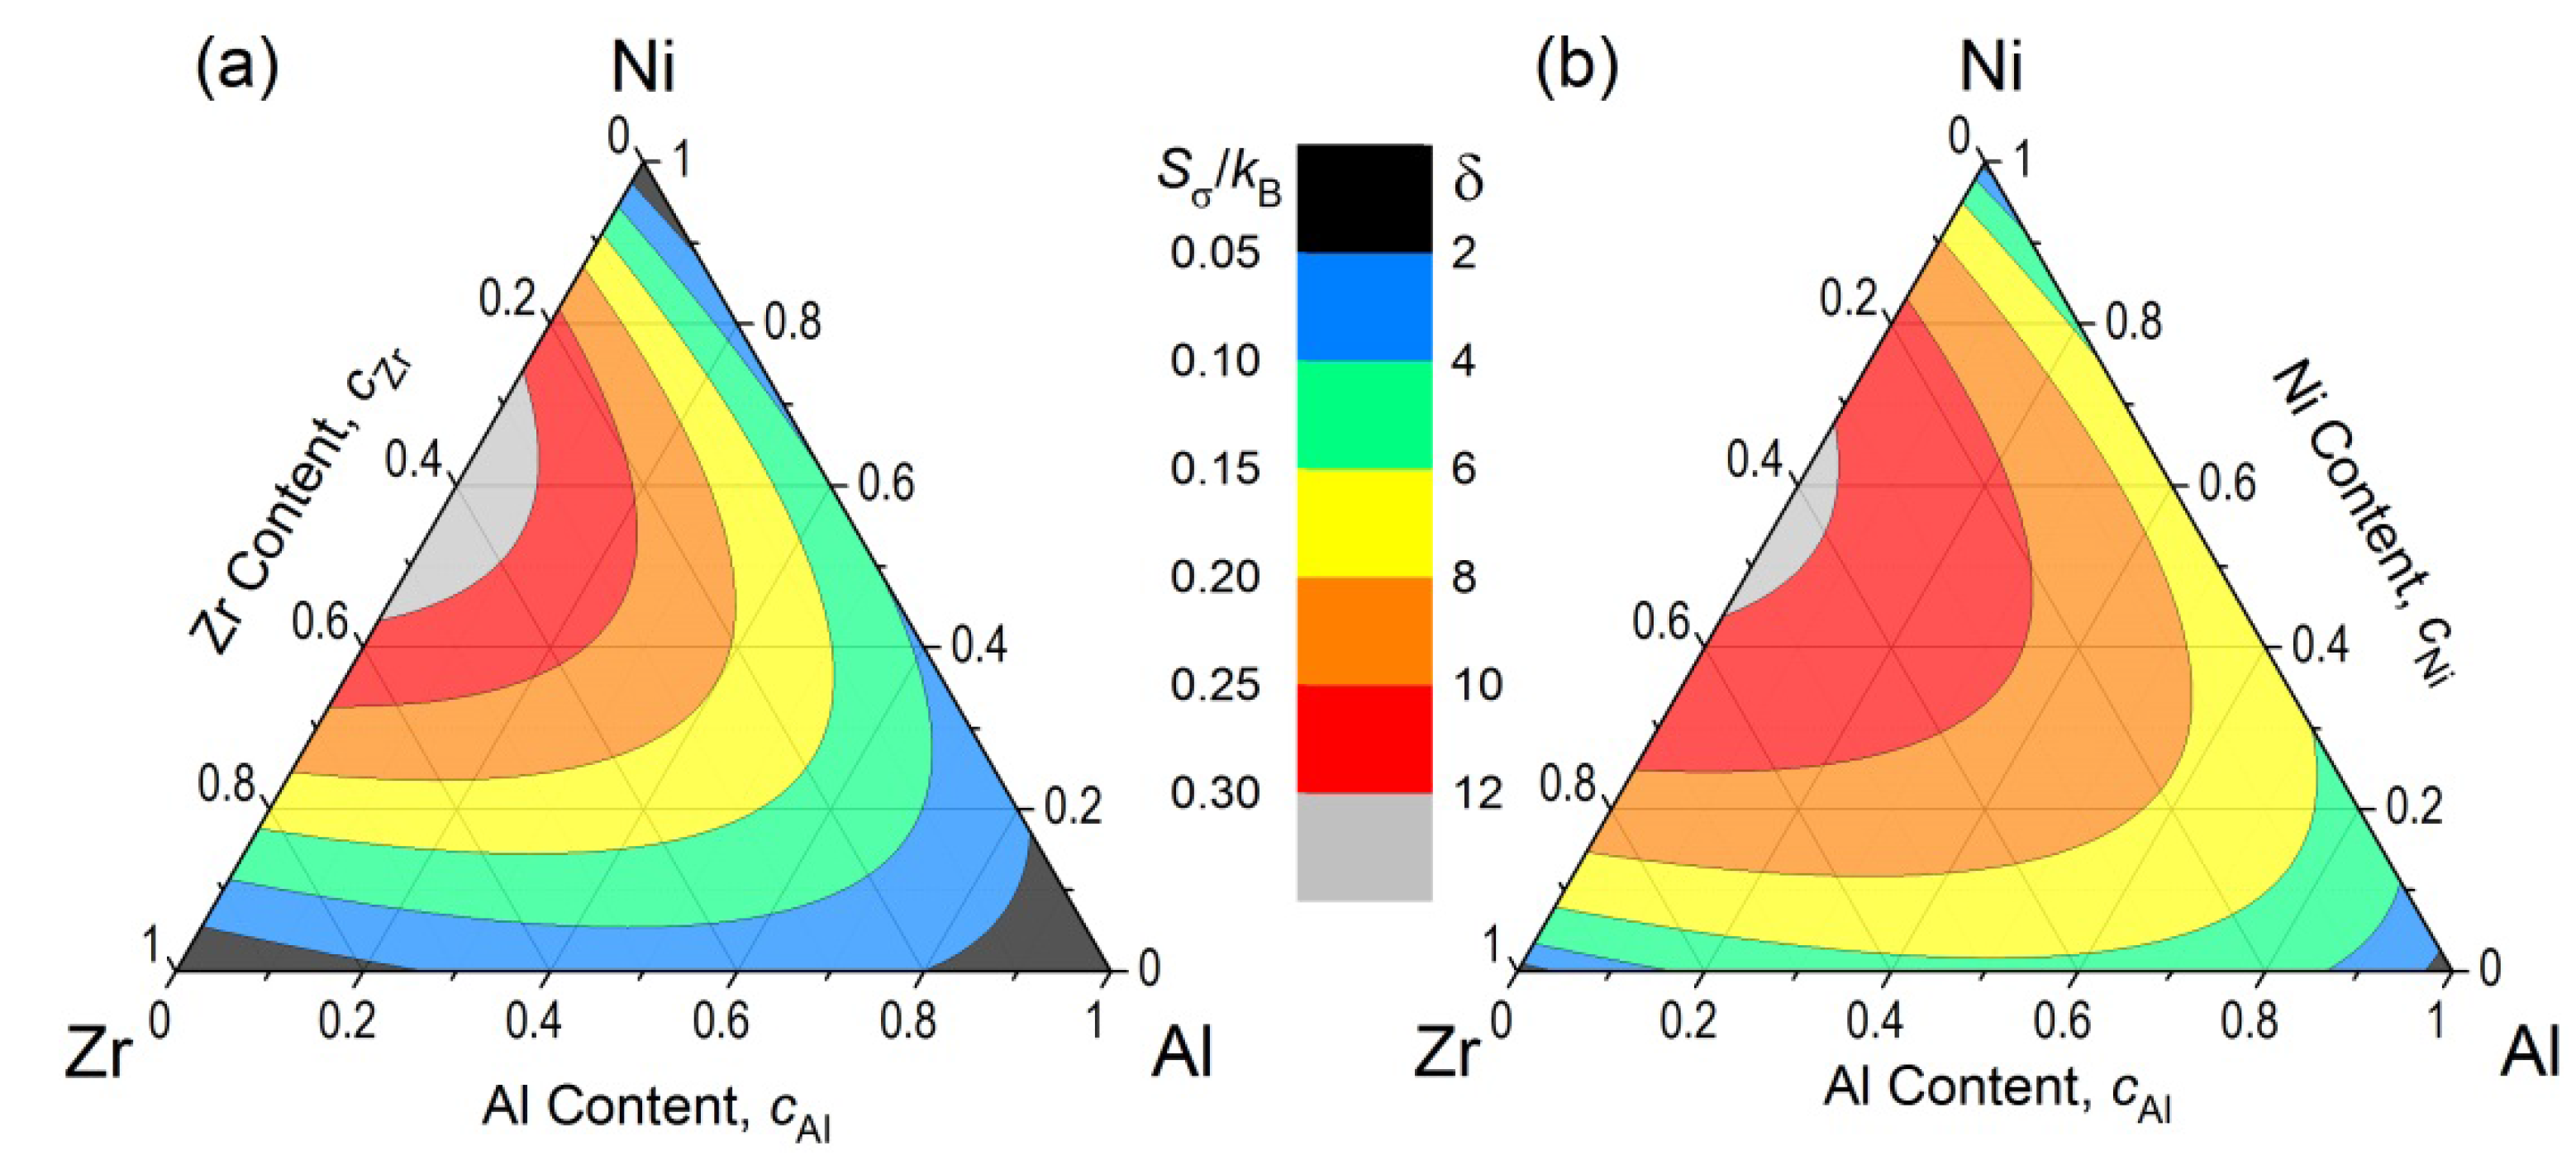
Figure 2a shows the changes in
Sσ/
kB plotted for Zr-Al-Ni systems. The maximum values of
Sσ/
kB is seen on the Zr-Ni sub-binary side around
cNi ~ 0.55, as is shown for Zr-Ni binary system in
Figure 1. The addition of Al with an intermediate atomic radius between Zr and Ni tends to decrease the
Sσ/
kB values along the Al corner. This tendency of
Sσ/
kB is essentially similar in δ as shown in
Figure 2b.
Figure 2 explains that
Sσ/
kB and
δ essentially exhibit the same tendencies in a composition diagram.
Figure 2.
(a) Mismatch entropy normalized by Boltzmann constant (Sσ/kB) and (b) Delta parameter (δ) represented in contour lines in a composition diagram for Zr-Al-Ni system.
Figure 2.
(a) Mismatch entropy normalized by Boltzmann constant (Sσ/kB) and (b) Delta parameter (δ) represented in contour lines in a composition diagram for Zr-Al-Ni system.
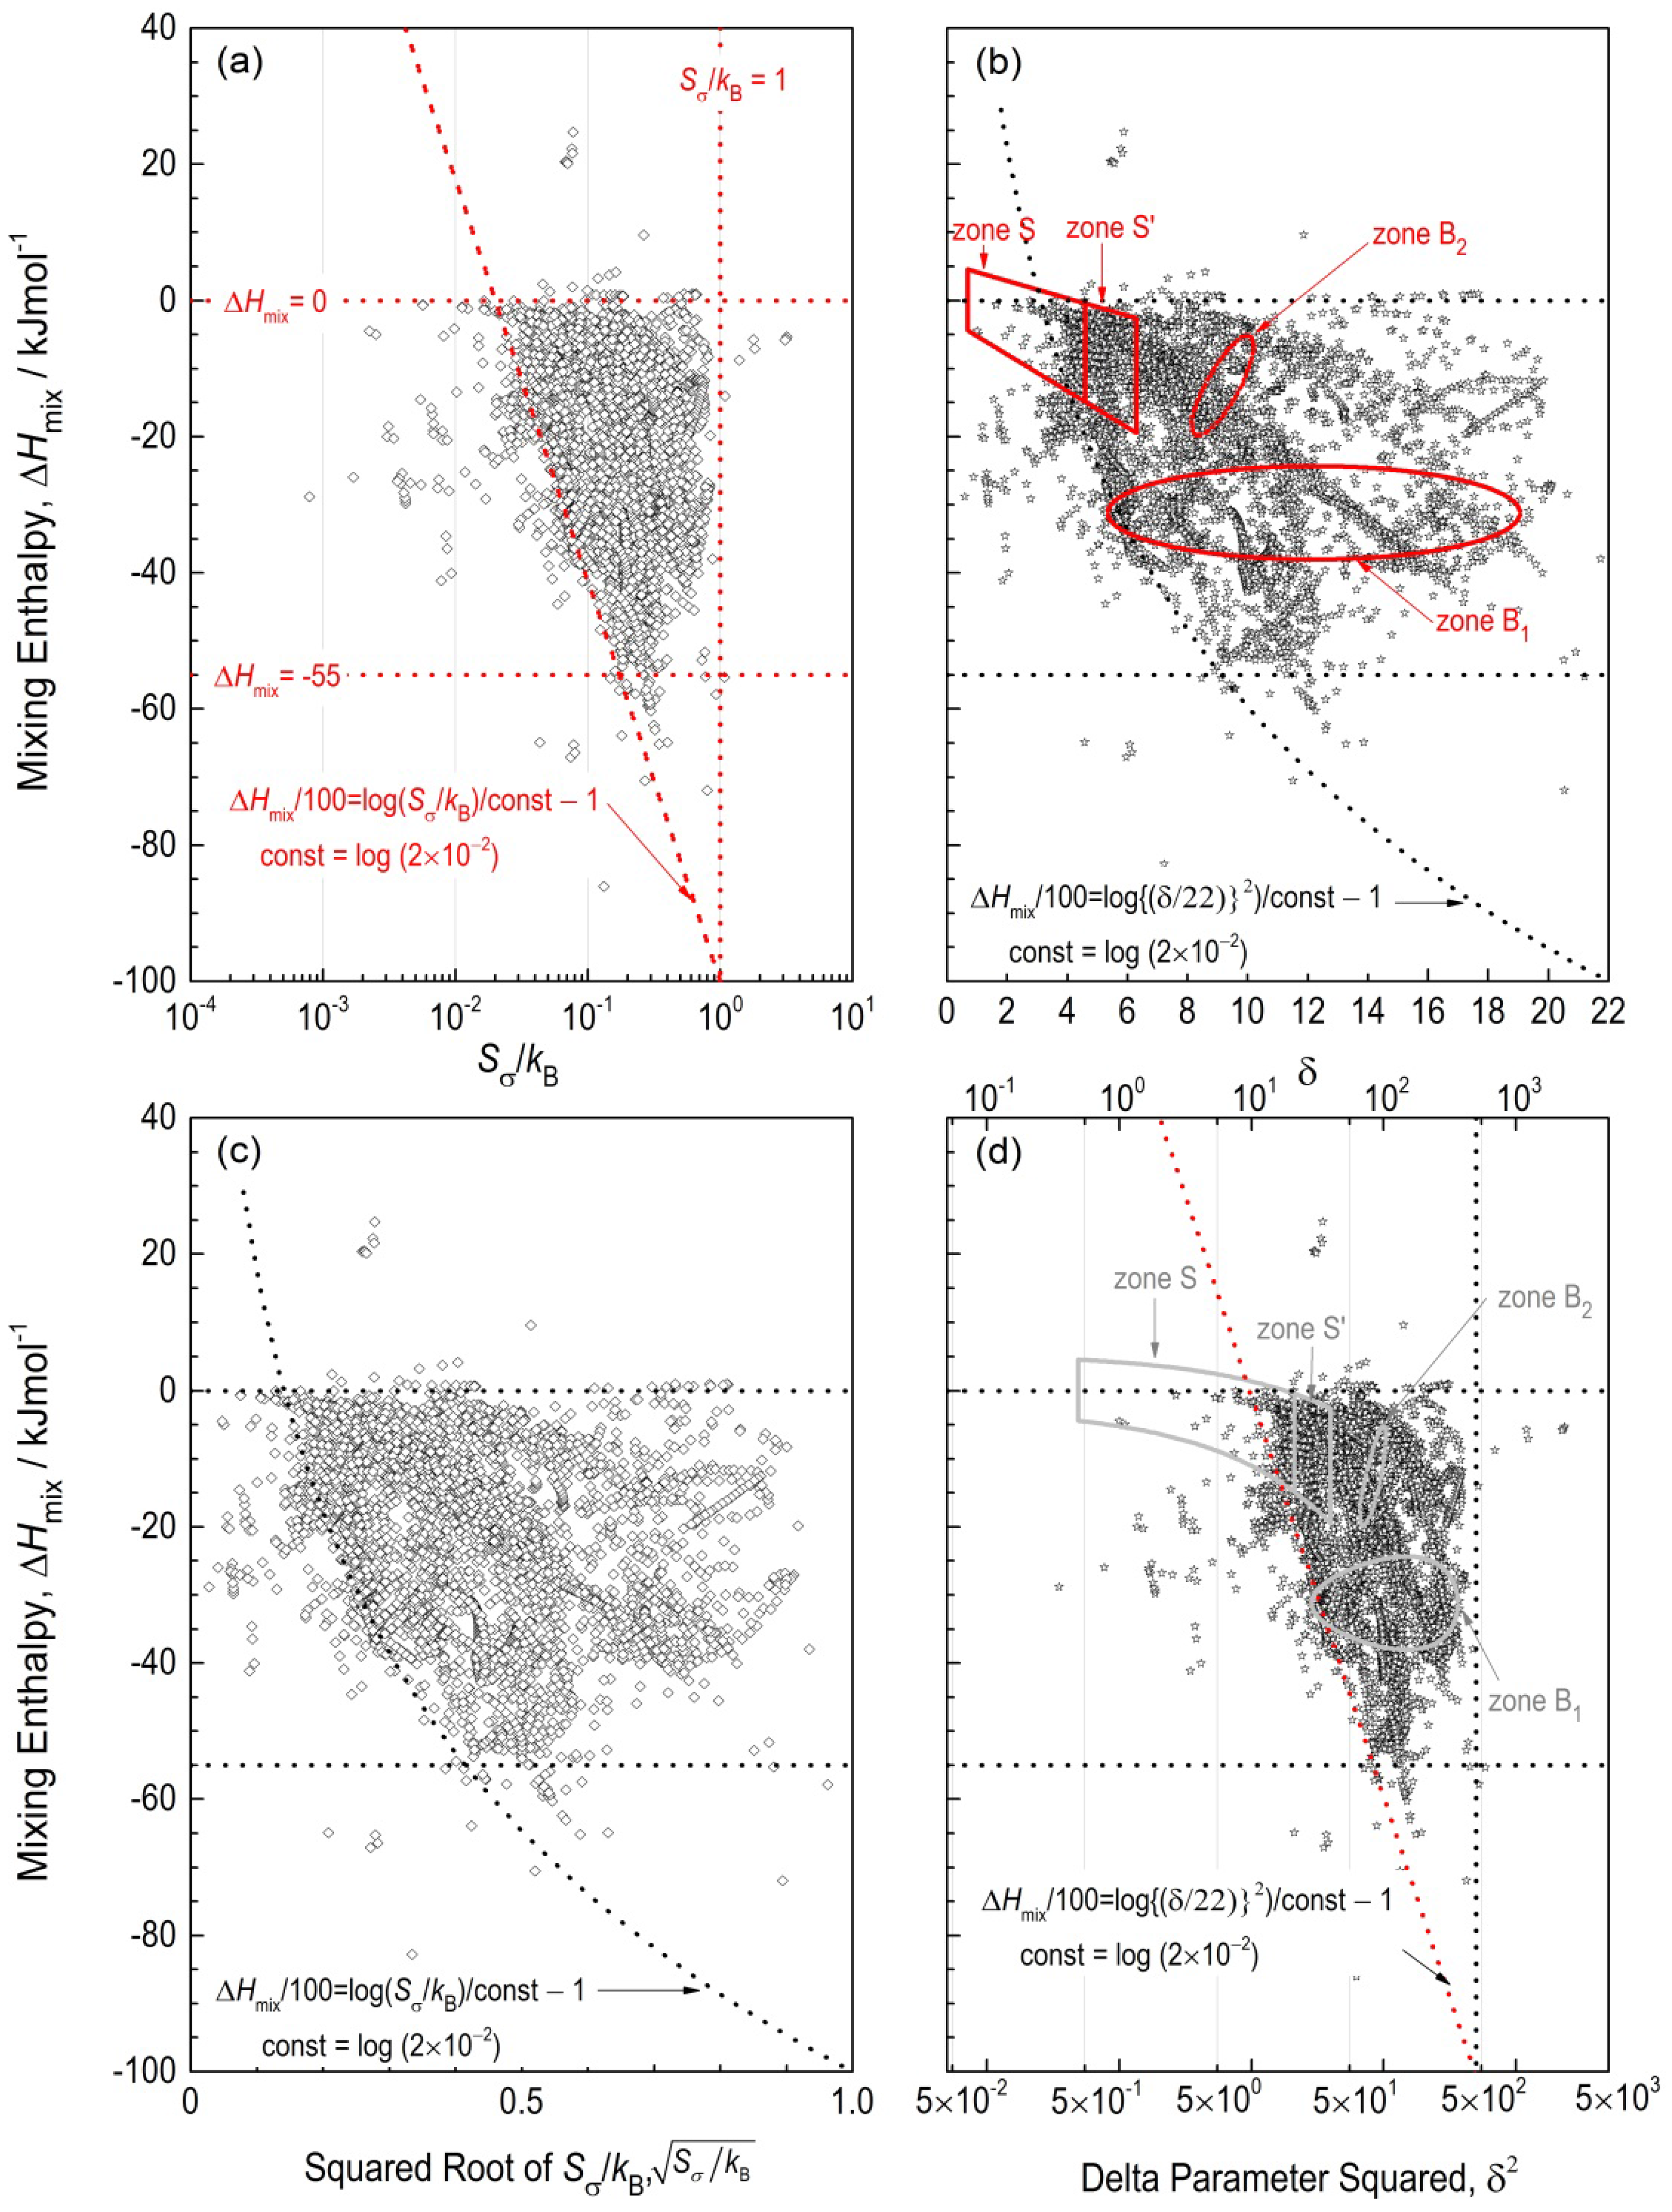
The
δ is frequently used in analyzing the features of H-E alloys, in particular, in a form of Δ
Hmix–
δ diagram [
12]. The Δ
Hmix–
δ diagram has the same concept to Δ
Hmix–
Sσ/
kB diagram [
16], which was reported in the authors’ early study to perform a statistical analysis of the effect of the second and third factor in alloy design for amorphous alloys including BMGs. These diagrams are similar in point that the values of Δ
Hmix,
δ and
Sσ/
kB were calculated as a function of composition where Δ
Hmix was calculated according to Equation (8). The calculation results of Δ
Hmix–
Sσ/
kB and Δ
Hmix–
δ diagrams for the ternary amorphous alloys are shown in
Figure 3, together with the plots of H-E alloys and BMGs. Here, it should be noted that x-axes in
Figure 3a, d are in a logarithm scale for
Sσ/
kB and δ
2, respectively.
Figure 3a, b are the original diagrams showing the relationships between Δ
Hmix–
Sσ/
kB [
16] and Δ
Hmix–
δ, [
12] respectively. On the other hand,
Figure 3c, d are other formulations of the diagrams for
Figure 3a, b.
Figure 3a, b show that no specific relationships are found between log (
Sσ/
kB) and
δ, since the plots of the amorphous alloys with the same data source [
22] give different appearance in
Figures 3a, b. In contrast,
Figure 3(b,c) show clear similarities in plots of the ternary amorphous alloys. The plots in
Figure 3b, c suggest that a relationship
δ (or
Sσ/
kBδ2) holds for the ternary amorphous alloys. On the basis of this relationship,
Figure 3 d with logarithm scale for x-axis (
δ2) is drawn by expecting that
Figure 3(d) of the correspondence with
Figure 3a. Here, it should be noted that x-axis (δ
2) in
Figure 3d is intentionally set up in the rage of 5
10−
2 to 5
10
3 for the correspondence between
Figure 3a, d. Thus, it is shown that two sets of
Figure 3a, d and
Figure 3b, c are identical.
Figure 3.
(
a) Δ
Hmix–
Sσ/
kB and (
b) Δ
Hmix–
δ diagrams for the 6150 ternary amorphous alloys from 351 systems [
22]. The trapezoid surrounded by broken lines in
Figure 3a indicates the threshold values, in which ternary amorphous alloys are formed, whereas zones S, S′, B’s in
Figure 3b exhibit the zones for H-E alloys with disordered solid solutions, H-E alloys with ordered solid solutions and BMGs, respectively, acquired form literature [
12]. The solid and broken lines to in red to show the zones and areas demonstrate the original results, whereas black or gray ones are converted ones. Some of the data for Si-Ti-Zr ternary amorphous alloys in the original database [
12] for Si and Ti contents were corrected according to the original reference [
23], resulting in change in the plots in the original literature [
16] in the areas of right triangle surrounded by broken line in
Figure 3a. The x-axis (δ
2) in
Figure 3d is intentionally set up in the rage of 5
10
−2 to 5
10
3.
The actual features of H-E alloys and BMGs are analyzed with the help of the plots of ternary amorphous alloys based on the two sets of diagrams mentioned above.
Figure 3b shows that the density of the plots of the ternary amorphous alloys in zone S in Δ
Hmix–
δ diagram are less, in particular, at a part of the half to two-thirds from the left-side in zone S. This indicates that Δ
Hmix and
δ for most of the H-E alloys in zone S differ from those for the ternary amorphous alloys. On the other hand, zone S′ for ordered alloys with ordered solid solutions are covered by the plots of the ternary amorphous alloys, indicating that the ordered alloys has the same trends with amorphous alloys. Besides, the half-down of the ellipse of zone B1 almost matches the boundary of the plots in
Figure 3b. These results for zones S, S′, B
1 and B
2 were firstly clarified by computing Δ
Hmix, δ and
Sσ/
kB simultaneously in the present study.
Figure 3b revealed that the H-E alloys possess smaller atomic size difference than BMGs, which is shown in the fact that zone S is at the left side of zones B’s. In addition, the H-E alloys have the smaller and negative Δ
Hmix than BMGs. The H-E alloys with disordered solid solutions are distinguished from ordered equi-atomic alloys by the boundary to separate zones S and S′ at
δ = 4.6. The corresponding
Sσ/
kB value would be
< 0.2, and thus,
Sσ/
kB < 0.04, from
Figure 3(c) according to the similarity in plots in
Figure 3(b). The
Sσ/
kB = 0.04 is almost the half of the maximum of
Sσ/
kB for Al-Ni system shown in
Figure 1 and considerably smaller than ln 2. Hence, the effect of atomic size for H-E alloys in zone S is thermodynamically negligible. However, this relatively-small difference in atomic size than that for BMGs is quite enough to restrict the atomic diffusion in H-E alloys, leading to excellent mechanical properties even at high temperatures [
1]. In this sense, the H-E alloys possess an ideal atomic size differences to keep a simple single crystalline structure. The similarity in plots in
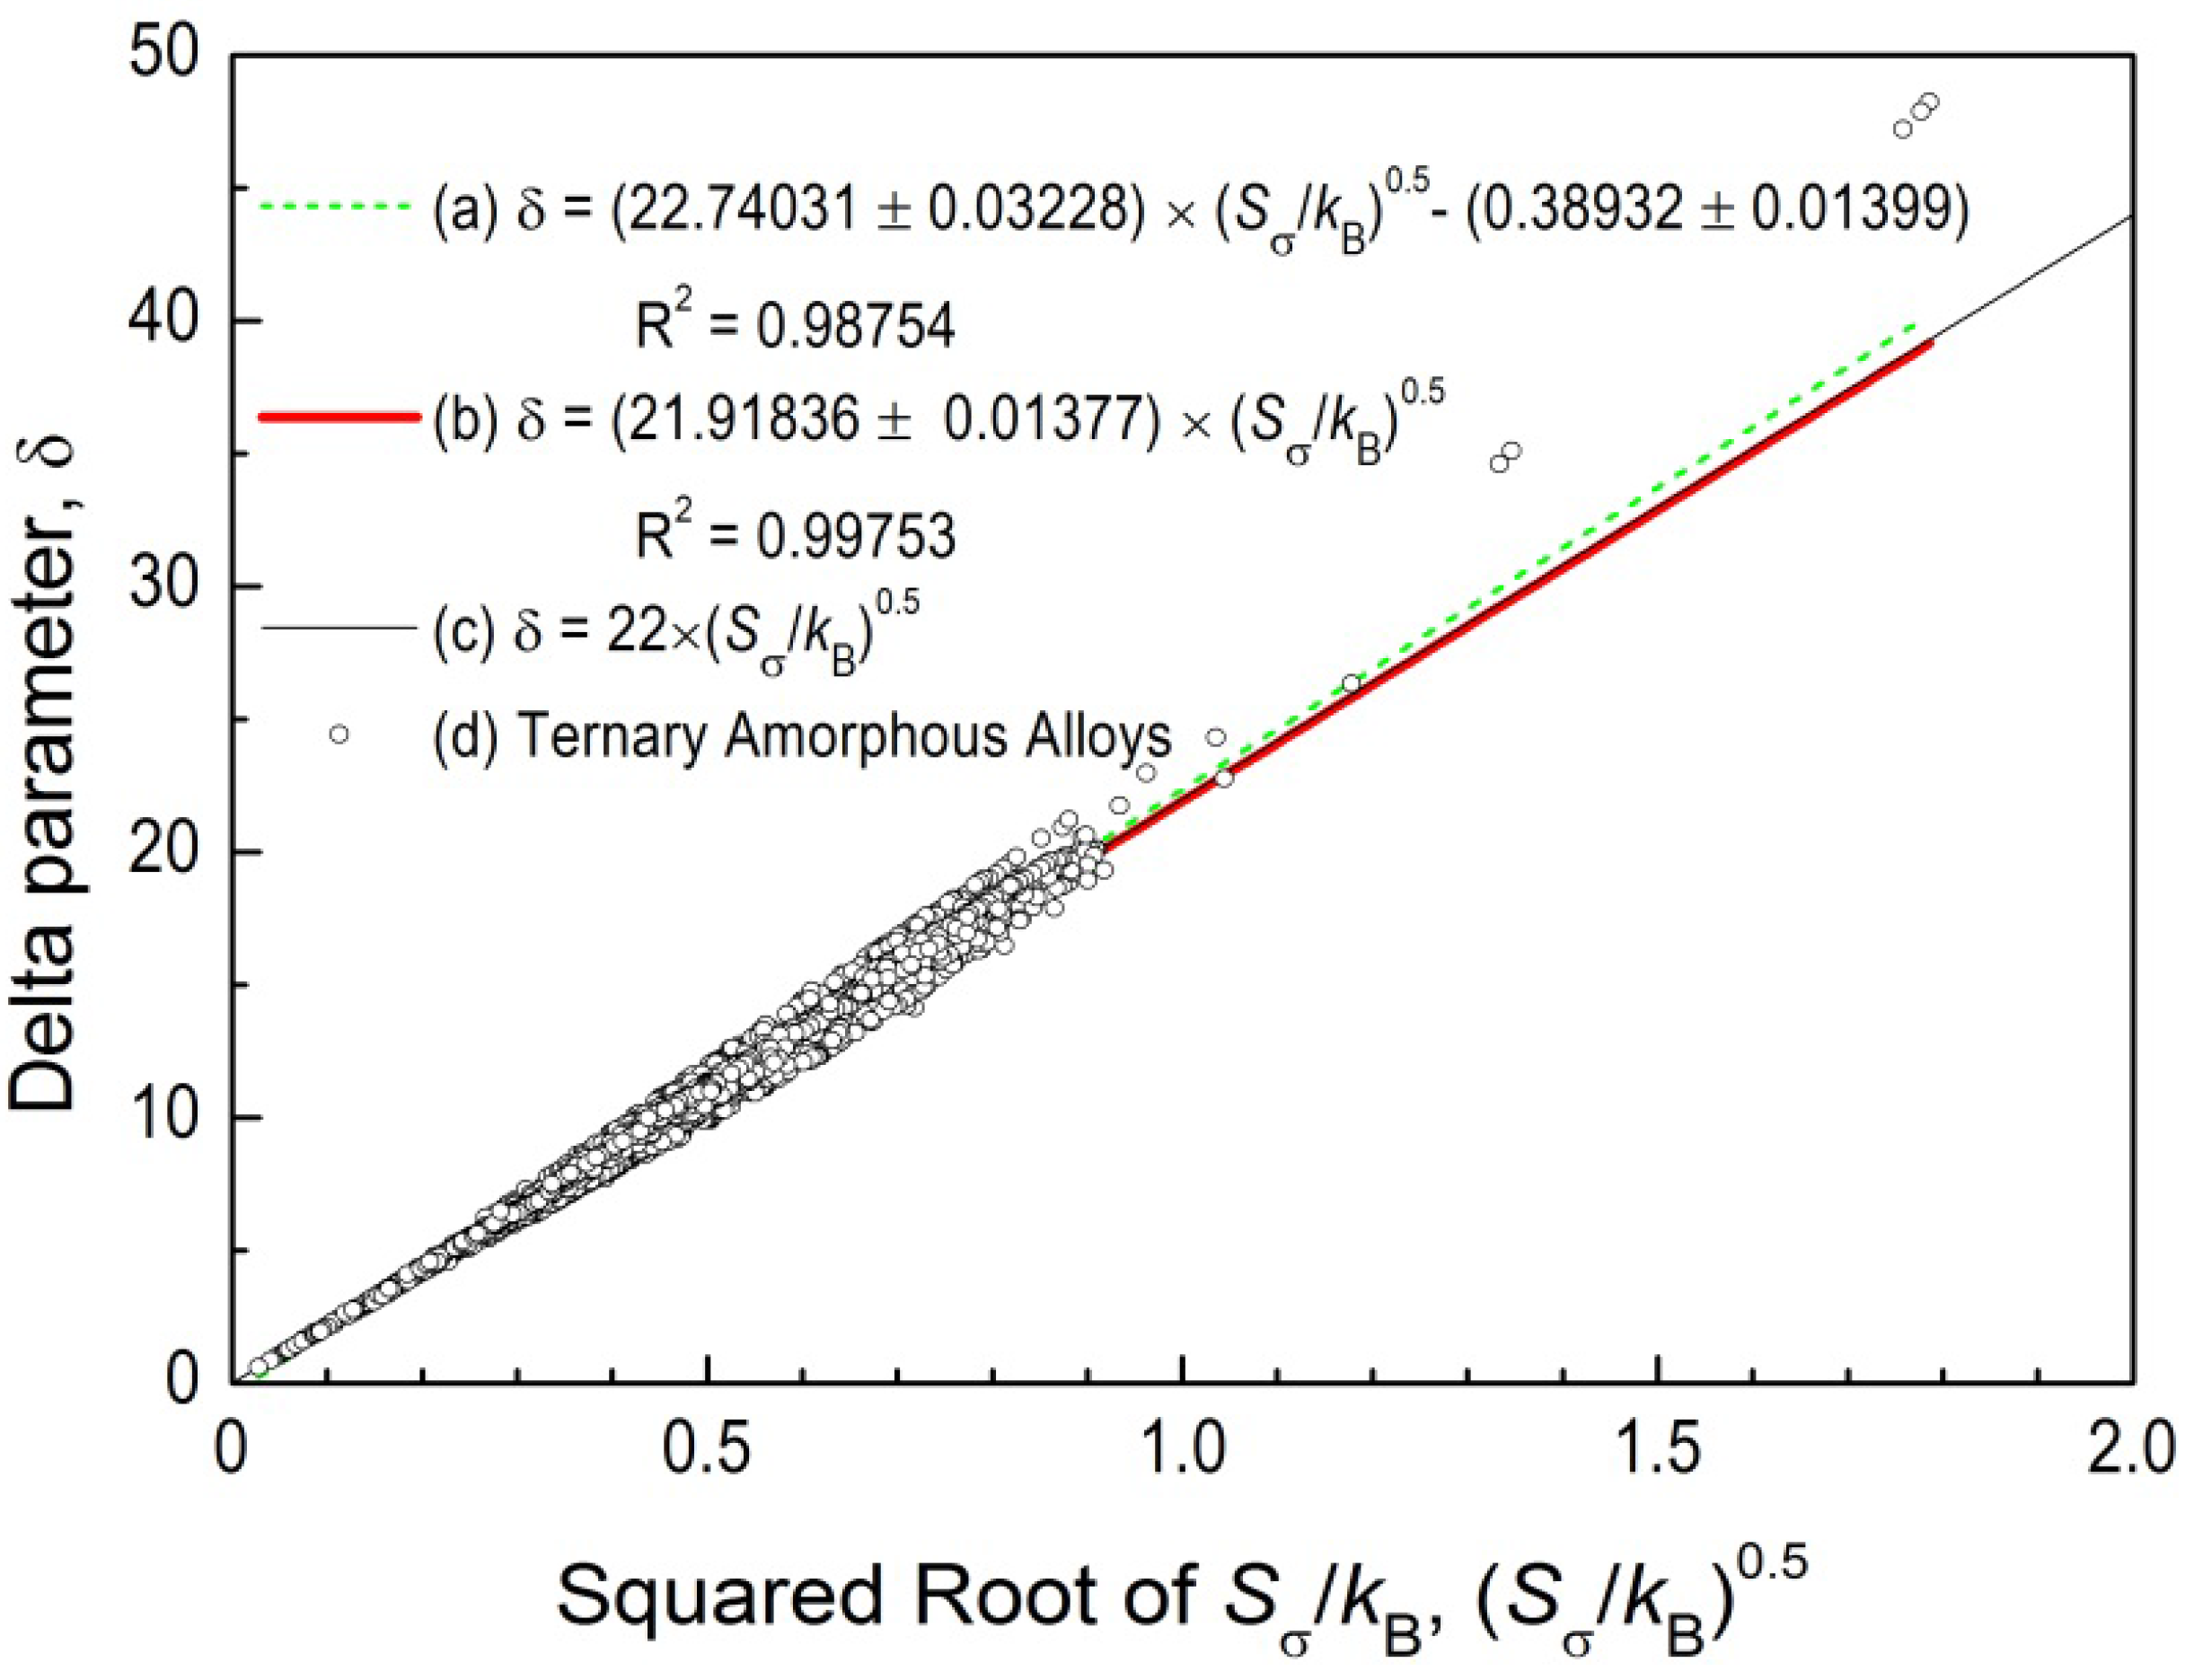
Figure 3(b,c) suggests a relationship
δ, leading to a relationship in Equation (11),
or
δ2 = 484 × (
Sσ/
kB) from the statistical analysis shown in
Figure 4. In
Figure 4, the ternary amorphous alloys are plotted with open circles in
Figure 4 to show the relationship between
and
δ, which is statistically approximated with linear formulae with and without intersection. As a result, the R-squared value (R
2) was 0.99753 for the linear approximation with intersect drawn in broken line (a), whereas R
2 = 0.99753 for the solid thick line (b) without intersection. The solid thin line (c) shows the relationship in Equation (1), indicating that the relationship between
and
δ for the ternary amorphous alloys can be approximated with Equation (11). The plots in
Figure 4 exhibit good agreement with line (c) at
< 0.25, whereas they show larger deviations at 0.25 <
~ 1.
Figure 4 suggests that Equation (11) holds for ternary amorphous alloys.
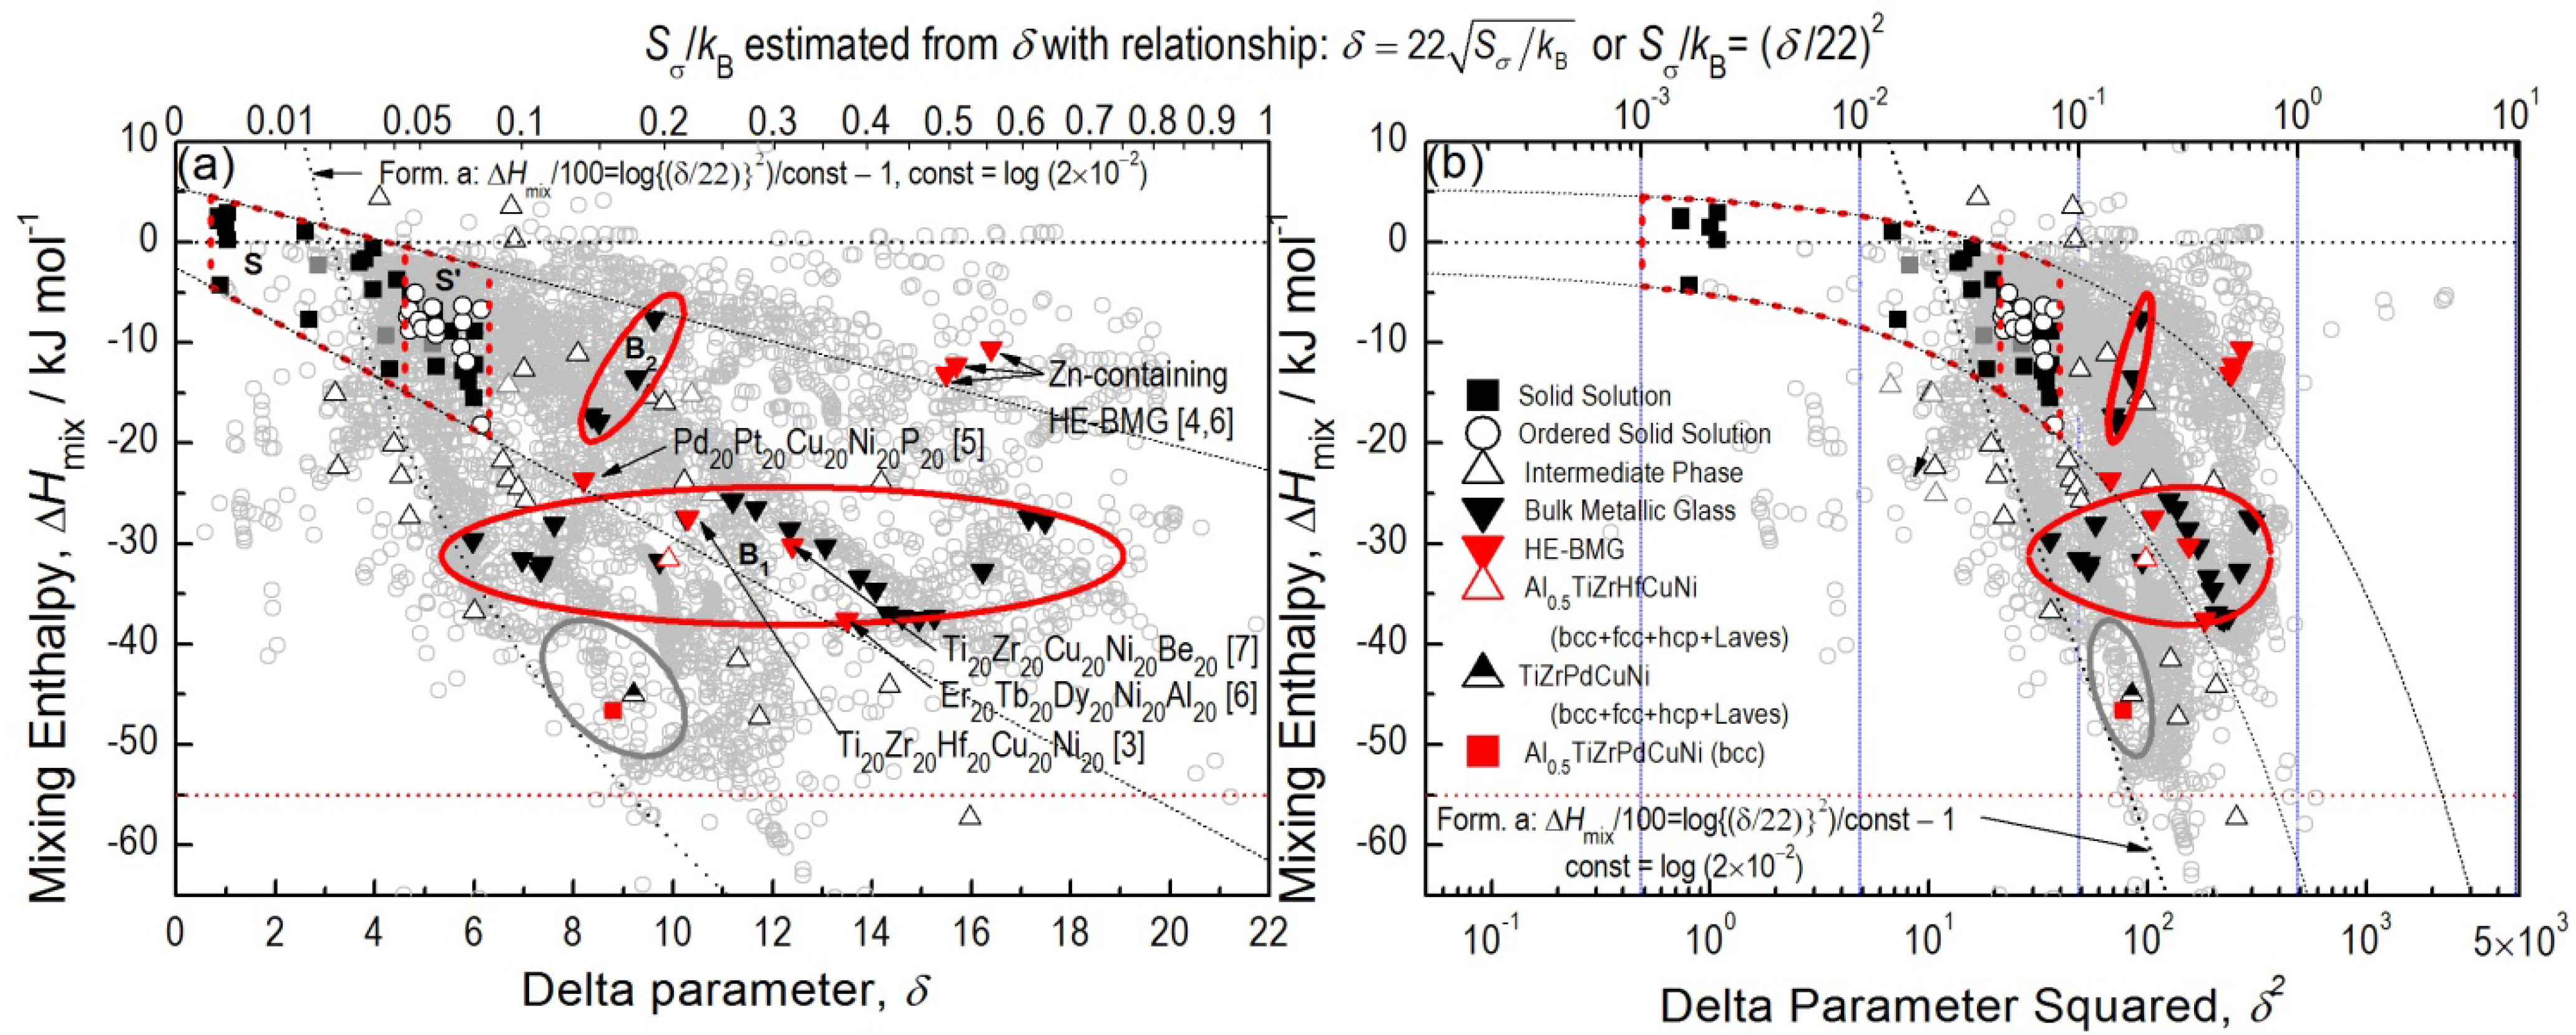
Further analysis was performed in detail by focusing on the relationships among H-E alloys, BMGs and H-E BMGs on the basis of Δ
Hmix–
δ and Δ
Hmix–
δ2 diagrams shown in
Figure 5.
Figure 5a is a revised Δ
Hmix–
δ diagram to the one reported in the authors’ previous work [
24] to which the sub x-axis according to Equation (11) and the data of 264 BMGs with the critical diameter (
dc) ranging 0.2–12 mm [
25] and 25 BMGs with
dc half inch (~ 12.3 mm) [
26] are added for comparison.
Figure 5a indicates that almost all the BMGs and HE-BMGs are plotted under
Sσ/
kB < 0.7 ~ ln 2. The highest
Sσ/
kB’s are seen in Zn-containing H-E BMGs [
4,
6], which are classified into Metal-Metal type comprising metallic elements only. On the other hand, some of the BMGs in zone B1 should contain Fe-TM-B (TM: transition metals) BMGs belonging to Metal-Metalloid type due to the inclusion of metalloid elements from B, C, Si, P and so forth. These BMGs belonging to Metal-Metalloid type also have high
Sσ/
kB, because of the considerable difference in
ri’s between TM and B. Here, it should be noted that Al
0.5TiZrPdCuNi H-E alloy with bcc single structure is separately plotted outside zone S [
24]. The Al
0.5TiZrPdCuNi H-E alloy was found in a procedure of finding H-E glassy alloy, and thus, the Δ
Hmix is larger and negative and
δ is larger than the conventional H-E alloys plotted in zone S. A reason for the Al
0.5TiZrPdCuNi H-E alloy is found outside zone S had been unclear [
24], but
Figure 5(a) newly provides the following possible insights. The Al
0.5TiZrPdCuNi H-E alloy is plotted at an area with gray solid ellipsoid where the ternary amorphous alloys are not plotted so densely as zone S′ and plotted as less densely as zone S. Thus, it is expected that new H-E alloys may found when the alloys have −50
Δ
Hmix/kJmol−
1 −40 and 8
δ 10 as well as 6
δ 8 along the curve “Form. a” in
Figure 3(a). This expectation to find out new H-E alloys with disordered solid solutions is only a necessary condition, but may open unprecedented new H-E alloys other than the area from zone S.
Figure 4.
Relationship between
δ and (
Sσ/
kB)
0.5 for the 6150 ternary amorphous alloys from 351 systems [
22]. The statistical analysis revealed the
δ ~ 22
(
Sσ/
kB)
0.5.
Figure 4.
Relationship between
δ and (
Sσ/
kB)
0.5 for the 6150 ternary amorphous alloys from 351 systems [
22]. The statistical analysis revealed the
δ ~ 22
(
Sσ/
kB)
0.5.
Figure 5 also provides other features of H-E alloys (zone S), ordered alloys (zone S′), BMGs (zones B
1 and B
2) and HE-BMGs. For instance, zone B
2 for Cu- and Mg-based BMGs tends to be plotted inside the area between the upper- and lower lines extrapolated from zones S and S′. Specifically, the Cu- and Mg-conventional BMGs are plotted along two lines in
Figure 5(a), in which a line is extrapolated from the upper-line of zones S and S′ with a form of Δ
Hmix = −1.28
δ + 5.44 and another one is Δ
Hmix = −0.8
δ + 3.5. Furthermore, HE-BMGs have a tendency to be plotted near the boundary of the extrapolated area. Furthermore, almost half of the BMGs in zone B
1 with higher δ values trends to be in the extrapolated area. These tendencies suggest that BMGs in zone B
2 and those in right-half of zone B
1 and HE-BMGs can be categorized into the same group materials in point that their plots are within the lines extrapolated from zones S and S′ in
Figure 5. This can be a universal interpretation of the H-E alloys, BMGs and HE-BMGs obtained from the statistical analysis. Hence, the results obtained in the present study to correlate
Sσ with δ as
Sσ/
kB ~ (
δ /22)
2 provides the mutual understandings among the H-E alloys, BMGs and HE-BMGs, and will be useful for further development of the alloys in near future. The authors have succeeded in correlating
Sσ/
kB with
δ, where the former and latter are separately used for describing the atomic size differences for BMGs and H-E alloys, respectively. The authors anticipate that more new H-E alloys with disordered solid solutions. are found based on the results of the present study, as the Al
0.5TiZrPdCuNi H-E alloy found in a procedure of developing new H-E glassy alloy can be explained in the present study.
Figure 5.
(a) ΔHmix–δ and (b) ΔHmix–δ2 diagrams, in which the data of H-E alloys, ordered alloys, intermetallic phases and BMGs including HE-BMGs. The Sσ/kB is estimated from δ with a relationship: Sσ/kB = (δ/22)2.
Figure 5.
(a) ΔHmix–δ and (b) ΔHmix–δ2 diagrams, in which the data of H-E alloys, ordered alloys, intermetallic phases and BMGs including HE-BMGs. The Sσ/kB is estimated from δ with a relationship: Sσ/kB = (δ/22)2.
