Article

Performance Degradation Assessment of Rolling Element Bearings Based on an Index Combining SVD and Information Exergy

1
National Center for Materials Service Safety, University of Science and Technology Beijing, Beijing 100083, China
2
School of Mechanical Engineering, University of Science and Technology Beijing, Beijing 100083, China
3
Department of Industrial and Manufacturing Engineering, Wichita State University, Wichita, KS 67226, USA
*
Author to whom correspondence should be addressed.
Entropy 2014, 16(10), 5400-5415; https://doi.org/10.3390/e16105400
Submission received: 21 July 2014 / Revised: 15 September 2014 / Accepted: 10 October 2014 / Published: 16 October 2014
(This article belongs to the Special Issue Exergy: Analysis and Applications)

Abstract

:
Performance degradation assessment of rolling element bearings is vital for the reliable and cost-efficient operation and maintenance of rotating machines, especially for the implementation of condition-based maintenance (CBM). For robust degradation assessment of rolling element bearings, uncertainties such as those induced from usage variations or sensor errors must be taken into account. This paper presents an information exergy index for bearing performance degradation assessment that combines singular value decomposition (SVD) and the information exergy method. Information exergy integrates condition monitoring information of multiple instants and multiple sensors, and thus performance degradation assessment uncertainties are reduced and robust degradation assessment results can be obtained using the proposed index. The effectiveness and robustness of the proposed information exergy index are validated through experimental case studies.
PACS Codes: 65.40.gd; 33.20.Tp; 07.05.Rm; 43.40.At; 91.55.Ax

1. Introduction

Rolling element bearings are among the most widely used elements and are also vulnerable links of rotary machinery, where their unexpected failure can cause costly downtime and unplanned maintenance activities. Therefore, it is of great significance to develop methods to ensure the reliable and cost-efficient operation of bearings [1]. In practice, bearings usually undergo degenerative processes from their normal states until final failure and sensors are installed to monitor the running status of bearings or the whole machine. The extraction of faulty features from these health monitoring signals and then performing intelligent detection and identification of bearing faults has been studied extensively in the past three decades. Mainly based on vibration signature analysis, many fault diagnosis methods combining advanced signal processing and pattern recognition approaches have been proposed for bearing diagnostics [24]. Although bearing diagnostics can be helpful for the implementation of condition-based maintenance (CBM) by effectively diagnosing bearing faults, they cannot reveal bearing degradation trends or be used for estimation of remaining useful life. Recently, performance degradation assessment beyond fault diagnosis has been proposed and received more and more attention for its benefits in implementing CBM strategies [5,6]. Performance degradation assessment methods cannot only detect early machine faults, but they can also be used for prognosis since the assessed current machine health condition is the basis of future remaining useful life estimation.
Like fault diagnosis, performance degradation assessment basically consists of two steps, namely feature extraction and degradation assessment. To date, a lot of work covering these two aspects has been published. Statistical moments of vibration or acoustic emission signals in the time/frequency domains, such as root mean square (RMS) and kurtosis, have been frequently used as features for machine performance degradation assessment [79]. Spectral entropy was proposed by Pan et al. [10] as a complementary index for bearing degradation assessment and the results of both simulations and experiments showed that spectral entropy effectively reflected the bearing degradation process. Hong et al. [11] developed Lempel–Ziv complexity to measure the severity of bearing faults and case studies demonstrated that this complexity was mainly affected by fault severity and was less susceptible to other factors such as working conditions. The manifold learning algorithm of local and nonlocal preserving projection was proposed by Yu [12] for feature extraction and bearing performance degradation was evaluated using a multivariate statistic process control approach. Directly measuring deviations away from benchmark normal conditions, synthesized health indexes such as those based on logistic regression and support vector data description (SVDD) methods have also been constructed for machinery degradation evaluation [13,14]. Hong et al. [15] combined wavelet packet and empirical mode decomposition (EMD) for feature extraction and bearing health states were assessed using a synthesized confidence value derived from self-organization mapping (SOM). For the degradation assessment aspect, many methods, mainly of the machine learning category, such as cerebellar model articulation controller (CMAC) and hidden Markov model (HMM) have been proposed [1619] for machine degradation assessment. Zhang et al. [20] used particle swarm optimization-support vector machine (PSO-SVM) for fault location and degradation classification of roller bearings and experimental studies showed that the proposed method had good generalization capability in the situation of small training samples. A deep belief network (DBN) was employed by Tamilselvan et al. [21] for multi-sensor health state classification and a case study indicated that the DBN model generally resulted in better health diagnosis performance. Relevance vector machine (RVM) combined with survival probability analysis was proposed in [22] for machine degradation assessment with censored data and a case study on bearings verified its effectiveness. The number of performance degradation assessment methodologies based on information fusion methodologies integrating multi-source information has been increasing recently [2325]. Oil analysis, microscopic debris analysis and vibration analysis features were fused by principal component analysis (PCA) for rolling bearing condition monitoring in [26]. SVDD and fuzzy c-means (FCM) were combined in [27] for bearing performance degradation assessment and experimental results showed that the hybrid model was robust to outliers.
Though much work has been done for performance degradation assessment, challenges exist in effectively and accurately assessing the performance degradation of bearings. One of the challenges is how to extract more consistent features for degradation assessment since previous research has found that different features may only be applicable for specific degradation modes or be useful at certain service stage of bearings. For example, kurtosis is sensitive to impulse faults (especially in the incipient degradation stage) but it decreases to normal-like levels as the damage grows, while RMS always correlates well with degradation severity, but it is not sensitive to minor abnormalities [28,29]. Another challenge is that bearing degradation evaluation is subject to uncertainty effects due to temporal variabilities of physical degradation processes, operating condition (such as speed and load) variations and sensor errors, etc. For robust performance assessment of bearings, such uncertainties should be reduced [30,31]. However, published bearing degradation assessments are mostly based on single or multi-sensor information acquired at one instant or under one usage condition. These methods can be effective in alleviating sensor errors, but they are of little help to reduce uncertainties due to operational condition variations and temporal variabilities of the physical degradation.
To solve the above problems for better performance degradation assessment of bearings, a novel information exergy index combining information exergy and singular value decomposition is developed in this paper. Information exergy is a process information fusion method that simultaneously combines information of multiple instants (or operational conditions) and multiple sensors, and thus degradation assessment uncertainties can be reduced using the proposed information exergy index. Experimental studies on deep groove ball bearings are used to demonstrate the effectiveness and robustness of the proposed approach. The rest of the paper is organized as follows: Section 2 briefly introduces generalized information entropy and information exergy; Section 3 details the proposed information exergy index by singular value decomposition of the information exergy matrix feature and proposes degradation assessment based on the index; Section 4 demonstrates the developed information exergy index with case studies of ball bearings; and Section 5 summaries the presented research and future work.

2. Information Exergy

2.1. Generalized Information Entropy

Information entropy was firstly introduced by Shannon to measure the uncertainty of information [32]. Information entropy only depends on the probability mass function of the system symbol sequence and it increases with the increasing uniformity of the probability mass function. The above concept of information entropy has been generalized in a number of different ways by different researchers [10,3336] since the pioneering work of Shannon. In all, generalized information entropy H can be formulated as:
H = - i μ ( A i ) ln μ ( A i ) i μ ( A i ) = 1
where Ai, limited to AiAj = Φ (ij) and C = ∪Ai, is a division of the symbol sequence information C generated by the discrete system. The function μ(.) is the measurement defined on the dividing space, much like a probability mass function.
Based on the above definition, if proper division and measurement of the information presented by a symbol sequence are formulated, the generalized information entropy, as defined by Equation (1), can be evaluated. Like Shannon information entropy, generalized information entropy can work as an uncertainty measure of the symbol sequence generated by a system, and it becomes larger when the measurement function is more uniformly distributed. In the following, spectral information entropy (abbreviated as spectral entropy in [10]) will be used as an example to further demonstrate this evaluation process. For the spectral information entropy, the function μ(.) is defined as:
μ ( i ) = Y ( i ) i Y ( i )
where Y(i) is the i-th power spectrum of the symbol sequence Y={y1, y2, …, yL}. Following Equation (1), the same normalized form of generalized information entropy can be obtained as:
S E n = - i μ ( i ) log 2 μ ( i ) log 2 L
where L is the length of the symbol sequence and SEn is the spectral information entropy.
Spectral information entropy has been effectively used for speech signal analysis and bearing degradation assessment [10,33]. Other specifications of the generalized information entropy such as wavelet information entropy and multiscale permutation information entropy have also been formulated and applied for applications of mechanical and structural damage diagnosis [3436].

2.2. Information Exergy

Exergy has been mostly studied in the field of thermodynamics [37]. Referring to the concept of thermodynamic exergy, information exergy has been proposed in [38] for vibration faults diagnosis of rotating machinery and experimental studies on rotor test rig showed that common rotor defects were accurately identified. Structural damage diagnosis based on information exergy was studied in our previous paper [39] and promising results were obtained.
Information exergy is based on generalized information entropy and it fuses multi-instant and multi-sensor information. Before introduction of the information exergy, the concept of multi-instant information should be defined. Multi-instant information (or information of multiple instants) is multiple slices of time series acquired at sequential instants or under multiple operating conditions (such as speed and load) by one sensor, while one slice of time series refers to one waveform signal quickly sampled at one instant or under one operational condition by one sensor.
Formally, information exergy is cumulative function of generalized information entropy and its discrete form can be given as:
E ( m - 1 ) = j = 1 m - 1 H ( j ) + H ( j + 1 ) 2
where H(j) is generalized information entropy of the j-th slice of time series and E(m−1) is the (m−1)-th information exergy obtained from the first j slices of time series.
A vector E = [E(1), E(2),…, E(M − 1)]T (M is the total number of instants and T is the transposition operator) can be obtained by assigning all sequentially evaluated information exergy in a vector form. The information exergy vector integrates multiple pieces of condition monitoring information in sequential instants or possible operating conditions and process information is obtained instead of instant information, thus uncertainties of operational condition variations and temporal variabilities can be reduced using the information exergy vector.
While multiple sensors (sensing points) are equipped to monitor machine operational status in practical applications, an information exergy matrix F can be accordingly constructed by arranging information exergy vector E of each individual sensing point in different columns respectively, as:
F = ( H ( 1 , 1 ) + H ( 2 , 1 ) 2 H ( 1 , 2 ) + H ( 2 , 2 ) 2 H ( 1 , K ) + H ( 2 , K ) 2 j = 1 2 H ( j , 1 ) + H ( j + 1 , 1 ) 2 j = 1 2 H ( j , 2 ) + H ( j + 1 , 2 ) 2 j = 1 2 H ( j , K ) + H ( j + 1 , K ) 2 j = 1 M - 1 H ( j , 1 ) + H ( j + 1 , 1 ) 2 j = 1 M - 1 H ( j , K ) + H ( j + 1 , K ) 2 ) ( M - 1 ) × K
where K is the total number of sensing points and H(j, k) is the generalized information entropy of the j-th slice of time series at the k-th sensing points. Note that multi-sensor condition monitoring information is aggregated by putting information exergy vectors in columns, sensor errors can be further reduced using the information exergy matrix F for errors of one or more sensors can be compromised by the remaining sensors, thus robust machine condition monitoring can be expected based on information exergy matrix.
Multi-instant and multi-sensor information is integrated into a two-dimension information exergy matrix through information exergy analysis; however it is not convenient to use this matrix feature directly, especially for online machine health monitoring. To alleviate this difficulty, the mean value (Mv) and the standard deviation (Std) of the subtraction of two information exergy matrices, as well as the proximity (Pr) between two information exergy matrices have been proposed for fault diagnosis in [38,39]. In the following, another novel information exergy index is proposed by directly matrix transform of the information exergy matrix.

3. Information Exergy Index for Degradation Assessment

3.1. Information Exergy Index Combining SVD and Information Exergy

A few proposed information exergy indexes are simply statistical parameters of the information exergy matrix obtained by entry or column unfolding of the matrix, while interactions within the information exergy matrix are lost. The information exergy matrix should be treated as a whole when extracting compact information exergy index, so singular value decomposition (SVD) is employed here to extract information exergy index from the information exergy matrix.
SVD is a generalization of the eigen-decomposition that is defined only for squared matrices and now it has become a general linear algebra technique for matrix analysis. The main idea of SVD is to decompose a matrix into three simple matrices, i.e., two orthonormal matrices and one diagonal matrix [40].
Formally, for a given information exergy matrix F of size (M−1)×K, its SVD is as:
F ( M - 1 ) × K = U ( M - 1 ) × ( M - 1 ) Λ ( M - 1 ) × K V K × K T
where U is a (M−1)×(M−1) orthogonal matrix and V is a K×K orthogonal matrix, while Λ is a (M−1)×K diagonal matrix as:
Λ = [ Σ 0 0 0 ] ( M - 1 ) × K Σ = d i a g ( σ 1 , σ 2 , , σ r a n k ( F ) )
where all σi (for i = 1, 2,…, rank(F)) are called singular values of the matrix F and they are arranged in a descending order, i.e., σ1 ≥ σ2 ≥ … ≥ σrank(F).
After SVD, the original information matrix F can be reconstructed from the first Q eigenvectors as
F ^ ( M - 1 ) × K = U ( M - 1 ) × Q d i a g ( σ 1 , σ 2 , , σ Q ) V K × Q T = i = 1 Q σ i u i v i T
Quality of the reconstruction is given by the ratio of the first Q singular values to the sum of all the singular values and is interpreted as the reconstructed proportion or the explained variance. It has been shown that the SVD gives an optimal approximation of a matrix (F) by another matrix () of smaller rank in a least square sense, so that SVD is equivalent to principal component analysis (PCA) [41].
Since SVD is equivalent to PCA, so like the eigenvalues of the covariance matrix in PCA, these singular values can be a measure of directional variations of information exergy matrix F and only a few of them are needed to preserve major information of the matrix F. Therefore, truncated singular values [σ1, σ2,…, σN]T are defined as information exergy index here to facilitate the application of information exergy. For determination of the preserved singular values number (N), cumulative contribution limit (or explained variance) method is used:
N = min n ( i = 1 n σ i i = 1 r a n k ( F ) σ i α )
where α is the truncated threshold and is application dependent [42]. For information reservation, the higher α the better. However, monitoring signals are always contaminated with noises and errors may happen at one sensor or instant, the last few small singular values should be removed. Also, easy application is preferred in engineering practice, the threshold α should not be too high. Taking these into account, a value of 85% is chosen for threshold α in this paper.

3.2. Degradation Assessment Based on the Proposed Information Exergy Index

Condition monitoring information of multiple instants and multiple sensors is integrated compactly in the proposed information exergy index, so uncertainties such as those induced from usage variations or sensor errors are taken into account and robust performance degradation assessment can be obtained. Degradation assessment based on the proposed information exergy index is illustrated as Figure 1 and its detailed procedure is listed in Table 1.
The proposed degradation assessment method mainly consists of offline learning and online assessment. In the offline learning phase, historical multi-instant and multi-sensor signals of known degradation severities are processed to extract their information exergy indices, and an empirical relationship between information exergy index and degradation severity is constructed. In the online assessment phase, a new information exergy index is calculated from newly sampled multi-instant and multi-sensor signals, and the current machine degradation severity is assessed by the established empirical relationship and new information exergy index.
Pattern recognition method such as CMAC and SVM can be further added to the degradation assessment model to automatically learn the relationship between information exergy index and degradation severity. The synthesized health index can also be constructed combining the proposed information exergy index and SVDD or SOM.

4. Experimental Validation of Information Exergy Index

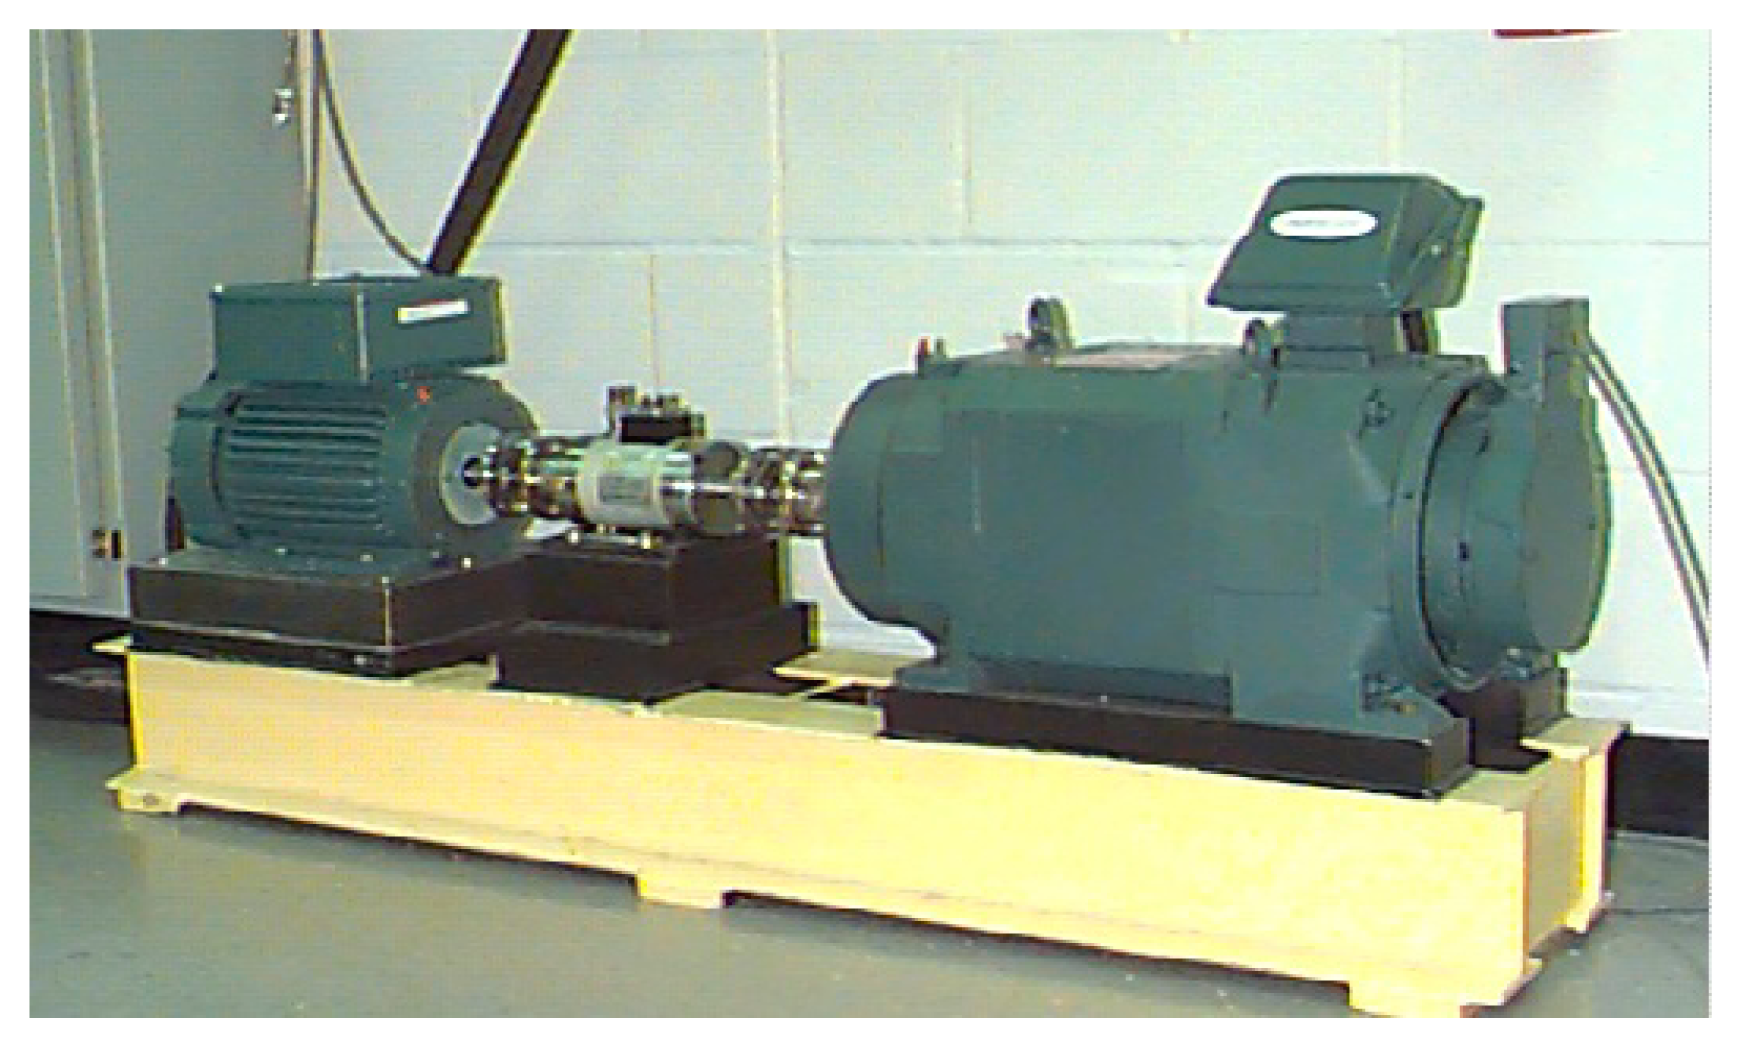
4.1. Experiment Description

The test bearings in the test stand (as shown in Figure 2) support the motor shaft and single point faults were introduced to the test bearings elements using electro-discharge machining (EDM) [43]. Vibration signals under four operational conditions (i.e., 1,797, 1,772, 1,750, 1,730 rpm) were recorded and the sampling frequency is set to 12 kHz with a duration of one second. Bearing datasets of this test stand have been validated for fault diagnosis and performance assessment applications in [44,45]. SKF bearings at the drive end of the motor shaft are studied here. The deteriorative severities are faulty diameters of 7, 14 and 21 mils (1 mil = 0.001 inches) of the inner raceway and rolling element. For statistical significance analysis, 50 vibration time series waveform of 0.167 second duration are extracted from the original vibration signals of each faulty severity.

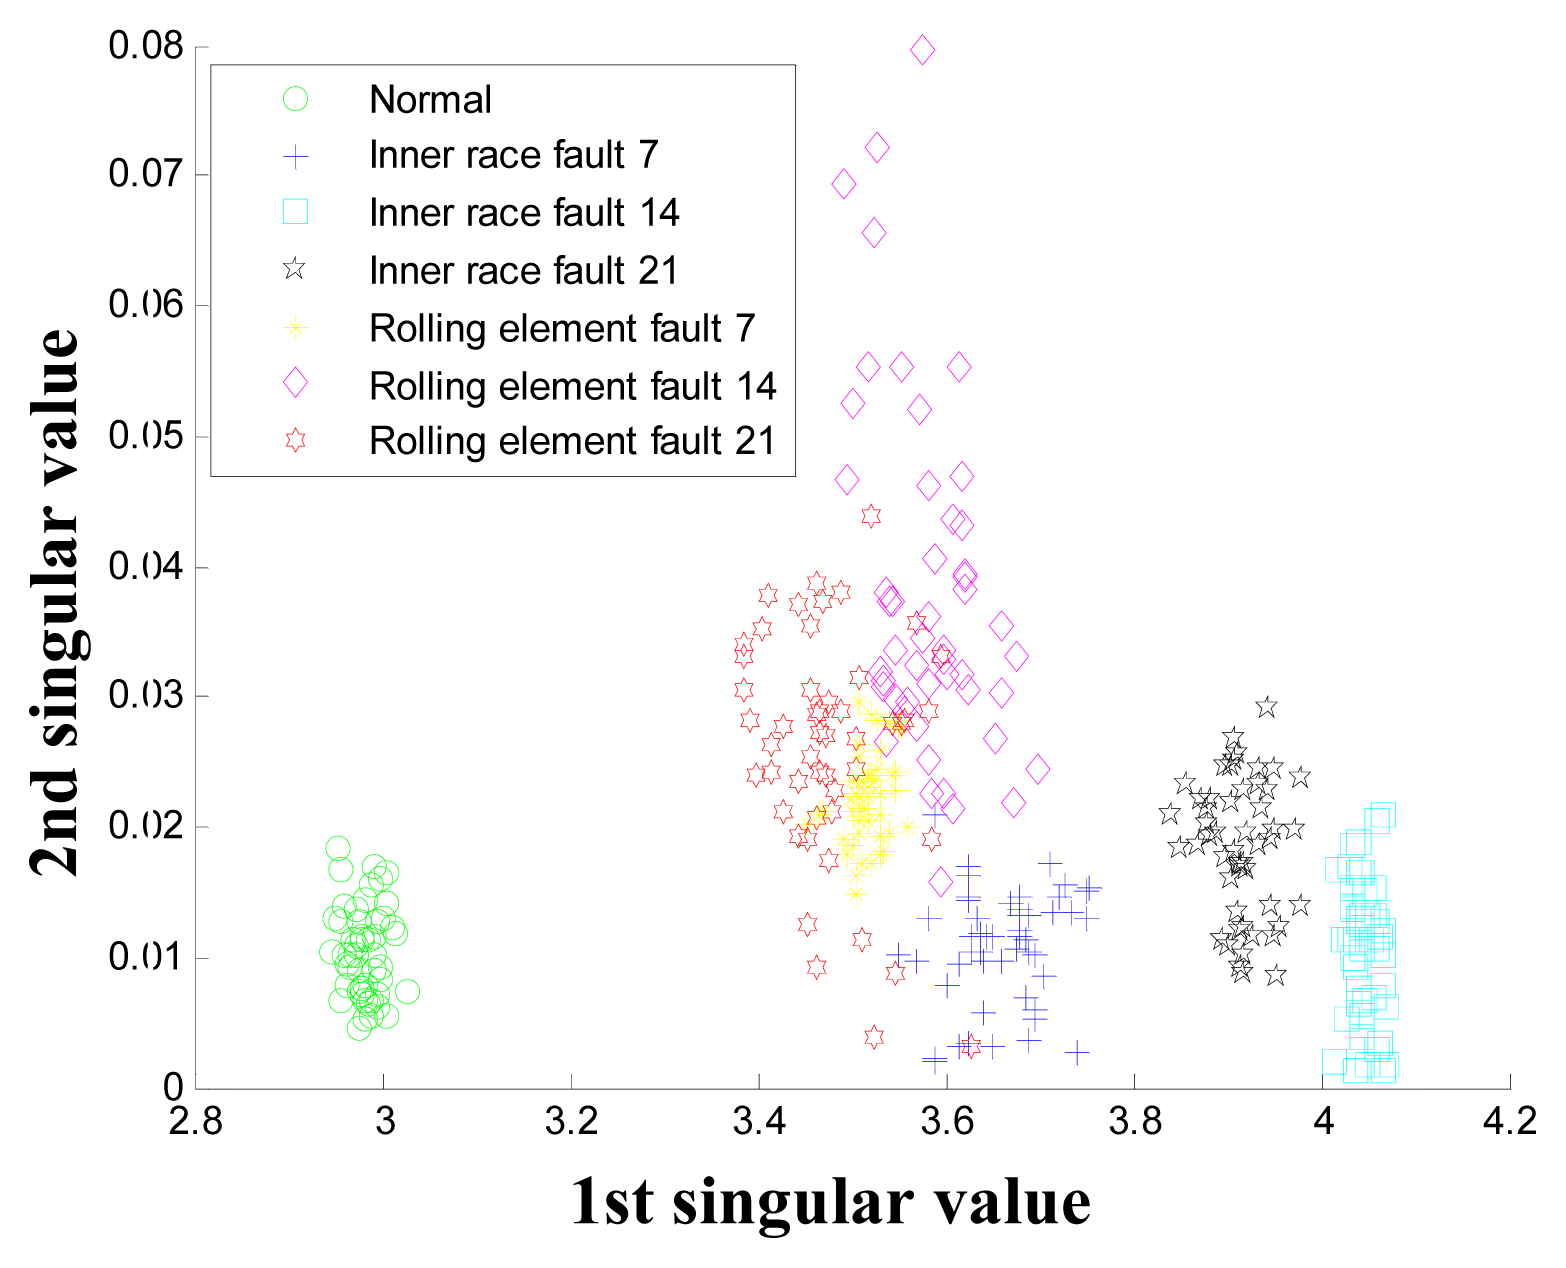
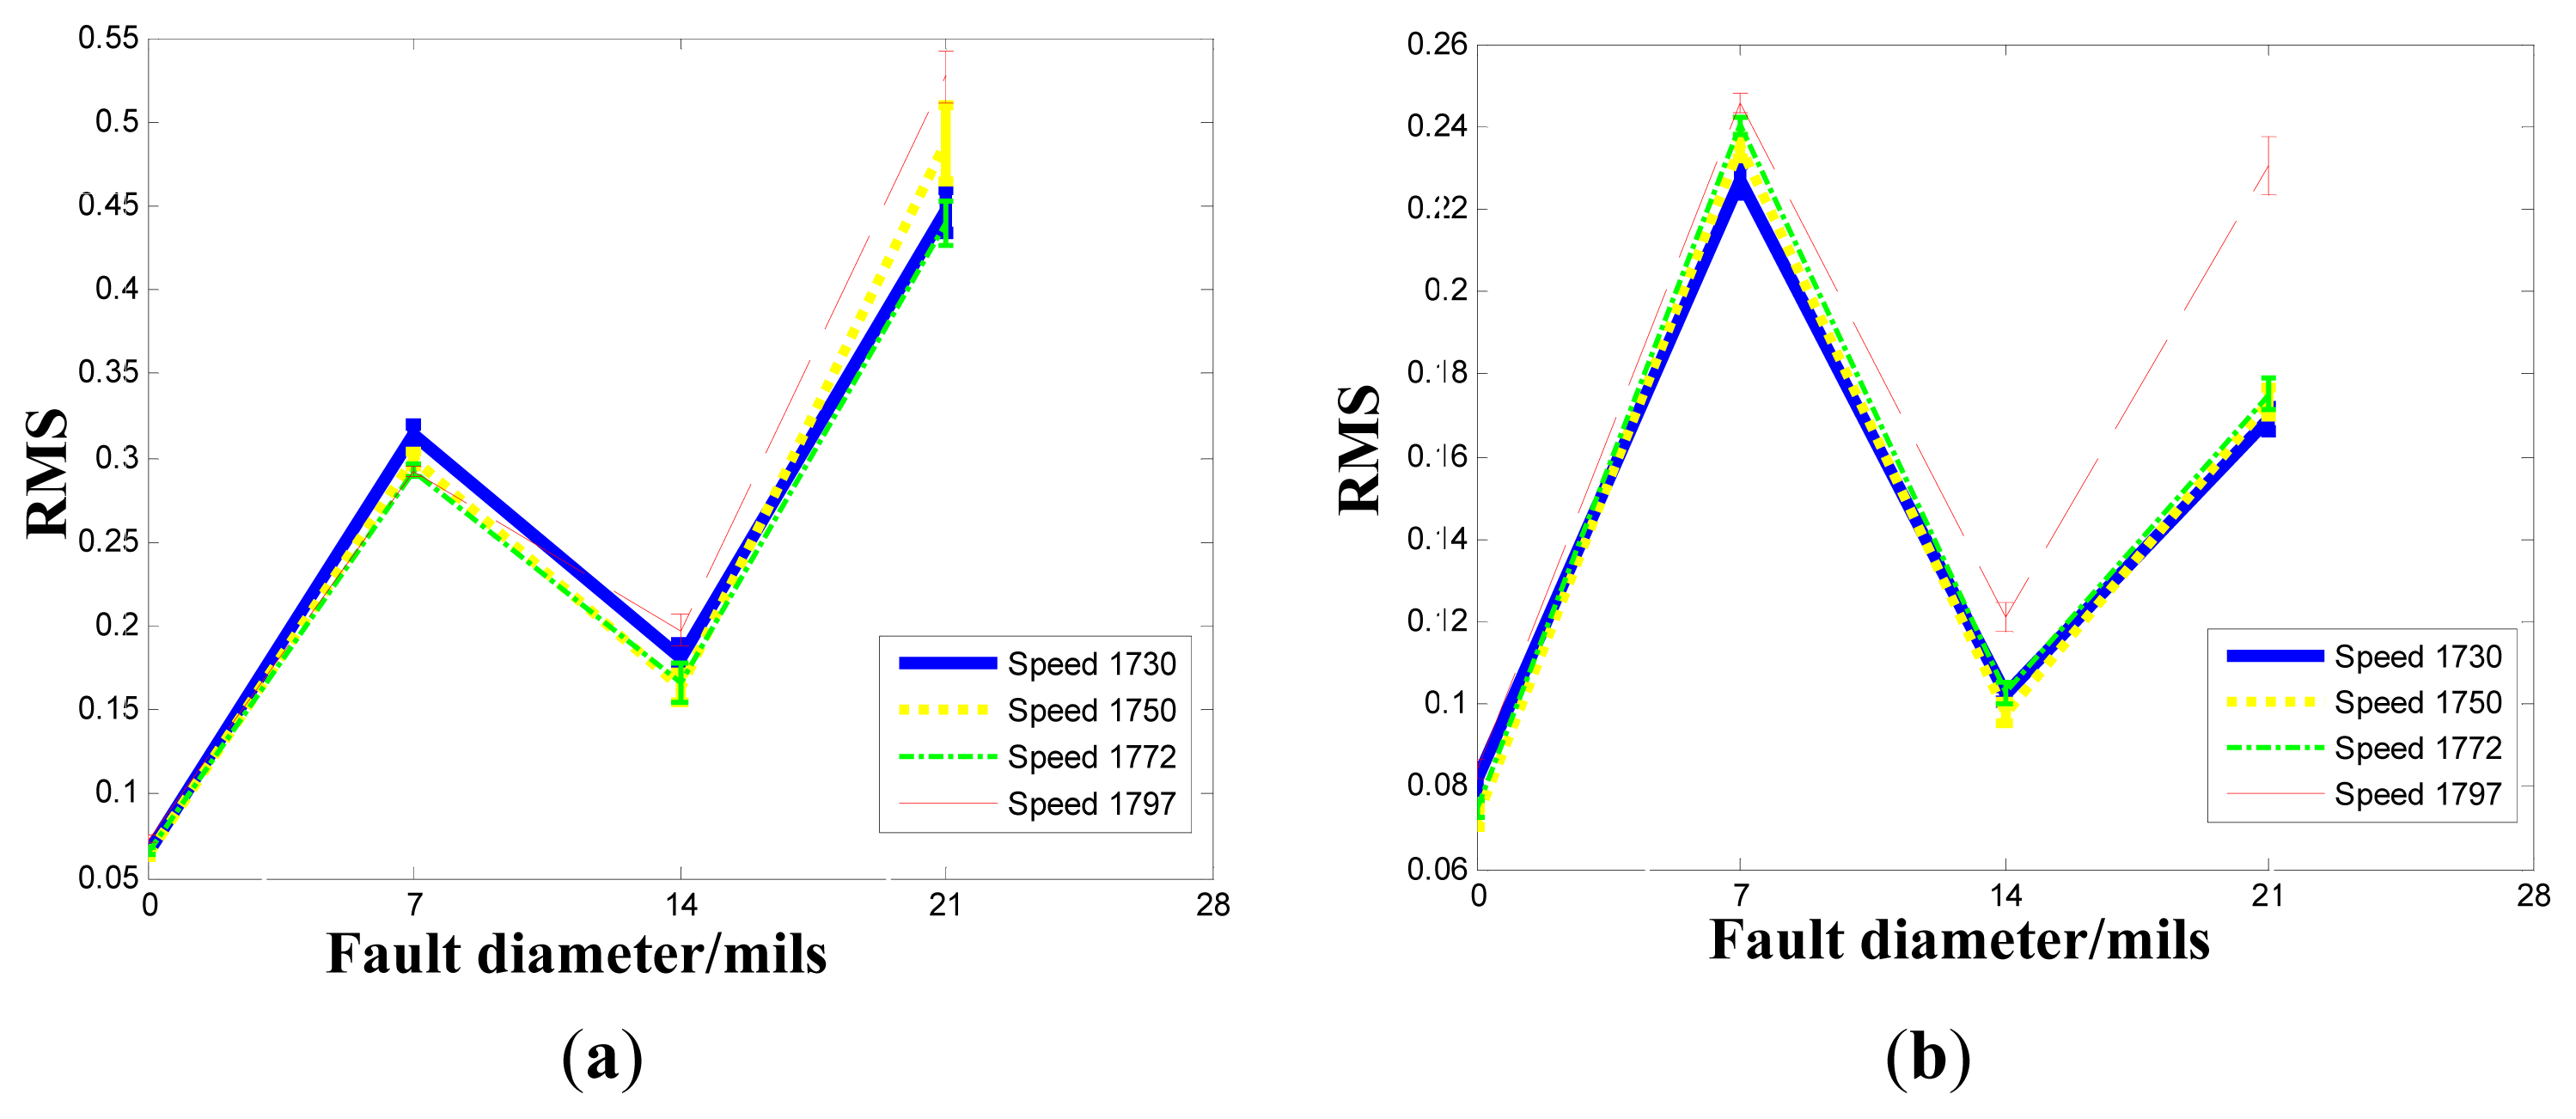
4.2. Experimental Results and Analysis

The information exergy index (SEx) based on SVD of spectral information entropy (SEn) is illustrated, and comparisons with RMS and SEn are made graphically, while the coefficient of variation (CV) defined as the ratio between standard deviation and mean is used as performance evaluation criterion for the information exergy indices (i.e., SEx, Mv, Std and Pr). CV measures the relative deviation from the mean in repeated trials and the less the better. Specifically in our case, one information exergy index has a less CV value then it is more robust for bearing degradation assessment.
Vibration sensor information of four possible operating conditions (i.e., M = 4) at two sensing points (i.e., K = 2) are fused in the information exergy matrix feature for each sample of bearing conditions including normal condition, thus operating SVDs results in at most two singular values. A general view of all the considered conditions of the bearings mapped into this two-dimension space is given in Figure 3. It can be observed that the severities of inner raceway degradation are very well clustered, while those of rolling elements are largely scattered and overlapped beyond a defect diameter of 7 mils. It can also be seen that degradations of both inner race and rolling element are well represented in the 1st singular value. Actually, the cumulative contribution rate of the 1st singular value is about 99% and only this singular value will be truncated as SEx in the following.

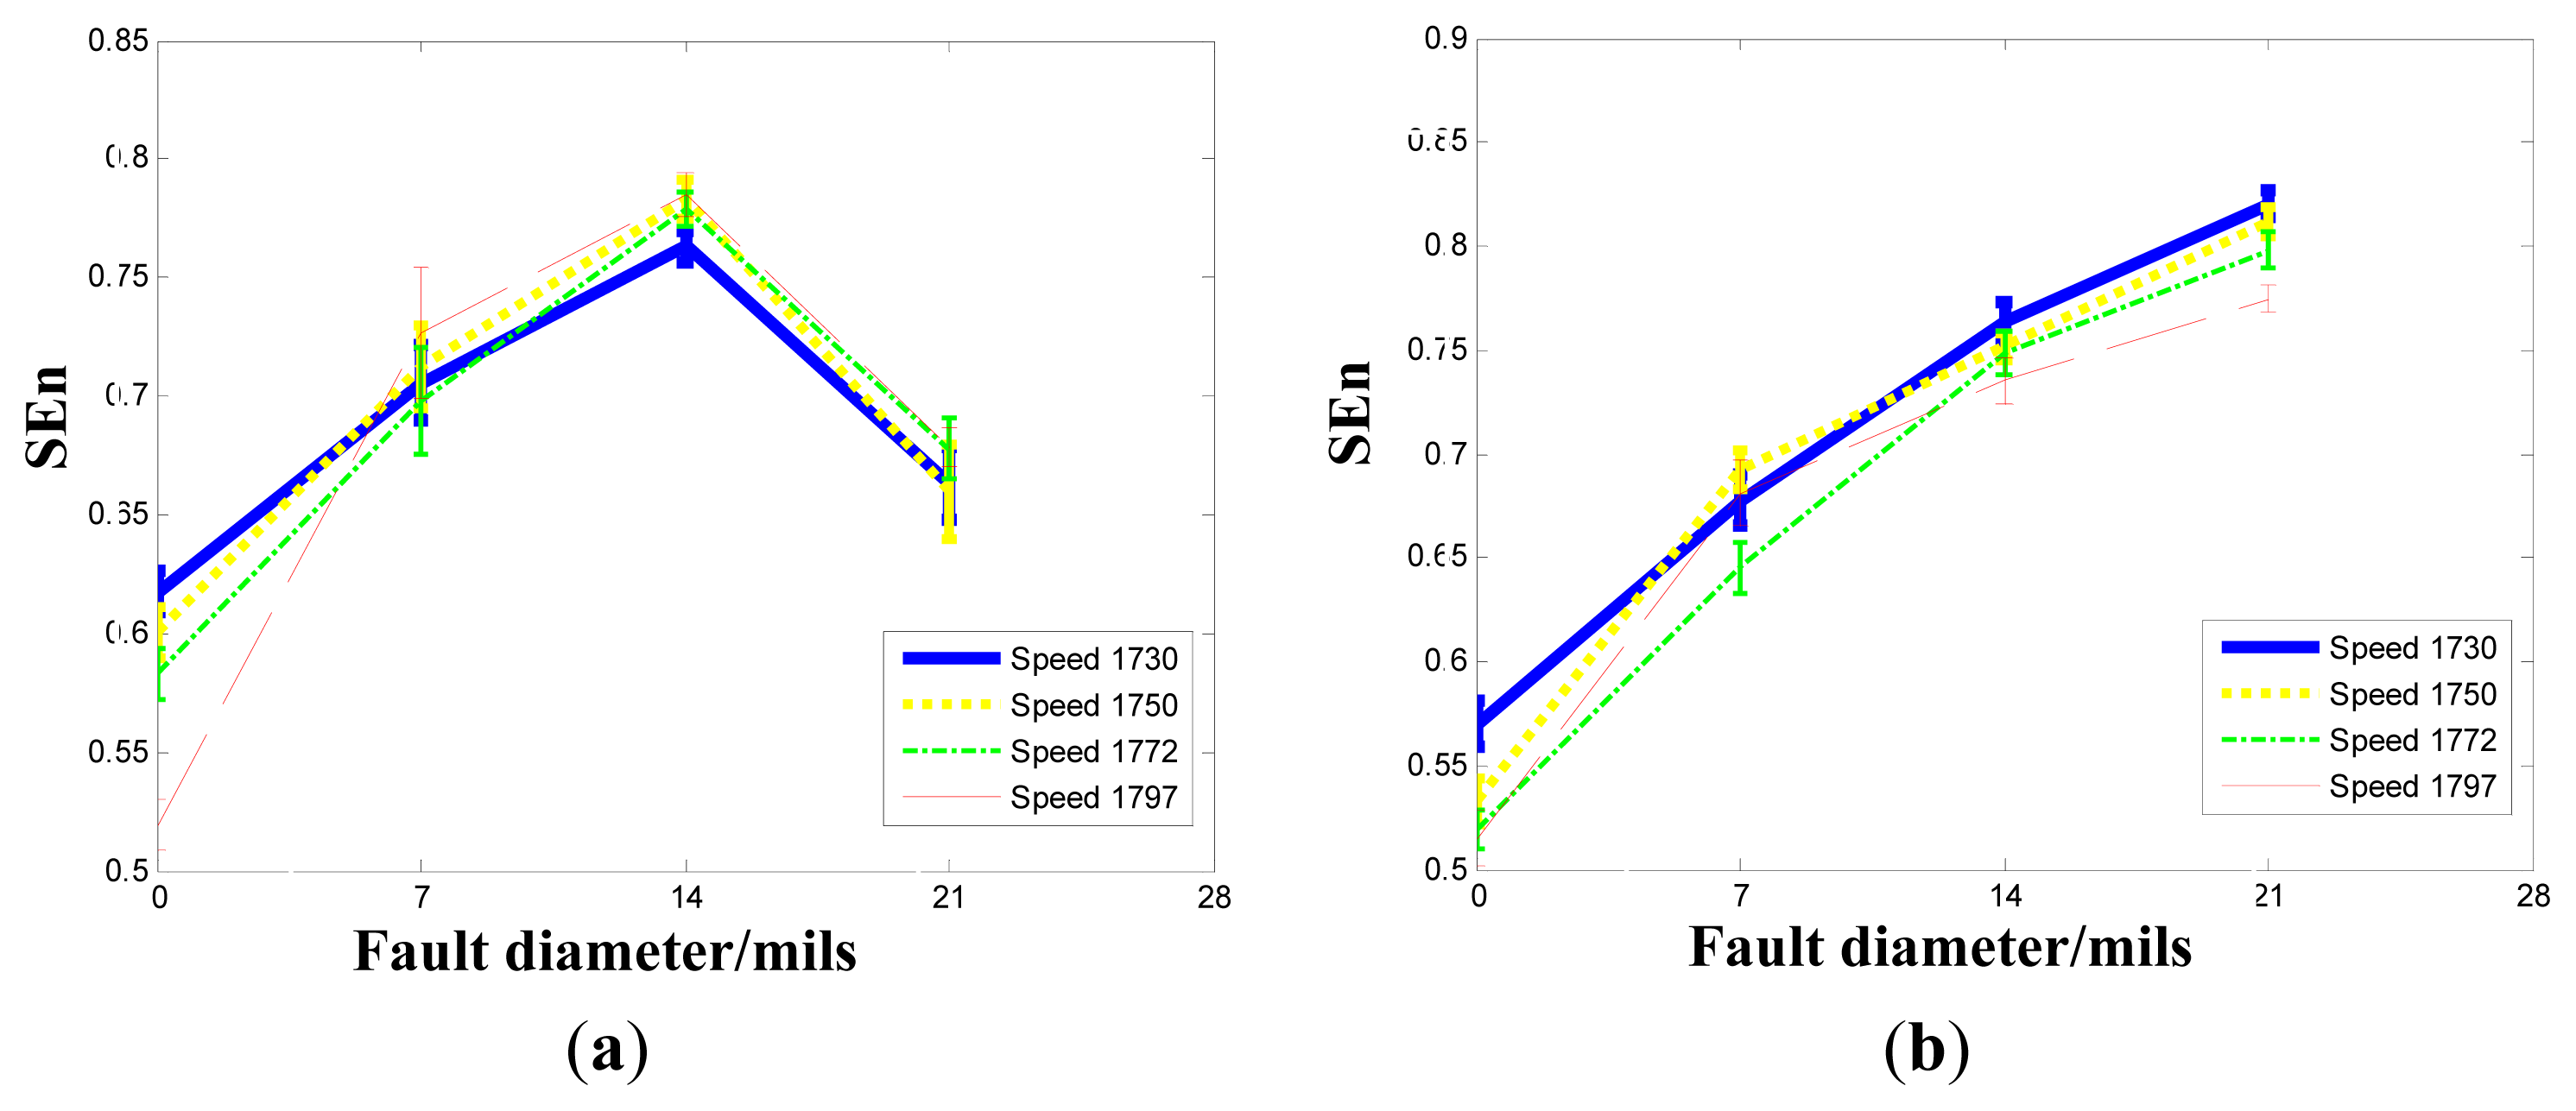
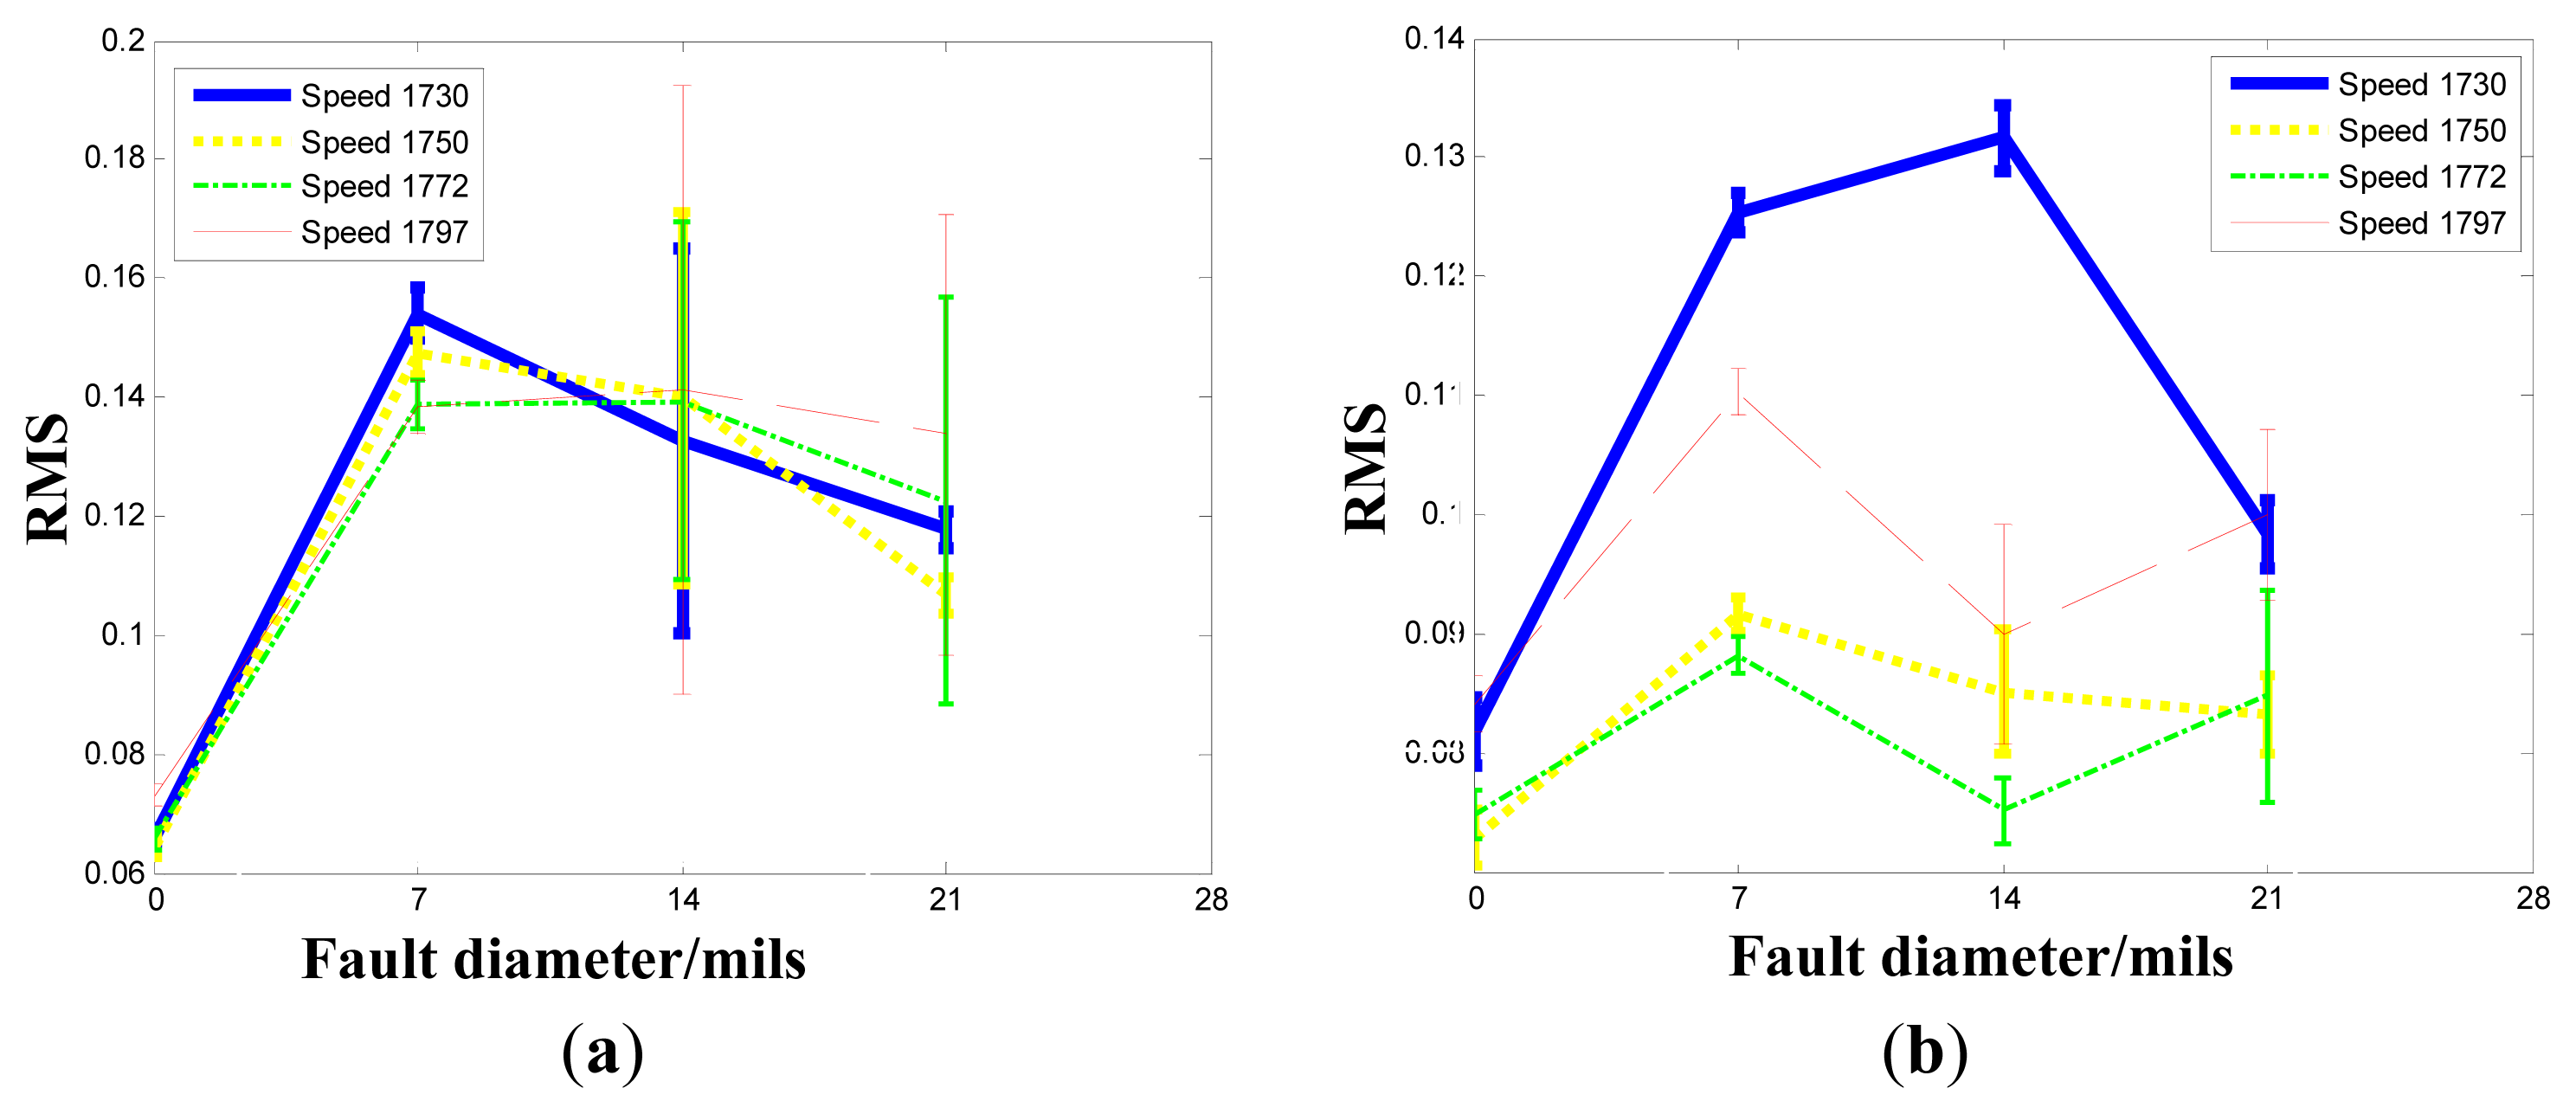
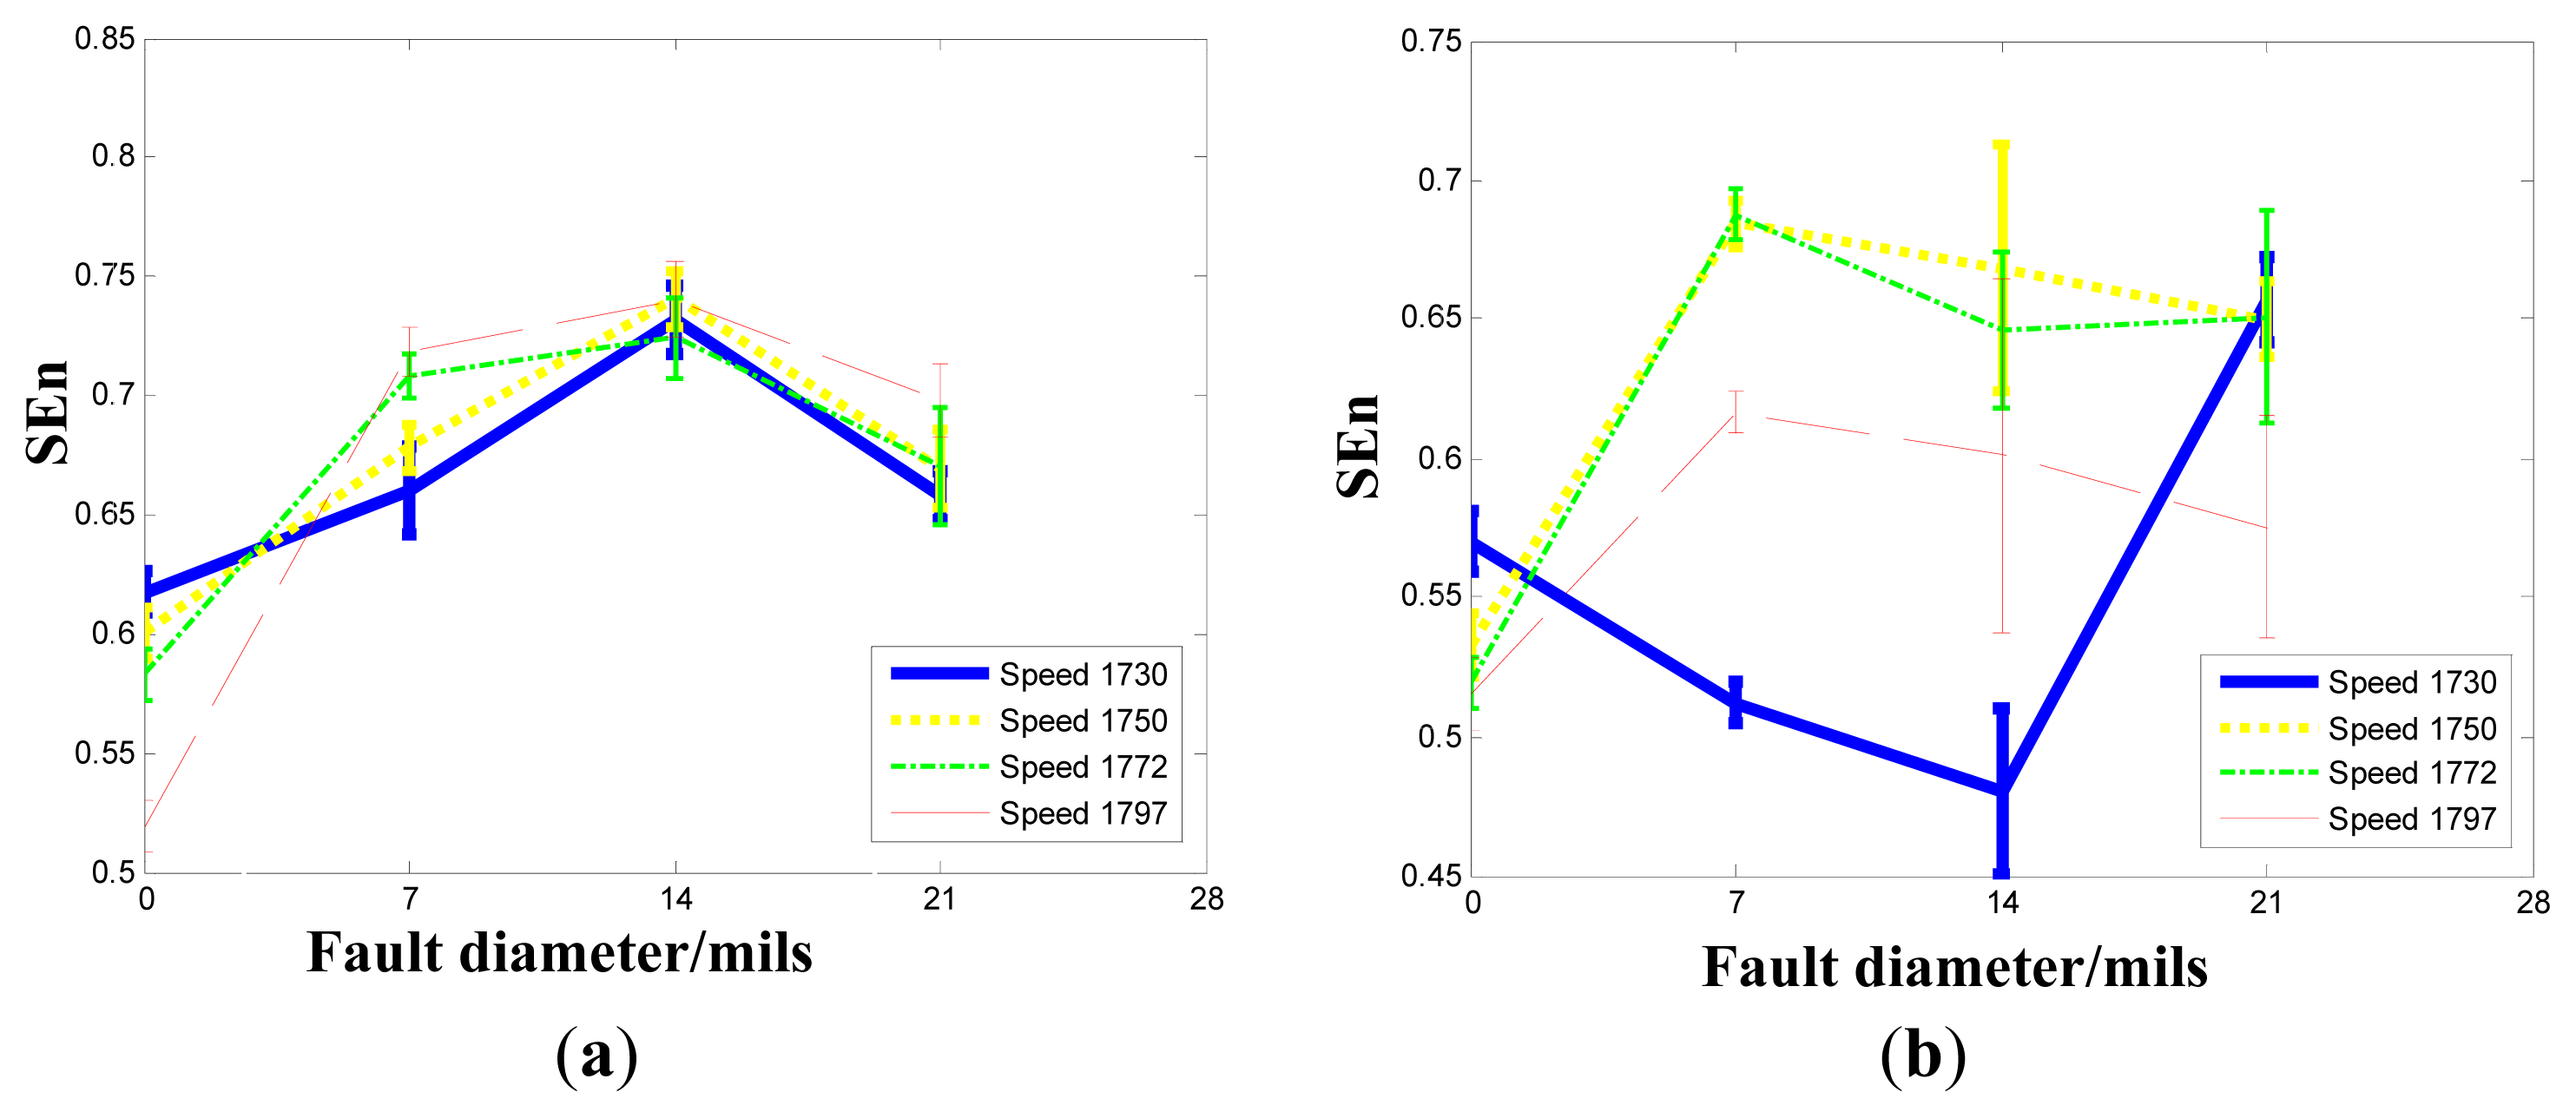
4.2.1. Inner Raceway Degradation Assessment

Degradation evaluation results of inner raceway with the SEx, SEn, RMS and the other three information exergy indicators are shown in Figures 46 and comparisons among all information exergy indices are tabulated in Table 2.
From Figure 4, it can be seen that RMS which is an effective measure of the vibration energy is not correlated with the degradation severities in this case study, but varying modes of RMS under different speeds and at both sensing points are consistent.
SEn of inner race degradation under four possible running conditions at drive end (Figure 5a) first increases and then decreases and a similar trend was also observed in [10]. During the incipient fault stage (up to 14 mils fault diameter), more disturbances are caused with increasing faulty inner raceway size and the vibration energy is much more evenly distributed in the frequency domain, SEn increases with degradation severities. However, when the defect sizes are bigger, faults become obvious and vibration energy is more concentrated in a few frequencies (i.e., ball pass frequency on the inner race, resonance frequency and shaft rotary frequency, etc.), and SEn decreases. Figure 5b shows that SEn at the fan end increases with the severity of inner race degradation, but this may not be the truth. Many disturbances on the vibration transmission routine from the drive end to the fan end may have corrupted the true vibration signal.
The bearing inner race degradation indices illustrated in Figure 6 are all based on information exergy matrix features. It can be observed that Std (Figure 6c) correlates very well with the deterioration process of the bearing inner race, but its value is very small and the CV are large (please refer to Table 2). The other three information exergy indicators all have the same trend as the SEn at the drive end, and these indexes are simple to use for applications since the information of possible operational conditions and multiple sensing points is integrated into one index. From Figure 6 and Table 2, it can also been seen that the CVs of the developed SEx index of all inner race degradation severities are much smaller than those of the other information exergy indices.

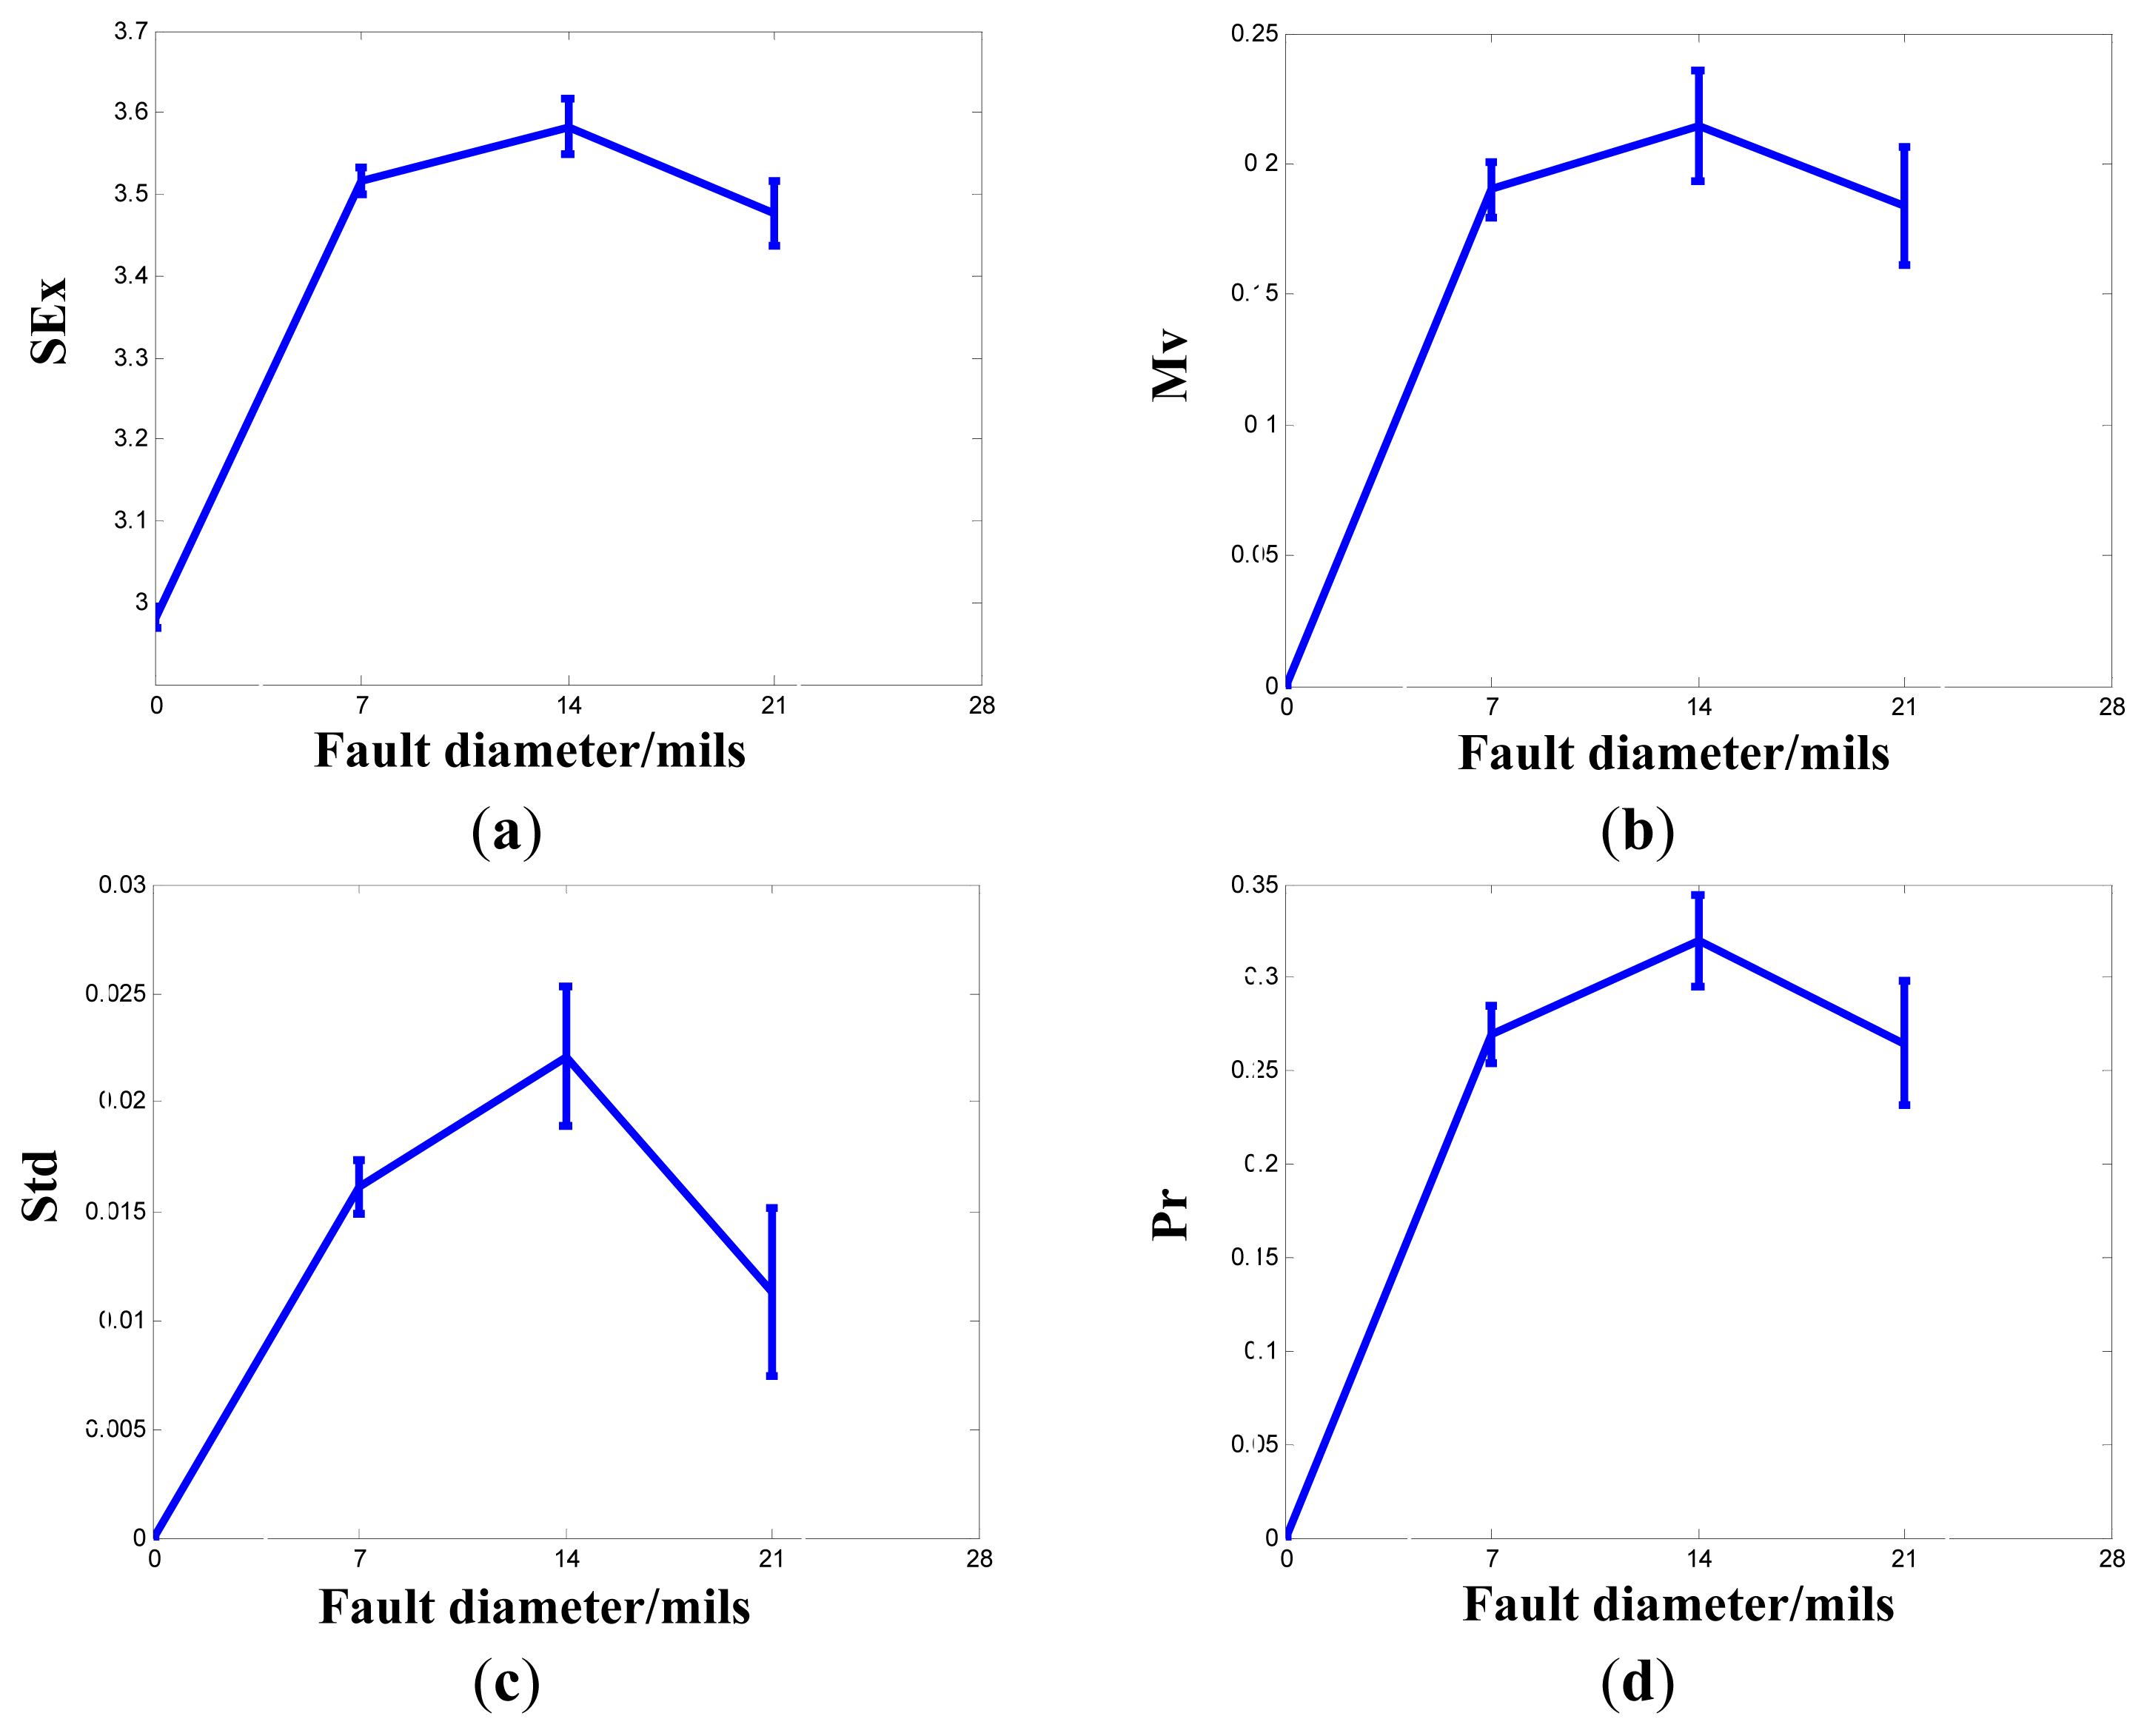
4.2.2. Rolling Element Degradation Assessment

The developed information exergy index (SEx) is also applied to degradation evaluation of bearing rolling elements and results are shown in Figures 79 and in Table 3.
RMSs (Figure 7a) of all the rolling element degradation status are smaller than those of the inner raceway with the same fault severities and trends of RMS are dependent on speed and sensing location.
The SEn of rolling element degradation vibration signals under four running conditions at the drive end (Figure 8a) demonstrates a similar pattern to that of inner race deterioration and similar explanations can be proposed, but we note that these SEns are more speed specific. The SEn of the fan end is shown in Figure 8b and it is observed that SEn under the lowest speed varies differently from that of another speed. Compared to inner race degradation, the SEn of rolling element degradation is more speed-based and possible operational conditions should be included for reliable performance assessment of rolling elements.
Degradation evaluation of rolling elements based on information exergy indices are graphed in Figure 9. It can be seen that all the four indicators have evolving modes similar to the pattern of SEn at the drive end. Again, the developed SEx indexes of all rolling element degradation status have much smaller CV values than those of the other information exergy indexes (please refer to Table 3).
From both degradation assessment results of inner race and rolling elements, it can be concluded that the developed SEx indexes have consistent trends with increasing fault severities, and the SEx of the former are bigger for the same fault diameter, so faulty or degenerated parts of rolling element bearings can be located with SEx and alarm lines can be predefined for condition monitoring purposes. Compared to SEn, the developed SEx integrates multi-instant information at multiple sensing points, thus temporal and sensor uncertainties can be reduced and results are more reliable (please refer to Figure 5 and Figure 6a, Figure 8 and Figure 9a).

5. Conclusions

An information exergy index based on SVD of the information exergy matrix feature is proposed for performance degradation assessment of rolling element bearings in this study. The information exergy matrix features are based on generalized information entropy and fuse the condition monitoring information of multiple instant and multiple sensors, thus uncertainties (such as sensor errors and operational condition variations) within the degradation evaluation can be reduced using the information exergy indices. Ball bearing inner raceway and rolling element deterioration severity evaluations are studied using spectral information entropy as generalized information entropy and results show that the proposed information exergy index is effective and robust. For more efficient performance degradation assessment, the information exergy index will be combined with other intelligent pattern recognition models in our future work.

Acknowledgments

This research is financially supported by the National Natural Science Foundation of China (No. 51005015), the Beijing Municipal Organization Department Foundation for Excellent Talents of China (2013D009006000003) and the Fundamental Research Funds for the Central Universities of China (No. FRF-TP-12-161A).

Author Contributions

All authors have contributed to the study and preparation of the article. They have read and approved the final manuscript.

Conflicts of Interest

The authors declare no conflict of interest.

References

  1. Zio, E.; Gola, G. A neuro-fuzzy technique for fault diagnosis and its application to rotating machinery. Reliab. Eng. Syst. Saf 2009, 94, 78–88. [Google Scholar]
  2. Jardine, A.K.S.; Lin, D.M.; Banjevic, D. A review on machinery diagnostics and prognostics implementing condition-based maintenance. Mech. Syst. Signal Process 2006, 20, 1483–1510. [Google Scholar]
  3. Chen, B.; Yan, Z.L.; Chen, W. Defect detection for wheel-bearings with time-spectral kurtosis and entropy. Entropy 2014, 16, 607–626. [Google Scholar]
  4. Randall, R.B.; Antoni, J. Rolling element bearing diagnostics—A tutorial. Mech. Syst. Signal Process 2011, 25, 485–520. [Google Scholar]
  5. Liao, L.X.; Lee, J. A novel method for machine performance degradation assessment based on fixed cycle features test. J. Sound Vib 2009, 326, 894–908. [Google Scholar]
  6. Niu, G.; Yang, B.S.; Pecht, M. Development of an optimized condition-based maintenance system by data fusion and reliability-centered maintenance. Reliab. Eng. Syst. Saf 2010, 95, 786–796. [Google Scholar]
  7. Yan, R.Q.; Gao, R.X.; Wang, C.T. Experimental evaluation of a unified time-scale-frequency technique for bearing defect feature extraction. J. Vib. Acoust 2009. [Google Scholar]
  8. Tao, B.; Zhu, L.M.; Ding, H.; Xiong, Y.L. An alternative time-domain index for condition monitoring of rolling element bearings—A comparison study. Reliab. Eng. Syst. Saf 2007, 92, 660–670. [Google Scholar]
  9. Feng, Z.P.; Zuo, M.J.; Hao, R.J.; Chu, F.L.; Badaoui, M.E. Gear damage assessment based on cyclic spectral analysis. IEEE Trans. Reliab 2011, 61, 21–32. [Google Scholar]
  10. Pan, Y.N.; Chen, J.; Li, X.L. Spectral entropy: A complementary index for rolling element bearing performance degradation assessment. Proc. Inst. Mech. Eng. Part C: J. Mech. Eng. Sci 2009, 223, 1223–1231. [Google Scholar]
  11. Hong, H.B.; Liang, M. Fault severity assessment for rolling element bearings using the Lempel-Ziv complexity and continuous wavelet transform. J. Sound Vib 2009, 320, 452–468. [Google Scholar]
  12. Yu, J.B. Local and nonlocal preserving projection for bearing defect classification and performance assessment. IEEE Trans. Ind. Electron 2012, 59, 2363–2376. [Google Scholar]
  13. Liu, W.B.; Zhong, X.; Lee, J.; Liao, L.X.; Zhou, M. Application of a novel method for machine performance degradation assessment based on Gaussian mixture model and Logistic regression. Chin. J. Mech. Eng 2011, 24, 879–884. [Google Scholar]
  14. Shen, Z.J.; He, Z.J.; Chen, X.F.; Sun, C.; Liu, Z.W. A monotonic degradation assessment index of rolling bearings using fuzzy support vector data description and running time. Sensors 2012, 12, 10109–10135. [Google Scholar]
  15. Hong, S.; Zhou, Z.; Zio, E.; Hong, K. Condition assessment for the performance degradation of bearing based on a combinatorial feature extraction method. Digit. Signal Process 2014, 27, 159–166. [Google Scholar]
  16. Xu, R.Z.; Xie, L.; Zhang, M.C.; Li, C.X. Machine degradation analysis using fuzzy CMAC neural network approach. Int. J. Adv. Manuf. Technol 2008, 36, 765–772. [Google Scholar]
  17. Moghaddass, R.; Zuo, M.J. A parameter estimation method for a condition-monitored device under multi-state deterioration. Reliab. Eng. Syst. Saf 2012, 106, 94–103. [Google Scholar]
  18. Lee, S.; Li, L.; Ni, J. Online degradation assessment and adaptive fault detection using modified hidden Markov model. J. Manuf. Sci. Eng 2010. [Google Scholar]
  19. Hu, J.Q.; Zhang, L.B.; Liang, W. Dynamic degradation observer for bearing fault by MTS-SOM system. Mech. Syst. Signal Process 2013, 36, 385–400. [Google Scholar]
  20. Zhang, Y.; Zuo, H.F.; Bai, F. Classification of fault location and performance degradation of a roller bearing. Measurement 2013, 46, 1178–1189. [Google Scholar]
  21. Tamilselvan, P.; Wang, P.F. Failure diagnosis using deep belief learning based health state classification. Reliab. Eng. Syst. Saf 2013, 115, 124–135. [Google Scholar]
  22. Widodo, A.; Yang, B.S. Application of relevance vector machine and survival probability to machine degradation assessment. Expert Syst. Appl 2011, 38, 2592–2599. [Google Scholar]
  23. Safizadeh, M.S.; Latifi, S.K. Using multi-sensor data fusion for vibration fault diagnosis of rolling element bearings by accelerometer and load cell. Inf. Fusion 2014, 18, 1–8. [Google Scholar]
  24. Xiao, W.B.; Chen, J.; Dong, G.M.; Zhou, Y.; Wang, Z.Y. A multichannel fusion approach based on coupled hidden Markov models for rolling element bearing fault diagnosis. Proc. Inst. Mech. Eng. Part C: J. Mech. Eng. Sci 2012, 226, 202–216. [Google Scholar]
  25. Lin, Y.F.; Chen, M.Y.; Zhou, D.H. Online probabilistic operational safety assessment of multi-mode engineering systems using Bayesian methods. Reliab. Eng. Syst. Saf 2013, 119, 150–157. [Google Scholar]
  26. Li, Z.X.; Yan, X.P. Study on data fusion of multi-dimensional sensors for health monitoring of rolling bearings. Insight-Non-Destr. Test. Cond. Monit 2013, 55, 147–151. [Google Scholar]
  27. Pan, Y.N.; Chen, J.; Dong, G.M. A hybrid model for bearing performance degradation assessment based on support vector data description and fuzzy c-means. Proc. Inst. Mech. Eng. Part C: J. Mech. Eng. Sci 2009, 223, 2687–2695. [Google Scholar]
  28. Lybeck, N.; Marble, S.; Morton, B. Validating prognostic algorithms: A case study using comprehensive bearing fault data. Proceedings of the 2007 IEEE Aerospace Conference, Big Sky, MT, USA, 3–10March 2007; pp. 1–9.
  29. Jiang, L.L.; Liu, Y.L.; Li, X.J.; Chen, A.H. Degradation assessment and fault diagnosis for roller bearing based on AR model and fuzzy cluster analysis. Shock Vib 2011, 18, 127–137. [Google Scholar]
  30. Zhang, B.; Sconyers, C.; Byington, C.; Patrick, R.; Orchard, M.; Vachtsevanos, G. A probabilistic fault detection approach: application to bearing fault detection. IEEE Trans. Ind. Electron 2011, 58, 2011–2018. [Google Scholar]
  31. Sawalhi, N.; Randall, R.B. Simulating gear and bearing interactions in the presence of faults: Part I. The combined gear bearing dynamic model and the simulation of localised bearing faults. Mech. Syst. Signal Process 2008, 22, 1924–1951. [Google Scholar]
  32. Shannon, C.E. A mathematical theory of communication. Mob. Comput. Commun. Rev 2001, 5, 3–55. [Google Scholar]
  33. Wu, B.F.; Wang, K.C. Robust endpoint detection algorithm based on the adaptive band-partitioning spectral entropy in adverse environments. IEEE Trans. Speech Audio Process 2005, 13, 762–775. [Google Scholar]
  34. Yu, D.J.; Yang, Y.; Cheng, J.S. Application of time-frequency entropy method based on Hilbert-Huang transform to gear fault diagnosis. Measurement 2007, 40, 823–830. [Google Scholar]
  35. Wu, S.D.; Wu, C.W.; Wu, T.Y.; Wang, C.C. Bearing fault diagnosis based on multiscale permutation entropy and support vector machine. Entropy 2012, 14, 1343–1356. [Google Scholar]
  36. Ren, W.X.; Sun, Z.S. Structural damage identification by using wavelet entropy. Eng. Struct 2008, 30, 2840–2849. [Google Scholar]
  37. Sciubba, E.; Wall, G. A brief commented history of exergy from the beginnings to 2004. Int. J. Thermodyn 2007, 10, 1–26. [Google Scholar]
  38. Chen, F.; Huang, S.H.; Yang, T.; Gao, W.; He, G.Q. Information exergy diagnosis method of vibration faults of rotating machinery. J. Mech. Eng 2009, 45, 65–71. [Google Scholar]
  39. Zhang, B.; Zhang, L.J.; Xu, J.W.; Liu, J. Information exergy-based method for structural damage diagnosis. J. Vibroeng 2013, 15, 1606–1618. [Google Scholar]
  40. Rajwade, A.; Rangarajan, A.; Banerjee, A. Image denoising using the higher order singular value decomposition. IEEE Trans. Pattern Anal. Mach. Intell 2013, 35, 49–862. [Google Scholar]
  41. Shirali, G.A.; Mohammadfam, I.; Ebrahimipour, V. A new method for quantitative assessment of resilience engineering by PCA and NT approach: A case study in a process industry. Reliab. Eng. Syst. Saf 2013, 119, 88–94. [Google Scholar]
  42. Tamura, M.; Tsujita, S. A study on the number of principal components and sensitivity of fault detection using PCA. Comput. Chem. Eng 2007, 31, 1035–1046. [Google Scholar]
  43. Ocak, H.; Loparo, K.A. Estimation of the running speed and bearing defect frequencies of an induction motor from vibration data. Mech. Syst. Signal Process 2004, 18, 515–533. [Google Scholar]
  44. Zhang, L.J.; Xu, J.W.; Yang, J.H.; Yang, D.B.; Wang, D.D. Multiscale morphology analysis and its application to fault diagnosis. Mech. Syst. Signal Process 2008, 22, 597–610. [Google Scholar]
  45. Yu, J.B. Bearing performance degradation assessment using locality preserving projections. Expert Syst. Appl 2011, 38, 7440–7450. [Google Scholar]
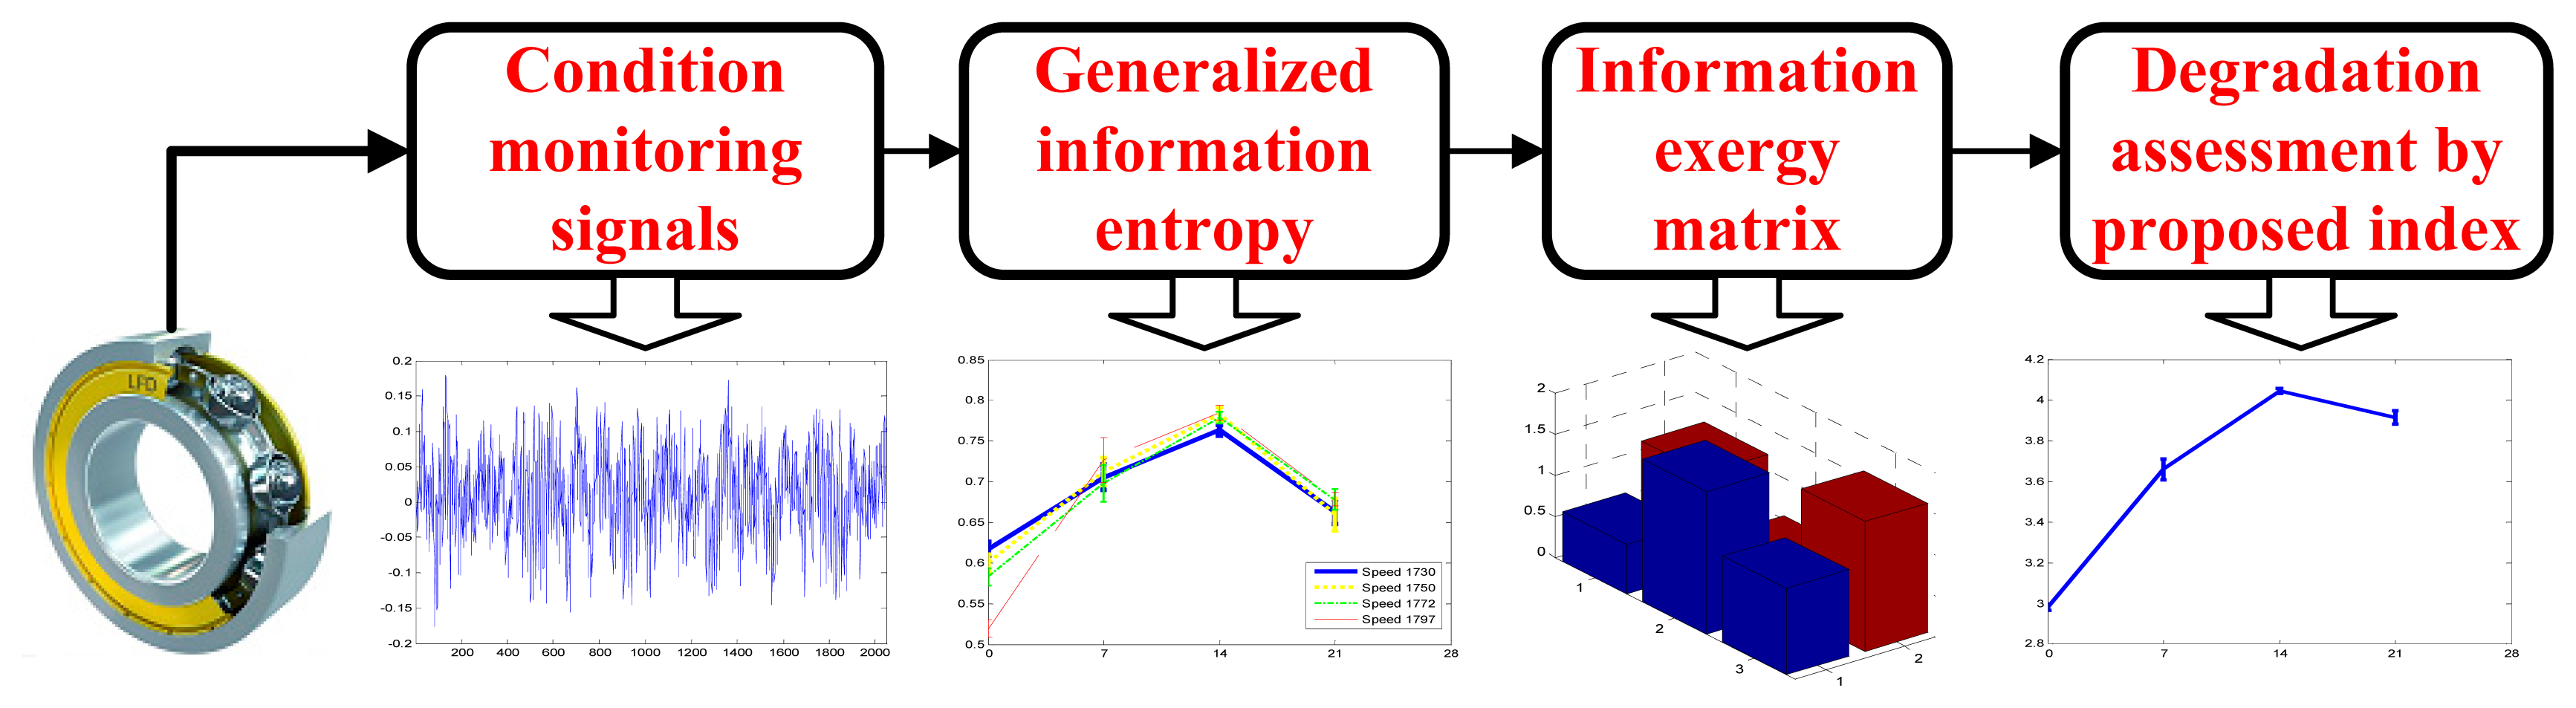
Figure 1. Information exergy index based degradation assessment.
Entropy 16 05400f1
Figure 2. Rolling bearing degradation test stand.
Entropy 16 05400f2
Figure 3. Mapping of the bearing conditions in the two-dimension SEx space.
Entropy 16 05400f3
Figure 4. RMS errorbar graph of inner race degradation vibration signals under four operating conditions: (a) drive end and (b) fan end.
Entropy 16 05400f4
Figure 5. SEn errorbar graph of inner race degradation vibration signals under four operating conditions: (a) drive end and (b) fan end.
Entropy 16 05400f5
Figure 6. Information exergy indices errorbar graph of inner race degradation vibration signals: (a) SEx; (b) Mv; (c) Std and (d) Pr.
Entropy 16 05400f6
Figure 7. RMS errorbar graph of rolling element degradation vibration signals under four operating conditions: (a) drive end and (b) fan end.
Entropy 16 05400f7
Figure 8. SEn errorbar graph of rolling element degradation vibration signals under four operating conditions: (a) drive end and (b) fan end.
Entropy 16 05400f8
Figure 9. Information exergy indices errorbar graph of rolling element degradation vibration signals: (a) SEx; (b) Mv; (c) Std and (d) Pr.
Entropy 16 05400f9
Table 1. Procedure for degradation assessment based on information exergy index.
Step 1Condition monitoring signals of multiple instants and multiple sensors are preprocessed for calculation of generalized information entropy, such as fast Fourier transform (FFT).
Step 2Specific generalized information entropy such as spectral information entropy of multi-instant and multi-sensor condition monitoring signals is calculated.
Step 3Information exergy matrix is constructed using the specific generalized information entropies of multiple instants and multiple sensors.
Step 4Information exergy index is extracted by SVD of the above information exergy matrix and singular value truncating.
Step 5Empirical relationship between information exergy index and degradation severity is established by clustering information exergy indices with known degradation severities.
Step 6Degradation severity is assessed by the established empirical relationship when new information exergy index is input.
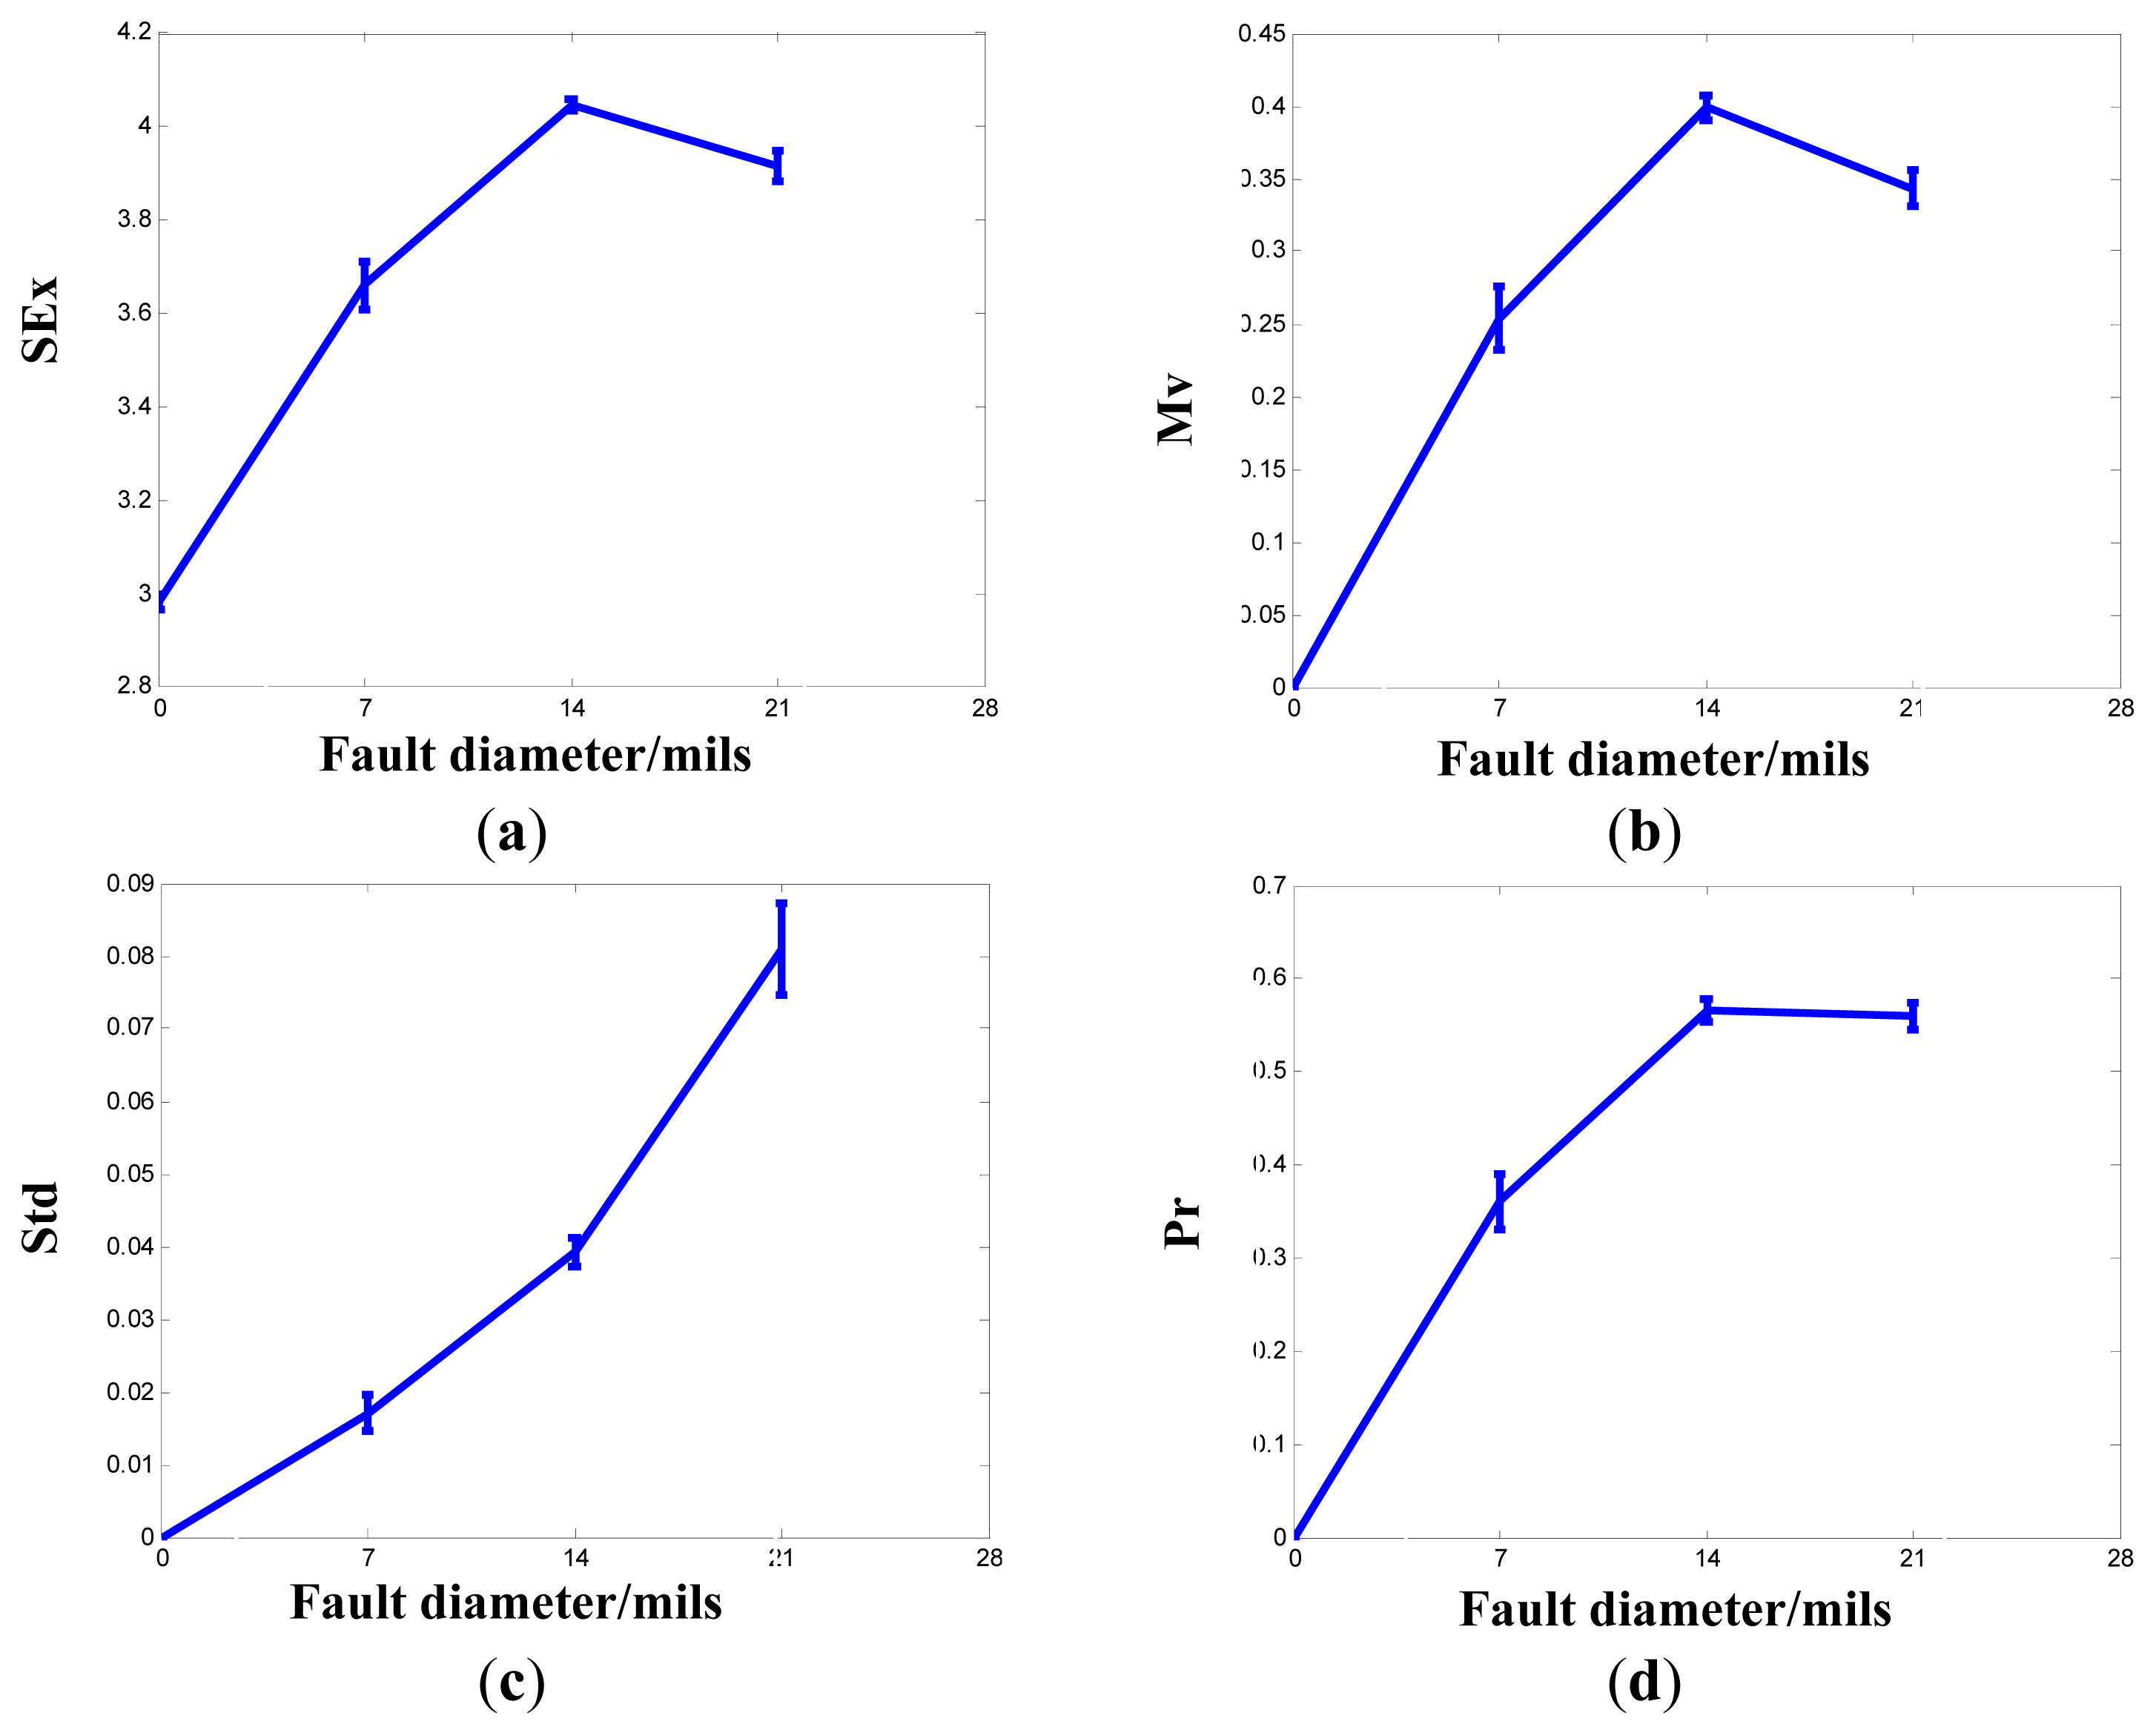
Table 2. Information exergy indices of inner race degradation.
IndexNormal7 Mils Fault14 Mils Fault21 Mils Fault
SEx2.9817(0.0060) *3.6606(0.0137) *4.0467(0.0034) *3.9153(0.0080) *
Mv00.2536(0.0845)0.3987(0.0208) *0.3432(0.0361) *
Std00.0170(0.1480) *0.0392(0.0487) *0.0810(0.0772) *
Pr00.3607(0.0812) *0.5659(0.0207) *0.5598(0.0259) *
() * is CV of the number preceding it.
Table 3. Information exergy indices of rolling element degradation.
IndexNormal7 Mils Fault14 Mils Fault21 Mils Fault
SEx2.9817(0.0040) *3.5170(0.0047) *3.5826(0.0094) *3.4769(0.0112) *
Mv00.1901(0.0569) *0.2147(0.0981) *0.1838(0.1247) *
Std00.0161(0.0749) *0.0221(0.1448) *0.0113(0.3443) *
Pr00.2697(0.0555) *0.3200(0.0770) *0.2648(0.1249) *
() * is CV of the number preceding it.

