Article

Self-Organization at Aqueous Colloid-Membrane Interfaces and an Optical Method to Measure the Kinetics of Exclusion Zone Formation

Institute for Frontier Science, 6114 LaSalle Ave #605, Oakland, CA 94611, USA
*
Author to whom correspondence should be addressed.
These authors contributed equally to this work.
Entropy 2014, 16(11), 5954-5975; https://doi.org/10.3390/e16115954
Submission received: 14 July 2014 / Revised: 9 November 2014 / Accepted: 11 November 2014 / Published: 17 November 2014
(This article belongs to the Special Issue Entropy and EZ-Water)

Abstract

:
Exclusion zone (EZ) formation at water-membrane interfaces was studied via bright- and dark-field microscopy. Various aqueous colloids including suspensions of charged microspheres, silicon dioxide particles, and raw whole milk were studied with Nafion® hydrophilic membranes. Interfacial formations observed included EZs and more complex patterns including striations, double layers, banding, dendritic aggregates of particles, and double-stranded structures resembling Birkeland current filaments in cold plasmas. A complex three-dimensional dynamic structure and continuous flow patterns persist in and around EZs, maintaining movement of the colloidal particles even after EZs are fully formed, for which a schematic is proposed. Since radiant energy is critical for EZ formation, we hypothesize that these interfacial phenomena are non-equilibrium dissipative structures that self-organize and self-maintain due to ongoing dynamic processes that may involve hydrodynamic interactions. Another experimental approach undertaken involved the construction of a microscope flow cell to measure the kinetics of EZ formation using sequential microphotography analyzed with macro-programmed ImageJ software to investigate effects of different types of conditioned water. No significant difference was found between spring water and the same water treated by a magnetic vortexer. A significant difference was found for municipal tap water compared to electrolyzed alkaline tap water from the same source.

Graphical Abstract

1. Introduction

Intracellular water, so vital to the living state, is mainly interfacial water near membranes and large macromolecules. There is increasing evidence that supports the concept that most of this water is ordered unlike bulk water and that this water structure plays a critical role in biological functions [1].
An in vitro model to study interfacial water was discovered by Pollack and associates at the University of Washington in Seattle. Water adjacent to a charged hydrophilic membrane spontaneously self-organizes in the presence of ambient light to form an “exclusion zone” (EZ), a region that excludes colloidal particles and solutes and extends up to hundreds of microns from the membrane, much larger than anticipated by conventional physical theory [24]. Studies on the electrical properties, viscosity, refractive index, and other physical properties of this water lead to the conclusion that EZ water appears to be a new phase of water whose structure differs substantially from that of bulk water or ice [5].
The EZ manifests as a clear zone in an aqueous colloid, for example, of charged polystyrene microspheres that move away from the membrane. The phenomenon is readily observed, reproducible, and can be photographed using optical microscopy [3]. We explored EZ phenomena using dark- and bright-field microscopy at various magnifications to investigate what further insights, if any, might be obtained. We used a variety of charged colloidal particles, including positively and negative charged polystyrene microspheres, silica particles, as well as the complex natural colloid, milk, comprised of colloidal proteins and fat, in order to explore the EZ phenomena broadly. We discovered more complex dynamical patterns that spontaneously self-organize near the membrane interface. Nafion®, a sulfonated tetrafluoroethylene based fluoropolymer-copolymer, which has unique ionic properties due to its perfluorovinyl ether groups terminated with sulfonate groups on a Teflon backbone, was employed as the charged hydrophilic membrane for all experiments. Here we present some of these findings.
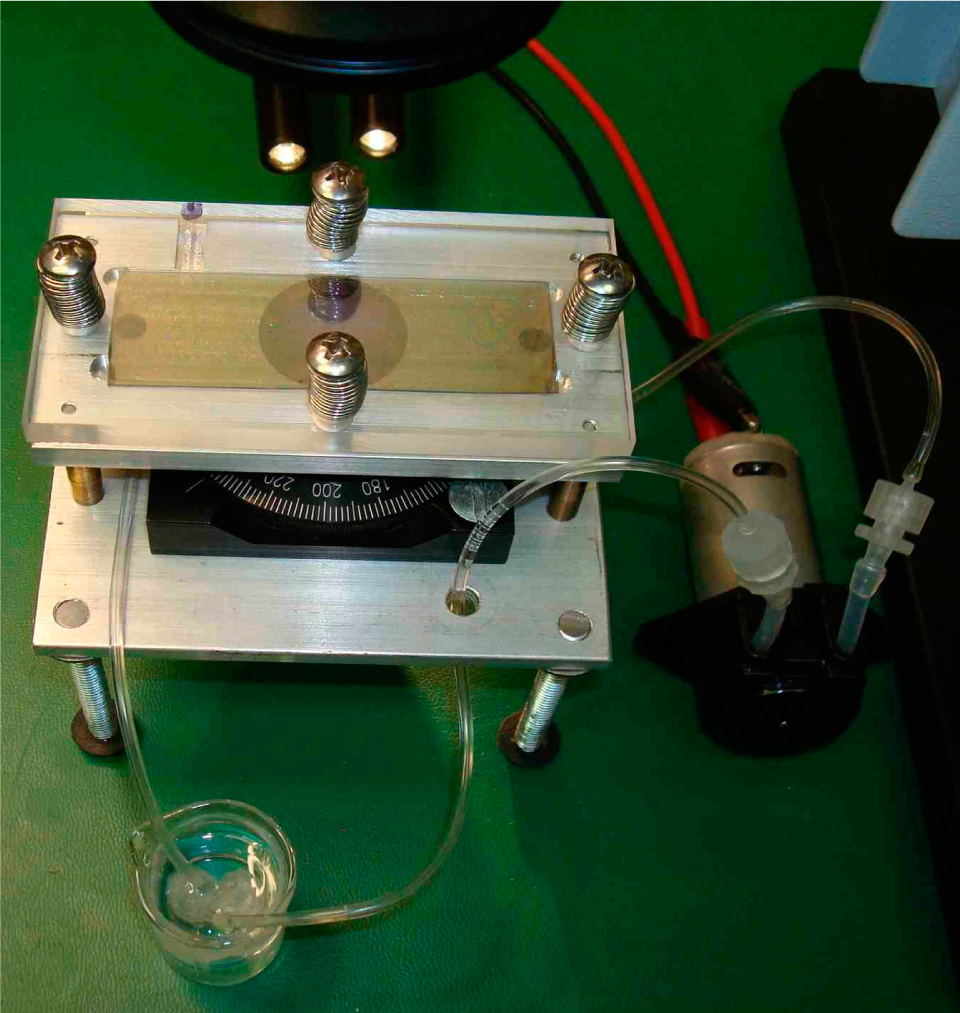
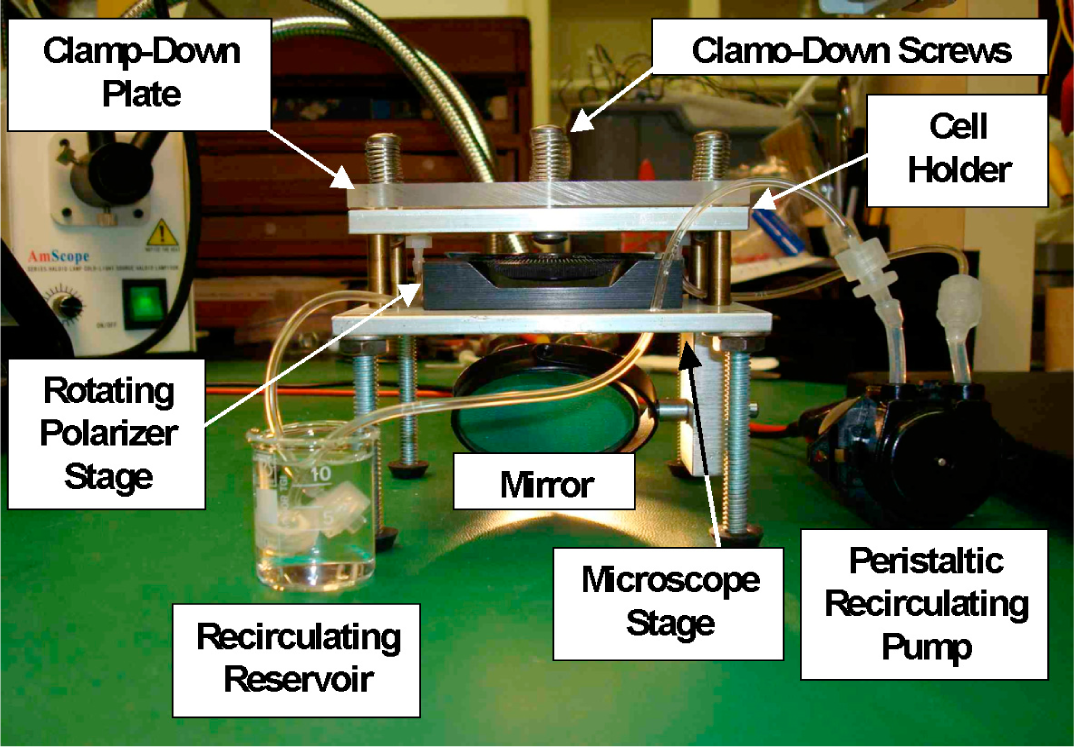
Secondly we wanted to explore the dynamics of EZ formation using water processed in different ways, for example, by mechanical vortexing and by exposure to externally applied electric, magnetic, or electromagnetic fields. Some of these waters thus processed for drinking are referred to in the health literature as “structured”, “functional”, “conditioned” or “activated”, along with statements of purported health claims such as improved hydration, detoxification, and other health benefits. Does water treated by such processes affect the size and kinetics of formation of EZs? If so, this might prove to be a quick assay for comparing processed waters and to learn more about how they may impact biological function through interfacial water. Observing EZs via optical microscopy proved to be insufficient for quantitative analysis. Thus we designed and built a custom apparatus involving a flow cell, microscopic stage, and software to measure precisely the kinetics of formation of EZs using an optical method. Here we also describe this quantitative method along with some preliminary data.

2. Methods and Procedures

2.1. Methods and Procedures for Sample Preparation and Microphotography

Aqueous colloids were prepared using various types of water and commercially available microspheres (Polysciences; Invitrogen) ranging in size from 0.5–3.0 μm. The commercial stock suspensions were diluted from 1:100 to 1:300 with the test waters to prepare appropriate concentrations for easily visible EZ formations. The microspheres included silicon dioxide, positively and negatively charged polystyrene, and ferromagnetic microspheres. Raw cow’s milk (unpasteurized, unhomogenized) and conventional pasteurized homogenized milk are natural colloids that were also tested. Nafion® membrane, 183 μm thick, (#117 DuPont, Fuel Cells Etc.) previously hydrated in the test water at room temperature, was used as a charged hydrophilic membrane. The test waters included type I laboratory reagent grade water (18.2 MΩ·cm from tap water treated by Barnstead NANOpure Diamond® water system model D11901); municipal tap water; electrolyzed reduced water (also called alkaline ionized water) from a commercial ionizer (Athena from AlkaViva); and various commercial bottled drinking waters. A 3 to 4 mm piece of the hydrated membrane was placed on a glass slide and 200 μL of the aqueous colloid was added using a micropipette. The wet Nafion® and colloid were carefully mixed, and a 24 × 50 mm glass cover slip was carefully placed onto the mixture to exclude air bubbles, at t = 0 using a stopwatch, measuring the time for EZ formation. Each sample was observed for up to 8 min or more. Microphotographs and videos were made using bright- and/or dark-field microscopy using a customized microscope with a removable dark-field condenser, Olympus and Nikon lenses, and magnification up to 8000× by means of digital enhancement, and using a C-mount S-video camera (JVC TK-C1380U) with an analog-digital converter (SIIG). A commercial calibrated micrometer slide (ruler 100 × 0.01 mm = 1 mm) was also photographed to measure the EZ. All experiments were conducted at ambient room temperature and moderate relative humidity.

2.2 Design and Construction of a Microscope Flow Cell to Measure EZ Size and Kinetics

A flow cell mounted on a custom-build microscope stage was designed as shown in Figures 1 and 2. It consists of a stage with an adjustable mirror at the bottom for light input (see Figure 2); a rotating polarizer stage; a flow cell holder mounted on standoffs; the flow cell embedded in the cell holder; and inlet and outlet ports in the cell holder for managing fluid flow.
A key feature of this flow cell was that a well-defined t = 0 could be established by abruptly stopping the flow. For example, after recirculating the aqueous colloid for typically 1 min, the recirculating pump was abruptly stopped. Flow came to a halt within seconds, and the EZ began to form immediately. This operating scheme was successful in determining t = 0 with a precision of ±1 s. The flow cell was used to repetitively produce well-defined EZ formations so that EZ kinetics could be studied with great precision. Typically 1-min vigorous recirculating was followed by 6 min rest to allow the EZ to form. These cycles, thus repeated, exhibited excellent reproducibility in the kinetics and size of EZs.
The flow cell was designed such that standard glass microscope slides could be used to form the chamber top and bottom. Small holes were drilled into the bottom slide as fluid inlet and outlet ports with O-ring seals. The bottom slide was placed into the machined-out trough of the cell holder. A rectangular piece of Nafion® was placed in the center of the bottom slide to serve as the membrane to be investigated while smaller pieces of Nafion® were placed near the corners of the slide to serve as same-thickness spacers to assure even height of the flow channel. The two slides were sealed by applying a thin bead of aquarium-grade silicone sealant (100% silicone) around the slide perimeter. The top glass slide was placed over this, and a cover plate of ¼” thick Plexiglas® was carefully placed on top to afford even compression from 4 spring-loaded clamp-down screws. A circular polarizing film acting as analyzer (with the polarizer positioned between the top slide and the cover plate) was to investigate polarizing effects, if any, in the water interface. Figure 2 shows another view of the device.
The device was designed so that the aqueous colloid could be flushed through to remove any residues from previous samples, recirculated for equilibration and to remove previous EZ formations, and brought to rest for EZ formation and multiple, sequential measurements. Tests confirmed excellent flow characteristics, showing a smooth laminar flow pattern in slow mode; a vigorous flow during flush mode to dislodge and remove air bubbles without disturbing the Nafion®; and no fluid movement in rest mode to allow the EZ to form unimpeded.
Time lapse photography was used to collect optical data. Microphotographs of the EZ formation from t = 0 onward at 10 s time intervals were taken until EZs were fully formed (t = 5.5 min) and a steady state was reached. The photographs were analyzed using the ImageJ software package, a Java-based image processing program developed and supported by the National Institutes of Health [6]. The raw data was acquired by a microscope (AmScope SM-4T, 7×–45× magnification) with a C-mount digital camera with a maximum resolution of 3488 × 2616 pixels. A Windows®-based program called AmScope MT, supplied with the camera (AmScope MT900, 9.1MP) was used to automatically control the image format and sequence timing of the image recording. Photographs were acquired in JPG-format at full resolution with automatic color balance and gray scale adjustments. The raw data was transferred to a desktop PC workstation for offline software development and data analysis with ImageJ. The raw JPG image sequences were loaded into ImageJ as virtual stack, which resided on the hard disk, because of the very large data volume. The virtual stack was converted to TIF-format for processing in ImageJ. A rectangular region-of-interest was overlaid on a typical micrograph in such a way that a profile plot could be generated perpendicularly cutting across the Nafion® edge and extending beyond the largest expected width of the EZ. The cropped TIF-stack was now small enough to reside in computer RAM for more efficient image processing. A profile plot of 8-bit deep gray scale (256 gray levels) was created with ImageJ and stored in a TXT-format.
Each profile was characterized by a sharp absolute minimum corresponding to the Nafion® edge and a smooth relative minimum corresponding to the outer boundary of the EZ. The distance between these two minima was considered the size of the EZ at t = tx. An ImageJ macro was written to automatically process each profile plot by fitting curves through the minima and then extracting the corresponding distance values.
Pilot testing of the device was performed using 2 μm carboxylated polystyrene microspheres in type I laboratory reagent grade water. Figure 3 shows the calculated means and standard deviations of EZ size vs. real time for three sequential runs performed over a 30 min period, showing that the system is stable and yields reproducible results. The upturn at t = 6 min was found to be common to all runs, which is likely the result of a dissipating EZ and indicates that 5 min is a sufficient monitoring time.

3. Results

Key observations discussed in detail herein include the following: (1) A range of complex dynamic patterns of organization of colloid particles near the membrane interface were observed, with pattern formations extending up to 3 mm from the membrane. (2) A three-dimensional dynamic structure and persistent flow pattern to the EZ near the membrane interface was observed in photographs taken at sequential focal depths. (3) No stable EZ was observed using Plexiglas® microscope slides. (4) Using the microscope flow chamber device, significant differences in EZ kinetics were shown for electrolyzed alkaline water compared to municipal tap water, but not for vortexed water compared to unvortexed water.

3.1. Highlights of New Findings from Microphotography

We replicated earlier findings by Pollack and colleagues that positively (amidine) and negatively (carboxylated) charged polystyrene microspheres from 1–3 μm in diameter produced EZs appearing as clear zones up to about 0.6 mm from a Nafion® membrane [15]. Here we present only interfacial patterns that go beyond previously published results.
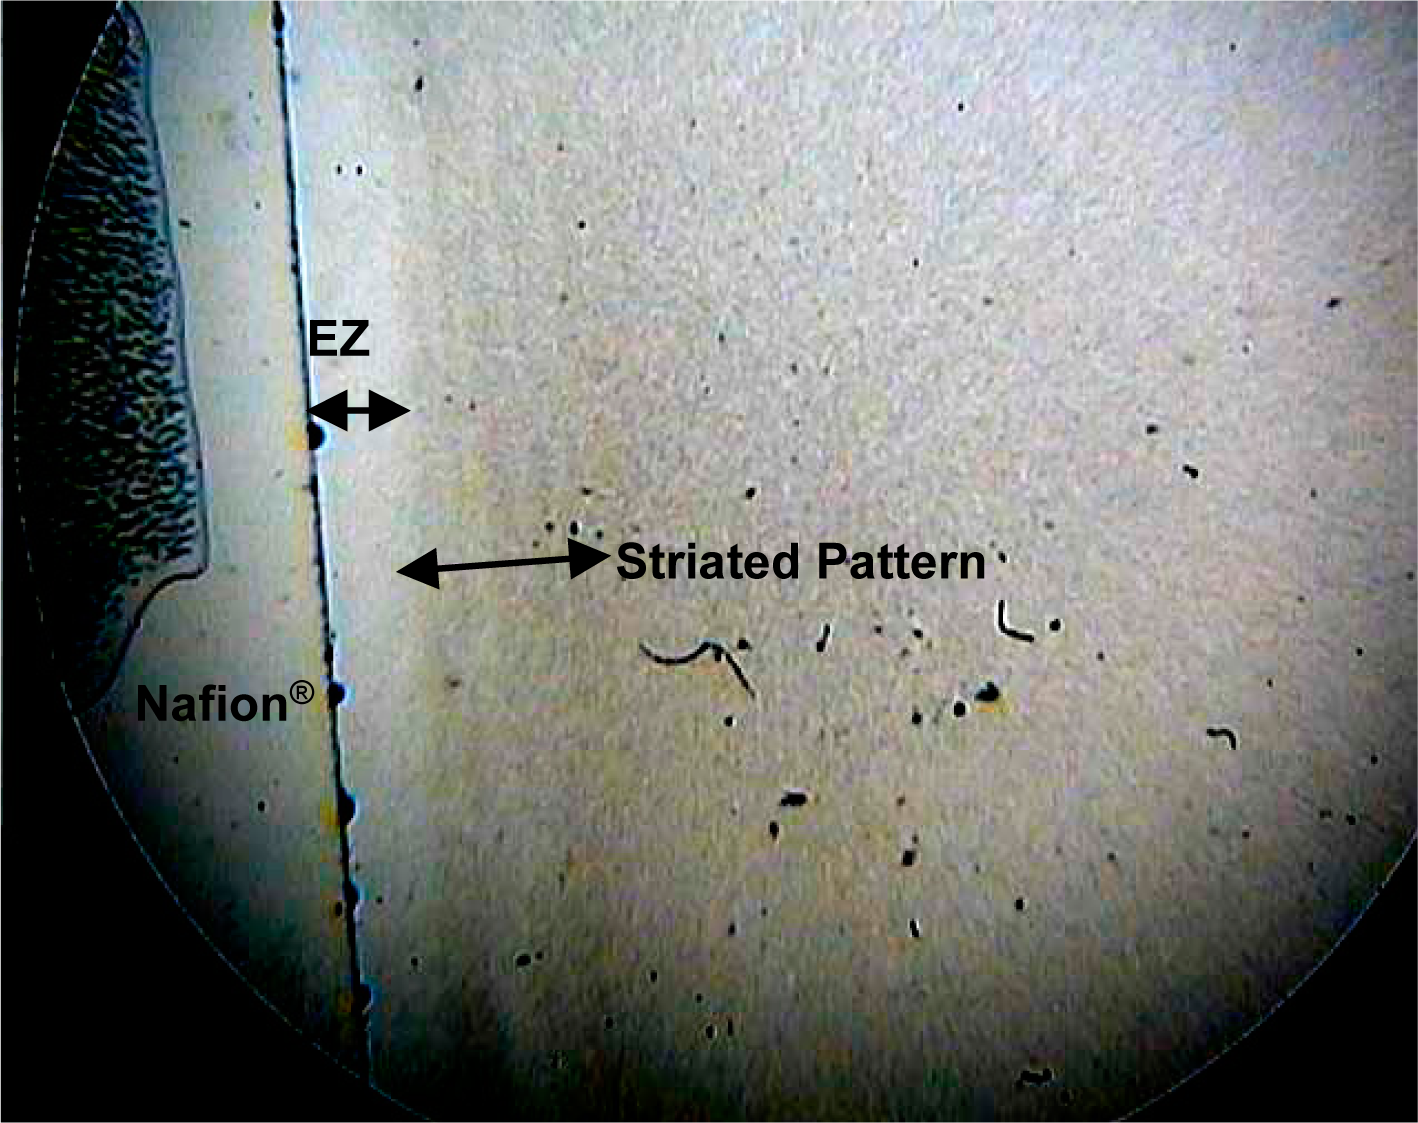
Figure 4 shows the pattern obtained at t = 6 min from 1 μm amidine microspheres in pH 9.2 electrolyzed alkaline water produced from a commercial water ionizer (AlkaViva Athena). The Nafion® is on the left hand side, and immediately to the right of the EZ, which is about 0.4 mm, a striated pattern of the microspheres is observed, showing an ordered region extending to 1 mm distance from the Nafion®.
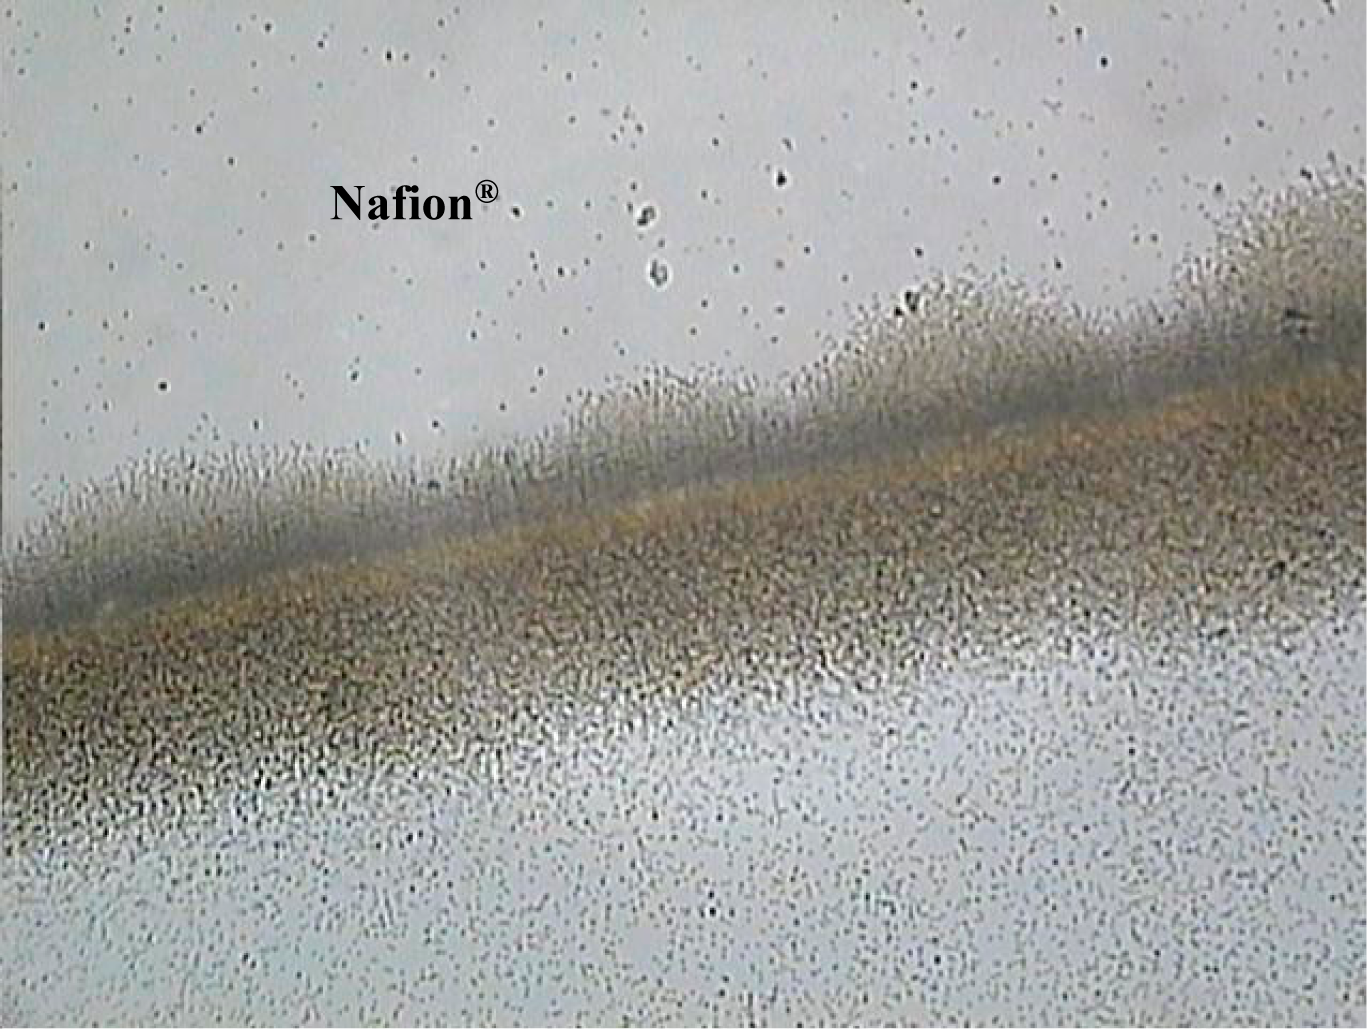
Figure 5 shows the interfacial pattern at t = 5 min formed from 1 μm silicon dioxide microspheres in type I laboratory reagent grade water (18.2 MΩ·cm), pH 7.0, and Nafion® at the upper left. These microspheres were strongly attracted to the edge of the negatively charged membrane. Here the EZ zone is faint and indistinct, observed just beyond the “swarm” of microspheres. These samples also showed a highly dynamic movement of the microspheres immediately adjacent to the membrane, which continued over time, reminiscent of swarming bees.
Silicon dioxide is amphoteric and at pH 7.0, the colloidal particles would be expected to carry little or no charge, unlike the charged polystyrene microspheres typically used to demonstrate EZ phenomena. Additionally, its density is about 2 g/cm3, approximately twice that of the polystyrene microspheres whose density is approximately the same as water. The different physical characteristics of silicon dioxide would be expected to impact the dynamics at the membrane interface in novel ways.
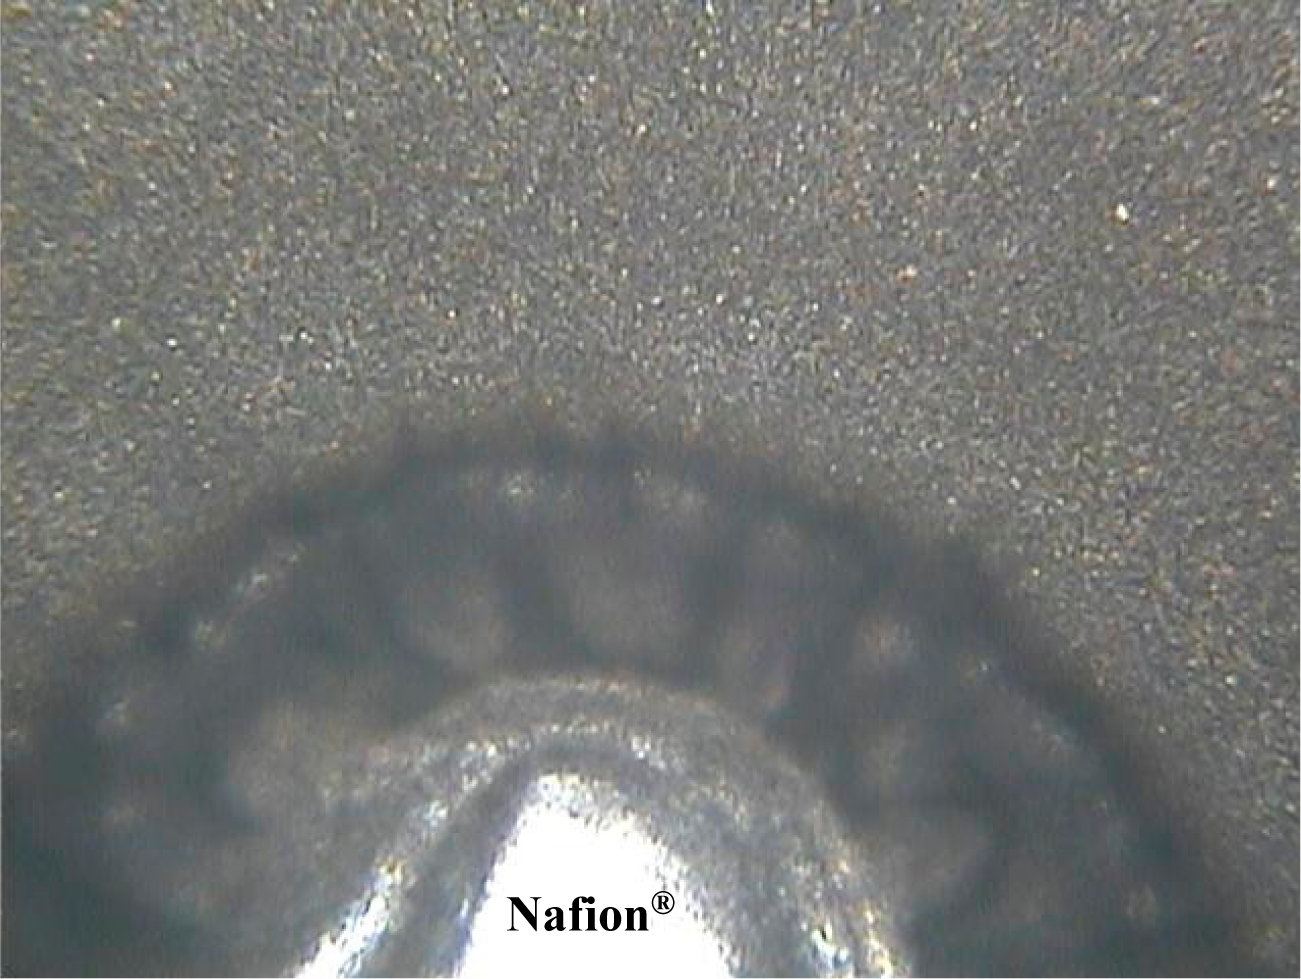
Figure 6 shows the same sample at higher magnification, revealing details of the self-organizing, dendritic growth of filamentous aggregates of the microspheres on the Nafion® side of the interface.
Figure 7 shows the complex dynamical pattern of raw whole milk around Nafion® as observed in bright-field microscopy. Raw whole cow’s milk is a natural heterogeneous aqueous colloid consisting of a wide range of size of fat globules up to about 7 μm in diameter, as well as soluble proteins (mostly casein and whey), and electrolytes. Not only is milk a complex mixture; its heterogeneity, wide range in particle size, and its organic, unprocessed integrity make this test sample unique. A similar pattern was observed using pasteurized, homogenized milk that was less distinctive (data not shown).
The interfacial pattern observed, which extends out to 0.6 mm beyond the membrane, is reminiscent of the Birkeland currents (field-aligned currents) [7] in a cold discharge plasma, i.e., a plasma discharge before breakdown into glow discharge or arcing. These currents tend to form helical twisted pairs of filaments similar in appearance to the pairs of particle streamers visible here. Other researchers have recently considered the similarity of charged colloidal suspensions and cold plasmas [8]. In addition, the anomalous behavior of the floating water bridge [9] comprised of partially ionized liquid water has been analyzed by applying principles of ionized gas plasmas to the charged particles in the liquid [10].
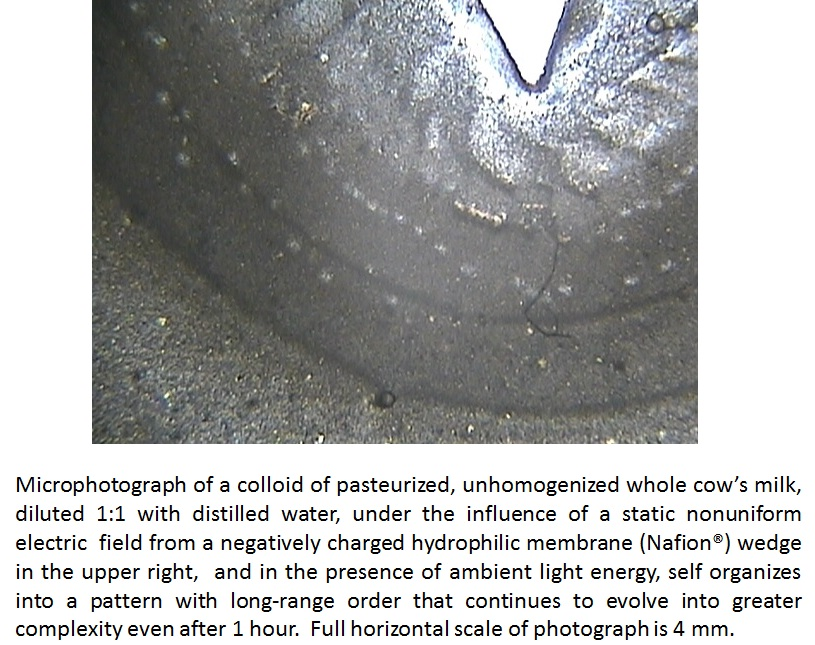
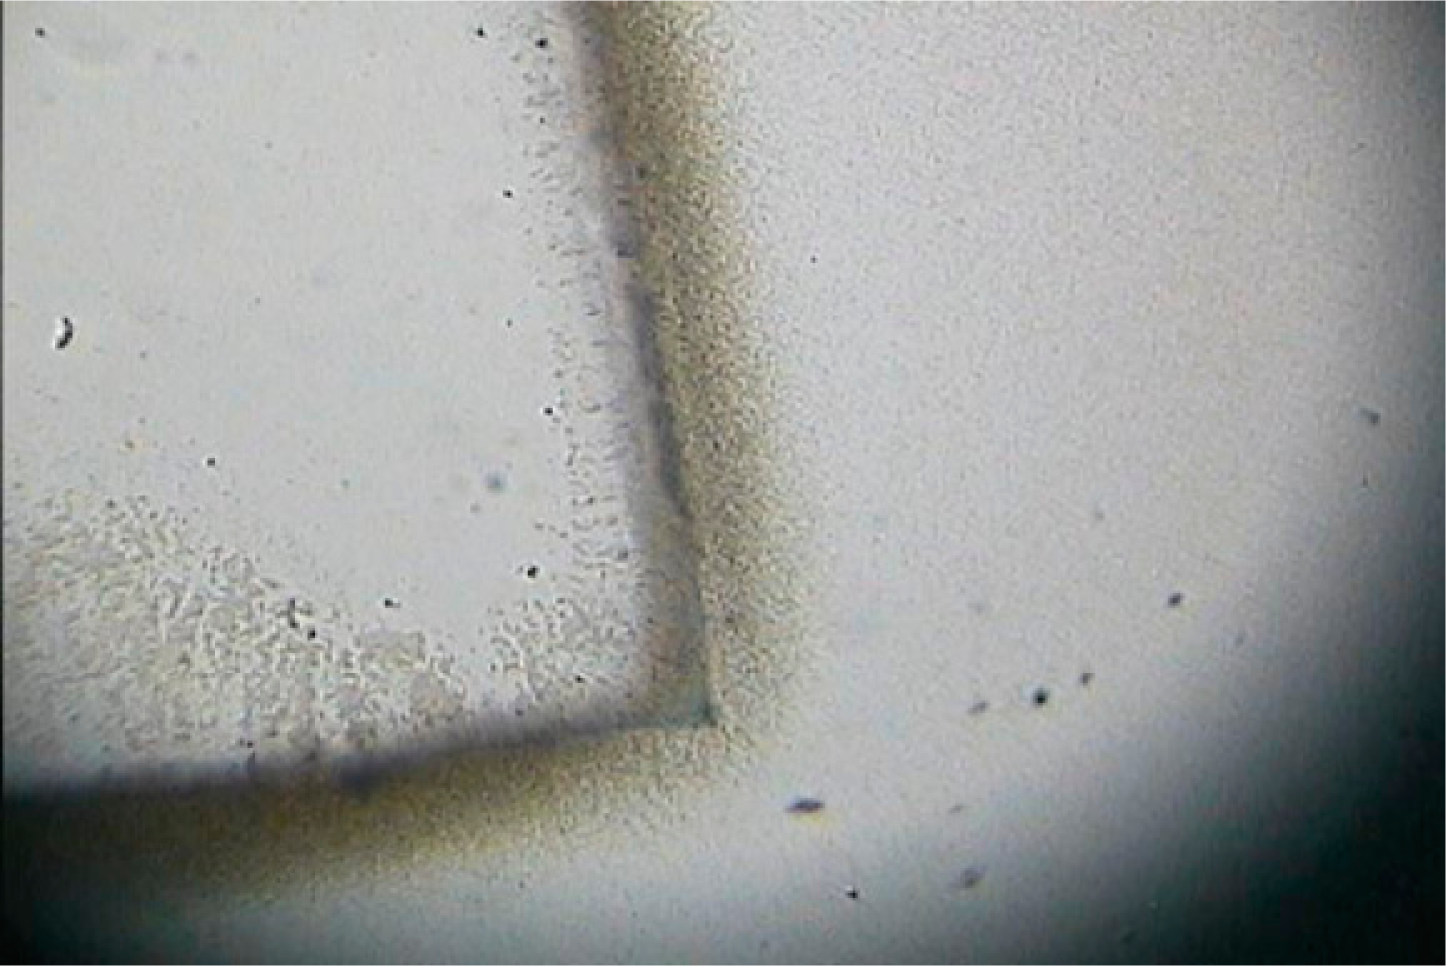
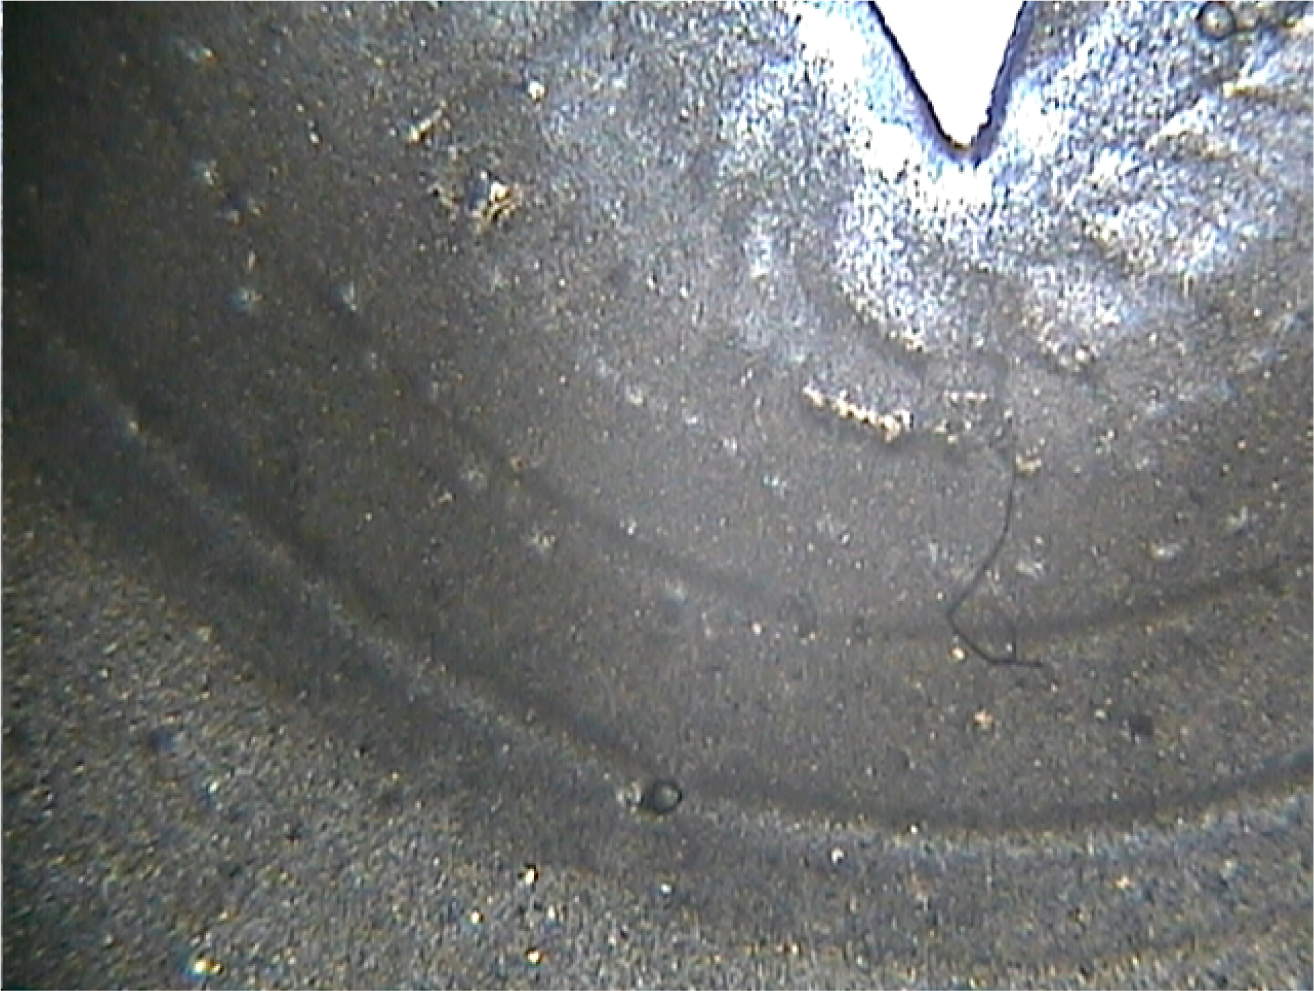
Figure 8 shows pasteurized unhomogenized whole milk diluted 1:1 with distilled water with a Nafion® wedge after 1 h as observed in bright-field microscopy. The interfacial pattern shows greater size (3 mm) and complexity than milk exposed to Nafion® for shorter time durations. A series of bands and small clear zones can be seen. Remarkably, there are two well-defined narrow bands at the furthest extent of the pattern, apparently resisting dispersion.
Figure 9 shows the interfacial pattern obtained using 1 μm carboxylated polystyrene microspheres, Nafion®, and type I laboratory reagent grade water at low magnification as observed in dark-field microscopy. Here the microspheres appear bright because they diffract the light, and the regions without microspheres appear dark. The EZ is not completely clear, but shows “streamers” of microspheres perpendicular to the Nafion® edge. Moreover, such streamers in the EZ layer are typically seen with dark-field microscopy in numerous samples composed of charged microspheres, pure water, and Nafion®. A double layer structure to the EZ is also seen here, which is less typical. The innermost EZ that is relatively clear is about 0.1 mm, and the outer EZ that appears as a “halo” is about 0.6 mm from the Nafion® edge.

3.2. Microphotographic Analysis of the Interface at Sequential Depths of Focus

Upon numerous microscopic observations with different samples, we discovered that there was a three-dimensional dynamic structure and persistent flow pattern in the EZ, i.e., that EZ are more complex than clear zones that appear around membranes. Moreover, focusing on sequential depths of focus at the interfaces, we found different directional movements of the microspheres as well as different distribution patterns. Figures 1017 show the fully formed EZ around Nafion® membrane at t = 5 min with 2 μm carboxylated microspheres and type I laboratory reagent grade water. We focused initially on the uppermost region of the sample on the z-axis and proceeded downward along the z-axis in approximately 25 μm increments with each subsequent photograph, to the last focal point at the bottom region of the sample closest to the glass slide in Figure 17.
Unfortunately these still photographs cannot convey the dynamics of the microspheres that continue even after the EZ layer reaches its full size, suggesting that EZs once formed are not static structures, but dynamic structures that reach a maximum size and steady state before beginning to disperse after approximately 6–8 min, which is likely due to diffusion.
From microscopic observations in sequential focal planes as shown in Figures 1017, we arrive at the schematic shown in Figure 18, which depicts a cross-section of a typical sample. The movement of microspheres is toward the membrane at the glass-membrane interface, and away from the membrane in the center of the aqueous region. The EZ boundary is most clearly seen when one focuses on the central aqueous region of the sample. The particle movement as shown by the arrows persists even after full formation of the EZ.
The presence of the glass slide and cover slip adjacent to the hydrophilic membrane renders this in vitro system a many-body interactive system in mechanics, more complex than a 2-body system of Nafion® and aqueous colloid alone. Since glass is amphoteric, hydrophilic, and may also carry a net negative charge, it may interact in similar ways as Nafion® with water. Moreover, surface tension effects from the cover slip and slide that “sandwich” the membrane are expected to be involved in the dynamics, too. Yet so much research on aqueous systems is conducted in glass (in vitro, literally), and on microscopic systems, in particular, sandwiched between two pieces of glass, that it is important to investigate and understand all of the interactions that may occur in this model system.

3.3. Microscopic Studies of EZ Using Plexiglas® Materials

Plexiglas® (polymethylmethacrylate with formula (C5O2H8)n ) was also investigated as a replacement material for the microscope glass slide, cover slip, or both, to examine the effect on EZ formation and interfacial dynamics. Because we also planned to design and build a sample chamber for kinetic studies, this would be important to investigate, as it would be much easier to fabricate one from Plexiglas® rather than from glass. Results show that EZs form initially using a Plexiglas® slide, but they are much smaller in size (0.1 mm) and unstable, fully dissipating in approximately 3 min. Moreover, subsequent sample preparations using the same Plexiglas® slide with a glass or Plexiglas® cover slip do not show reproducible EZs. Figure 19 shows the rapid dissipation of the EZ obtained using a Plexiglas® slide with a glass cover slip.

3.4. Summary of Findings from Microscopic Observations

Interfacial water in colloids at charged hydrophilic membranes typically exhibit EZ phenomena. However, more complex dynamic, self-organized patterns are also seen dependent upon the component materials. Silicon dioxide microspheres suspended in water swarm and aggregate near the membrane, forming dendritic structures at the interface. The natural colloid, raw whole cow’s milk, yields an EZ with an ultrastructure resembling field-aligned currents in gas plasmas and banding of colloidal particles up to 3 mm from the membrane. Dark field microscopic examination of more typical EZ formations show streamers of microspheres in the EZ region. Photographic analysis of EZ structures in focal planes of depth ranging from 0–185 μm, the thickness of the Nafion® membrane, reveals that the microspheres migrate toward the Nafion® at the glass interfaces and away from the Nafion® at the center, and furthermore that EZs appear to be dynamic process structures self-maintained by continuous flows. For samples prepared using microscope slides, it appears that glass slides may be necessary to produce reliable and robust EZ, since Plexiglas® does not. This suggests that the microscope slide model may be a multi-body system where glass plays an interactive role in generating EZ formations.

3.5. Comparing Processed Waters Using Microscope Flow Chamber for Precise EZ Measurement

Treatment of a commercial bottled spring water for 20 min was performed using a Nikken PiMag Optimizer II®, which purportedly aerates the water through vortexing while simultaneously treating it with a 4400 Gauss magnetic field with opposing polarity within the impeller assembly at the bottom. The results comparing treated vs. untreated water using 1 μm carboxylated microspheres are shown in Figure 20. The treated water produces what appears to be a slightly smaller EZ than control, although the kinetics of EZ formation appear to be essentially the same. The data show a possible trend at t > 200 s, but it is insignificant (p = 0.06).
Figure 21 shows the results of 4 runs performed using municipal tap water, pH 7.1, compared to 4 runs performed on the same water processed by an ionizer (AlkaViva, Athena), pH 8.4. Water from the cathodic fraction following partial electrolysis is ionized alkaline (reduced electrolyzed) water. Some of the observed difference may be due to the pH difference, although the ionized alkaline water is unbuffered, and no substances have been added to it.

3.6. Concluding Remarks on the Microscopic Flow Chamber Device

The device yielded reproducible results for identical runs, either sequential or performed on different days (not shown). It appears to be capable of discerning differences in EZ kinetics. Whereas no significant difference or a possible trend (p = 0.06) was found for water treated by vortexing and magnetic field exposure vs. control, a significant difference (p = 0.009) was observed between electrolyzed reduced municipal water and untreated municipal water.

4. Conclusions and Discussion

As shown herein, EZ formations prepared using glass slides for study via optical microscopy sometimes show more complex patterns than simply a clear zone near the membrane interface. The particular interfacial formations obtained depend upon the materials used. Aqueous colloids of silicon dioxide microspheres swarmed and aggregated near the membrane, suggesting interacting forces and subsequent re-distribution in an energetically more favorable pattern of dendritic strands. Cow’s milk formed complex patterns with dynamic streams of colloidal particles that looked similar to Birkeland currents in cold plasmas, and also generated a series of distinct bands with long-range order up to 3 mm from the interface.
Furthermore, dark-field microscopy of EZ formations revealed streams of particles moving in the clear zone from membrane to EZ edge and vice versa. Microphotography through multiple focal planes of depth revealed a dynamic three-dimensional structure with particle flows that persist even when EZ formations are at steady state. These observations suggest that EZs and other spontaneous interfacial formations are dynamic process structures and that hydrodynamic interactions may play an important role.
There appear to be interactions from the use of glass microscope slides and cover slips used to demonstrate EZs. Glass interfaces appear to enhance EZ formation and maintenance, possibly due to the amphoteric and hydrophilic nature of glass. By contrast, Plexiglas® interfaces do not facilitate robust or stable EZs at hydrophilic membranes in the microscopic model. The boundary conditions—specific geometry of the sample and confinement of the aqueous colloid—apparently play a role in the interfacial pattern dynamics.
Likewise, studies on “driven” or “active” colloids show some similarities to the patterns shown here. There are reports on large-scale self-assembled patterns emerging from collective interactions between colloidal particles driven by external fields such as alternating electric or magnetic fields [11] and at low constant voltage [12]. The richness in behavior and dynamic structure reported is remarkable. These structures exist only while external energy is supplied, which is similar to EZ phenomena that also require a continuous supply of energy. By contrast, EZ formations manifest in charged aqueous colloids near a static nonuniform electric field associated with a charged hydrophilic membrane interface and driven by ambient visible light or infrared radiation. It is possible that EZ phenomena may be a special case of soft matter phenomena known as “driven” or “active” colloids, in which a symmetry-breaking perturbation is introduced by the charged hydrophilic membrane conveying a static nonuniform electric field.
EZ patterns including the more complex dynamical structures at aqueous colloid-membrane interfaces that we observed are hypothesized to be dissipative structures, i.e., complex dynamical structures in open thermodynamic systems able to self-organize into patterns and give rise to increased order and decreased entropy within this open thermodynamic system. These phenomena do not violate the Second Law of Thermodynamics, which maintains that the entropy of an isolated system never decreases because isolated systems always evolve toward thermodynamic equilibrium, a state with maximum entropy. EZ phenomena are not properties of isolated systems, since in order to form they require externally applied energy in the form of visible or infrared radiation [2]. Thus, the system is open to energy flows and not at equilibrium where the Second Law would apply. Rather, EZ formations may be at dynamic steady state or possibly even far-from-equilibrium, dependent upon energy flow for self-maintenance. This is consistent with non-equilibrium thermodynamics expounded by Prigogine and others [13]. A well-known example of a dissipative, self-organizing structure is a pattern of Benard cells associated with convection in a fluid. Thus, in membrane interfacial dynamics, an aqueous colloid exposed to a static nonuniform electric field and a continuous supply of electromagnetic radiation in the form of visible or infrared light spontaneously self-organizes to form a clear zone, the exclusion zone near the membrane, and as we showed, other, more complex interfacial patterns of the colloidal particles in some cases, too.
To understand the physical basis of these dynamical patterns that form in aqueous colloids out-of-equilibrium, we must consider the possible role of hydrodynamics as well as Coulombic interactions, Casimir forces, and van der Waals attractions. Hydrodynamic interactions are typically ignored in models of aqueous colloids at equilibrium. However, they are considered to play a major role in non-equilibrium processes in charged particle suspensions [14]. Hydrodynamic interactions describe forces mediated between colloidal particles via solvent flow. If a colloidal particle moves relative to the fluid, it creates a fluid velocity field around it that affects the motion of neighboring particles. Fields that induce particle motion lead to hydrodynamic interactions in colloids. We expect that for the interfacial systems described here, which involve a nonuniform electric field coupled with ambient radiant energy, hydrodynamic interactions including viscous solvent flow and electrokinetic phenomena may be involved in the dynamical pattern formation, including that of EZ phenomena. Because such hydrodynamic interactions are long range, decaying with distance as 1/r, they may contribute to the long-range spatial order of the patterns observed. Coulombic forces are also long-range, but they may be screened due to ions in the aqueous medium or oppositely charged colloidal particles that may be present, and thus their contribution may be partially compensated. Van der Waals interactions are very short-range, decaying with distance as 1/r6 and would be expected to contribute much less to these dynamic formations.
No fully elaborated fundamental physical analysis or computer simulation exists yet to predict or explain non-equilibrium dissipative self-organizing structures for aqueous charged colloids in general [15]. Such a model would require a more sophisticated theoretical treatment than those that have been previously published. A very large number of parameters combined with electrostatics and hydrodynamics and their coupling, including electro-osmosis and electro-hydrodynamic convection, would be involved [16]. Parameters including van der Waals interactions, Brownian motion, surface interactions from the glass or charged hydrophilic membrane boundaries, parameters characterizing the applied electromagnetic field, gravity, properties of the solvent, ions, and the size and shape of colloidal particles, must all be considered. Explaining the self-assembly of actively-driven colloids remains one of the challenging problems in interdisciplinary research on soft matter [17]. Nonetheless, some of the features we observed in interfacial patterns described here have been modeled by others. Computer simulations of certain key elements such as banding have been achieved, for example, for oppositely charged colloidal mixtures driven by AC electric fields that separate the colloidal particles into distinct bands [18]. Other elements of the dynamic patterns that we observed in silica colloids and in milk, the motion of charged particles in distinct lanes, called “laning”, has been modeled for colloidal mixtures driven by an external field [19]. Further work on computer simulations and other mathematical approaches may provide greater insights into nonequilibrium processes in colloids.
Quantum electrodynamics may also provide insights into the self-organization and long-range order of active aqueous colloids. The first systematic quantum electrodynamic (QED) theory of condensed matter was developed by Preparata [20]. This approach was extended to water by Del Giudice and colleagues to explain stable non-equilibrium states in liquid water [21]. They theorize that water has a particular structure consisting of a mixture of coherent and incoherent phases, such that water appears to be a matrix of two phases in co-existence—a “gaseous” or incoherent phase that includes coherent domains of 0.1 μm in which all the molecules oscillate in phase with a self-trapped electromagnetic field [22]. Thus, the water molecules within the coherent domains vibrate together in a state of coherent excitation in which photons are trapped in resonant states. As Voeikov and Del Giudice wrote, “These two phases (of water) have different thermodynamic parameters. The low entropy coherent domains are considered to be the EZ water, and the other is high entropy bulk water. This system can perform internal work such as self-organization to sustain its non-equilibrium state due to negentropy arousal from spontaneous non-coherent to coherent state conversion [23].” These coherent domains may possibly show coherence among themselves, too, and have been proposed to explain the EZ water near a charged membrane that excludes colloidal particles and solutes. Moreover, coherent domains provide order over long distances and can possibly also act as antennae for externally applied electromagnetic fields involved in the dynamic pattern formation of EZ layers and active colloids [24]. The QED theory of water is a promising approach toward understanding non-equilibrium processes in aqueous systems.
The microscope flow device and optical method using microphotography was found to measure reproducibly the kinetics and size of EZ formation. This method provides a quantitative approach to EZ measurements and offers the convenience of recirculating the aqueous colloid to return the system to a well-defined starting point for EZ formation and performing rapid sequential assays using ImageJ software that we adapted. However, it must be pointed out that this method involves the projection of the three-dimensional EZ onto 2-dimensional photographs and their subsequent optical analysis to determine the outer boundary of the clear zone. Thus, the method ignores the complexity of EZ structure described herein that can be observed at different focal planes. Nonetheless, it appears to be a useful tool to compare different types of water treatments to look for differences in EZ kinetics. Such differences may be related to subtle changes in water structure.
Understanding biological systems requires a fundamental understanding of self-organization, coherent dynamics, communication with the environment, and self-regulation, among other processes. EZ phenomena and interfacial water dynamics in which self-organization of dynamic patterns form spontaneously under non-equilibrium conditions with continuous energy input are useful as model systems toward understanding the complex behaviors of living systems, and especially the role of water in biological dynamics. It may also be useful to consider the living state as an energy flow organizing matter as well as a material structure organizing the flow of energy. Further studies on interfacial water and EZ phenomena are likely to yield many new insights into the living state.

Acknowledgments

We are grateful to the Federico and Elvia Faggin Foundation that supported this research in part.

Author Contributions

Harry Jabs designed and built the microscopic flow chamber to study the kinetics of EZ formation, conducted experiments with it, and analyzed these data. Beverly Rubik performed experiments on EZ pattern formation for different material systems using the bright- and dark-field microscope and explored the relationship of EZ pattern formation to active colloids and physical theory. Both authors have read and approved the final manuscript.

Conflicts of Interest

The authors declare no conflict of interest.

References

  1. Pollack, G.H. Cells, Gels, and the Engines of Life; Ebner and Sons Publishers: Seattle, WA, USA, 2001. [Google Scholar]
  2. Zheng, J.M.; Pollack, G.H. Long range forces extending from polymer-gel surfaces. Phys. Rev. E. 2003, 68, 031408. [Google Scholar]
  3. Zheng, J.M.; Chin, W.C.; Khijniak, E.; Pollack, G.H. Surfaces and interfacial water: Evidence that hydrophilic surfaces have long-range impact. Adv. Colloid Interface Sci. 2006, 127, 19–27. [Google Scholar]
  4. Chai, B.; Yoo, H.; Pollack, G.H. Effect of radiant energy on near-surface water. J. Phys. Chem. B. 2009, 113, 13953–13958. [Google Scholar]
  5. Pollack, G.H. The Fourth Phase of Water: Beyond Solid, Liquid, Vapor; Ebner and Sons Publishers: Seattle, WA, USA, 2013. [Google Scholar]
  6. Collins, T.J. ImageJ for microscopy. Biotechniques 2007, 43, 25–30. [Google Scholar]
  7. Peratt, A.L. Birkeland currents in cosmic plasma. In Physics of the Plasma Universe; Springer: New York, NY, USA, 1992; pp. 43–91. [Google Scholar]
  8. Lowen, H.; Royall, C.P.; Morfill, G.E. Charged colloidal suspensions and their link to complex plasmas. AIP Conf. Proc. 2011, 1397, 201–210. [Google Scholar]
  9. Fuchs, E.C.; Woisetschlaeger, J.; Gatterer, K.; Maier, E.; Pecnic, R.; Eisenkoelbl, H. The floating water bridge. J. Phys. D Appl. Phys. 2007, 40. [Google Scholar] [CrossRef]
  10. Johnson, R.J. Plasma-like behavior of partially ionized liquids. Part I: the floating water bridge. Water J 2012, 3, 132–145. [Google Scholar]
  11. Dobnikar, J.; Snezhko, A.; Yethiraj, A. Emergent colloidal dynamics in electromagnetic fields. Soft Matter 2013, 9, 3693–3704. [Google Scholar]
  12. Han, Y.; Grier, D.G. Colloidal electroconvection in a thin horizontal cell: I. microscopic cooperative patterns at low voltage. J. Chem. Phys. 2005, 122, 164701. [Google Scholar]
  13. Prigogine, I.; Nicholis, G. Self-Organization in Non-Equilibrium Systems; Wiley: Hoboken, NJ, USA, 1977. [Google Scholar]
  14. Rex, M.; Lowen, H. Influence of hydrodynamic interactions on lane formation in oppositely charged driven colloids. Eur. Phys. J. E Soft Matter 2008, 1, 143–150. [Google Scholar]
  15. Ivlev, A.; Lowen, H.; Morfill, G.; Royall, C.P. Complex Plasmas and Colloidal Dispersions: Particle-resolved Studies of Classical Liquids and Solids; World Scientific: London, UK, 2012; p. 267. [Google Scholar]
  16. Lowen, H.; Esztermann, A.; Wysocki, E.; Allahyarov, E.; Messina, R.; Jusufi, A.; Hoffmann, N.; Gottwald, D.; Kahl, G.; Konieczny, M.; Likos, C.N. Charged colloids and polyelectrolytes: From statics to electrokinetics. J. Phys. Conf. Ser. 2005, 11, 207–222. [Google Scholar]
  17. Aranson, I.S. Collective behavior in out-of-equilibrium colloidal suspensions. Comptes Rendus Physique 2013, 14, 518–527. [Google Scholar]
  18. Vissers, T.; van Blaaderen, A.; Imhof, A. Band formation in mixtures of oppositely charged colloids driven by an AC electric field. Phys. Rev. Lett. 2011, 106, 228303. [Google Scholar]
  19. Dzubiella, J.; Hoffmann, G.P.; Lowen, H. Lane formation in colloidal mixtures driven by an external field. Phys. Rev. E. 2002, 65, 021402. [Google Scholar]
  20. Preparata, G. QED Coherence in Matter; World Scientific: Singapore, Singapore, 1995. [Google Scholar]
  21. Arani, R.; Bono, I.; Del Giudice, E.; Preparata, G. QED coherence and the thermodynamics of water. Int. J. Mod. Phys. B. 1995, 9, 1813–1841. [Google Scholar]
  22. Del Giudice, E.; Vitiello, G. Role of the electromagnetic field in the formation of domains in the process of symmetry-breaking phase transitions. Phys. Rev. A. 2006, 74, 022105. [Google Scholar]
  23. Voeikov, V.L.; Del Giudice, E. Water respiration: the basis of the living state. Water J 2009, 1, 57–75. [Google Scholar]
  24. Del Giudice, E.; Spinetti, P.R.; Tedeschi, A. Water dynamics at the root of metamorphosis in living organisms. Water J. 2010, 2, 566–586. [Google Scholar]
Figure 1. Custom-built microscope stage with polarizer, flow cell, and peristaltic recirculating pump and plumbing.
Entropy 16 05954f1
Figure 2. Front view of microscope stage with mounted flow cell and accessories.
Entropy 16 05954f2
Figure 3. Mean values with bars showing standard deviations of three sequential runs for test samples comprised of 2 μm carboxylated polystyrene microspheres in type I laboratory reagent grade water.
Entropy 16 05954f3
Figure 4. 1-μm amidine polystyrene microspheres in electrolyzed reduced water, with Nafion® membrane on the left observed using bright field microscopy. Immediately next to the EZ, which is a clear zone of 0.4 mm, a complex pattern with striations of microspheres in rows parallel to the interface formed. (NOTE: Image enhanced with increased contrast and decreased brightness.)
Entropy 16 05954f4
Figure 5. 1 μm silicon dioxide microspheres in type I laboratory reagent grade water. Nafion® is at the upper left. Microspheres appear to swarm continuously toward the Nafion®, and the EZ is faint and indistinct. Full horizontal scale of photograph is 4.8 mm.
Entropy 16 05954f5
Figure 6. 1 μm silicon dioxide microspheres in type I reagent grade laboratory water, and Nafion® membrane at the top, at t = 5 min. The microspheres have self-organized into dendritic formations ranging up to approximately 15 μm long on the membrane side of the interface, entering from the swarm of microspheres below. The EZ below the swarm is indistinct.
Entropy 16 05954f6
Figure 7. Raw whole milk with a Nafion® wedge at the bottom, which appears white here in bright-field microscopy at t = 6 min. An indistinct clear zone is seen around the Nafion®. Beyond that are dark regions in a complex pattern in which particle streams have obscured the light. The interfacial region shown here at t = 5 min exhibits a pattern reminiscent of Birkeland currents, a non-equilibrium dissipative structure seen in cold plasmas. The upper region of the photograph shows the range of particle size of unhomogenized fat particles and their random distribution of particles in the bulk region. Pattern formation extends out to 1.5 mm from the membrane interface.
Entropy 16 05954f7
Figure 8. Pasteurized unhomogenized whole milk diluted 1:1 with distilled water and with a Nafion® wedge after 1 h as observed in bright-field microscopy. This interfacial pattern is larger (3 mm) and more complex than for any other samples tested. Full horizontal scale of photograph is 4.2 mm.
Entropy 16 05954f8
Figure 9. 1 μm carboxylated microspheres in type I reagent grade laboratory water with a Nafion® wedge in the lower right hand corner observed under a dark-field microscope. “Streamers” of microspheres in the inner clear zone are typical of the EZ that forms in this model system. Here, a secondary layer of the EZ is also observed, the “halo”. The clear zone is approximately 0.5 mm, and the halo ranges up to 1.5 mm from the membrane interface.
Entropy 16 05954f9
Figure 10. Nafion® at lower right, 2 μm carboxylated microspheres, type I reagent grade laboratory water. Initial focus at the uppermost region of sample on the z-axis, just beneath the glass cover slip. Microspheres are seen migrating toward Nafion® in the EZ region, starting from the outer edge of the EZ. The EZ size from membrane boundary to edge of the clear zone is approximately 0.5 mm.
Entropy 16 05954f10
Figure 11. Same sample as Figure 10. At this next focal plane approximately 25 μm downward into the depth of the sample the microspheres that have moved in closest to the membrane are in clear view. They appear to be moving outward in streamlets toward the EZ outer boundary. The EZ size from membrane boundary to edge of the clear zone is approximately 0.5 mm.
Entropy 16 05954f11
Figure 12. Same sample as Figure 10. At this next focal plane approximately 25 μm deeper into the sample, the streamlets of microspheres are no longer in clear focus, although the EZ boundary is coming into focus. The EZ size from membrane boundary to edge of the clear zone is approximately 0.5 mm.
Entropy 16 05954f12
Figure 13. Same sample as Figure 10. At this next focal plane we are approximately at the center of the sample in depth. The microspheres nearest to the membrane are no longer in focus. The EZ boundary is in clear focus at this depth. The EZ size from membrane boundary to edge of the clear zone is approximately 0.5 mm.
Entropy 16 05954f13
Figure 14. Same sample as Figure 10. At this next focal plane downward, the EZ remains distinct, although the microspheres nearest its boundary are somewhat out of focus. The microspheres that have migrated onto the Nafion® surface interior are beginning to come into focus. The EZ size from membrane boundary to edge of the clear zone is approximately 0.5 mm.
Entropy 16 05954f14
Figure 15. Same sample as Figure 10. At this next focal plane downward, the microspheres that have attached to the Nafion® surface are now clearly visible. The EZ boundary is considerably less distinct here. The EZ size from membrane boundary to edge of the clear zone is approximately 0.5 mm.
Entropy 16 05954f15
Figure 16. Same sample as Figure 10. At this next focal plane downward, the EZ is no longer as distinct, and the migration of microspheres from the EZ outer boundary toward the membrane-glass interface at the bottom of the sample is visible. The microspheres that have adhered to the membrane are in better focus. The EZ size from membrane boundary to edge of the clear zone is approximately 0.5 mm.
Entropy 16 05954f16
Figure 17. Same sample as Figure 10. This is the focal point at the bottom of the sample on the z-axis beyond which all focus is lost. The migration of microspheres toward the membrane is apparent within the EZ, which no longer shows such a distinct boundary here. The microspheres adhering to the membrane surface are most clearly in focus here. The EZ size from membrane boundary to edge of the clear zone is approximately 0.5 mm.
Entropy 16 05954f17
Figure 18. Schematic of cross section of microscope slide samples indicating the observed flow of microspheres that creates and maintains the EZ in the central focal plane of the sample.
Entropy 16 05954f18
Figure 19. Plexiglas® bottom slide with glass cover slip over Nafion® (lower right) using 2 μm carboxylated microspheres with type I laboratory reagent grade water at t = 3 min. The small EZ (0.1 mm) that had formed earlier has already dissipated. Full horizontal scale of photograph is 4 mm.
Entropy 16 05954f19
Figure 20. Comparison of runs on treated vs. untreated commercial bottled spring water using Nikken PiMag Optimizer II®, which vortexes water while treating it with magnetic field. No significant difference was found (p = 0.06).
Entropy 16 05954f20
Figure 21. Comparison of runs on municipal tap water and the same water processed by an ionizer that produces partially electrolyzed reduced alkaline water. There is a significant difference (p = 0.009) between the EZ kinetics for processed and unprocessed water.
Entropy 16 05954f21

