Automatic Sleep Stages Classification Using EEG Entropy Features and Unsupervised Pattern Analysis Techniques

 ,
,
Abstract
:1. Introduction
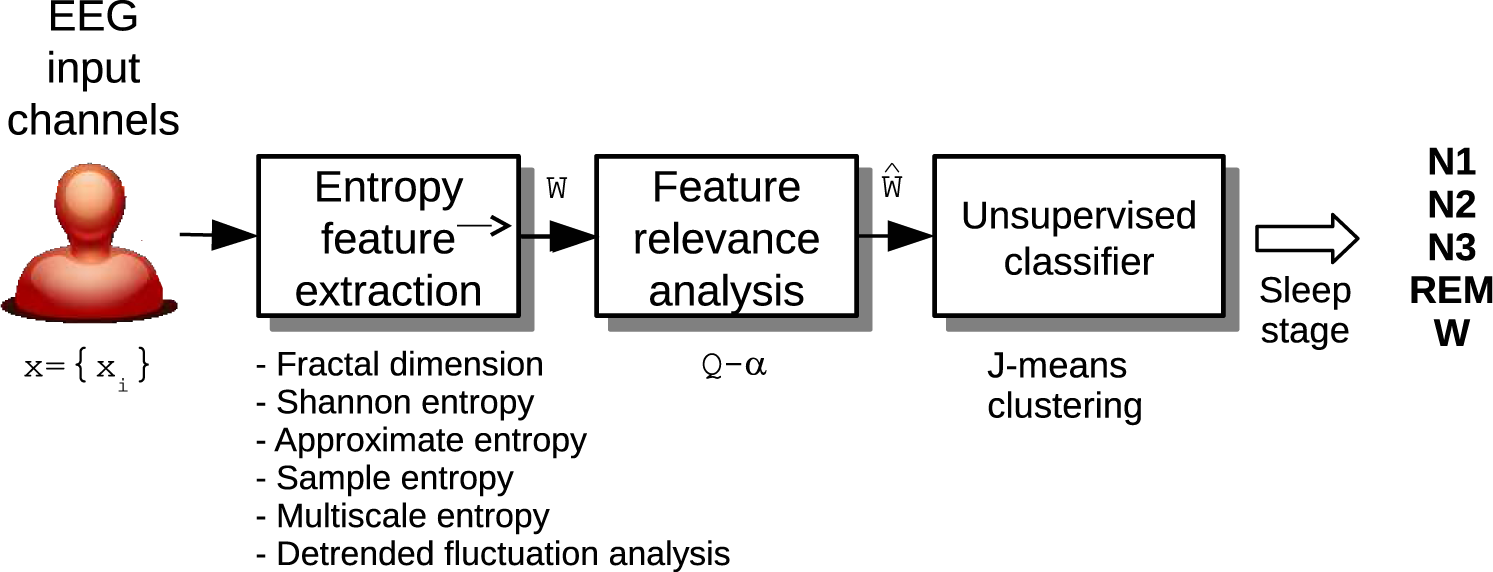
2. Method
2.1. Experimental Dataset
2.2. Feature Extraction
2.2.1. Fractal Dimension
2.2.2. Detrended Fluctuation Analysis
2.2.3. Shannon Entropy
2.2.4. Approximate Entropy
2.2.5. Sample Entropy
2.2.6. Multiscale Entropy
2.3. Feature Relevance Analysis
2.4. Sleep Stages Unsupervised Classifier
- Initialization: A standard k-means clustering is used to set an initial partition of the feature vectors and the centroids. This reduces the temporal cost of the partition calculation.
- Search: Given a tolerance threshold (4 standard deviations of the intra-cluster distance), find the unoccupied points (feature vectors that do not belong to any cluster).
- Update: Add a new cluster centroid at some unoccupied location and find the index of the best centroid to delete. Update the partition according to the new centroids.
- Finalize: If a local minimum is found in the previous iteration, stop. For each resulting cluster, a sleep stage can be assigned as the most frequent class (using a k-Neighbors method), which in clinical practice could be done by a whole cluster manual scoring. Otherwise return to step 2.
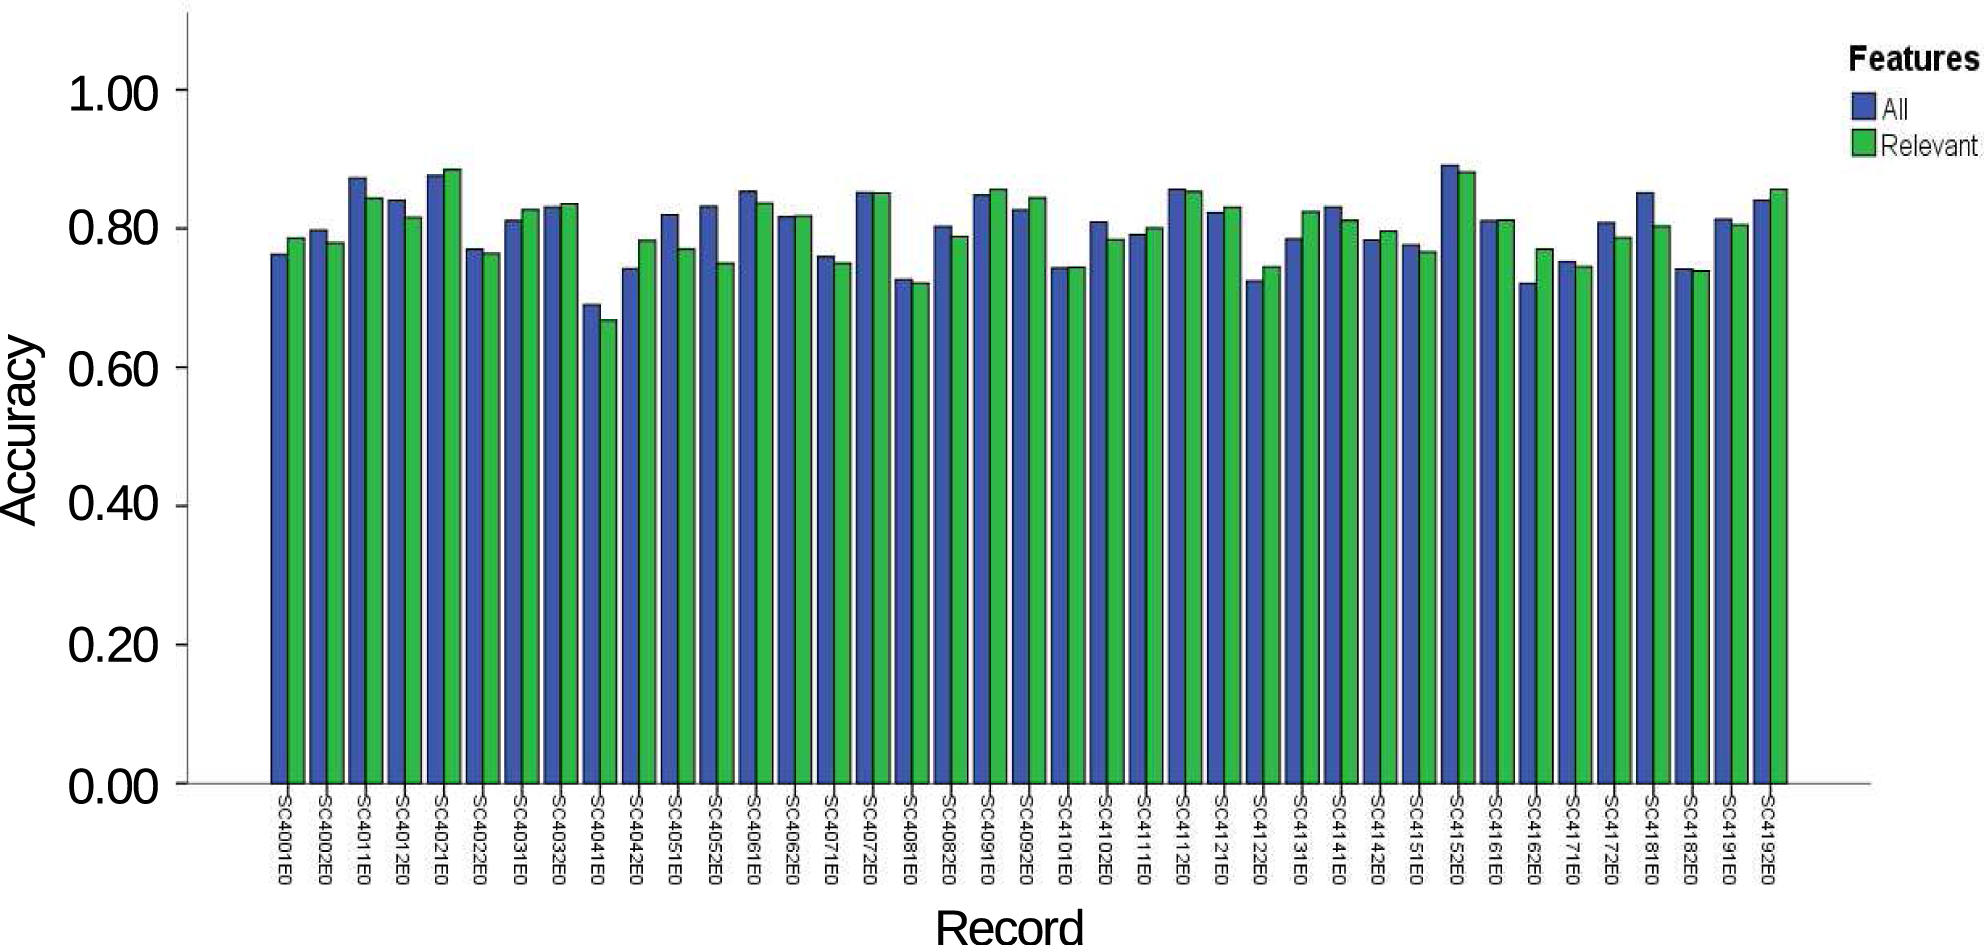
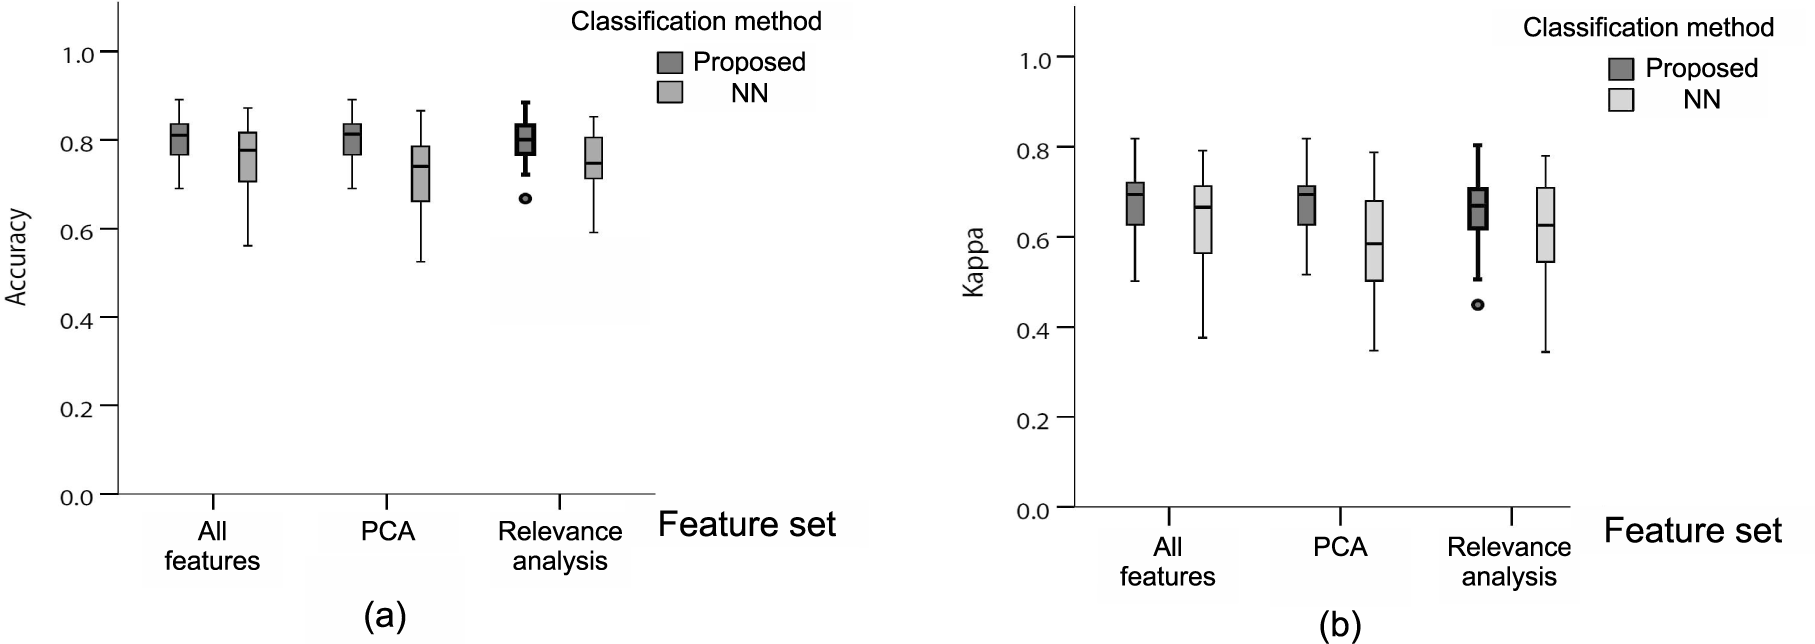
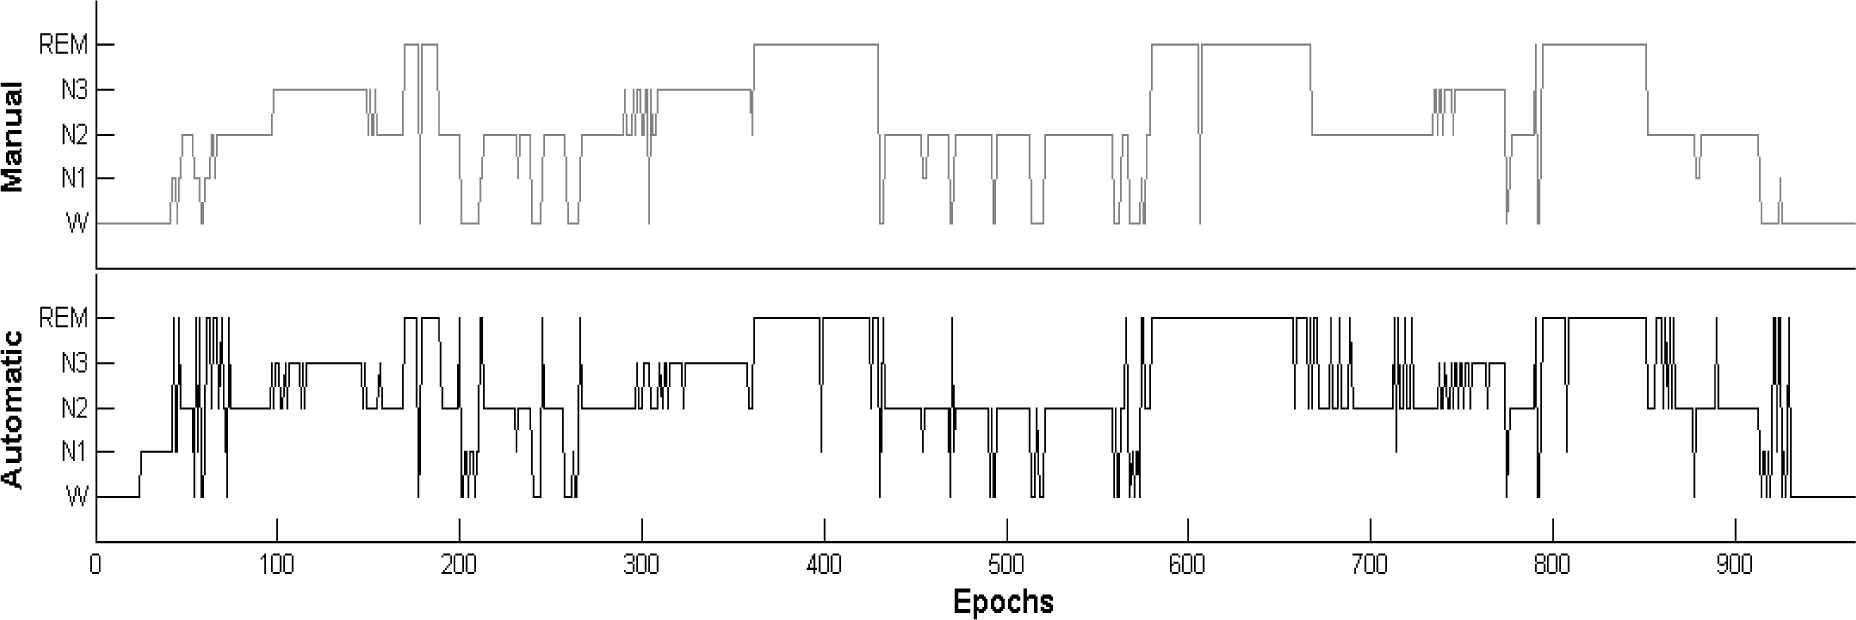
3. Results and Discussion
4. Conclusions
Acknowledgments
Author Contributions
Conflicts of Interest
References
- Saper, C.B.; Fuller, P.M.; Pedersen, N.P.; Lu, J.; Scammell, T.E. Sleep state switching. Neuron 2010, 68, 1023–1042. [Google Scholar]
- Halasz, P.; Bodizs, R. Dynamic structure of NREM sleep; Springer: London, UK, 2013. [Google Scholar]
- Rauchs, G.; Desgranges, B.; Foret, J.; Eustache, F. The relationships between memory systems and sleep stages. J. Sleep Res. 2005, 14, 123–140. [Google Scholar]
- Landmann, N.; Kuhn, M.; Piosczyk, H.; Feige, B.; Baglioni, C.; Spiegelhalder, K.; Frase, L.; Riemann, D.; Sterr, A.; Nissen, C. The reorganisation of memory during sleep. Sleep Med. Rev. 2014, 18, 531–541. [Google Scholar]
- Hublin, C.; Partinen, M.; Koskenvuo, M.; Kaprio, J. Sleep and mortality: A population-based 22-year follow-up study. Sleep 2007, 30, 1245–1253. [Google Scholar]
- Lovin, P.A.; Ehrenpreis, A.B. The role of polysomnography in the differential diagnosis of chronic insomnia. Am. J. Psychiatry. 1988, 145, 346–349. [Google Scholar]
- Steriade, M.; McCormick, D.A.; Sejnowski, T.J. Thalamocortical oscillations in the sleeping and aroused brain. Science 1993, 262, 679–685. [Google Scholar]
- Niedermeyer, E.; da Silva, F. (Eds.) Electroencephalography; Lippincott Williams and Wilkins: Philadelphia, PA, USA, 2005.
- Iber, C. The AASM Manual for the Scoring of Sleep and Associated Events: Rules, Terminology and Technical Specifications; American Academy of Sleep Medicine: Westchester, NY, USA, 2007. [Google Scholar]
- Hopfe, H.D.; Anderer, P.; Zeitlhofer, J.; Boeck, M.; Dorn, H.; Gruber, G.; Heller, E.; Loretz, E.; Moser, D.; Parapatics, S. Interrater reliability for sleep scoring according to the Rechtschaffen Kales and the new AASM standard. J. Sleep Res. 2009, 18, 74–84. [Google Scholar]
- Hopfe, H.D.; Kunz, D.; Gruber, G.; Klosch, G.; Lorenzo, J.L.; Himanen, S.L.; Kemp, B.; Penzel, T.; Roschke, J.; Dorn, H. Interrater reliability between scorers from eight European sleep laboratories in subjects with different sleep disorders. J. Sleep Res. 2004, 13, 63–69. [Google Scholar]
- Fraiwan, L.; Khaswaneh, N.; Ylweesy, K. Automatic sleep stage scoring with Wavelet Packets based on single EEG recording. Proc. World Acad. Sci. Eng. Technol. Paris 2009, 54, 385–488. [Google Scholar]
- Vuckovic, A.; Radivojevic, V.; Chen, A.; Popovic, D. Automatic recognition of alertness and drowsiness from EEG by an artificial neural network. Med. Eng. Phys. 2002, 24, 349–360. [Google Scholar]
- Robert, C.; Guilpin, C.; Limoge, A. Review of neural network applications in sleep research. J. Neurosci. Methods. 1998, 79, 187–193. [Google Scholar]
- Ronzhina, M.; Janousek, O.; Kolarova, J.; Novakova, M.; Honzik, P.; Provaznik, I. Sleep scoring using artificial neural networks. Sleep Med. Rev. 2012, 16, 251–263. [Google Scholar]
- Subasi, A.; Ercelebi, E. Classification of EEG signals using neural network and logistic regression. Comput. Methods Programs Biomed. 2005, 78, 87–99. [Google Scholar]
- Rodriguez-Sotelo, J.L.; Peluffo-Ordonez, D.; Cuesta-Frau, D.; Castellanos-Dominguez, G. Unsupervised feature relevance analysis applied to improve ECG heartbeat clustering. Comput. Methods Programs Biomed. 2012, 108, 250–261. [Google Scholar]
- Kemp, B.; Zwinderman, A.; Tuk, B.; Kamphuisen, H.; Oberye, J. Analysis of a sleep-dependent neural feedback loop: The slow-wave microcontinuity of the EEG. IEEE–BME 2000, 9, 1185–1194. [Google Scholar]
- Goldberger, A.L.; Amaral, L.A.; Glass, L.; Hausdorff, J.M.; Ivanov, P.C.; Mark, R.G.; Mietus, J.E.; Moody, G.B.; Peng, C.K.; Stanley, H.E. Physiobank, physiotoolkit, and physionet components of a new research resource for complex physiologic signals. Circulation 2000, 101, e215–e220. [Google Scholar]
- Van Sweden, B.; Kemp, B.; Kamphuisen, H.; van der Velde, E. Alternative electrode placement in (automatic) sleep scoring (Fpz-Cz / Pz-Oz versus C4-A1 / C3-A2). Sleep 1990, 3, 279–283. [Google Scholar]
- Mourtazaev, M.; Kemp, B.; Zwinderman, A.; Kamphuisen, H. Age and gender affect different characteristics of slow waves in the sleep EEG. Sleep 1995, 7, 557–564. [Google Scholar]
- Rechtschaffen, A.; Kales, A. A Manual of Standardized Terminology, Techniques and Scoring System for Sleep Stages of Human Subjects; US Department of Health, Education, and Welfare: Bethesda, MD, USA, 1968. [Google Scholar]
- Fraiwan, L.; Lweesy, K.; Khasawneh, N.; Wenz, H.; Dickhaus, H. Automated sleep stage identification system based on time-frequency analysis of a single EEG channel and random forest classifier. Comput. Methods Programs Biomed. 2012, 108, 10–19. [Google Scholar]
- Raghavendra, B.S.; Dutt, N.D. Computing fractal dimension of signals using multiresolution box-counting method. Int. J. Inf. Math. Sci. 2010, 6, 50–65. [Google Scholar]
- Shoupeng, S.; Peiwen, Q. A fractal-dimension-based signal processing technique and its use for nondestructive testing. Russ. J. Nondestruct. Test. 2007, 43, 270–280. [Google Scholar]
- Peng, C.K.; Buldyrev, S.V.; Havlin, S.; Simons, M.S.; Eugene, H.; Goldberger, A.L. Mosaic organization of DNA nucleotides. Phys. Rev. E 1994. [Google Scholar]
- Peng, C.; Havlin, S.; Stanley, H.; Goldberger, A. Quantification of scaling exponents and crossover phenomena in nonstationary heartbeat time series. Chaos 1995, 5, 82–87. [Google Scholar]
- Fell, J.; Roschke, J.; Mann, K.; Schaffner, C. Discrimination of sleep stages: a comparison between spectral and nonlinear EEG measures. Electroencephalogr. Clin. Neurophysiol. 1996, 98, 401–410. [Google Scholar]
- Pincus, S. Approximate entropy (ApEn) as a complexity measure. Chaos Interdiscip. J. Nonlinear Sci. 1995, 5, 110–117. [Google Scholar]
- Richman, J.S.; Moorman, J.R. Physiological time–series analysis using Approximate Entropy and Sample Entropy. Am. J. Physiol.–Heart Circulatory Physiol. 2000, 278, H2039–H2049. [Google Scholar]
- Costa, M.; Goldberger, A.L.; Peng, C.K. Multiscale entropy analysis of biological signals. Phys. Rev. E 2005, 71, 021906. [Google Scholar]
- Toennies, K.D.; Celler, A.; Blinder, S.; Moeller, T.; Harrop, R. R. Scatter segmentation in dynamic SPECT images using principal component analysis. Proceedings of the SPIE (Medical Imaging 2003), San Diego, CA, USA, Part I, 15 February 2003; pp. 507–516.
- Wolf, L.; Shashua, A. Feature selection for unsupervised and supervised inference: The emergence of sparsity in a weighted-based approach. Proceedings of the Ninth IEEE International Conference on Computer Vision, Nice, France, 13–16 October 2003; pp. 378–384.
- Hansen, P.; Mladenovic, N. J-Means: a new local search heuristic for minimum sum of squares clustering. Pattern Recognit. 2001, 34, 405–413. [Google Scholar]
- Gunes, S.; Polat, K.; Yosunkaya, S. Efficient sleep stage recognition system based on EEG signal using k-Means clustering based feature weighting. Expert Syst. Appl. 2010, 37, 7922–7928. [Google Scholar]
- Koley, B.; Dey, D. An ensemble system for automatic sleep stage classification using single channel EEG signal. Comput. Biol. Med. 2012, 42, 1186–1195. [Google Scholar]
- Hese, P.V.; Philips, W.; Koninck, J.D.; de Walle, R.V.; Lemahieu, I. Automatic detection of sleep stages using the EEG. Proceedings of the 23rd Annual International Conference of the Engineering in Medicine and Biology Society, 25–28 October 2001; 2, pp. 1944–1947.
- Oropesa, E.; Cycon, H.L.; Jobert, M. Sleep stage classification using Wavelet Transform and neural network. Int. Comput. Sci. Inst. 1999. Available online: http://www.researchgate.net/publication/216570220_Sleep_Stage_Classification_Using_Wavelet_Transform__Neural_Network accessed on 10 December 2014.
- Krakovska, A.; Mezeiova, K. Automatic sleep scoring: A search for an optimal combination of measures. Artif. Intell. Med. 2011, 53, 25–33. [Google Scholar]
- Shambroom, J.R.; Fabregas, S.E.; Johnstone, J. Validation of an automated wireless system to monitor sleep in healthy adults. J. Sleep Res. 2012, 21, 221–230. [Google Scholar]
- Swarnkar, V.; Udantha, R.A. Bispectral analysis of single channel EEG to estimate macro-sleep-architecture. Int. J. Med. Eng. Inform. 2014, 6, 43–64. [Google Scholar]
- Liang, S.F. Automatic stage scoring of single-channel sleep EEG by using Multiscale Entropy and autoregressive models. IEEE Trans. Instrum. Meas. 2012, 61, 1649–1657. [Google Scholar]
- Viera, A.; Garrett, J.M. Understanding interobserver agreement: The Kappa statistic. Fam. Med. 2005, 5, 360–363. [Google Scholar]
- Weiss, B.; Clemens, Z.; Bodizs, R.; Halasz, P. Comparison of fractal and power spectral EEG features: Effects of topography and sleep stages. Brain Res. Bull. 2011, 84, 359–375. [Google Scholar]
- Susmakova, K.; Krakovska, A. Discrimination ability of individual measures used in sleep stages classification. Artif. Intell. Med. 2008, 44, 261–277. [Google Scholar]
- Eckehard, O.; Achermann, P.; Wennekers, T. The sleeping brain as a complex system. Philos. Trans. R. Soc. A: Math. Phys. Eng. Sci. 2011, 369, 3697–3707. [Google Scholar]
- Buckelmuller, J. Trait-like individual differences in the human sleep electroencephalogram. Neuroscience 2006, 138, 351–356. [Google Scholar]
- Dongen, H.P.V.; Vitellaro, K.M.; Dinges, D.F. Individual differences in adult human sleep and wakefulness. Leitmotif for a research agenda. Sleep 2005, 28, 479–496. [Google Scholar]
- Fraiwan, L. Automated sleep stage identification system based on time-frequency analysis of a single EEG channel and random forest classifier. Comput. Methods Programs Biomed. 2012, 108, 10–19. [Google Scholar]
- Kemp, B.; Janssen, A.; Roessen, M. A digital telemetry system for ambulatory sleep recording. Sleep-Wake Research in The Netherlands. 1993, 4, pp. 129–132. Available online: http://physionet.mit.edu/pn4/sleep-edfx/Papers/1993-Kemp—telemetry.pdf accessed on 10 December 2014.
- Dijk, D.J. Effects of seganserin, a 5-HT2 antagonist, and temazepam on human sleep stages and EEG power spectra. Eur. J. Pharmacol. 1989, 171, 207–218. [Google Scholar]
- Rodriguez-Sotelo, J.; Osorio-Forero, A.; Jimenez-Rodriguez, A.; Restrepo, F. A new tool for assisted sleep staging and transitory sleep patterns analysis in EEG signals. Proceedings of the IX Congreso Nacional X Seminario Internacional de NEUROCIENCIAS. COLNE., 15–17 May 2014; pp. 163–164.
- Zhang, Z.; Chen, Z.; Zhou, Y.; Du, S.; Zhang, Y.; Mei, T.; Tian, X. Construction of rules for seizure prediction based on approximate entropy. Clin. Neurophysiol. 2014, 125, 1959–1966. [Google Scholar]
- Khan, J.; Venkatraghavan, L.; Mariappan, R. Entropy as an indicator of cerebral perfusion in patients with increased intracranial pressure. J. Anaesthesiol. Clin. Pharmacol. 2014, 30, 409–411. [Google Scholar]


| Stage | J-means
| NN
| ||
|---|---|---|---|---|
| Recall | Precision | Recall | Precision | |
| N1 | 0.15 (0.28) | 0.14 (0.26) | 0.35 (0.23) | 0.42 (0.24) |
| N2 | 0.91 (0.07) | 0.84 (0.07) | 0.84 (0.09) | 0.89 (0.10) |
| N3 | 0.59 (0.43) | 0.39 (0.29) | 0.43 (0.22) | 0.46 (0.24) |
| REM | 0.38 (0.44) | 0.34 (0.40) | 0.75 (0.26) | 0.52 (0.31) |
| W | 0.84 (0.16) | 0.87 (0.10) | 0.93 (0.08) | 0.73 (0.18) |
| Feature | Accuracy | Kappa | Time |
|---|---|---|---|
| FD | 0.78 (0.06) | 0.61 (0.13) | 0.62 (0.04) |
| DFA | 0.75 (0.06) | 0.56 (0.14) | 0.62 (0.05) |
| H | 0.65 (0.09) | 0.37 (0.12) | 0.81 (0.10) |
| ApEn | 0.74 (0.05) | 0.54 (0.12) | 0.56 (0.02) |
| SampEn | 0.73 (0.06) | 0.51 (0.16) | 0.63 (0.04) |
| MSE | 0.69 (0.06) | 0.42 (0.13) | 0.88 (0.08) |
| Absolute Power | 0.74 (0.06) | 0.53 (0.11) | 1.00 (0.29) |
| Asymmetry | 0.70 (0.07) | 0.46 (0.08) | 0.63 (0.03) |
| Central Power | 0.70 (0.07) | 0.47 (0.11) | 0.69 (0.04) |
| Coherence | 0.70 (0.07) | 0.46 (0.12) | 0.69 (0.04) |
| Phase Coherence | 0.67 (0.08) | 0.38 (0.12) | 0.75 (0.04) |
| Power Ratios | 0.80 (0.05) | 0.67 (0.08) | 0.75 (0.05) |
| Relative Power | 0.77 (0.06) | 0.61 (0.11) | 0.69 (0.03) |
| Prediction outcome | ||||||
|---|---|---|---|---|---|---|
| W | N1 | N2 | N3 | REM | ||
| Actual value | W | 3333 | 2046 | 1074 | 21 | 329 |
| N1 | 177 | 1082 | 624 | 39 | 882 | |
| N2 | 884 | 915 | 8155 | 1198 | 6647 | |
| N3 | 42 | 69 | 1539 | 4255 | 400 | |
| REM | 484 | 1017 | 1738 | 25 | 3851 | |
© 2014 by the authors; licensee MDPI, Basel, Switzerland This article is an open access article distributed under the terms and conditions of the Creative Commons Attribution license (http://creativecommons.org/licenses/by/4.0/).
Share and Cite
Rodríguez-Sotelo, J.L.; Osorio-Forero, A.; Jiménez-Rodríguez, A.; Cuesta-Frau, D.; Cirugeda-Roldán, E.; Peluffo, D. Automatic Sleep Stages Classification Using EEG Entropy Features and Unsupervised Pattern Analysis Techniques. Entropy 2014, 16, 6573-6589. https://doi.org/10.3390/e16126573
Rodríguez-Sotelo JL, Osorio-Forero A, Jiménez-Rodríguez A, Cuesta-Frau D, Cirugeda-Roldán E, Peluffo D. Automatic Sleep Stages Classification Using EEG Entropy Features and Unsupervised Pattern Analysis Techniques. Entropy. 2014; 16(12):6573-6589. https://doi.org/10.3390/e16126573
Chicago/Turabian StyleRodríguez-Sotelo, Jose Luis, Alejandro Osorio-Forero, Alejandro Jiménez-Rodríguez, David Cuesta-Frau, Eva Cirugeda-Roldán, and Diego Peluffo. 2014. "Automatic Sleep Stages Classification Using EEG Entropy Features and Unsupervised Pattern Analysis Techniques" Entropy 16, no. 12: 6573-6589. https://doi.org/10.3390/e16126573