Describing the Structural Diversity within an RNA’s Ensemble

Abstract
: RNA is usually classified as either structured or unstructured; however, neither category is adequate in describing the diversity of secondary structures expected in biological systems We describe this diversity within the ensemble of structures by using two different metrics: the average Shannon entropy and the ensemble defect. The average Shannon entropy is a measure of the structural diversity calculated from the base pair probability matrix. The ensemble defect, a tool in identifying optimal sequences for a given structure, is a measure of the average number of structural differences between a target structure and all the structures that make up the ensemble, scaled to the length of the sequence. In this paper, we show examples and discuss various uses of these metrics in both structured and unstructured RNA. By exploring how these two metrics describe RNA as an ensemble of different structures, as would be found in biological systems, it will push the field beyond the standard “structured” and “unstructured” categorization.1. Introduction
Ribonucleic acid (RNA) is a ubiquitous molecule with the propensity to fold into complex secondary structures [1,2]. The number of possible secondary structures for a given RNA sequence of length L has been calculated to increase as 1.8L [3]. This means that only 314 nucleotides are required for an RNA to have more possible configures than the estimated number of observable atoms in the universe (N = 80/log10(1.8) ≈ 314) [3,4]. For the small subunit of the Escherichia coli ribosome, with 1,542 nucleotides, the number of possible structures is an absurdly large number (1.81,542 = 4.3 × 10393) [3,5]. This plethora of possible structures means that even the most probable structure is highly unlikely with a probability on the order of 10−22 [6]. These calculations suggest that RNAs populate an ensemble of structures at any given point in time. Recent evidence has suggested that the alternative structures that make up these ensembles may provide some evolutionary advantage to the cell or organism [4,7]. One such advantaged is the ability to control and change the function of a ribozyme based upon cellular conditions [8–10], a mechanism very similar to how riboswitches regulate gene expression based upon the presence or absence of a small metabolite [11–14]. RNAs, such as the ribosome and self-splicing introns, which are believed to be under significant evolutionary pressure to adopt a single functional conformation [15–17], are generally labeled as “structured”.
As a counter point to these structured RNAs, there are unstructured RNAs that are not believed to have evolved to take on a specific structure [18,19]. The typical example of these unstructured RNAs include long non-coding RNAs and messenger RNAs (mRNA). Surprisingly, genome-wide association studies have revealed links between single point mutations and disease phenotypes, even in untranslated and other non-coding regions of RNA [20–23]. These disease associated mutations have been shown to disrupt the structure and shift the ensemble of structures of the mRNA [24,25]. Further investigation revealed that this same idea could explain why two point mutations are in high linkage disequilibrium; the first mutation disrupts the ensemble of structures, while the second restores it [26]. These mutations, both disrupting and restoring, were commonly found outside of protein binding regions, suggesting a structural, rather than sequence, component [26].
With the evidence that “unstructured” RNA has structure and “structured” RNA populates many different structures, it is clear that the simplistic labels of structured and unstructured for RNA are insufficient. To address this issue, we propose the use of a continuous scale using both the average Shannon entropy and the ensemble defect. Both of these metrics have been used to describe the uncertainty in structural predictions and structural stability. Here, we use these metrics as a way to describe the diversity of the different structures that populate the ensemble. This analysis includes calculating the average Shannon entropy and ensemble defect for all of the sequences for the small subunits of the ribosome and all the identified mRNAs in the human genome. Additionally, we compare these metrics to the correlation coefficient used by Halvorsen et. al. [24] and describe the use of structural profiles. These structural profiles combined with the average Shannon entropy and ensemble defectmay provide a more accurate way to think about RNA and the effect of mutations on the ensemble of structures.
2. Methods
2.1. Measuring the Structural Diversity
A majority of methods for RNA secondary structure prediction focus on identifying the “correct” structure. In the absence of many homologous sequences, this structure is calculated using the minimization of thermodynamic parameters by dynamic programming [27,28]. These predictions take advantage of the measured properties of RNA base stacking, RNA bending and nucleotide pairing [29–32]. These thermodynamic methods for prediction have been continuously refined to the point where structures can be informed by chemical mapping experiments [12,33–36]. Many of the current programs even have the ability to return the partition function and perform suboptimal sampling for a given RNA sequence [37–41]. Recent work has pushed beyond simple energy calculations to include entropic modifications to the folding algorithms [42]. A complete discussion of the procedure of how these programs work is beyond the scope of this paper, but can be found elsewhere [30,43,44]. For completeness, we will briefly describe the aspects of RNA structural prediction that are related to the average Shannon entropy, ensemble defect and correlation coefficient.
The partition function, Z, is defined in the standard way as:
where ΔGn is the free energy of the n–th structure, R is the universal gas constant and T is the temperature, and the sum is over all possible structures. The probability of any two nucleotides (i and j) being paired is then described by the base pair probability matrix, P;
The matrix, Sij, describes the base pairing between any two nucleotides, where Sij = 1 when the i–th and j–th nucleotides are paired and zero otherwise. An equivalent method, used in the RNA structure software package [29,30,45], is to describe the structure as the vector, s, defined by:
A corresponding transformation of the base pair probability matrix, P, is used to calculate the probability that base i is paired. This is done by summing over all values of j for column i from one to L, the length of the sequence. This is written with the sum from one to L, notated by j = 1 : L:
The correlation coefficient, defined by Halvorsen et. al., is defined as the Pearson correlation coefficient between the pairing probability of the wild type sequence, pWT, and a mutant sequence, pmut.
Huynen et al. were the first to propose the use of the Shannon entropy as a description of the uncertainty in a predicted structure [46]. A few years later, Schultes et al. proposed a slightly different measure to accomplish the same task [47]. Currently, the RNA literature defines the Shannon entropy for an RNA sequence of length L as:
where P is the base pair probability matrix. However, Equation (5) is not a true Shannon entropy, because the base pair probability matrix does not sum to unity. Huynen et al. originally defined Equation (5) with the notation that the base pair probability matrix was modified with Pi,j=i as the probability that base i did not pair with any other base [46]. To avoid confusion with the current literature [28,48–50], we will use Equation (5) with the unmodified base pair probability matrix, but refer to it as the average Shannon entropy.
The ensemble defect, E(S0), was originally designed to describe the distance of the average structure of an ensemble away from a target structure, S0 [51,52]. This target structure, S0, may be any structure the RNA sequence can fold into, including, but not limited to, predicted structures from standard dynamic programing [28,38,40,41], structures predicted using more sophisticated methods [42] or identified crystal structures. The ensemble defect was originally used to measure the success of designing a sequence that would take on a desired structure [51–53]. The design of an RNA sequence may need to be informed by more then just thermodynamic properties, such as constraints in the speed of the folding, self-assembly or, even, frustrated folding kinetics [52]. Since it is believed that the evolution of RNA structures must filter through similar constraints to arrive at functional and useful RNA structures [54], it is useful to borrow the ensemble defect from the field of sequence design as a metric describing the diversity of structures. The ensemble defect is calculated by appending an extra column describing the i–th base being unpaired to both the structure matrix and the base pair probability matrix. The resulting rectangular matrices for the modified structure matrix, S, and base pair probability matrix P are written as
 and ℘, respectively.
This results in the ensemble defect being defined as [51,52]:
Equation (6) can be rewritten to not require the extended base pair probability matrix and extended structure matrix as:
Both Equation (6) and Equation (7) can be thought of as summing up the nucleotide similarity between the target structure and the base pair probability. This results in the ensemble defect having a simple interpretation: a value of 0.25 means that a structure sampled from the ensemble will, on average, have 25% of the nucleotides paired differently than the target structure. This would correspond to 25 nucleotides for a sequence of 100 nucleotides or 125 nucleotides for a sequence of 500 nucleotides. This calculation has previously been used to generate a credibility limit measuring the accuracy of a secondary structure prediction [55]. This interpretation assumes that there is a single correct solution instead of a collection of structures that are commonly found in biological systems.
Despite the existence of an exact calculation (Equation (6) and Equation (7)), in some circumstances, it may prove advantageous to be able to calculate the ensemble defect over a subset of sampled structures, thereby avoiding the base pair probability matrix. The easiest way to write this modification is to take advantage of the vector, s, that describes a given structure, resulting in:
where sn is the n–th structure of the ensemble of N structures and δ is the Kronecker delta function. This ensemble could be a subset, identified by clustering or other methods, from a larger sampled ensemble or all structures within a given energy range. A range of suboptimal sampling has been calculated for five different RNA sequences with an energy range of up to 2 kcal/mol from the minimum free energy structure and is shown in the supplement (Supplementary Figure S1). The use of Equation (8) allows for an estimate of how much variation there is among the structures by using the standard deviation associated with the summation. Equation (8) approaches the exact solution of Equation (6) when the ensemble is created using Boltzmann sampling and is sufficiently large (Supplementary Figure S2).
For these measurements of diversity to be useful, they must show a difference from such simple measurements as the percent of guanine and cytosine within a sequence. A previous study by Freyhult et al. showed that the percent of guanine and cytosine was correlated to the normalized free energy [48]. This same study showed very little correlation with the other metrics in the study including the averaged Shannon entropy. To confirm these results, we preform the same analysis to identify correlation between the percentage of guanine and cytosine with the averaged Shannon entropy and ensemble defect for the small subunit of the ribosome from Bacteria and the 3′ and 5′ untranslated regions of the human mRNA. The results show very little correlation with the maximum being 0.17 between the 3′ untranslated regions and the averaged Shannon entropy. The results for the 3′ and 5′ untranslated regions are shown in Supplementary Figure S3 while the results for the small subunit are not shown. These results rule out that the Shannon entropy and ensemble defect are just measuring the guanine and cytosine content of a sequence.
2.2. RNA Structural Diversity Profiles
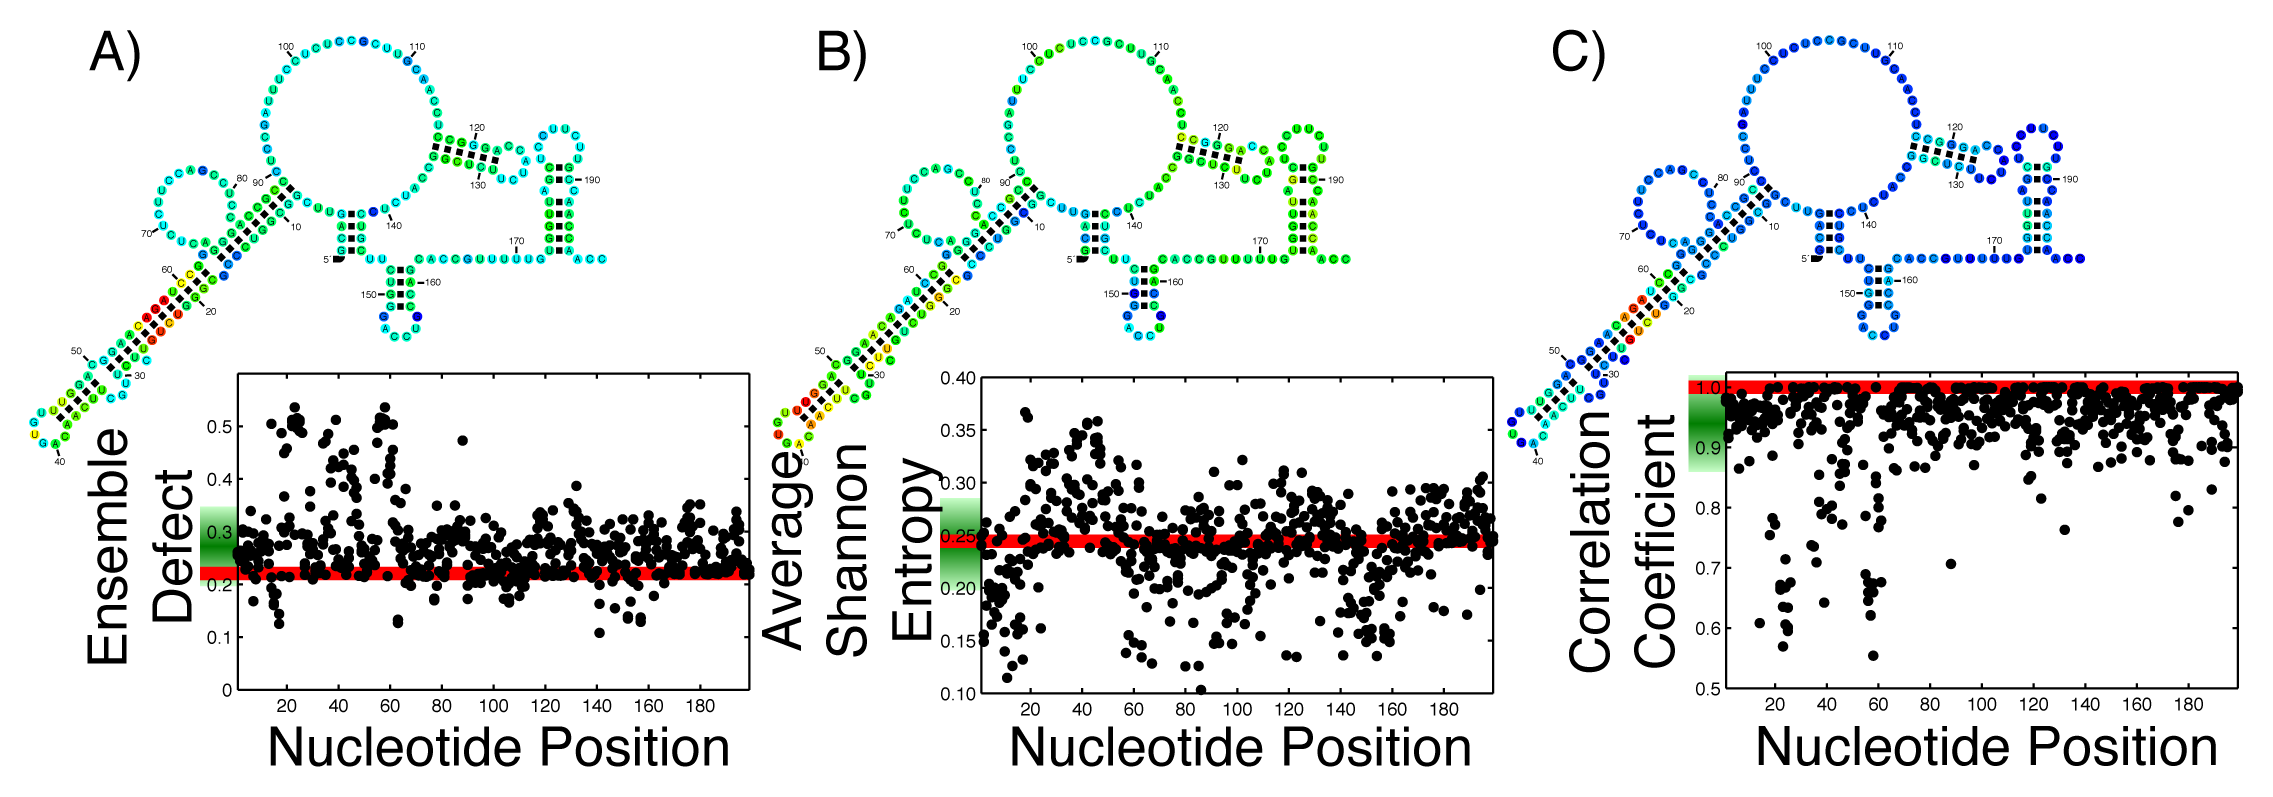
With the ever growing body of data from genome-wide association studies concerning point mutations, it is useful to observe how possible point mutations will affect the ensemble of structures. For an RNA that is generally considered structured, this disruption is easy to imagine; the RNA can no longer take on the proper structure. For an unstructured RNA, the interpretation is more difficult. By thinking of RNA, either structured or unstructured, as populating an ensemble of different structures, these mutations must disrupt the ensemble by changing the diversity of structures. The effect of all single possible nucleotide changes can be calculated and observed in a single graph. Since each mutation happens at a specific nucleotide, that nucleotide can be used as a coordinate, with a second coordinate being the calculated value of the average Shannon entropy, or ensemble defect or correlation coefficient. By calculating this set of coordinates for every possible mutation, we can create a profile of what the mutations will do to the ensemble. Since each nucleotide has three possible mutations, each position along the x-axis has three individual data points. This has been done on the 199 nucleotide 5′ untranslated region of the ferritin light chain (FTL) gene using the ensemble defect (Figure 1A), average Shannon entropy (Figure 1B) and the correlation coefficient (Figure 1C). (The Ferritin light chain is abbreviated as FTL because the more natural abbreviation - FLC - had already been given to the flowering locus C gene.)
To aid in the interpretation of these profiles, Figure 1 includes the minimum free energy structure of the 5′ untranslated region of the FTL gene with each nucleotide colored according to the mean value of all the mutations at that nucleotide.
2.3. RNA Sequences and Secondary Structures
The sequences for the mRNA, including both the 3′ and 5′ untranslated regions, were extracted from the University of California Santa Cruz genome build hg18 [56]. These sequences included the 5′ untranslated regions of the Ferritin Light Chain (FTL) gene, the 5′ untranslated regions of retinoblastoma (RB1) gene, and the 5′ untranslated region of the serpin peptidase inhibitor (SERPINA1) and were selected for additional investigation, due to their disease associated mutants described in Halvorsen et al [24] and their identification as “unstructured.” The sequences for the small subunit of the ribosome and the phenylalanine tRNA were from the Comparative RNA website [57]. The example small subunit sequences for E. coli (accession number J01695), S. solfataricus (accession number X03225) and H. sapiens (accession number K03432) are from the same source. The sequence for the Group II intron is from the RNA Families Database (reference number RF02001) [58,59]. The sequence for the P4P6 stem of Tetrahymena thermophila was from the RNA Mapping Database [60–62]. The accepted secondary structures used in this study were obtained from the Comparative RNA website [57]. The secondary structures in Figure 1 were drawn and colored using the secondary structure drawing program R2R [63]. All secondary structures were calculated using the Vienna group’s folding software version 2.0.7, specifically RNAfold and RNAsubopt, using the standard settings [40,41].
3. Results and Discussion
3.1. Structural Diversity of Unstructured RNAs
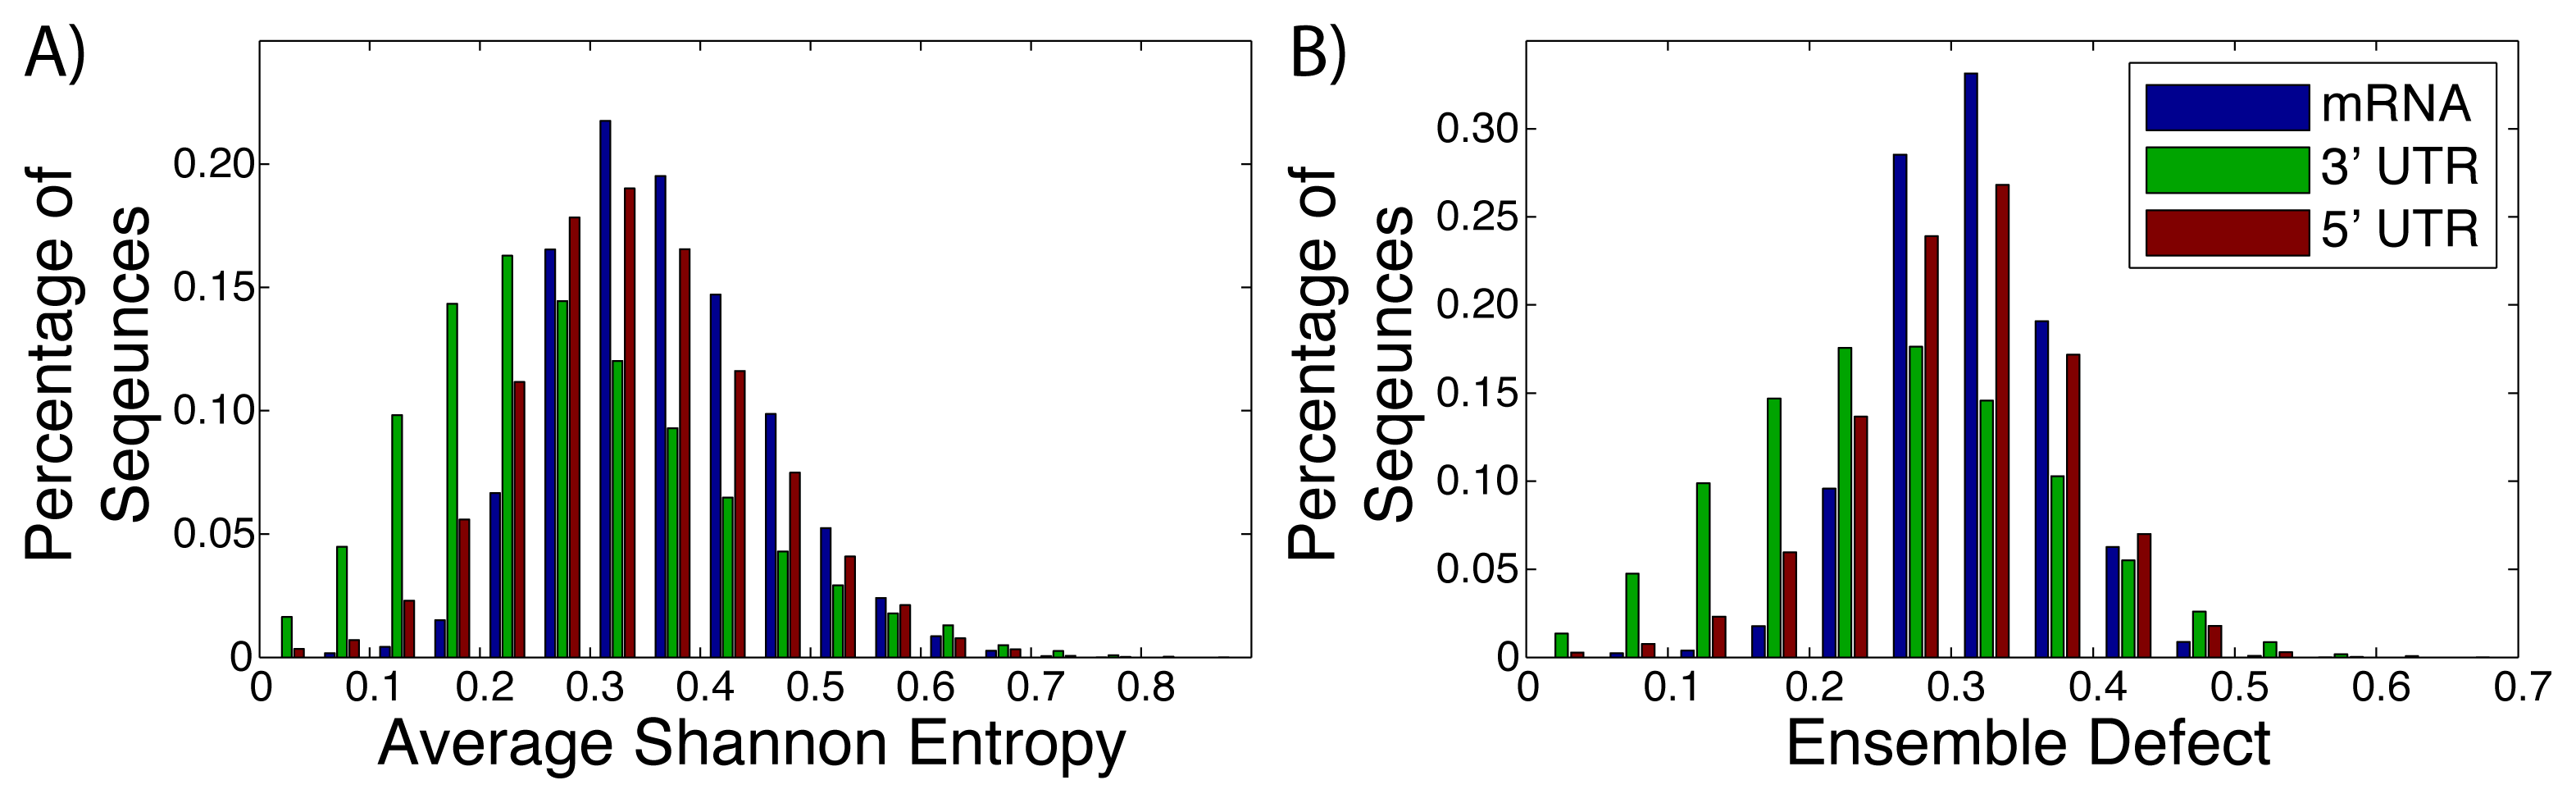
Messenger RNA (mRNA), including the untranslated and translated regions, are generally labeled as unstructured, due to a lack of a well-defined structure [2,24,64,65]. Instead of a well-defined structure, these RNA sequences populate an ensemble of different structures [26,66,67]. The diversity of the different structures within these ensembles have not been studied thoroughly, with most studies of mRNA focusing on the minimum free energy structure [68–70]. We have taken advantage of the University of California, Santa Cruz genome (build hg18) [56] to extract the sequences of known mRNAs after they have been spliced. The average Shannon entropy and ensemble defect for the full mRNA sequence (N = 30, 638), the 3′ untranslated regions (N = 27, 241) and the 5′ untranslated regions (N = 26, 679) were calculated (Figure 2). The ensemble defect for every sequences is calculated using the minimum free energy structure as computed by the Vienna software [40,41], due to the general availability and simplicity of use for large amounts of data. The full mRNA had a range of values for both metrics with the range of values for the average Shannon entropy being 0.031 to 0.733, while the ensemble defect has a range of 0.028 to 0.574. It is interesting to note that the mean value for the 3′ untranslated regions for both the average Shannon entropy (0.255) and ensemble defect (0.233) are lower than the the 5′ untranslated region and full mRNA (0.313 and 0.277 and 0.341 and 0.289, respectively). This suggests that there is less structural diversity within the ensembles for the 3′ untranslated regions than the 5′ untranslated regions or the mRNA as a whole, which is expected from the studies of protein binding sites [71].
3.2. Structural Diversity of Structured RNAs
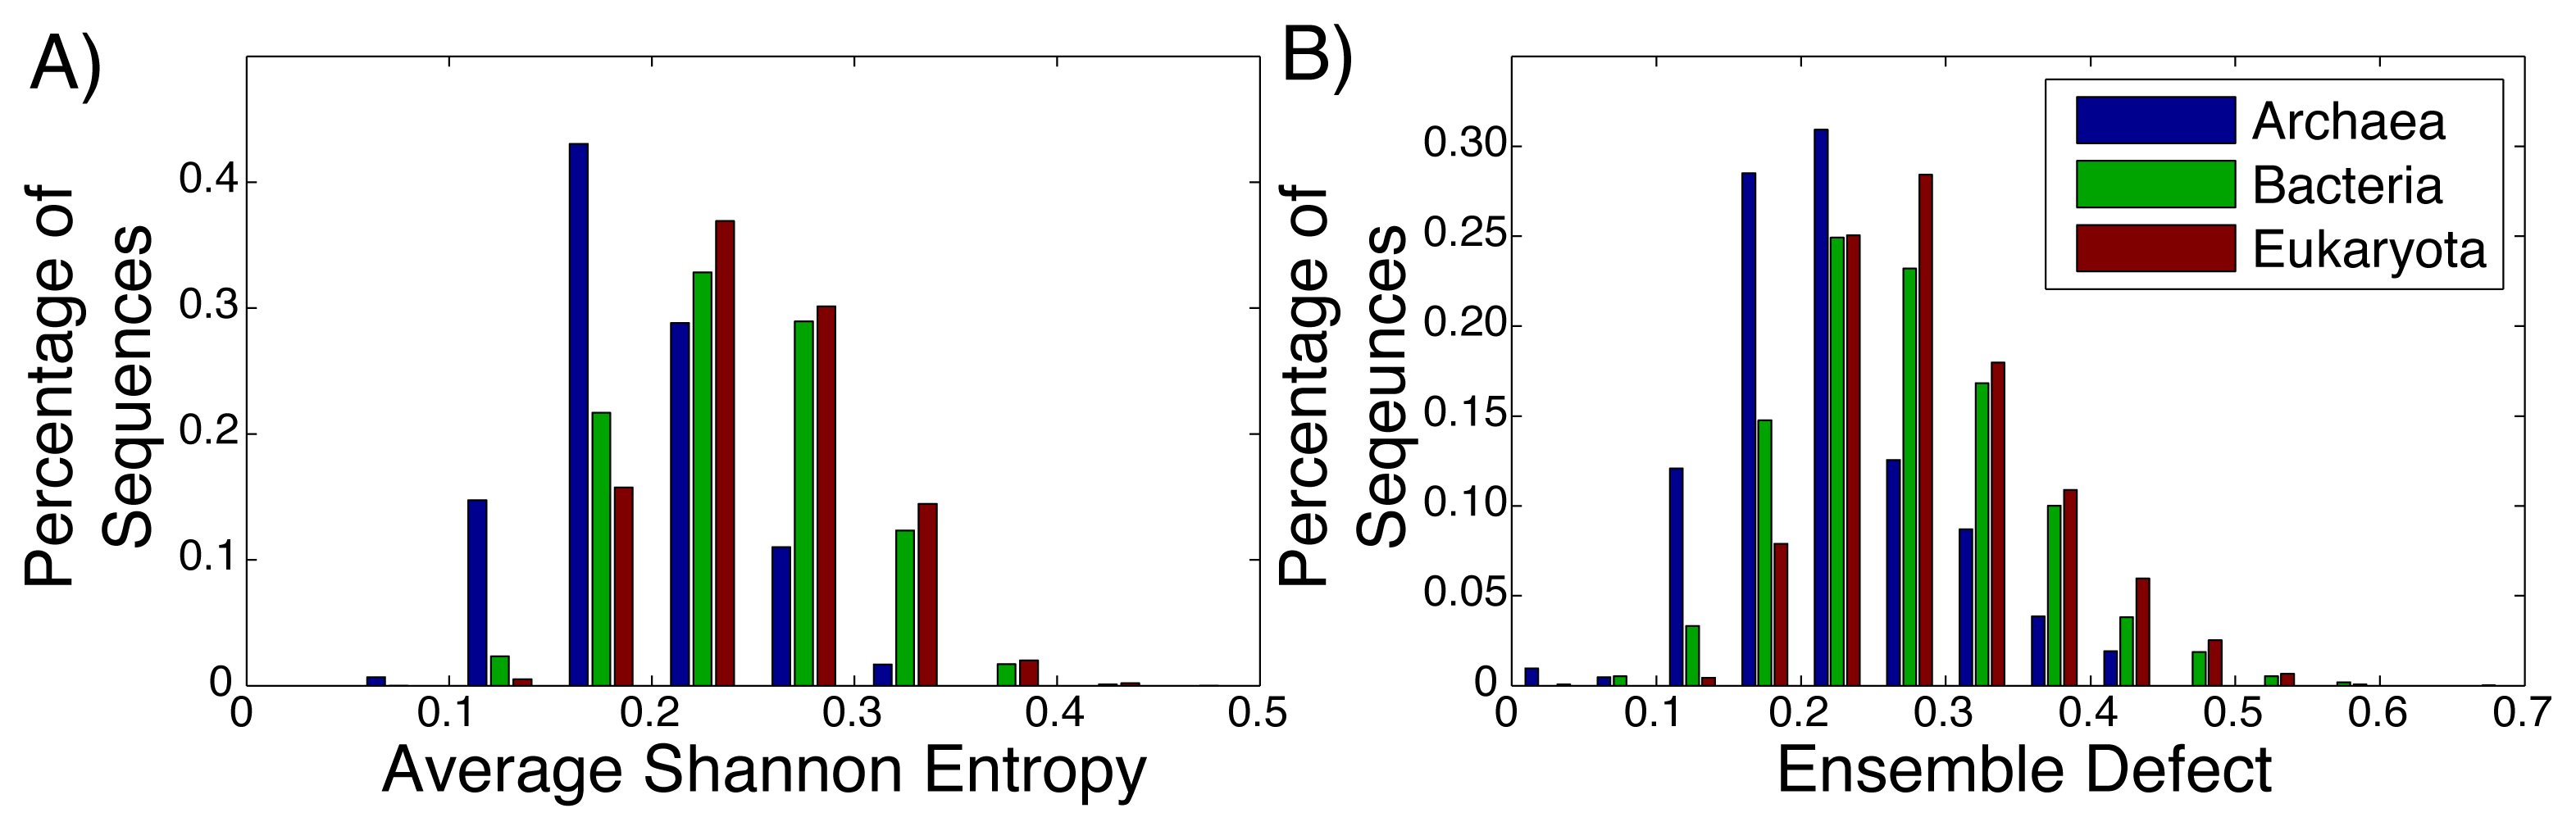
Even among ribozymes that perform the same function, there is variation among how structured an RNA sequence is. Take, for example, the ribosome: the huge RNA and protein molecular machine used to translate messenger RNA to protein and that is found in all three kingdoms of life. The ribosome consists of three RNA subunits and a variable number of proteins dependent on the organism [72,73]. Our focus will be on the small subunit, which is generally considered to be highly structured and has been repeatedly crystallized across the different kingdoms [74–76]. For both the average Shannon entropy (Figure 3A) and the ensemble defect (Figure 3B), we can see a large range of values for the small subunit, even within the different kingdoms. The mean average Shannon entropy values for the three kingdoms are: Archaea, 0.195; Bacteria, 0.241; and Eukaryota, 0.250. The mean ensemble defect values using the minimum free energy structure are 0.220, 0.272 and 0.290, respectively.
Considering how structured and unstructured RNA is treated in the literature, the distributions from the small subunit of the ribosome (Figure 3) and the mRNA (Figure 2) should be significantly different. A Kolmogorov–Smirnov test between all the ribosome distributions and the mRNA distributions do show that they are different distributions with p-values below the standard 0.05 significance level; however, this same test also shows that the distributions for the ribosomes are different among themselves. There is a large overlap of the ranges of the distributions of the ribosomes having a range of 0.00 to 0.65, while the range for the unstructured RNA has a similar range of 0.00 to 0.65 for the ensemble defect. The distributions for the ensemble defect overlap to different degrees, but all of them are over 50% and range up to 88%. The overlap of the average Shannon entropy distributions are lower, ranging from 29% to 60%. These results reinforce the idea that the classifications of “unstructured” and “structured” are misleading.
3.3. Mutations and Structural Diversity Profiles
With the increased interest in how single point mutations affect the diversity of structures an RNA can populate, it is useful to observe how every possible mutation will change the diversity. As a comparison to previous studies [24,26], the ensemble defect, average Shannon entropy and correlation coefficient of every possible nucleotide change for the 5′ untranslated regions (UTR) sequence for the human FTL gene was calculated and shown as a structural diversity profile (Figure 1). Every point represents a mutation at that nucleotide position, with the red line being the value for the wild type sequence. For the FTL sequence, the average Shannon entropy of the mutants varies above and below the wild type value (0.2444), with a mean of the single-nucleotide polymorphism (SNP) values of 0.2415. This is in contrast to the ensemble defect, where the mean of all the mutants is higher then the wild type value (0.2724 for the mean of the mutants versus 0.2209 for the wild type). The ensemble defect is able to pick out many of the same structural disrupting mutants (nucleotides 22–25 and 56–59) as other structural studies [24–26] and those found using the correlation coefficient (Figure 1C). As a visualization, the minimum free energy secondary structure is shown and colored according to the average value of the possible mutations at that nucleotide (Figure 1). This coloration of the minimum free energy structures of the wild type sequence suggests that several nucleotides in the 20–30 and 50–60 areas play an important role in the structure of the 5′ untranslated region of the FTL gene. These nucleotides have previously been shown to stabilize an identified iron response element, a known regulatory motif, located between nucleotides 30–50 [24–26,77].
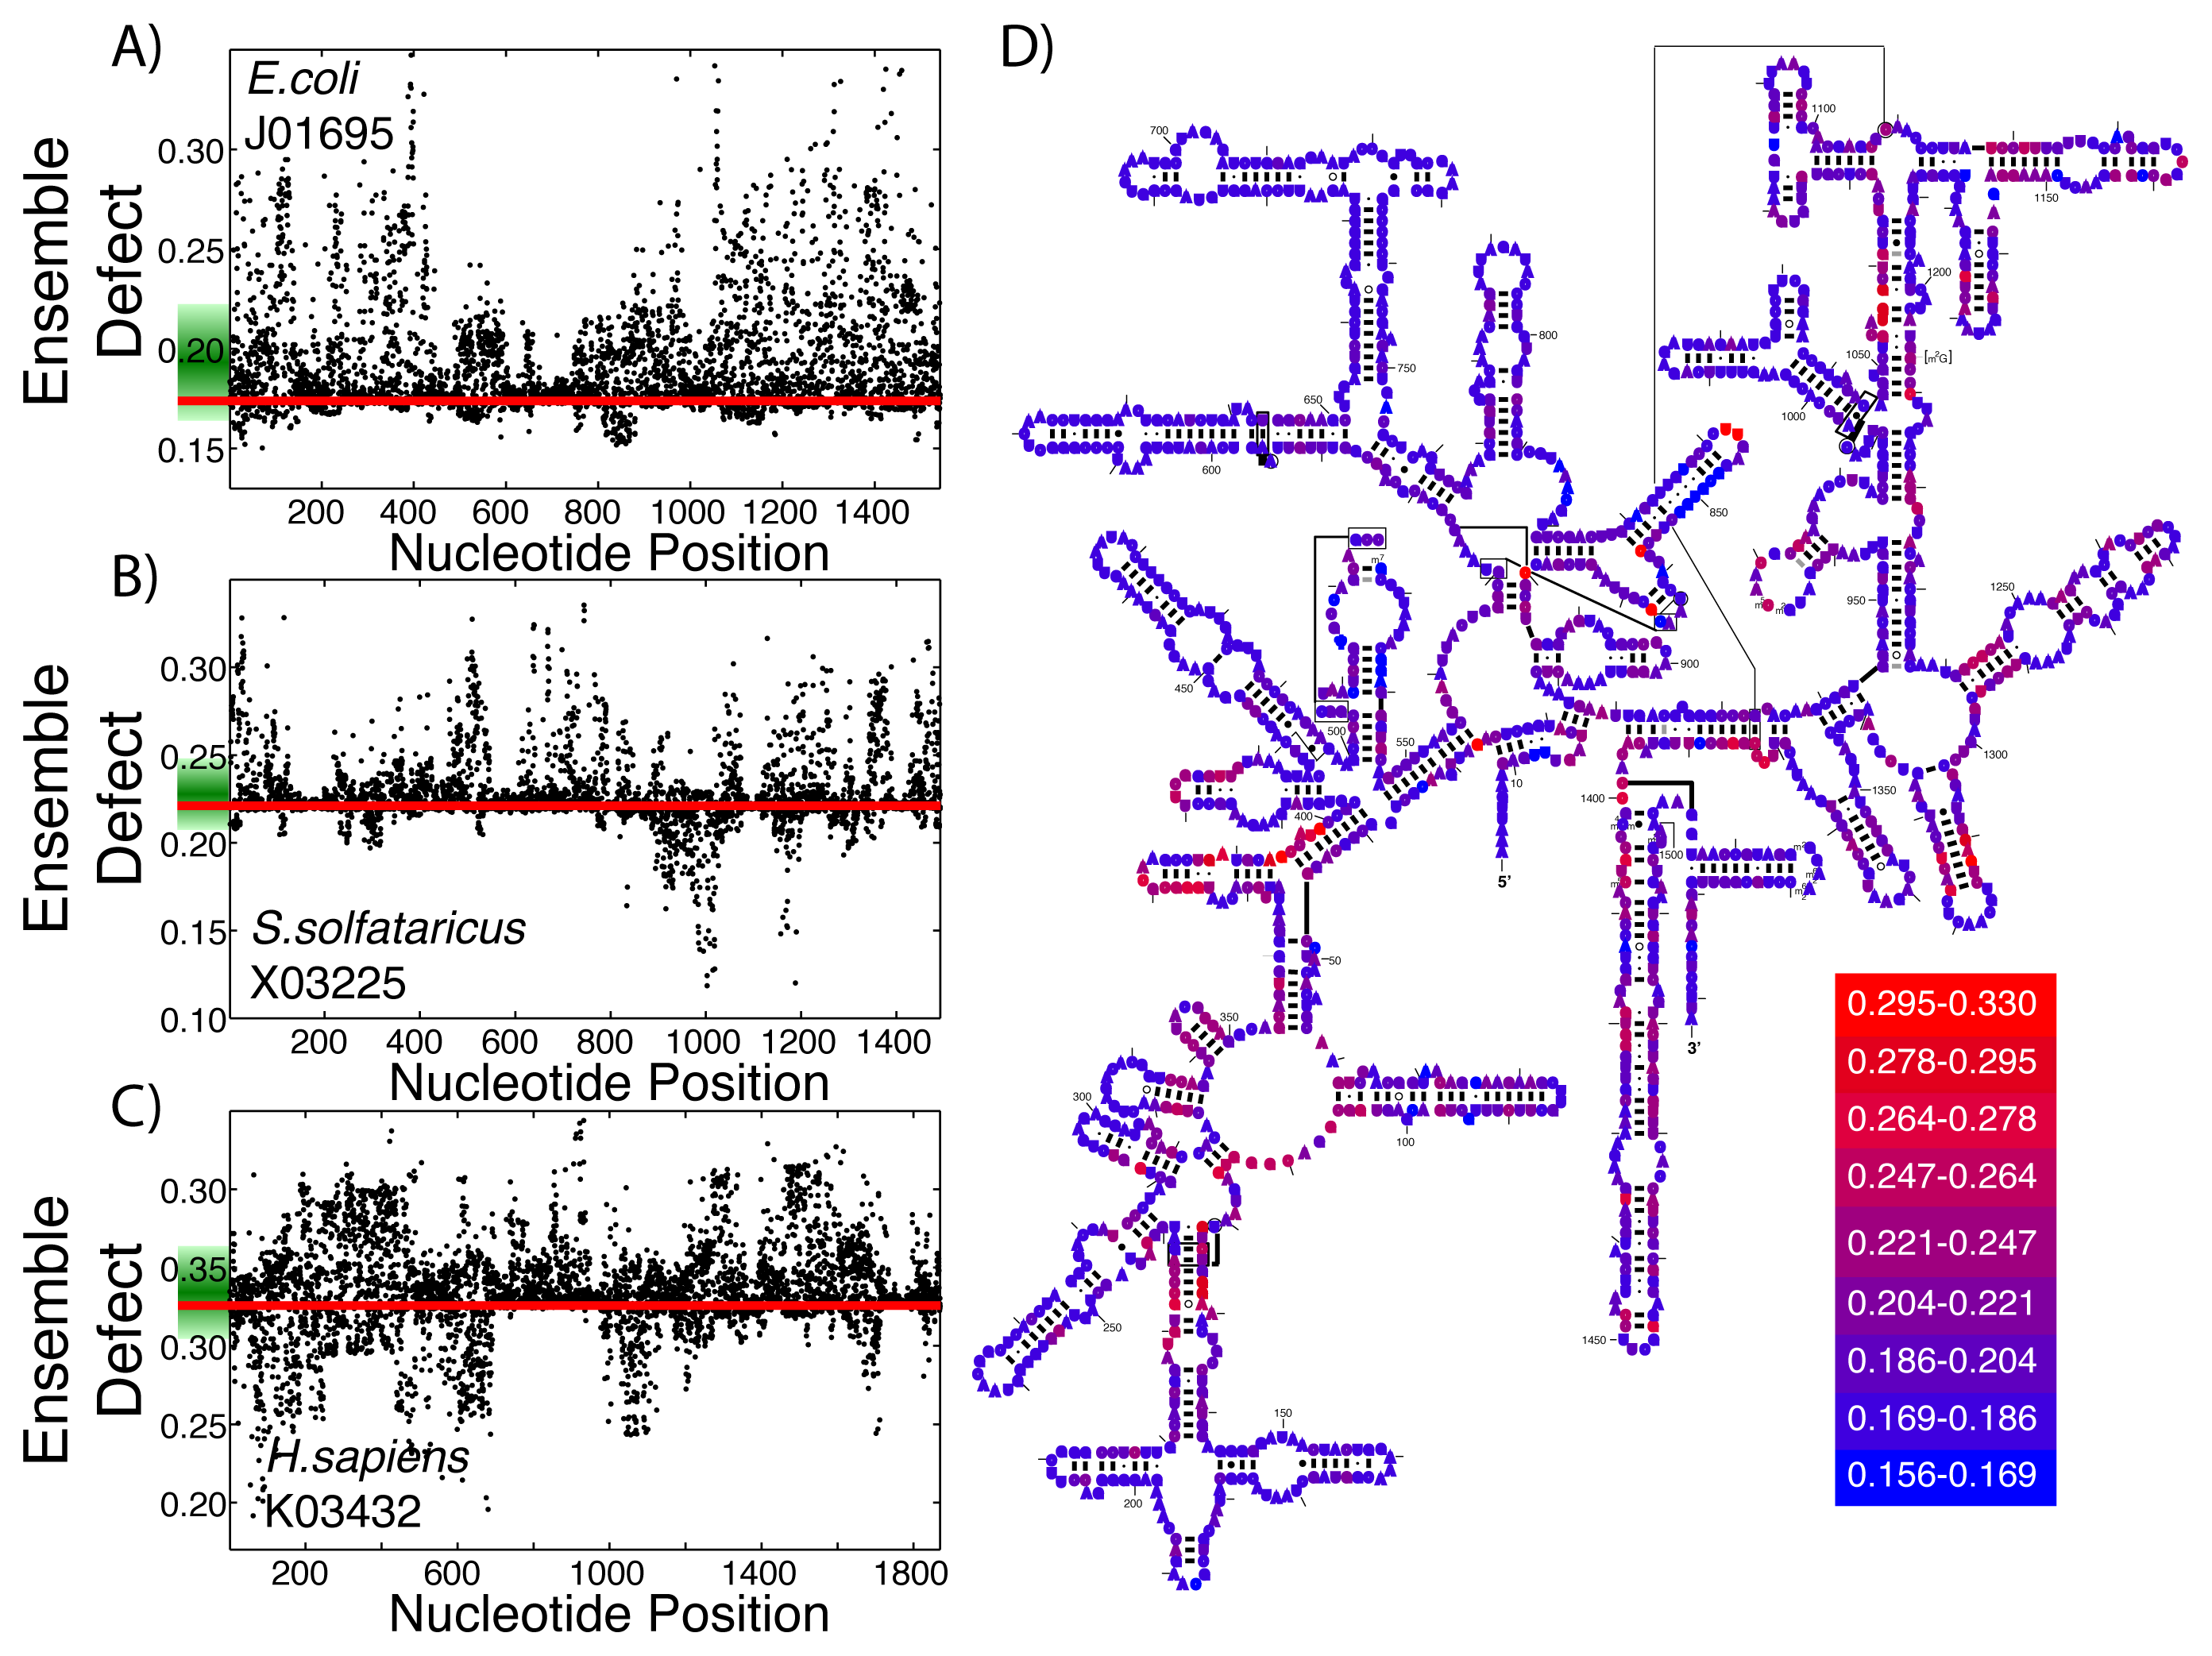
This same procedure to create structural diversity profiles can be used on even highly structured ribozymes that perform the same function. As examples, we selected a single sequence for the small subunit of the ribosome from each of the three kingdoms and generated structural diversity profiles for each sequence. We use E. coli as an example from Bacteria (Figure 4A), S. solfataricus from Archaea (Figure 4B) and H. sapiens for Eukarya (Figure 4C). The ensemble defect among the three small subunit sequences compared to their minimum free energy structure varies greatly: E. coli, 0.174; S. solfataricus, 0.221; and H. sapiens, 0.326. Since ribosomal structures have been under such intense scrutiny, each of these three sequences have an accepted structure that may be used as a target structure instead of the minimum free energy structure. The resulting ensemble defect values jump dramatically: E. coli, 0.511; S. solfataricus, 0.411; and H. sapiens, 0.660. This difference in using the minimum free energy and accepted structures can be attributed to the algorithms used in creating the base pair probability matrix and the minimum free energy. The mutational analysis shows unique patterns across the three subunit sequences (Figure 4A–C). The accepted small subunit structure for E. coli has been colored according to the average ensemble defect values (Figure 4D), showing which nucleotides are most susceptible to disrupting the ensemble of structures. The structural diversity profiles using the average Shannon entropy for these three sequences are shown in the supplementary materials (Supplementary Figure S4).
3.4. Optimization Towards a Structure
At the RNA structure level, evolution works through mutations, which on average should increase the structural diversity, and selection, which should reduce this diversity, ideally to optimize an RNA sequence to take on a single or very few structures. This process of mutation and selection is believed to be driving the optimization of the small subunit of the ribosome to only inhabit a very small number of its possible structures [49,69,73,78]. Additionally, Schultes et al. showed that natural sequences were generally evolved to have less structural diversity compared to randomly generated sequences [47]. Since both the ensemble defect and the average Shannon entropy are measures of structural diversity, they can be used as tools to describe how “optimized” the ensemble of structures is. Considering that the ensemble defect was originally developed to inform sequence design [52,53] and is a measurement away from a target structure, it is a better measure of how evolved a sequence is towards the target structure than the average Shannon entropy. These ideas suggest that the use of structural profiles would help inform our understanding of how optimized the small subunit of the ribosome is for the three sequences shown in Figure 4. The E. coli small subunit appears to be most optimized towards its minimum free energy structure (E(SMFE) = 0.174) with that of H. sapiens being the least optimized (E(SMFE) = 0.326), at least according to the ensemble defect values. Each of the sequences have a number of mutations that would optimize the sequences even further (E. coli, 20.3%; S. solfataricus, 38.4%; and H. sapiens, 32.3%). These profiles also provide information about the range of effects from a single point mutation, such as the fact that the mutation that would optimize E. coli the most (A71U) is only 13% lower (0.1508) than the wild type value, while the optimal mutation for E. sapiens optimizes the value to 0.1914 (a 41% decrease), still higher than the E. coli wild type value. This type of ensemble defect analysis provides a possible tool and methodology for simulating directed evolution experiments by subsequent generations of structural profiles and the selection of mutations.
3.5. Relation to the Correlation Coefficient
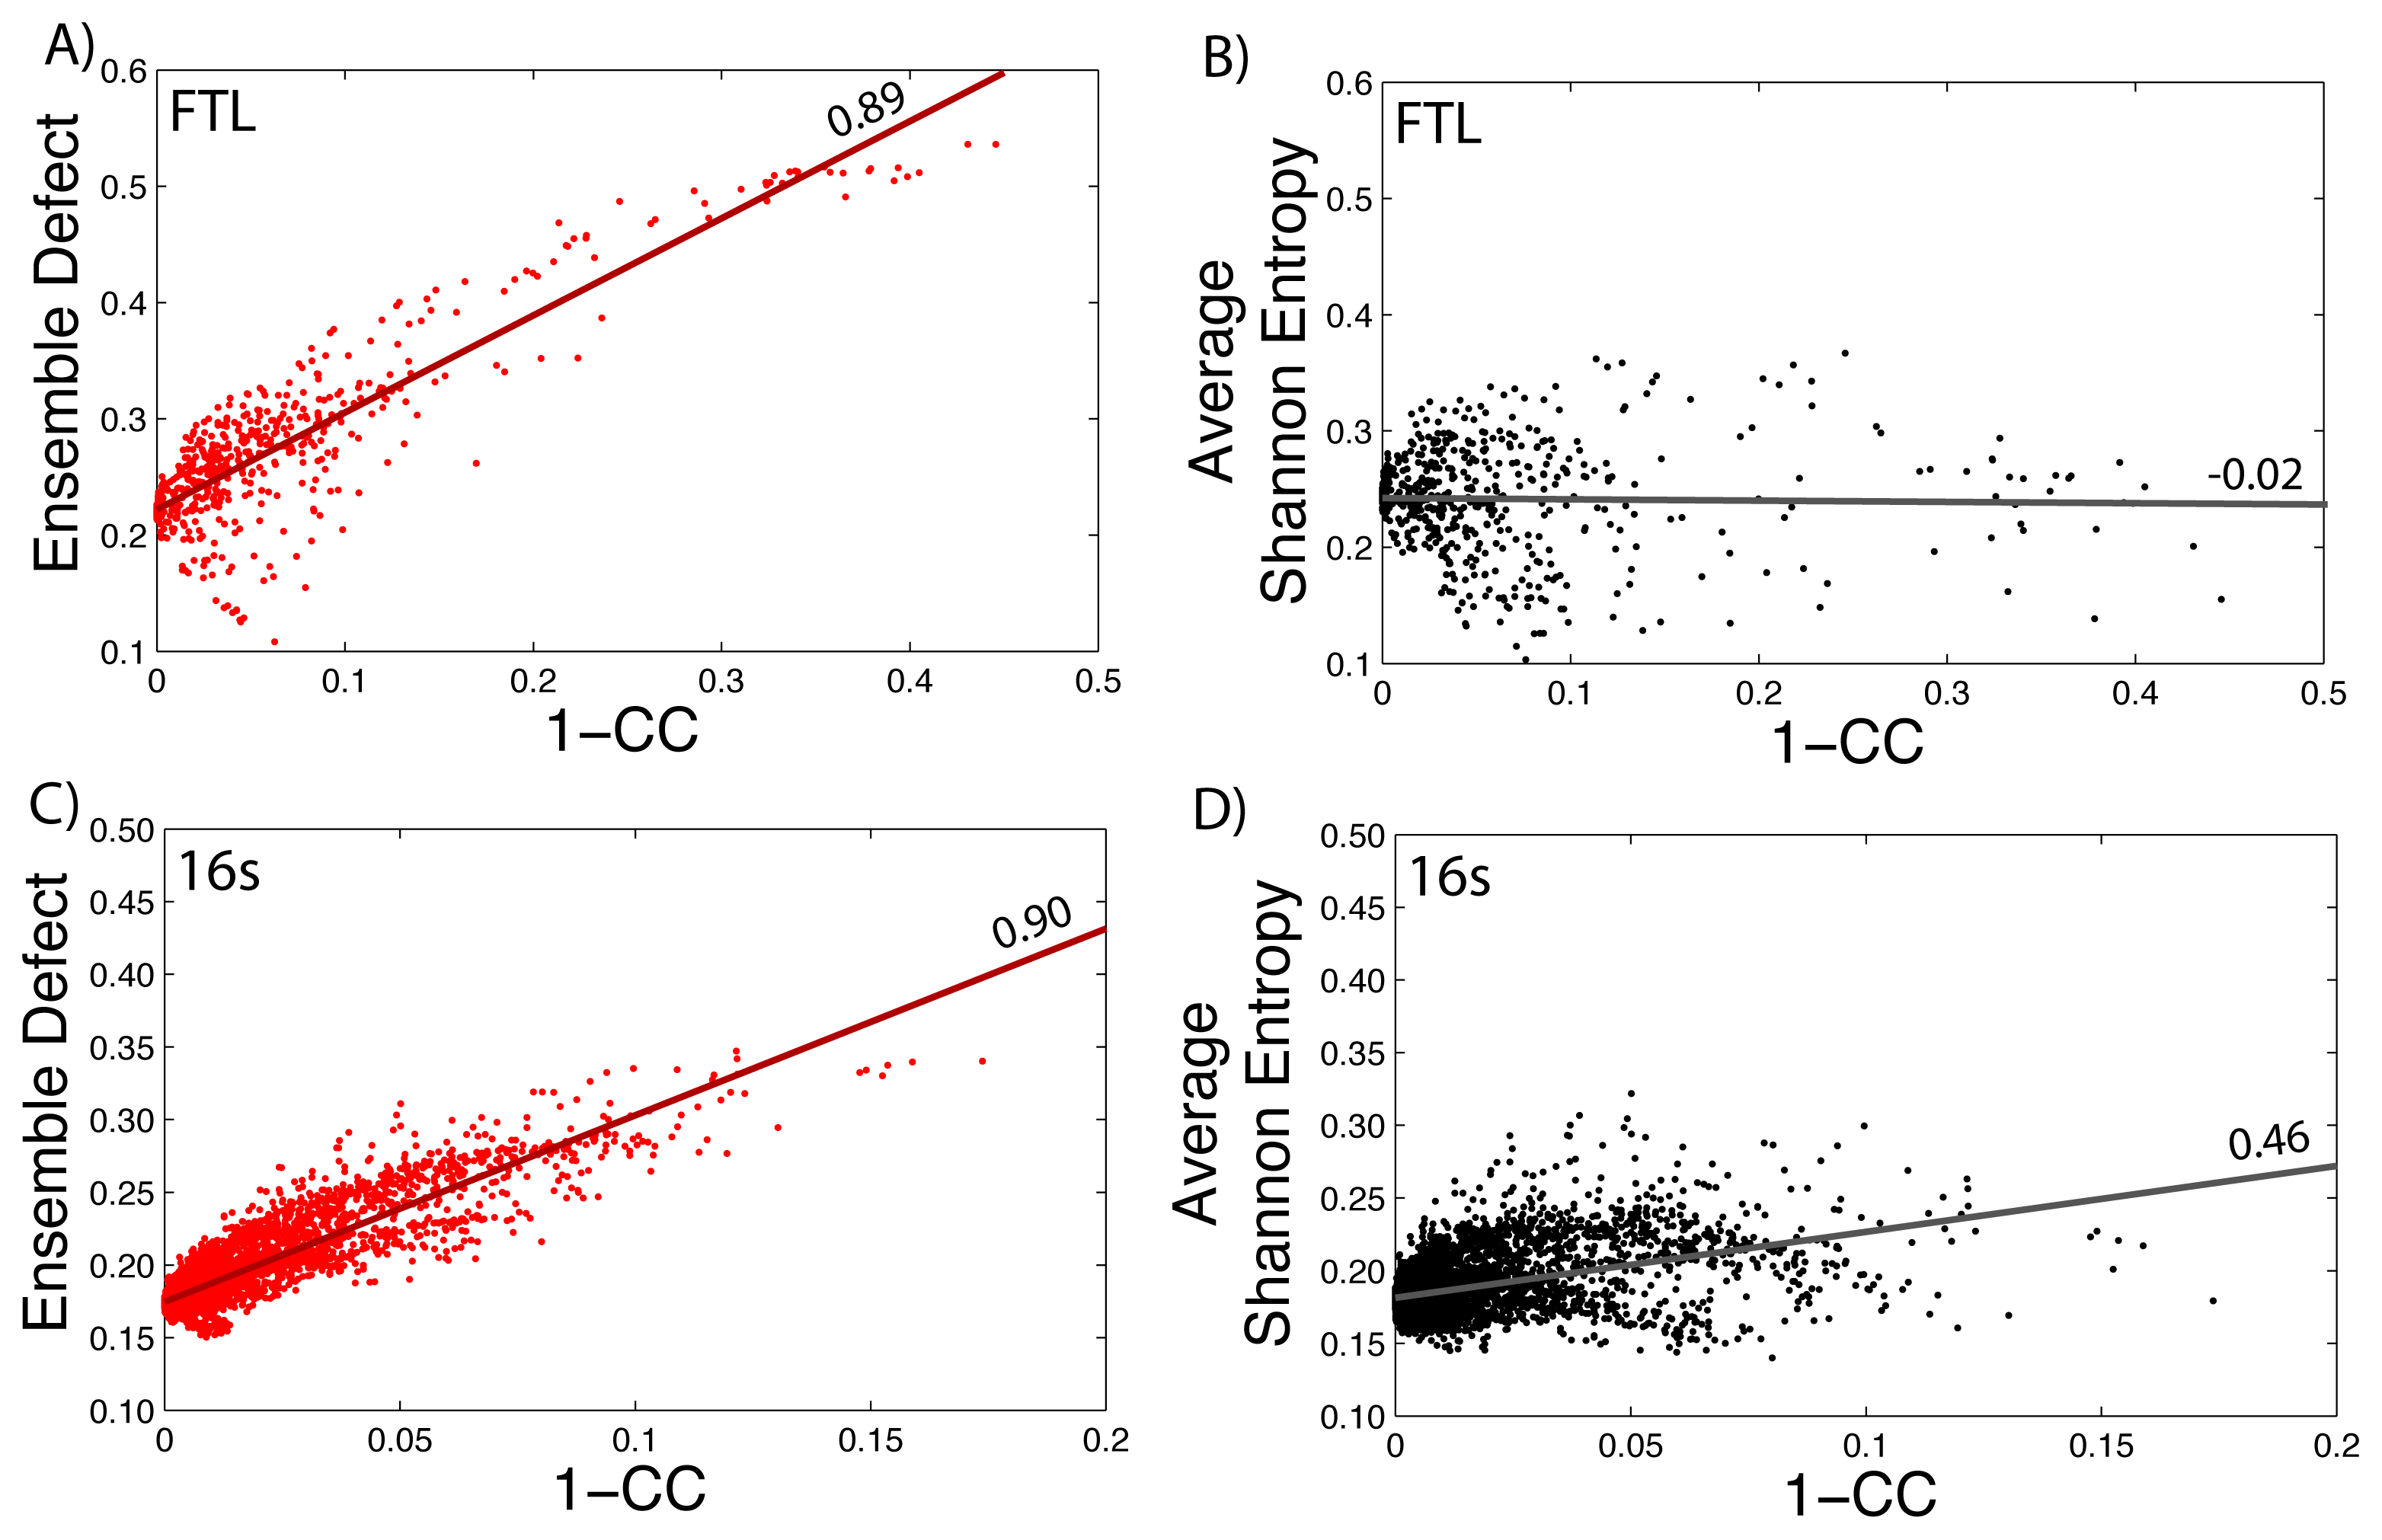
How well the ensemble defect and the average Shannon entropy can predict mutations that change the diversity of the structures in the ensemble is found by comparing them to the correlation coefficient values. We take the calculated values of the average Shannon entropy and the ensemble defect for the 5′ untranslated region of the FTL gene (shown in Figure 1) and compare the values to one minus the correlation coefficient values (1–CC) calculated using SNPfold [24]. We use 1–CC, because the correlation coefficient measures the differences between the wild type, unmutated pairing probability and the pairing probability resulting from the mutation. The results are shown in Figure 5, with the data for the ensemble defect shown in red (Figure 5A) and the average Shannon entropy shown in black (Figure 5B). Strait lines are drawn to help emphasize the correlation and lack of correlation between the calculations. The procedure is repeated for the small subunit of the E. coli ribosome (Figure 5C–D). The correlations between the ensemble defect and 1–CC for both the small subunit and the 5′ untranslated region of FTL are high at 0.90 and 0.89, respectively. This trend is not surprising, because both metrics are measuring away from the structural properties of the minimum free energy structure. However, when the accepted structure, instead of the minimum free energy structure, is used to calculate the ensemble defect for the small subunit, the correlation drops to 0.58. The trend of the ensemble defect having a better correlation then the average Shannon entropy appears to hold across several other examples, as shown in the supplementary materials (Supplementary Figures S5–S9). The correlation between 1–CC and the average Shannon entropy is lower for every investigated sequence, but surprisingly, there is a negative correlation for the phenylalanine tRNA (Supplementary Figure S9). This result suggests that tRNA, or at least the phenylalanine tRNA, has to maintain a specific structural diversity, which most mutations decrease (Supplementary Figure S9). The only other examined sequence with a negative correlation is the 5′ untranslated region of FTL (Figure 5B) with a value of −0.02, but this is more indicative of no correlation. If this lack of correlation was due to the 5′ untranslated region of FTL being unstructured, we would expect similar results for the 5′ untranslated regions of RB1 (Supplementary Figure S6) and SERPINA1 (Supplementary Figure S7); however, both these correlations are higher at 0.46 and 0.33, respectively. The lower correlation between 1–CC and the average Shannon entropy suggests that many point mutations do not change the amount of diversity within the ensemble of structures, but do change which structures are populated. The Pearson correlation between the ensemble defect and the averaged Shannon entropy is 0.29 for the 5′ UTR of the human FTL gene and 0.77 for the E. coli small subunit of the ribosome. Despite so few examples, making it impractical to draw firm conclusions, these results suggests a more detailed study of the relationship between 1–CC and the average Shannon entropy and the ensemble defect is warranted.
4. Conclusions
An RNA sequence is usually classified as either structured or unstructured. Structured RNAs are generally considered to have a specific structure, usually necessary to perform a specific function. Examples of structured RNAs include the ribosome, tRNAs and the self-splicing introns. Unstructured RNAs are not considered to have a specific structure or a structure that is not essential for its function, such as in messenger RNAs, small interfering RNAs or long noncoding RNAs. Yet, with the increased understanding that even highly “structured” RNA populates an ensemble of structures, this simplistic classification makes little sense. Figure 2 and Figure 3 even show an overlap of ranges for both the average Shannon entropy and ensemble defect that would be unexpected for groups generally thought of as structured and unstructured. This suggests that to understand RNA’s role beyond that of a simple coding transcript, it is necessary to move beyond the “structured” and ‘unstructured’ labeling.
In this paper, we have discussed the use of the ensemble defect and the average Shannon entropy as tools for describing the degree of structure of an RNA. These metrics provide a continuous range of values instead of the binary “structured”/“unstructured” labeling. The average Shannon entropy is a measure of the diversity of an RNA’s ensemble of structures based upon the probability of pairing between all nucleotides. The ensemble defect uses a different approach, measuring the average percent difference among the structures from a target structure; however, without a detailed inspection, it is hard to distinguish a few structures far away from a target structure from many structures centered on the target structure. We have shown how the continuous scale provided by the average Shannon entropy and the ensemble defect can be used to describe the diversity of structures within the ensemble of structures that an RNA will populate. Using a continuous scale may allow for the identification of mutations that disrupt or reinforce a given structure in much the same way as the correlation coefficient metric. Considering both the average Shannon entropy and the ensemble defect, this study suggests that these two simplistic categories are merely extremes on a continuous scale describing the diversity of structures that an RNA will populate in biological systems.
4.1. Future Plans
The idea that RNA populates an ensemble is not new nor novel, yet the idea of a single structure persists in the literature. The persistence of this paradigm is probably due to the classification of RNA into structured and unstructured categories and the lack of intuitive tools to visualize and describe these ensembles. The analysis presented here should alleviate both these concerns and has the possibility of being used in a variety of different applications and possibly answering several currently unanswered questions. Is evolution actively selecting for a single structure or multiple structures that have some role in the cell? It is known that riboswitches, pieces of RNA with known “on” and “off” states, are sensitive to metabolites and temperature [80] and have variable ratios across organisms [4]. How are alternative structures used to tune RNA expression, dynamics and interactions, in a similar way to riboswitches, to control and regulate cellular function, as suggested by both computational and experimental studies [7,81,82]? These alternative structures would certainly be an ideal method for regulating expression at scales where thermodynamic potentials play such a large role. These ensembles would also provide a pathway for a sequence to differentiate into different functional structures, while maintaining, at least partially, its original function [9]. Answering any of these questions is beyond the scope of this work; however, it is hoped that the tools and concepts presented here will help lay the foundation to answer these and other questions.
Acknowledgments
We would like to thank Shruti Saxena for her helpful comments and discussions about this manuscript. Additionally, we would like to thank the anonymous reviewers and the editor for their efforts and comments in improving this paper. This work was supported by the National Science Foundation through the National Evolutionary Synthesis Center (NESCent) under grant number #EF-0905606.
Conflicts of Interest
The authors declare no conflict of interest.
References
- Das, R.; Kwok, L.W.; Millett, I.S.; Bai, Y.; Mills, T.T.; Jacob, J.; Maskel, G.S.; Seifert, S.; Mochrie, S.G.; Thiyagarajan, P.; et al. The fastest global events in RNA folding: Electrostatic relaxation and tertiary collapse of the Tetrahymena ribozyme. J. Mol. Biol 2003, 332, 311–319. [Google Scholar]
- Chu, V.B.; Herschlag, D. Unwinding RNA’s secrets: Advances in the biology, physics, and modeling of complex RNAs. Curr. Opin. Struct. Biol 2008, 18, 305–314. [Google Scholar]
- Mathews, D.H.; Turner, D.H. Prediction of RNA secondary structure by free energy minimization. Curr. Opin. Struct. Biol 2006, 16, 270–278. [Google Scholar]
- Ritz, J.; Martin, J.S.; Laederach, A. Evolutionary Evidence for Alternative Structure in RNA Sequence co-variation. PLoS Comput. Biol 2013, 9, 1–11. [Google Scholar]
- Gutell, R.R.; Lee, J.C.; Cannone, J.J. The accuracy of ribosomal RNA comparative structure models. Curr. Opin. Struct. Biol 2002, 12, 301–310. [Google Scholar]
- Hamada, M. Fighting against uncertainty: An essential issue in bioinformatics. Brief. Bioinforma 2013. arXiv:1305.3655 [q-bio.QM]. [Google Scholar]
- Chen, C.; Mitra, S.; Jonikas, M.; Martin, J.; Brenowitz, M.; Laederach, A. Understanding the Role of Three-Dimensional Topology in Determining the Folding Intermediates of Group I Introns. Biophys. J 2013, 104, 1326–1337. [Google Scholar]
- Flamm, C.; Hofacker, I.L.; Maurer-stroh, S.; Stadler, P.F.; Zehl, M. Design of multistable RNA molecules. RNA 2001, 7, 254–265. [Google Scholar]
- Schultes, E.A.; Bartel, D.P. One sequence, two ribozymes: Implications for the emergence of new ribozyme folds. Science 2000, 289, 448–452. [Google Scholar]
- Al-Hashimi, H.M.; Walter, N.G. RNA dynamics: It is about time. Curr. Opin. Struct. Biol 2008, 18, 321–329. [Google Scholar]
- Tucker, B.J.; Breaker, R.R. Riboswitches as versatile gene control elements. Curr. Opin. Struct. Biol 2005, 15, 342–348. [Google Scholar]
- Wilkinson, K.A.; Merino, E.J.; Weeks, K.M. RNA SHAPE chemistry reveals nonhierarchical interactions dominate equilibrium structural transitions in tRNA(Asp) transcripts. J. Am. Chem. Soc 2005, 127, 4659–4667. [Google Scholar]
- Edwards, T.E.; Ferre-D’Amare, A.R. Crystal structures of the thi-box riboswitch bound to thiamine pyrophosphate analogs reveal adaptive RNA-small molecule recognition. Structure 2006, 14, 1459–1468. [Google Scholar]
- Stoddard, C.D.; Gilbert, S.D.; Batey, R.T. Ligand-dependent folding of the three-way junction in the purine riboswitch. RNA 2008, 14, 675–684. [Google Scholar]
- Doherty, E.A.; Doudna, J.A. Ribozyme structures and mechanisms. Annu. Rev. Biochem 2000, 69, 597–615. [Google Scholar]
- Kertesz, M.; Wan, Y.; Mazor, E.; Rinn, J.L.; Nutter, R.C.; Chang, H.Y.; Segal, E. Genome-wide measurement of RNA secondary structure in yeast. Nature 2010, 467, 103–107. [Google Scholar]
- Ellington, A.D.; Chen, X.; Robertson, M.; Syrett, A. Evolutionary origins and directed evolution of RNA. Int. J. Biochem. Cell Biol 2009, 41, 254–65. [Google Scholar]
- Ying, S.Y.; Chang, D.C.; Miller, J.D.; Lin, S.L. The microRNA: Overview of the RNA gene that modulates gene functions. Methods Mol. Biol 2006, 342, 1–18. [Google Scholar]
- Lemay, J.F.; Lemieux, C.; St-Andre, O.; Bachand, F. Crossing the borders: Poly(A)-binding proteins working on both sides of the fence. RNA Biol 2010, 7, 291–295. [Google Scholar]
- Glinsky, G.V. Disease phenocode analysis identifies SNP-guided microRNA maps (MirMaps) associated with human “master” disease genes. Cell Cycle 2008, 7, 3680–3694. [Google Scholar]
- Glinsky, G.V. SNP-guided microRNA maps (MirMaps) of 16 common human disorders identify a clinically accessible therapy reversing transcriptional aberrations of nuclear import and inflammasome pathways. Cell Cycle 2008, 7, 3564–3576. [Google Scholar]
- Nuinoon, M.; Makarasara, W.; Mushiroda, T.; Setianingsih, I.; Wahidiyat, P.A.; Sripichai, O.; Kumasaka, N.; Takahashi, A.; Svasti, S.; Munkongdee, T.; et al. A genome-wide association identified the common genetic variants influence disease severity in beta(0)-thalassemia/hemoglobin E. Human Genetics 2009, 127, 303–314. [Google Scholar]
- Glinskii, A.B.; Ma, J.; Ma, S.; Grant, D.; Lim, C.U.; Sell, S.; Glinsky, G.V. Identification of intergenic trans-regulatory RNAs containing a disease-linked SNP sequence and targeting cell cycle progression/differentiation pathways in multiple common human disorders. Cell Cycle 2009, 8, 3925–3942. [Google Scholar]
- Halvorsen, M.; Martin, J.S.; Broadaway, S.; Laederach, A. Disease-associated mutations that alter the RNA structural ensemble. PLoS Genet 2010, 6, 1–11. [Google Scholar]
- Salari, R.; Kimchi-Sarfaty, C.; Gottesman, M.M.; Przytycka, T.M. Sensitive measurement of single-nucleotide polymorphism-induced changes of RNA conformation: Application to disease studies. Nucleic Acids Res 2013, 41, 44–53. [Google Scholar]
- Martin, J.S.; Halvorsen, M.; Davis-Neulander, L.; Ritz, J.; Gopinath, C.; Beauregard, A.; Laederach, A. Structural effects of linkage disequilibrium on the transcriptome. RNA 2012, 18, 77–87. [Google Scholar]
- Mathews, D.H.; Disney, M.D.; Childs, J.L.; Schroeder, S.J.; Zuker, M.; Turner, D.H. Incorporating chemical modification constraints into a dynamic programming algorithm for prediction of RNA secondary structure. Proc. Natl. Acad. Sci. USA 2004, 101, 7287–7292. [Google Scholar]
- Mathews, D.H. Using an RNA secondary structure partition function to determine confidence in base pairs predicted by free energy minimization. RNA 2004, 10, 1178–1190. [Google Scholar]
- Mathews, D.H. Revolutions in RNA secondary structure prediction. J. Mol. Biol 2006, 359, 526–532. [Google Scholar]
- Mathews, D.H.; Moss, W.N.; Turner, D.H.; Noller, H.F. Folding and finding RNA secondary structure. Cold Spring Harber Perspect. Biol 2010, 2, 1–15. [Google Scholar]
- Bernhart, S.H.; Tafer, H.; Muckstein, U.; Flamm, C.; Stadler, P.F.; Hofacker, I.L. Partition function and base pairing probabilities of RNA heterodimers. Algorithms Mol. Biol 2006, 1, 1–11. [Google Scholar]
- Schroeder, S.J.; Stone, J.W.; Bleckley, S.; Gibbons, T.; Mathews, D.M. Ensemble of secondary structures for encapsidated satellite tobacco mosaic virus RNA consistent with chemical probing and crystallography constraints. Biophys. J 2011, 101, 167–175. [Google Scholar]
- Low, J.T.; Weeks, K.M. SHAPE-directed RNA secondary structure prediction. Methods 2010, 52, 150–158. [Google Scholar]
- Deigan, K.E.; Li, T.W.; Mathews, D.H.; Weeks, K.M. Accurate SHAPE-directed RNA structure determination. Proc. Natl. Acad. Sci. USA 2009, 106, 97–102. [Google Scholar]
- Quarrier, S.; Martin, J.S.; Davis-Neulander, L.; Beauregard, A.; Laederach, A. Evaluation of the information content of RNA structure mapping data for secondary structure prediction. RNA 2010, 16, 1108–1117. [Google Scholar]
- Hajdin, C.E.; Bellaousov, S.; Huggins, W.; Leonard, C.W.; Mathews, D.H.; Weeks, K.M. Accurate SHAPE-directed RNA secondary structure modeling, including pseudoknots. Proc. Natl. Acad. Sci. USA 2013, 110, 5498–5503. [Google Scholar]
- Ding, Y. A statistical sampling algorithm for RNA secondary structure prediction. Nucleic Acids Res 2003, 31, 7280–7301. [Google Scholar]
- Ding, Y. Statistical and Bayesian approaches to RNA secondary structure prediction. RNA 2006, 12, 323–331. [Google Scholar]
- Chan, C.Y.; Lawrence, C.E.; Ding, Y. Structure clustering features on the Sfold Web server. Bioinformatics 2005, 21, 3926–3928. [Google Scholar]
- Hofacker, I.L.; Stadler, P.F. Memory efficient folding algorithms for circular RNA secondary structures. Bioinformatics 2006, 22, 1172–1176. [Google Scholar]
- Lorenz, R.; Bernhart, S.H.; Höner, Zu; Siederdissen, C.; Tafer, H.; Flamm, C.; Stadler, P.F.; Hofacker, I.L. ViennaRNA Package 2.0. Algorithms Mol. Biol 2011, 26, 1–14. [Google Scholar]
- Dawson, W.; Yamamoto, K.; Kawai, G. A new entropy model for RNA : Part I. A critique of the standard Jacobson-Stockmayer model applied to multiple cross links. J. Nucleic Acids Investig 2012, 3, 18–36. [Google Scholar]
- Mathews, D.H. RNA Therapeutics; Methods in Molecular Biology, chapter 8: Using OligoWalk to Identify Efficient SiRNA Sequences; Humana Press: Totowa, NJ, USA, 2010; Volume 629, pp. 109–121. [Google Scholar]
- Sabarinathan, R.; Tafer, H.; Seemann, S.E.; Hofacker, I.L.; Stadler, P.F.; Gorodkin, J. The RNAsnp web server: Predicting SNP effects on local RNA secondary structure. Nucleic Acids Res 2013, 41(W1), 1–5. [Google Scholar]
- Mathews, D.H.; Sabina, J.; Zuker, M.; Turner, D.H. Expanded sequence dependence of thermodynamic parameters improves prediction of RNA secondary structure. J. Mol. Biol 1999, 288, 911–940. [Google Scholar]
- Huynen, M.; Gutell, R.; Konings, D. Assessing the reliability of RNA folding using statistical mechanics. J. Mol. Biol 1997, 267, 1104–1112. [Google Scholar]
- Schultes, E.A.; Hraber, P.T.; LaBean, T.H. Estimating the contributions of selection and self-organization in RNA secondary structure. J. Mol. Evol 1999, 49, 76–83. [Google Scholar]
- Freyhult, E.; Gardner, P.P.; Moulton, V. A comparison of RNA folding measures. BMC Bioinforma 2005, 6, 1–9. [Google Scholar]
- Wang, Y.; Manzour, A.; Shareghi, P.; Shaw, T.I.; Li, Y.W.; Malmberg, R.L.; Cai, L. Stable stem enabled Shannon entropies distinguish non-coding RNAs from random backgrounds. BMC Bioinforma 2012, 13 Suppl 5, 1–10. [Google Scholar]
- Lorenz, W.A.; Clote, P. Computing the partition function for kinetically trapped RNA secondary structures. PloS One 2011, 6, 1–17. [Google Scholar]
- Zadeh, J.N.; Wolfe, B.R.; Pierce, N.A. Nucleic Acid Sequence Design via Efficient Ensemble Defect Optimization. J. Comput. Chem 2011, 32, 439–452. [Google Scholar]
- Dirks, R.M.; Lin, M.; Winfree, E.; Pierce, N.A. Paradigms for computational nucleic acid design. Nucleic Acids Res 2004, 32, 1392–1403. [Google Scholar]
- Andersen, E.S. Prediction and design of DNA and RNA structures. New Biotechnol 2010, 27, 184–193. [Google Scholar]
- Le, S.Y.; Zhang, K.; Maizel, J.V. RNA molecules with structure dependent functions are uniquely folded. Nucleic Acids Res 2002, 30, 3574–3582. [Google Scholar]
- Webb-Robertson, B.M.; McCue, L.A.; Lawrence, C.E. Measuring global credibility with application to local sequence alignment. PLoS Comput. Biol 2008, 4, 1–12. [Google Scholar]
- Karolchik, D.; Kuhn, R.M.; Baertsch, R.; Barber, G.P.; Clawson, H.; Diekhans, M.; Giardine, B.; Harte, R.A.; Hinrichs, A.S.; Hsu, F.; et al. The UCSC Genome Browser Database: 2008 update. Nucleic Acids Res 2008, 36, D773–D779. [Google Scholar]
- Cannone, J.J.; Subramanian, S.; Schnare, M.N.; Collett, J.R.; D’Souza, L.M.; Du, Y.; Feng, B.; Lin, N.; Madabusi, L.V.; Müller, K.M.; et al. The comparative RNA web (CRW) site: An online database of comparative sequence and structure information for ribosomal, intron, and other RNAs. BMC Bioinforma 2002, 3, 1–31. [Google Scholar]
- Griffiths-Jones, S.; Moxon, S.; Marshall, M.; Khanna, A.; Eddy, S.R.; Bateman, A. Rfam: Annotating non-coding RNAs in complete genomes. Nucleic Acids Res 2005, 33, Database issue. D121–D124. [Google Scholar]
- Griffiths-Jones, S.; Bateman, A.; Marshall, M.; Khanna, A.; Eddy, S.R. Rfam: An RNA family database. Nucleic Acids Res 2003, 31, 439–441. [Google Scholar]
- The RNA Mapping Database, Available online: http://http://rmdb.stanford.edu/repository Accessed on June 8, 2013.
- Das, R.; Kudaravalli, M.; Jonikas, M.; Laederach, A.; Fong, R.; Schwans, J.P.; Baker, D.; Piccirilli, J.A.; Altman, R.B.; Herschlag, D. Structural inference of native and partially folded RNA by high-throughput contact mapping. Proc. Natl. Acad. Sci 2008, 105, 4144–4149. [Google Scholar]
- Das, R.; Laederach, A.; Pearlman, S.M.; Herschlag, D.; Altman, R.B. SAFA: Semi-automated footprinting analysis software for high-throughput quantification of nucleic acid footprinting experiments. RNA 2005, 11, 344–354. [Google Scholar]
- Weinberg, Z.; Breaker, R.R. R2R–software to speed the depiction of aesthetic consensus RNA secondary structures. BMC Bioinforma 2011, 12, 1–19. [Google Scholar]
- Peng, C.K.; Buldyrev, S.V.; Goldberger, A.L.; Havlin, S.; Mantegna, R.N.; Simons, M.; Stanley, H.E. Statistical properties of DNA sequences. Phys. A 1995, 221, 180–192. [Google Scholar]
- Rana, T.M. Illuminating the silence: Understanding the structure and function of small RNAs. Nat. Rev. Mol. Cell Biol 2007, 8, 23–36. [Google Scholar]
- Waldispuhl, J.; Clote, P. Computing the partition function and sampling for saturated secondary structures of RNA, with respect to the Turner energy model. J. Comput. Biol 2007, 14, 190–215. [Google Scholar]
- Tyagi, R.; Mathews, D.H. Predicting helical coaxial stacking in RNA multibranch loops. RNA 2007, 13, 939–951. [Google Scholar]
- Seffens, W.; Digby, D. mRNAs have greater negative folding free energies than shuffled or codon choice randomized sequences. Nucleic Acids Res 1999, 27, 1578–1584. [Google Scholar]
- Clote, P.; Ferré, F.; Kranakis, E.; Krizanc, D. Structural RNA has lower folding energy than random RNA of the same dinucleotide frequency. RNA 2005, 11, 578–591. [Google Scholar]
- Rivas, E.; Eddy, S. Secondary structure alone is generally not statistically significant for the detection of noncoding RNAs. Bioinformatics 2000, 16, 583–605. [Google Scholar]
- Hafner, M.; Landthaler, M.; Burger, L.; Khorshid, M.; Hausser, J.; Berninger, P.; Rothballer, A.; Ascano, M.; Jungkamp, A.C.; Munschauer, M.; et al. PAR-CliP–a method to identify transcriptome-wide the binding sites of RNA binding proteins. J. Vis. Exp 2010, 1–4. [Google Scholar]
- Woodson, S.A. Recent insights on RNA folding mechanisms from catalytic RNA. Cell Mol. Life Sci 2000, 57, 796–808. [Google Scholar]
- Noller, H.F. RNA structure: Reading the ribosome. Science 2005, 309, 1508–1514. [Google Scholar]
- Wimberly, B.T.; Brodersen, D.E.; Clemons, W.M.; Morgan-Warren, R.J.; Carter, A.P.; Vonrhein, C.; Hartsch, T.; Ramakrishnan, V. Structure of the 30S ribosomal subunit. Nature 2000, 407, 327–339. [Google Scholar]
- Yusupov, M.M.; Yusupova, G.Z.; Baucom, A.; Lieberman, K.; Earnest, T.N.; Cate, J.H.; Noller, H.F. Crystal structure of the ribosome at 5.5 A resolution. Science 2001, 292, 883–896. [Google Scholar]
- Schuwirth, B.S.; Borovinskaya, M.A.; Hau, C.W.; Zhang, W.; Vila-Sanjurjo, A.; Holton, J.M.; Cate, J.H.D. Structures of the bacterial ribosome at 3.5 A resolution. Science 2005, 310, 827–834. [Google Scholar]
- Ferrari, F.; Foglieni, B.; Arosio, P.; Camaschella, C.; Daraio, F.; Levi, S.; Garcia Erce, J.A.; Beaumont, C.; Cazzola, M.; Ferrari, M.; et al. Microelectronic DNA chip for hereditary hyperferritinemia cataract syndrome, a model for large-scale analysis of disorders of iron metabolism. Hum. Mutat 2006, 27, 201–208. [Google Scholar]
- Le, S.Y.; Liu, W.M.; Maizel, J.V. A data mining approach to discover unusual folding regions in genome sequences. Knowl.-Based Syst 2002, 15, 243–250. [Google Scholar]
- Ritz, J.; Martin, J.S.; Laederach, A. Evaluating our ability to predict the structural disruption of RNA by SNPs. BMC Genomics 2012, 13 Suppl 4, 1–11. [Google Scholar]
- Reining, A.; Nozinovic, S.; Schlepckow, K.; Buhr, F.; Fürtig, B.; Schwalbe, H. Three-state mechanism couples ligand and temperature sensing in riboswitches. Nature 2013, 499, 355–359. [Google Scholar]
- Laederach, A.; Shcherbakova, I.; Liang, M.P.; Brenowitz, M.; Altman, R.B. Local kinetic measures of macromolecular structure reveal partitioning among multiple parallel pathways from the earliest steps in the folding of a large RNA molecule. J. Mol. Biol 2006, 358, 1179–1190. [Google Scholar]
- Martin, J.S.; Simmons, K.; Laederach, A. Exhaustive Enumeration of Kinetic Model Topologies for the Analysis of Time-Resolved RNA Folding. Algorithms 2009, 2, 200–214. [Google Scholar]


© 2014 by the authors; licensee MDPI, Basel, Switzerland This article is an open access article distributed under the terms and conditions of the Creative Commons Attribution license (http://creativecommons.org/licenses/by/3.0/).
Share and Cite
Martin, J.S. Describing the Structural Diversity within an RNA’s Ensemble. Entropy 2014, 16, 1331-1348. https://doi.org/10.3390/e16031331
Martin JS. Describing the Structural Diversity within an RNA’s Ensemble. Entropy. 2014; 16(3):1331-1348. https://doi.org/10.3390/e16031331
Chicago/Turabian StyleMartin, Joshua S. 2014. "Describing the Structural Diversity within an RNA’s Ensemble" Entropy 16, no. 3: 1331-1348. https://doi.org/10.3390/e16031331