The Superiority of Tsallis Entropy over Traditional Cost Functions for Brain MRI and SPECT Registration

Abstract
: Neuroimage registration has an important role in clinical (for both diagnostic and therapeutic purposes) and research applications. In this article we describe the applicability of Tsallis Entropy as a new cost function for neuroimage registration through a comparative analysis based on the performance of the traditional approaches (correlation based: Entropy Correlation Coefficient (ECC) and Normalized Cross Correlation (NCC); and Mutual Information (MI) based: Mutual Information using Shannon Entropy (MIS) and Normalized Mutual Information (NMI)) and the proposed one based on MI using Tsallis entropy (MIT). We created phantoms with known geometric transformations using Single Photon Emission Computed Tomography (SPECT) and Magnetic Resonance Imaging from 3 morphologically normal subjects. The simulated volumes were registered to the original ones using both the proposed and traditional approaches. The comparative analysis of the Relative Error (RE) showed that MIT was more accurate in the intra-modality registration, whereas for inter-modality registration, MIT presented the lowest RE for rotational transformations, and the ECC the lowest RE for translational transformations. In conclusion, we have shown that, with certain limitations, Tsallis Entropy has application as a better cost function for reliable neuroimage registration.1. Introduction
Systems for Computer Aided Diagnosis (CAD) have received significant attention as an auxiliary tool in medical diagnosis. In particular, CAD may contribute to the qualitative and quantitative analysis of medical images. For this, several image processing techniques must be applied for the realignment, registration, segmentation, normalization and smoothing of 2-D images and 3-D volumes [1,2]. The registration comprises the overlaying of two or more images using the coordinate system of one of them to establish correspondence to the coordinate system in the other one. This process can be performed in three ways: (a) manually, guided by a physician or a specialist who needs to drive the reference volume to the target one; (b) semi-automated registration, based on markers defined in the image content; and (c) automated registration, using algorithms that can be based on fiducial marks, surface matching, and similarity measures [3,4]. Rigid body registration is widely used for intra-subject neuroimage registration and it consists of searching rotations and translations to match images with the same anatomy; for instance, a 3D-to-3D rigid body registration is defined by three translations and three rotations, i.e., six transformation parameters [5].
Based on clinical grounds, the findings obtained by different imaging techniques can be used in a complementary manner by physicians. The combination of morphologic images (X-ray, Ultrasound (US), Computed Tomography (CT) and Magnetic Resonance Imaging (MRI)) and the functional ones (Positron Emission Tomography (PET), Single Photon Emission Computed Tomography (SPECT) and functional Magnetic Resonance Imaging (fMRI)) can improve the image interpretation [6]. This procedure, known as multimodal or intermodal medical image registration, is a relevant tool for the surgical planning. In neurosurgery, for example, multimodal or intermodal image registrations are useful to identify lesions or to localize dysfunctional areas to be resected. For epilepsy, the multimodal registration of MRI and SPECT can provide important information for the localization of the epileptogenic zone that must be surgically removed for patients to be seizure-free [7]. Monomodal or intramodal registration are useful in the pre and post-condition image analysis, e.g., comparative inspection of the ictal and interictal SPECT images, subtraction of ictal and interictal SPECT co-registered to MRI (SISCOM), and for the study of ongoing or stepwise brain changes in the course of a disease [8]. Another interesting application of SPECT registration can be found on Oliveira et al. [9] in which is proposed a computational solution to quantify a specific to an non-specific uptake ratio in [123I]FP-CIT SPECT images and simultaneously measure the spatial dimensions of the basal ganglia.
Currently many software solutions and methods are available for different registration applications. A very recent review about registration methods can be found in Oliveira et al. [10]. The well-known Statistical Parametric Mapping (SPM) adopts similarity measures for neuroimage registration, and gives four cost function options: Entropy Correlation Coefficient (ECC), Normalized Cross Correlation (NCC), standard Mutual Information using Shannon Entropy (MIS) and Normalized Mutual Information (NMI). Mutual Information (MI) is a measurement originated from Information Theory [11], and was first proposed for medical image registration in [12,13]. Thenceforward, many studies have found satisfactory results for registration based on Information Theory. Recently, a comparative study of 16 registration methods evaluated the multimodal rigid body registration of neuroimages. The results have shown that two methods based on MI were superior to the alternatives and obtained similar accuracy to that of the gold standard [14]. The most important contribution of MI is the use of entropy as a quantification of information.
The entropy of an image is understood as a measure of diffusion of a gray level distribution. A homogeneous image have low entropy value since its histogram has just one peak; in the other hand, a heterogeneous image, with many peaks in its histogram, result in a high entropy value [15]. In this setting, given two images A and B, the Mutual Information is defined as:
where H(A) and H(B) are the entropy of images A and B, and H(A,B) is the intersection of the entropies, corresponding to a measure of diffusion of joint histogram p(a,b). In other words, H(A,B) is the probability of incidence of the gray value a in image A and the grey value b in image B (in correspondent coordinates), for all a and b in the region of superposition of A and B.
The classic Shannon entropy is given by Equation (2):
This formalism is restricted to the statistics of the Boltzmann-Gibbs-Shannon (BGS) validity domain, assuming to describe nature for the effect of short ranged interactions and the microscopic memory. Usually, systems that conform to the BGS are referred to as additive systems. Considering that we can decompose a physical system into statistically independent A and B subsystems, the probability of a composite system is:
Thus, Shannon entropy demonstrates the additive property:
However, for certain classes of physical systems that possess long range interactions, long time memories, and fractal-type structure it is necessary to extend the Shannon theory. The importance of fractal geometry in medical image processing is explained by the self-similarity observed in biological structures imaged with a finite resolution. These images are spectrally and spatially complex, and also have similarities at different spatial scales [16]. Constantino Tsallis, influenced by multifractal concept, come up with a generalization of BGS statistics based on the generalized form:
where k is a positive constant, W is the number of possibilities and the real number q is the entropic index of non-additivity degree. The Tsallis entropy is identical to BGS entropy in the limit q→1 [18]. Tsallis entropy is non-additive in such a way that for a statistically independent system, the entropy follows the pseudo-additive entropic rule:
Consequently, q = 1 corresponds to additivity, q < 1 corresponds to sub-additivity and q > 1 to super-additivity [19]. So, considering Sq ≥ 0 in the pseudo-additive formalism of the previous equation (6), the following entropic classifications are defined:
The entropic index q fluctuates according to the system properties, which includes the long distance correlations and multifractal characteristics, and represents the degree of non-additivity of the system.
Several generalized differential entropies and divergences have been suggested and proven to be efficient for medical image processing applications. Recently, Carvalho [20] studied Hellinger’s metric as a nonparametric metric estimator based on the Parzen window in which it was possible to design a new two-stage resampling error bound estimator. Its asymptotic behavior allows use this metric in three or more densities, just like clustering and image processing and analysis. Additionally, previous studies showed satisfactory results using Tsallis Entropy for segmentation [21] and registration [22] in general image databases and in medical images [23–25]. More principles and concepts about registration methods and similarity metrics can be found in Goshtasby [26].
We used the non-additive Tsallis formula to calculate the entropy in the determination of Mutual Information, which was used as a cost function for the registration. This technical note aims to evaluate the Mutual Information using the Tsallis Entropy (MIT) as a new cost function for MRI and SPECT neuroimage registration, in comparison to the set of cost functions traditionally available on SPM8.
2. Material and Methods
2.1. Computational Resources and Software
The algorithms and the methods were developed in the Center of Imaging Sciences and Medical Physics of the Ribeirão Preto Medical School. An All-in-one HP Omni Pro110 PC (Intel® Core ™2 Duo CPU [email protected] GHz, 4.00 GB memory) running a Microsoft OS (Windows 7 Professional) was used. This supported the following softwares: MRIcro version 1.40 build 1 was used to convert the image formats, and MatLab 7.12 (R2011a) to run SPM8, which was used to perform the registrations.
2.2. Algorithm
The SPM’s registration routines were edited and adapted to incorporate the Tsallis Entropy as a new optional cost function for registration. One important feature of this module is the free selection of values for the non-additive parameter; thereupon, this parameter can be adapted according the registration characteristics.
2.3. MRI and SPECT Protocols
All procedures were in compliance with Ethics Committee of the Ribeirão Preto School of Medicine (FMRP-USP) guidelines. The selection of morphologically normal MRI and SPECT images for the present research was provided from three volunteers (two women and one man) who gave written informed consent to participate. These subjects were evaluated by a neurologist from the Medical Center of the Ribeirão Preto Medical School, University of São Paulo, Brazil. The MRI and SPECT images were selected according to the following inclusion criteria: (1) the images should be considered normal, with no previous history of inflammation, infection, surgical intervention or neurological insults; and (2) MRI and SPECT should be acquired and processed in the same machines, of the same facility, as described below. Exclusion criteria included: (1) MRI and SPECT images showing even the slightest evidence of voluntary movement; and (2) SPECT images acquired with low count rate. This research project was approved by our Research Ethics Committee (Protocol Number: 9141/2009). Brain SPECT imaging was carried out using 40 mCi (1480 MBq) of the tracer 99mTc—ethyl cysteinate diethylester (99mTc-ECD or 99mTc-bicisate). Subjects were injected under strictly controlled conditions, with eyes opened and in a quiet semi-darkened room. The dose was injected by the intravenous route just 30 min after the technician had given verbal instructions and volunteer have recovered from the discomfort caused by the establishment of an intravenous line. SPECT images were acquired 60 min after the tracer injection, using a rotating dual-headed gamma camera (SOPHA, SMV, Twinsburg, OH, USA) equipped with a low-energy, high-resolution parallel-hole collimator with the photopeak energy window centered at 140 keV with a width of 20%. Thirty-two projections (30 s per projection) were acquired per head, in a 128 × 128 matrix with a ×2 zoom, over a 180 degrees orbit, summing up to 75,000 counts/projection/head, and resulting in 64 views obtained at 31 intervals. Filtered back-projection was performed with a low-resolution Butterworth filter with a cutoff frequency of 0.14 cycles per pixel, of order 9. Images were reconstructed and visually analyzed in the orbitomeatal transverse, coronal and sagittal slices. The uniform attenuation correction was performed taking the size of a pixel at 2.55 mm, using the first-order Chang algorithm, and applying an attenuation coefficient of 0.12 cm−1.
MRI images were acquired on a Siemens Magnetom Vision unit of 1.5 Tesla (Erlangen, Germany), according to protocols specifically designed for epilepsy studies: (a) High resolution sagittal T1-weighted spoiled gradient recall (SPGR) sequence; (b) Double echo transverse turbo spin echo (TSE) PD-T2-weighted; (c) A pair of fluid-attenuated inversion recovery (FLAIR) sequences, a transverse sequence with 5-mm thick slices and a coronal sequence with 3-mm thick slices angled perpendicularly to the hippocampus; (d) One turbo short-tau inversion recovery (STIR) coronal sequence through the temporal lobes with thin continuous sections of 2 mm angle perpendicular to the hippocampus. In this study, only the 3D T1-weighted Gradient-Echo MRI sequence was used [27].
2.4. MRI and SPECT Protocols
The brain SPECT and T1-weighted MRI images were converted from DICOM to NIfIT format using MRIcro software (by Chris Rorden, Neuropsychology Lab, Columbia, SC, USA) [28] and then preprocessed using the SPM8 package (Wellcome Trust Centre for Neuroimaging, University College of London, London, UK) [29]. SPM8 was used for the construction of anatomical phantoms containing predetermined geometric variations following the steps: (1) firstly, we verified whether the volumes presented major transformations that could affect the overall performance of the algorithm (for example, 90° rotations). Those that presented these transformations were manually corrected; (2) for each MRI and SPECT volume, the anterior commissure was set as representing the origin volume; (3) the volumes undergone an affine transformation and were co-registered and normalized in the same anatomical space with their respective templates available in the SPM. (SPECT.mnc and T1.mnc); (4) the normalized volumes were binarized using the mask brainmask.mnc, which is also available in the SPM, to remove external signal that could impair the registration process; (5) finally, these normalized volumes were described as MRI_1, MR_2 MR_3 for the respective magnetic resonance volumes of the volunteers #1, #2 and #3, and SPECT_1, SPECT_2 SPECT_3 for the respective SPECT volumes of the volunteers, and usually termed as the base volumes.
2.5. Simulators
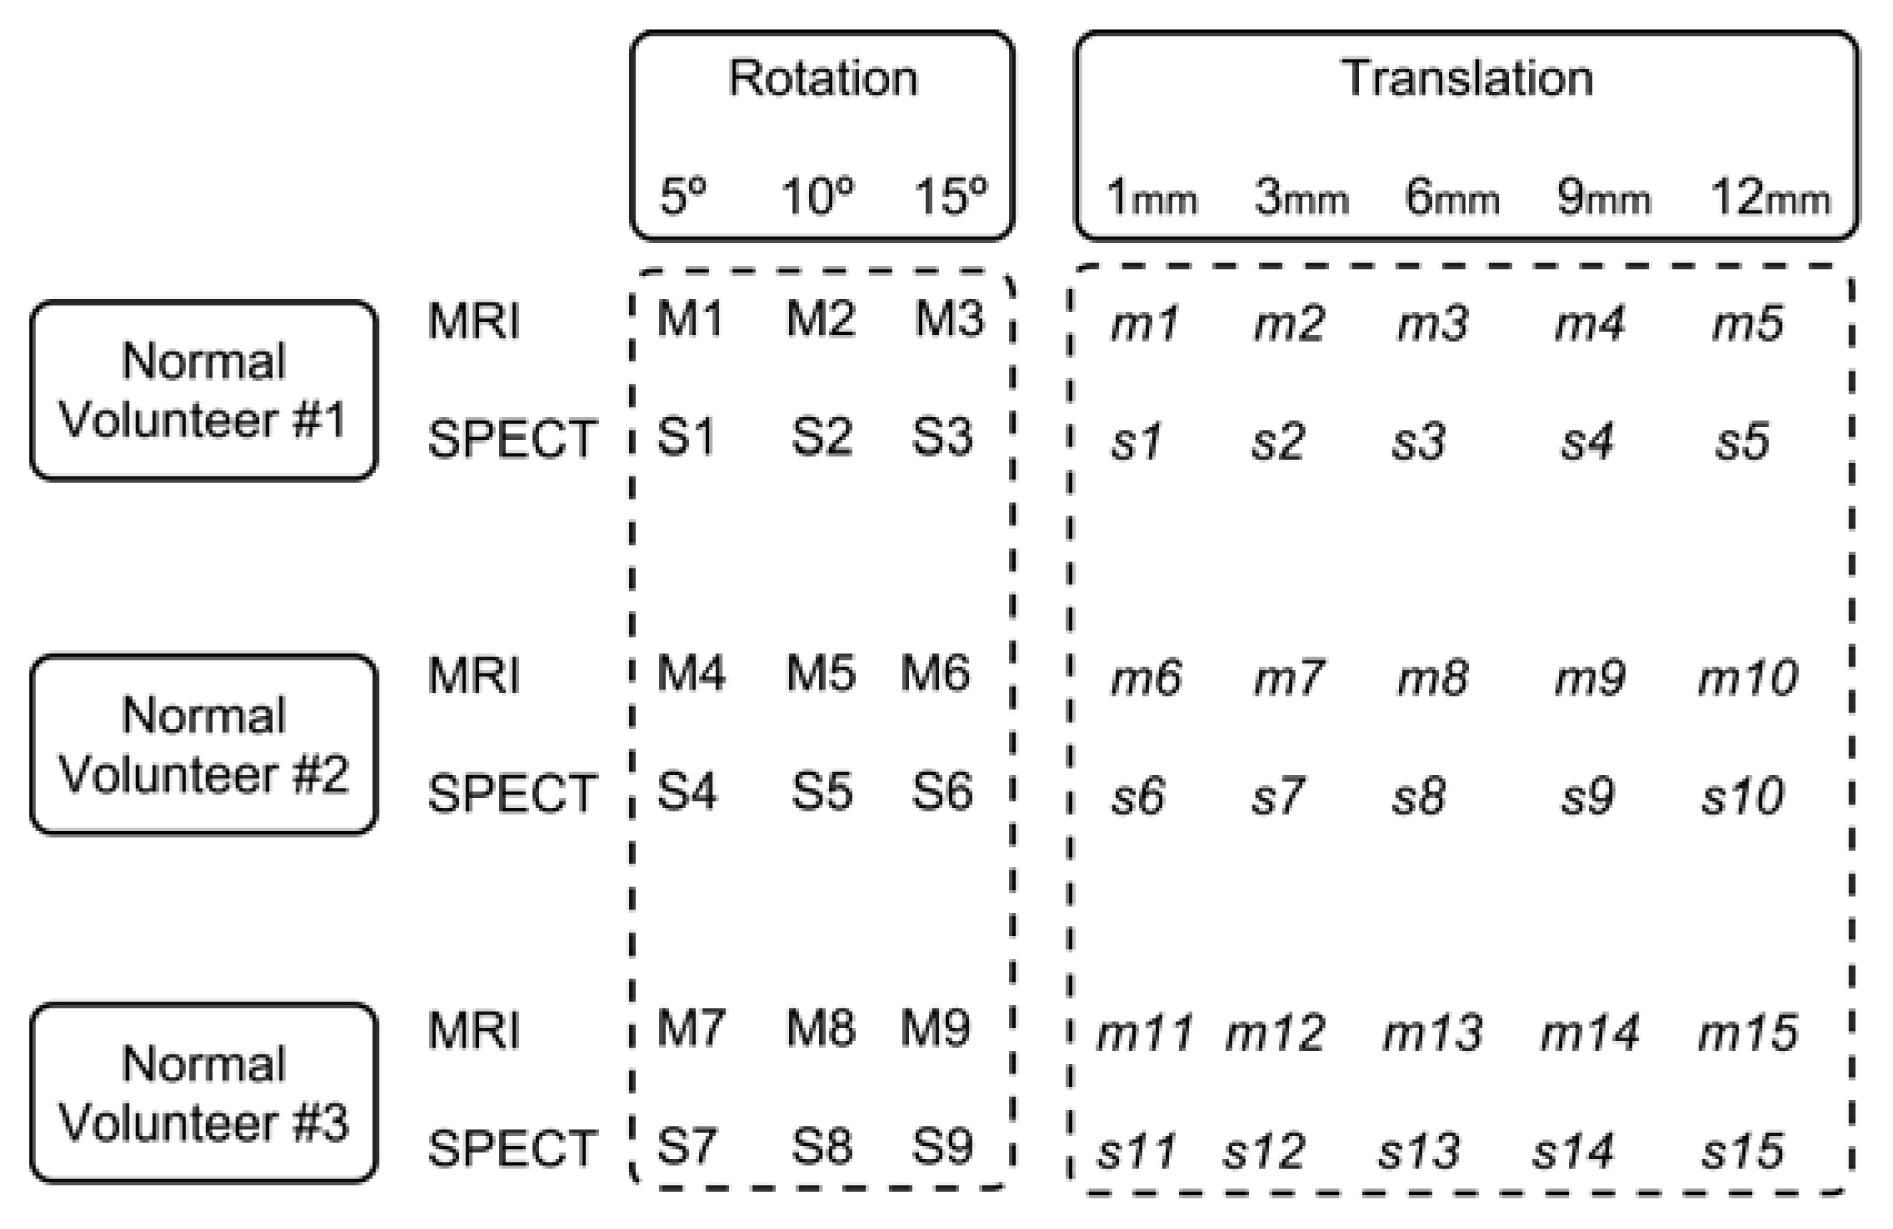
Using the baseline volumes, two independent sets of MRI and SPECT simulators were constructed. For the first set (rotational transformation), the baseline MRI and SPECT volumes of each volunteer were used to construct three MRI and three SPECT simulators, which are different among themselves only by the application of 5°, 10° and 15° rotational transformations around the three axes altogether (pitch, roll, and yaw). As a result, we obtained a set of nine rotational MRI (Figure 1, simulators M1 to M9) and 9 rotational SPECT simulators (Figure 1, simulators S1 to S9) for each of the three volunteers.
For the second set (translational transformation), the MRI and SPECT baseline volumes of each volunteer were used to construct five MRI and five SPECT simulators, which are different among themselves only by the application of 1, 3, 6, 9 and 12 mm of translational transformations around the three axes altogether (pitch, roll, and yaw). As a result, we obtained a set of 15 translational MRI simulators (Figure 1, simulators m1 to m15) and 15 translational SPECT simulators (Figure 1, simulators s1 to s15) for each of the three volunteers. In total, we obtained 48 MRI and SPECT simulators.
Our study was based on rigid transformation because this approach presents wide clinical applicability in neurology and it is effective to describe the spatial relationship between two or more neuroimages since the motion of the brain is largely constrained by the skull. Additionally, similarity metrics measures have proved to perform satisfactory results in linear registration algorithms and several neuroimage softwares, such as SPM, RView and others, use it. Finally, one of the main reasons for the successful impact of rigid registration techniques is the fact that these techniques can be assessed and validate against a gold standard.
Non-linear registration is also clinically relevant and can use similarity metrics as well. Generally it is useful to relate tissue deformation caused by intervention or relevant changes occurred over time, however it is a more complex approach that has limited validation accuracy and it would not be an appropriate choice to test a new similarity metrics for the first time.
The rotations and translations values for the simulated transformations were defined based on related studies, which generally apply different levels of perturbations in the source image in order to evaluate the registration algorithm under situations that are commonly faced in the clinical scenario. Higher transformations might occur clinically as well, however they can be minimized manually and used as starting point by the algorithm.
2.6. Registration
2.6.1. Intra-Modality MRI and SPECT Registration
For MRI volumes, the simulators generated from rotational and translational transformations were registered with the respective baseline MRI volumes for each volunteer (see Figure 2). After rigid transformations, the M1, M2 and M3 simulators were registered with the baseline MRI_1; M4, M5 and M6 simulators with the baseline MRI_2, and M7, M8 and M9 simulators with the baseline MRI_3. Also after rigid transformations, the m1 to m5 simulators were registered with the baseline MRI_1; m6 to m10 simulators with the MRI_2, and m11 to m15 simulators with the MRI_3. A total of 336 registrations were performed in this step. For SPECT volumes, the simulators generated from rotational and translational transformations were also registered with their respective baseline SPECT volumes, for each volunteer (See Figure 2). After rigid transformations, the S1, S2 and S3 simulators were registered with the baseline SPECT_1; S4, S5 and S6 simulators with the SPECT_2, and S7, S8 and S9 simulators with the SPECT_3. Also after rigid transformations, the s1 to s5 simulators were registered with the baseline SPECT_1; s6 to s10 simulators with the SPECT_2, and s11 to s15 simulators with the SPECT_3. A total of 336 registrations were performed in this step.
2.6.2. Inter-Modality Registration
For inter-modality registration, the SPECT simulators generated from rotational and translational transformations were registered with the respective baseline MRI volumes for each volunteer (see Figure 2). After rigid transformations, the S1, S2 and S3 simulators were co-registered with the baseline MRI_1; S4, S5 and S6 simulators with the MRI_2, and S7, S8 and S9 simulators with the MRI_3. Also after rigid transformations, the s1 to s5 simulators were co-registered with the baseline MRI_1; s6 to s10 simulators with the MRI_2, and s11 to s15 simulators with the MRI_3. A total of 336 registrations were performed in this step.
2.6.3. Cost Functions for Registrations
In order to perform the intra and inter-modality registrations of the simulators with baseline MRI and SPECT volumes, we used the traditional objective functions (ECC, NCC, NMI and MIS) and random q values for Tsallis Entropy cost function, using the same computational conditions.
2.7. Qualitative and Quantitative Assessments
Upon conclusion of the registrations, we performed a qualitative assessment based on a visual analysis to define which q values for MIT were able to minimally merge the volumes for intra and inter-modality registrations. For this purpose, we selected only the q values whose registrations had a visually good alignment. Thus, only those q values ranging from 0.1 to 3.0 were included as eligible parameters for the following quantitative study. Otherwise, all the traditional objective functions were visually assessed and included in the quantitative study.
For the quantitative assessment, the registration parameters obtained from the rotational and translational transformation matrices were used to calculate the Relative Error (RE) for the respective rotational (Sq) and translational (t-RE) transformations. This RE was obtained for each of the registrations and was calculated as the difference between the ground truth (the expected parameters) and the translational and rotational values returned from the algorithm, divided by the expected parameters.
where the prefixes rX, rY and rZ correspond to the rotations and tX, tY and tZ to the translations performed in the image’s axis X, Y and Z, respectively, while suffixes exp means the expected value for the transformation, and ret means the effective returned value by the system.
After the individual calculation of r-RE and t-RE for each registration, we calculated an average r-RE and t-RE from simulators registration for each traditional cost function and for each MIT q value. Those q values that presented the best results (the lowest t-RE and r-RE) were compared against the results of the traditional methods (ECC, NCC, NMI, MIS). This comparison was performed by using the same simulators and computational resources, and by applying the same workflow.
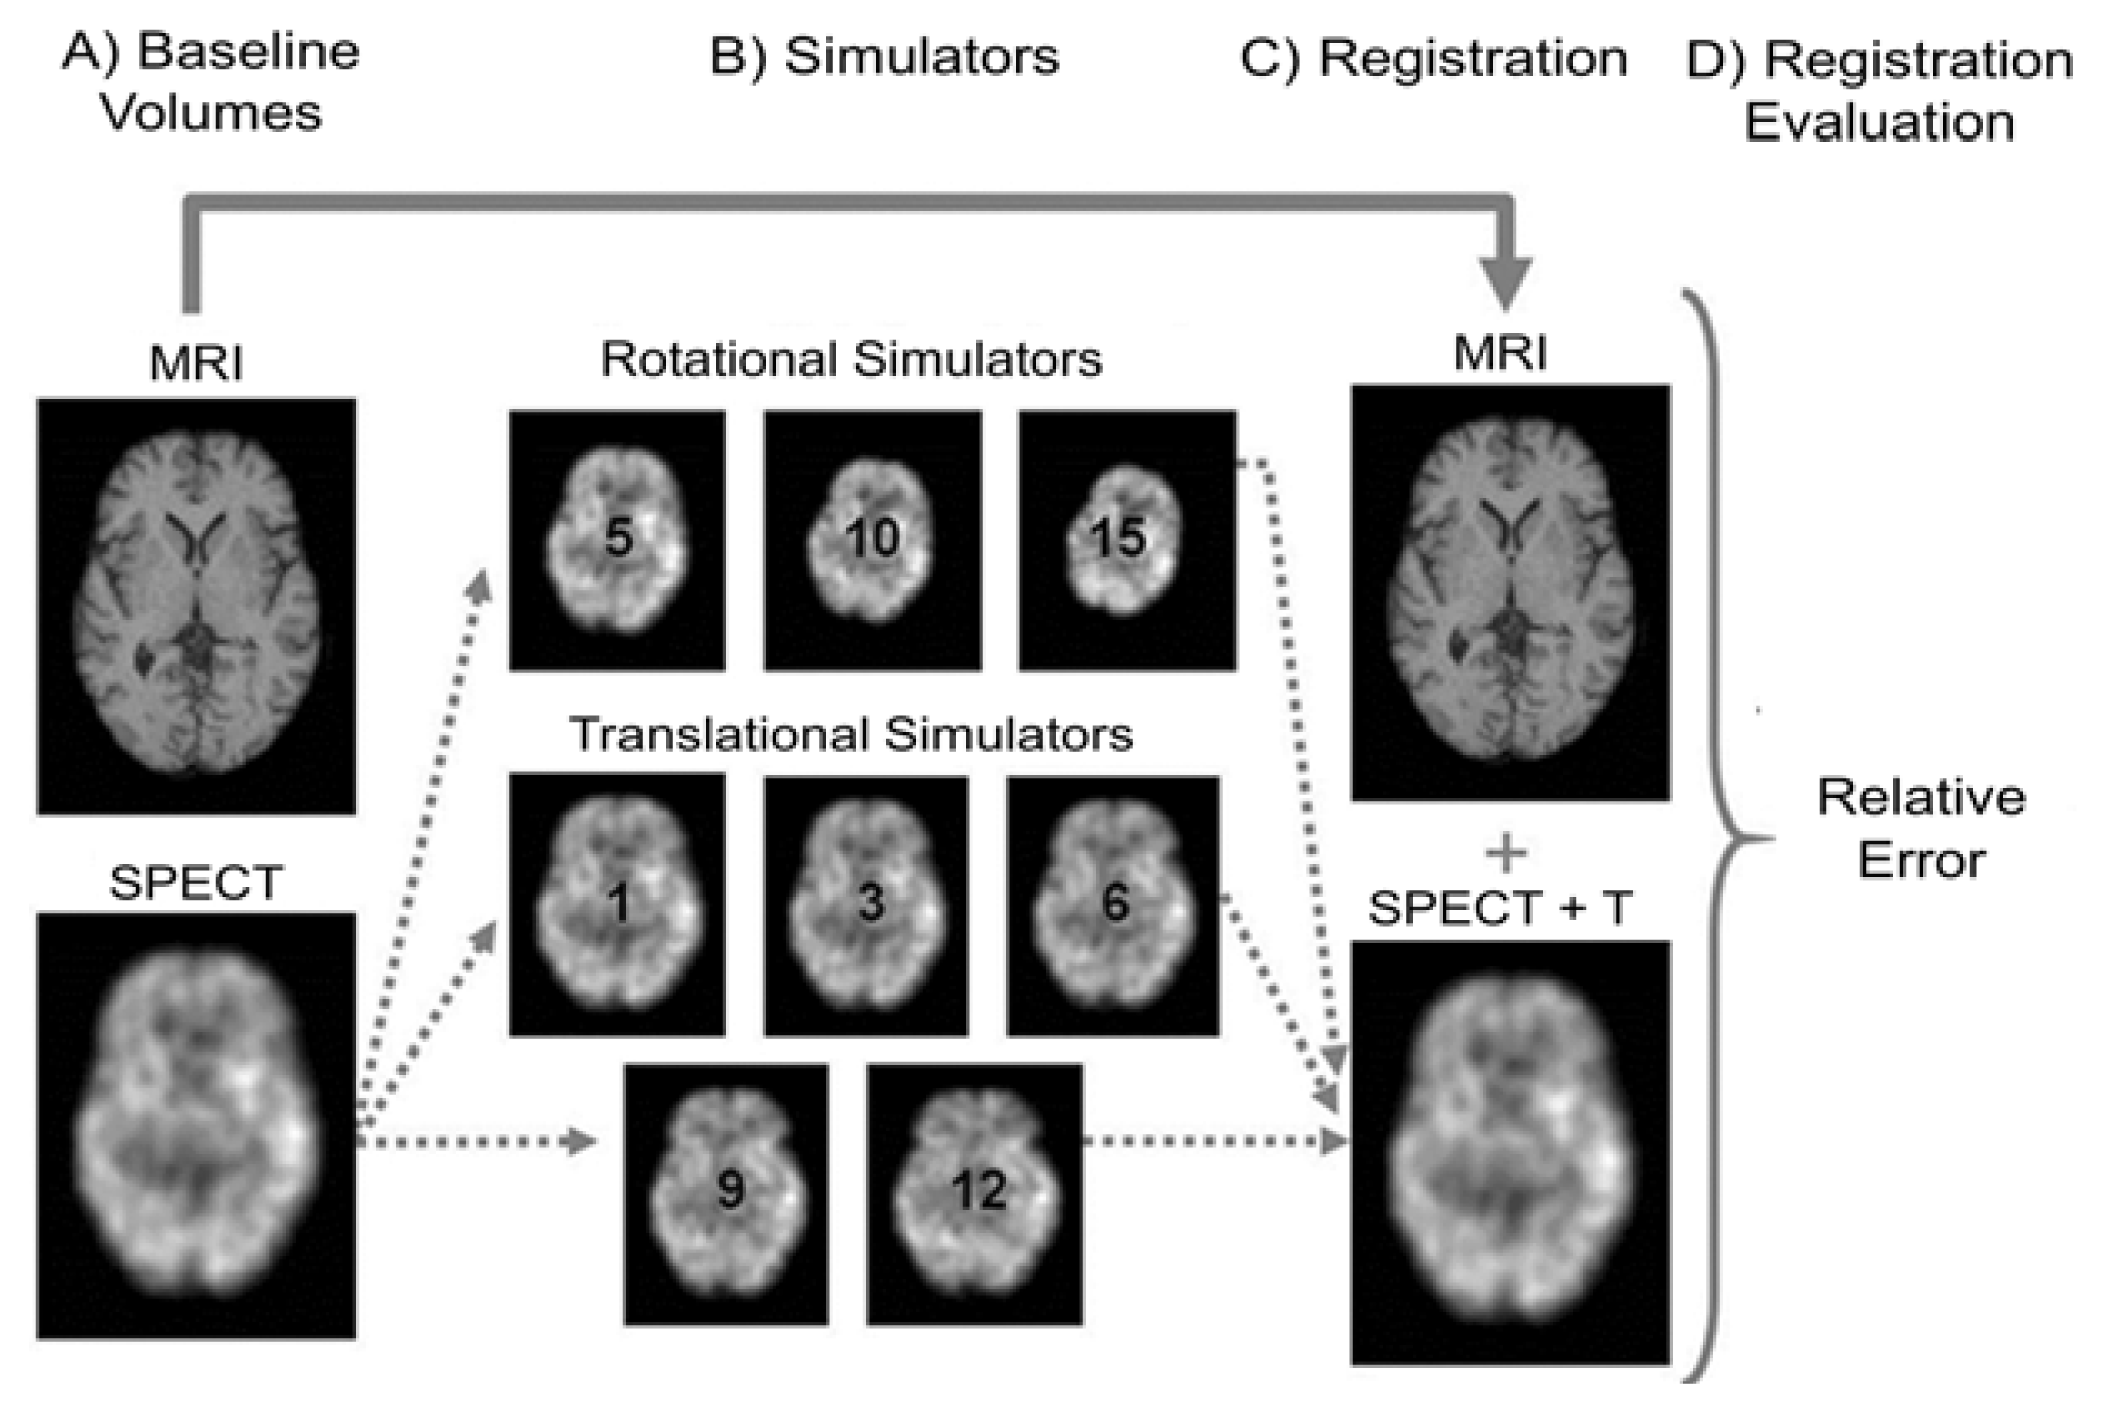
The general overview of the methodology pipeline is showed in Figure 2: (A) Initially, MRI and SPECT volumes were spatially normalized to the same standard space, resulting in two baseline MRI and SPECT phantoms; (B) From the baseline SPECT volume, eight simulators were built: three produced by applying rotational transformation (with 5, 10 and 15 degrees), and five produced by applying translational transformations (1, 3, 6, 9 and 12 mm); (C) Each simulator was registered to the baseline MRI volume and the transformation parameters were recovered; (D) In the final step, transformation parameters were used to estimate the relative error. Intra-modality registrations follow the same pipeline. As it can be noticed, the same procedures were applied to the images of each of the three volunteers, by performing the intra and inter-modality registrations.
3. Experimental Section
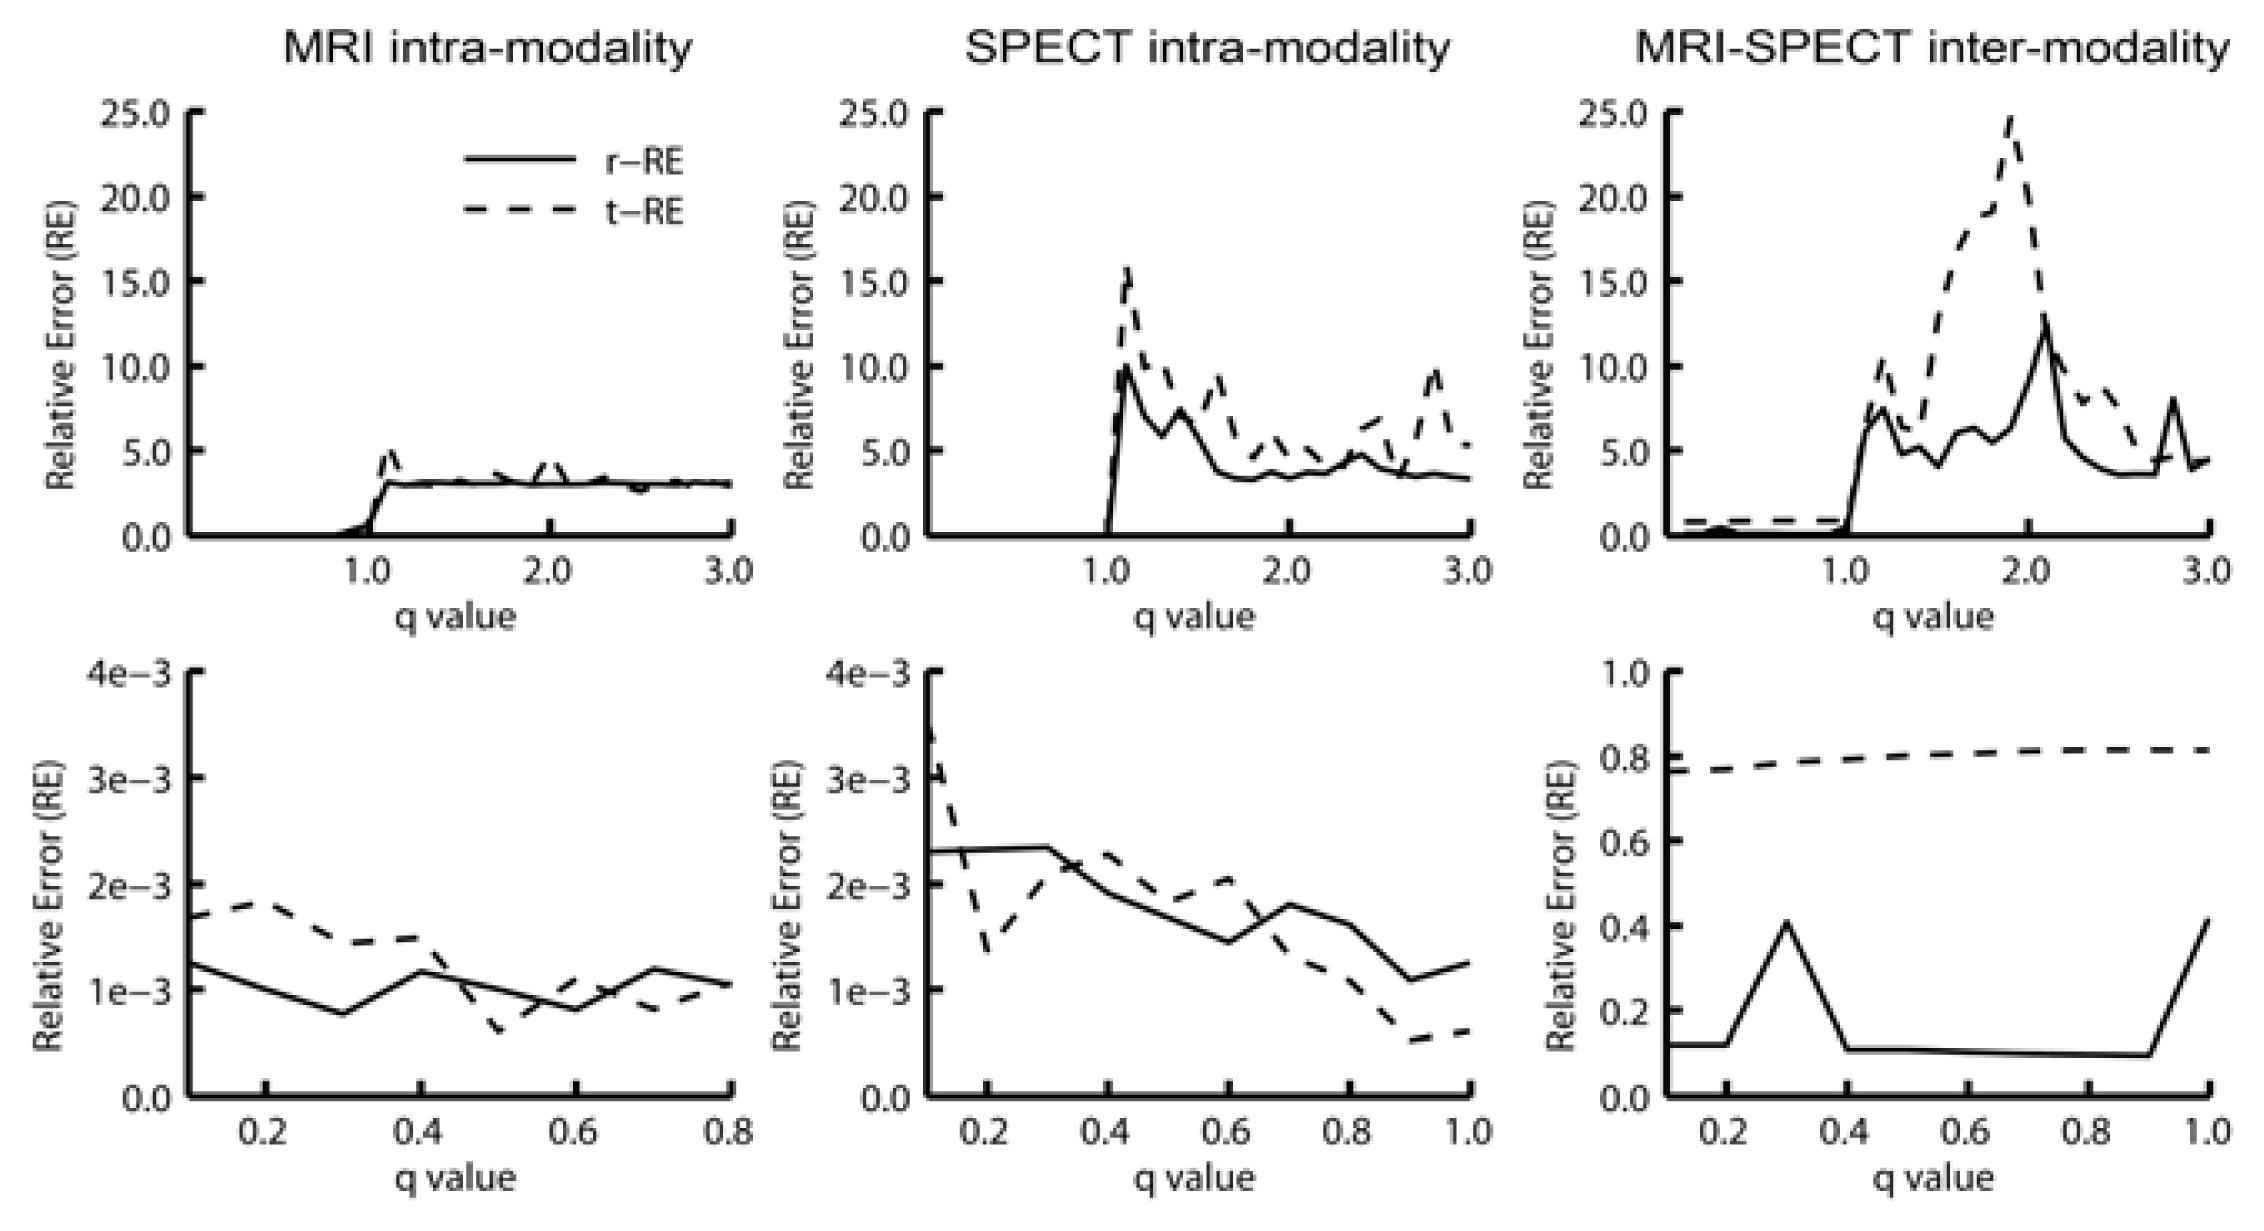
The analysis of the RE of the registrations using Mutual Information based on the Tsallis Entropy revealed that the use of the following q values (MITq) resulted in the best alignments: 0.1, 0.2, 0.3, 0.4, 0.5, 0.6, 0.7, 0.8, 0.9 and 0.999. For this reason, we selected these q values for the comparative analysis between the MIT and the traditional cost functions commonly available in SPM8. Furthermore, we found that q values higher than 1.0 resulted in large registration errors (r-RE and t-RE) leading to significant misalignments between simulators, as illustrated in Figure 3.
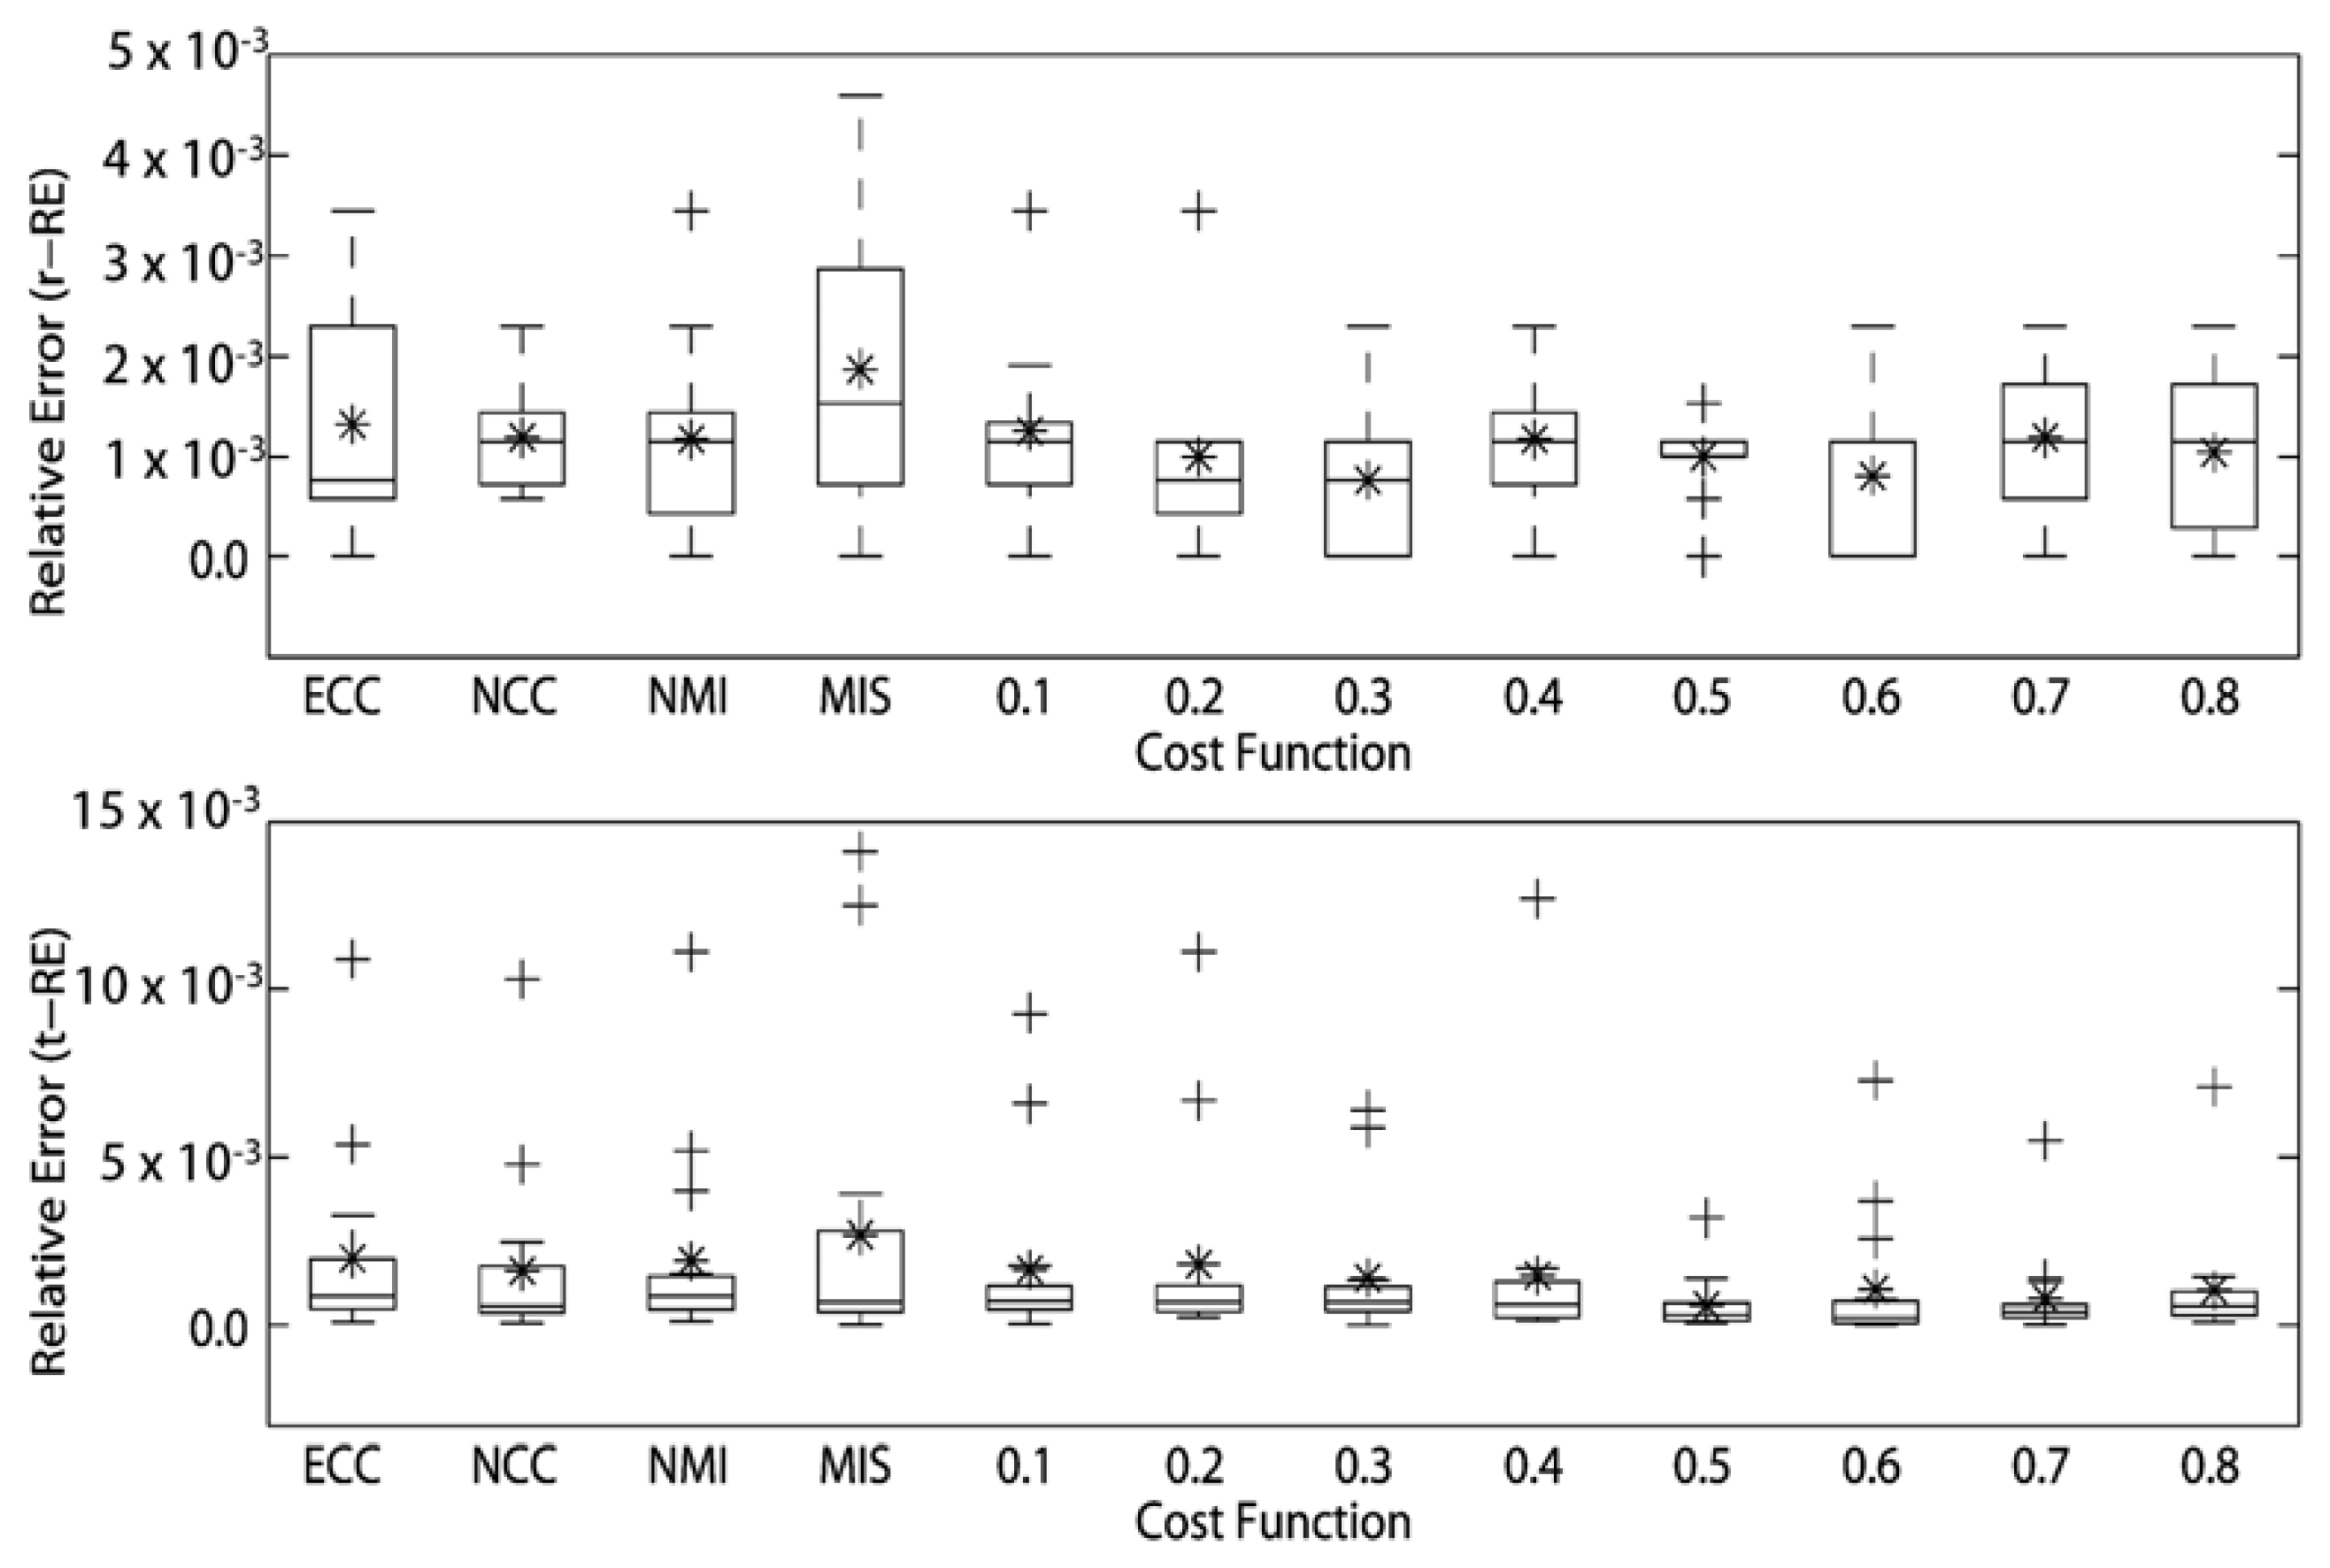
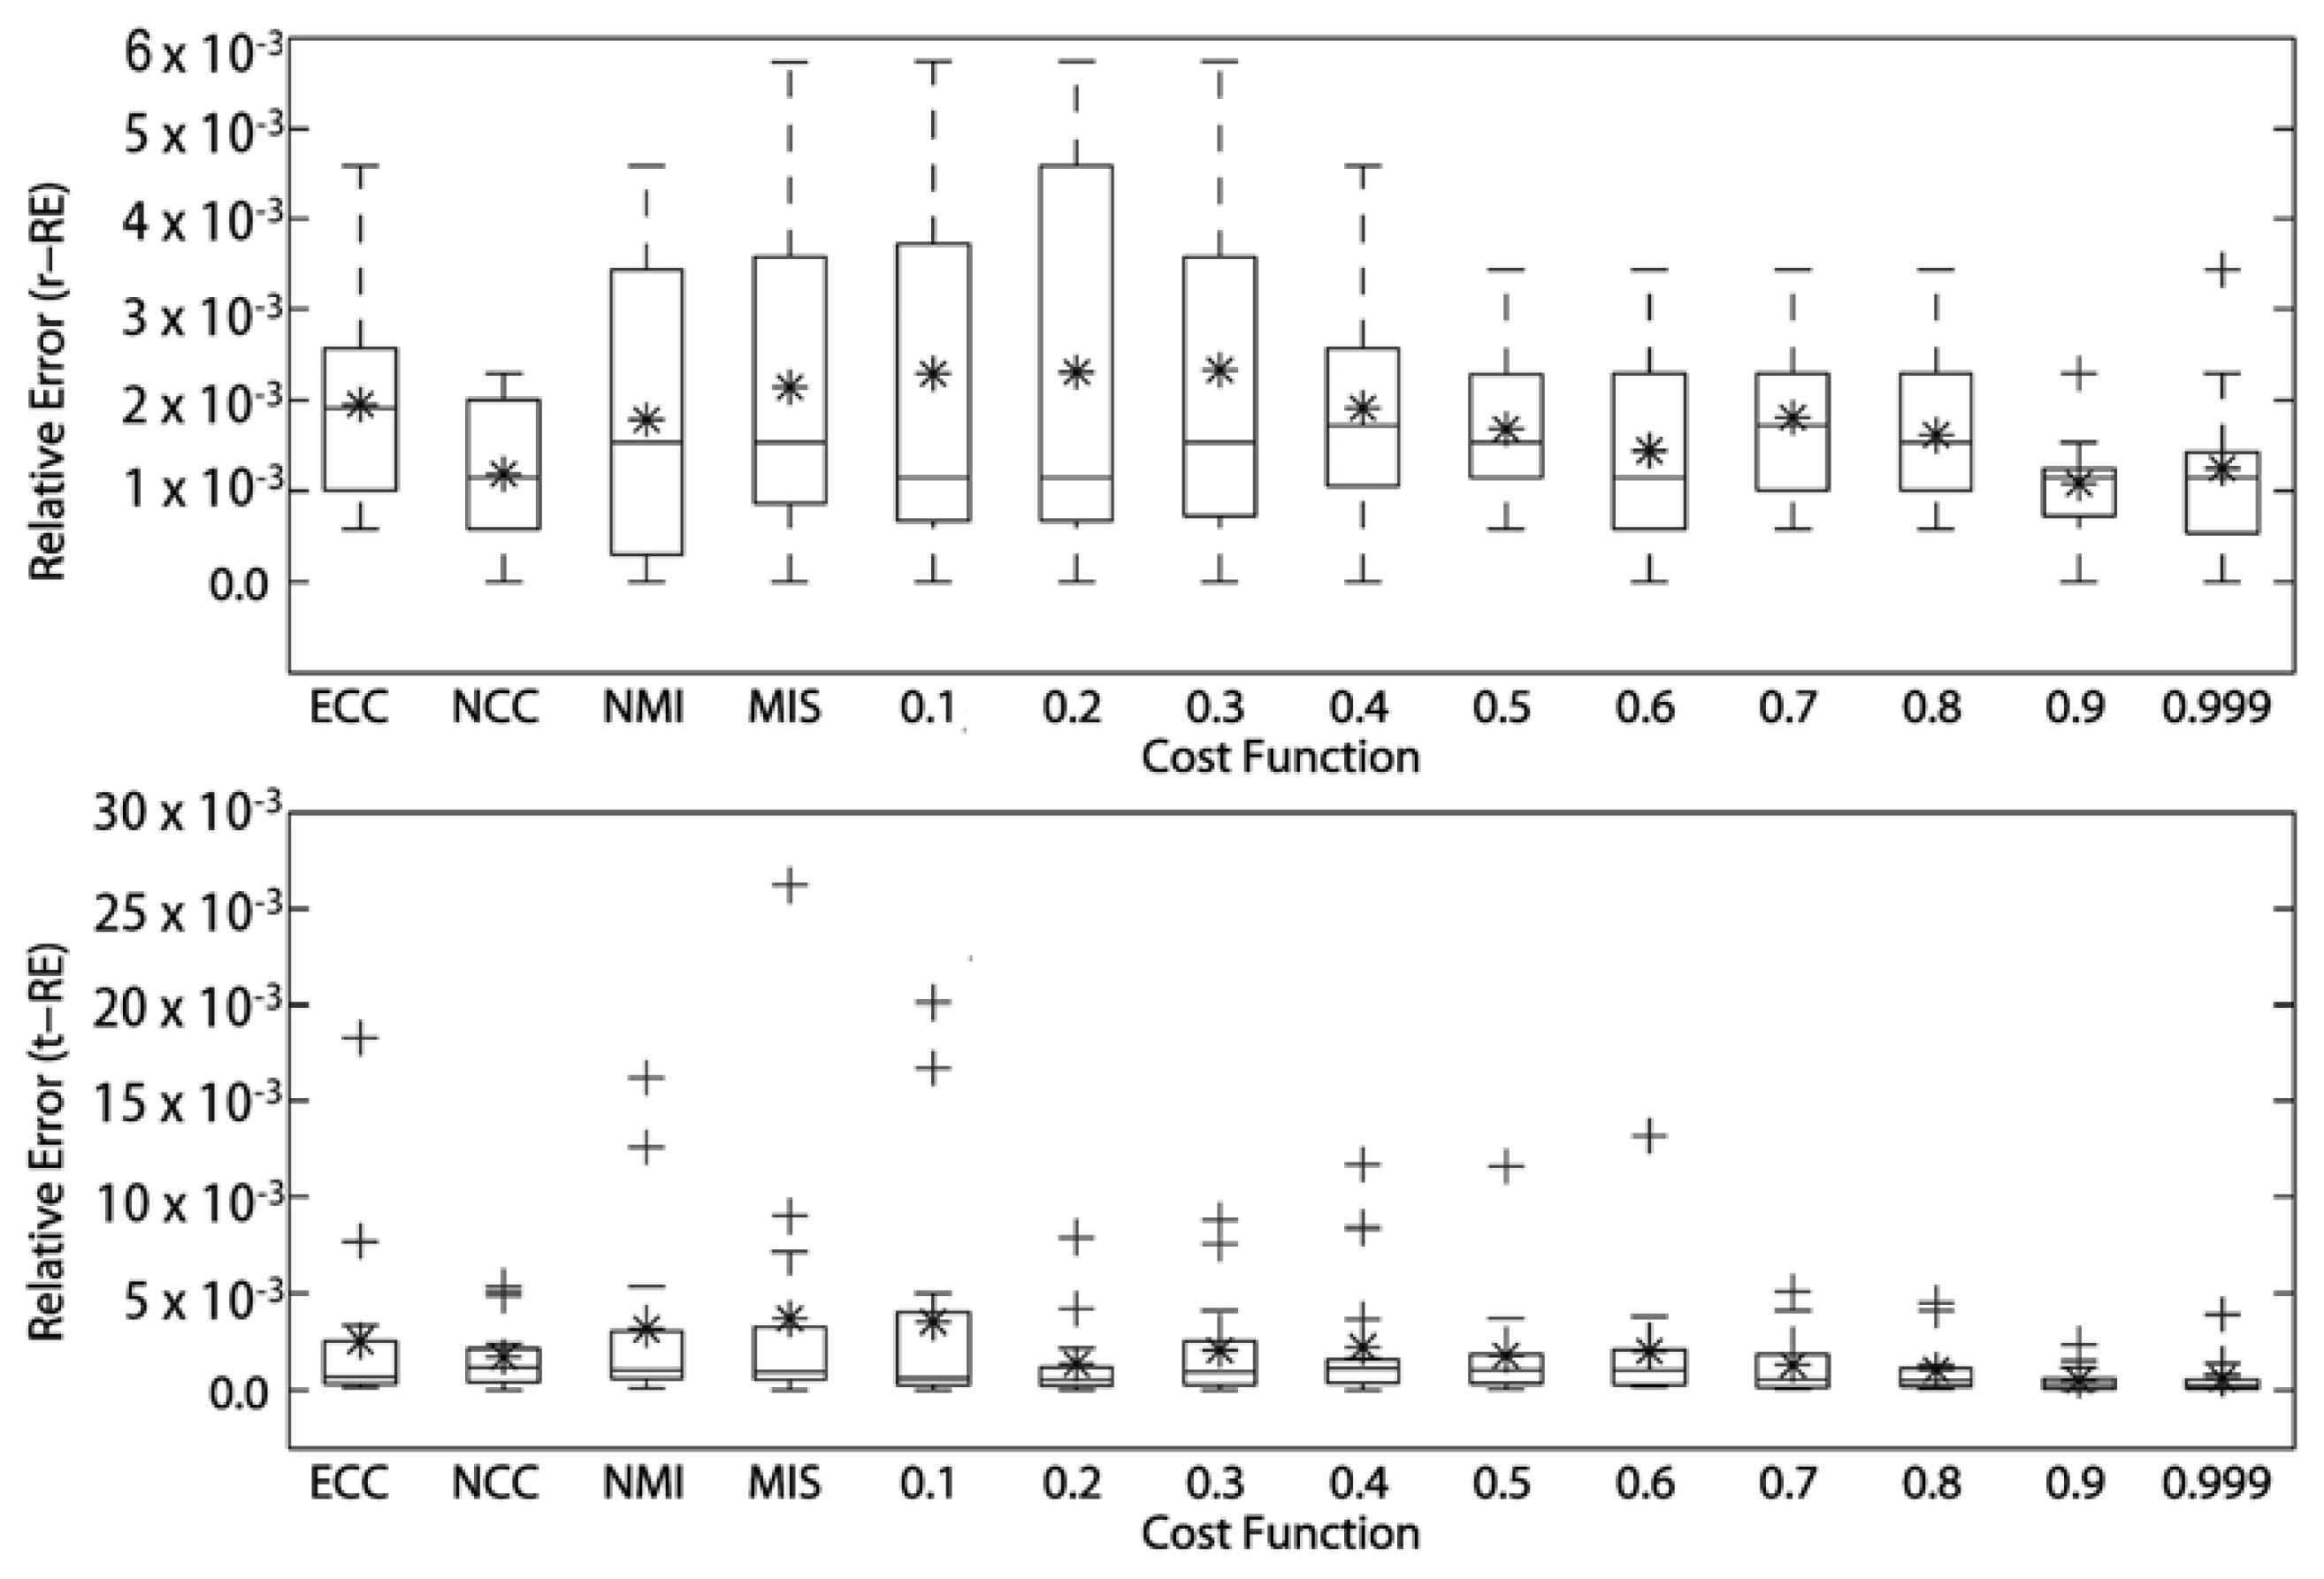
The RE of the rotational and translational simulations of the cost functions for intra-modality registrations of MRI volumes are presented in Figure 4. The MITq = 0.3 presented the best registration for rotational simulations (r-RE = 7.644290 × 10⁻⁴) and MITq = 0.5 was the best cost function for translational simulations showing t-RE = 6.00741 × 10⁻⁴. We also noticed that for rotational simulations, except NCC, all the others cost functions showed at least one registration with r-RE = 0. The two best cost functions here (MITq = 0.3 and MITq = 0.6) presented three perfect registrations (r-RE = 0). For translational simulations, all cost functions presented at least one registration with t-RE very close to 0, however, most part of them presented two or more superior outliers. MITq = 0.5 showed just one superior outlier.
Next, we analyzed the rotational and translational simulations of the remaining 13 cost functions, and ranked them in a decreasing order according to the relative errors values (See Table 1). The MIT cost functions presented lower r-RE and t-RE than other cost functions in majority of the intra-modality MRI registrations.
The RE of the rotational and translational simulations of the cost functions for intra-modality registrations of SPECT volumes are presented in Figure 5. The MITq = 0.9 presented the best registration for both rotational and translational transformations of SPECT volumes (r-RE = 1.082823 × 10⁻³ and t-RE = 5.2463 × 10 × 10−4); followed by the decreasing performance of the NCC, MITq = 0.999, MITq = 0.8, MITq = 0.5 and NMI for rotational transformations, and the decreasing performance of the MITq = 0.999, MITq = 0.8, MITq = 0.7, MITq = 0.2 and NCC for translational transformations (see Table 2). We also noticed that for rotational simulations, except ECC, MITq = 0.5, MITq = 0.7 and MITq = 0.8, all the others cost functions showed at least one registration with r-RE = 0. MITq = 0.9 presented one perfect registration (r-RE = 0) and also the lowest superior limit. For translational simulations all cost functions presented at least one registration with t-RE very close to 0, however, only the MITq = 0.9 exhibited one perfect registration (t-RE = 0). MITq = 0.9 showed the lowest superior outliers.
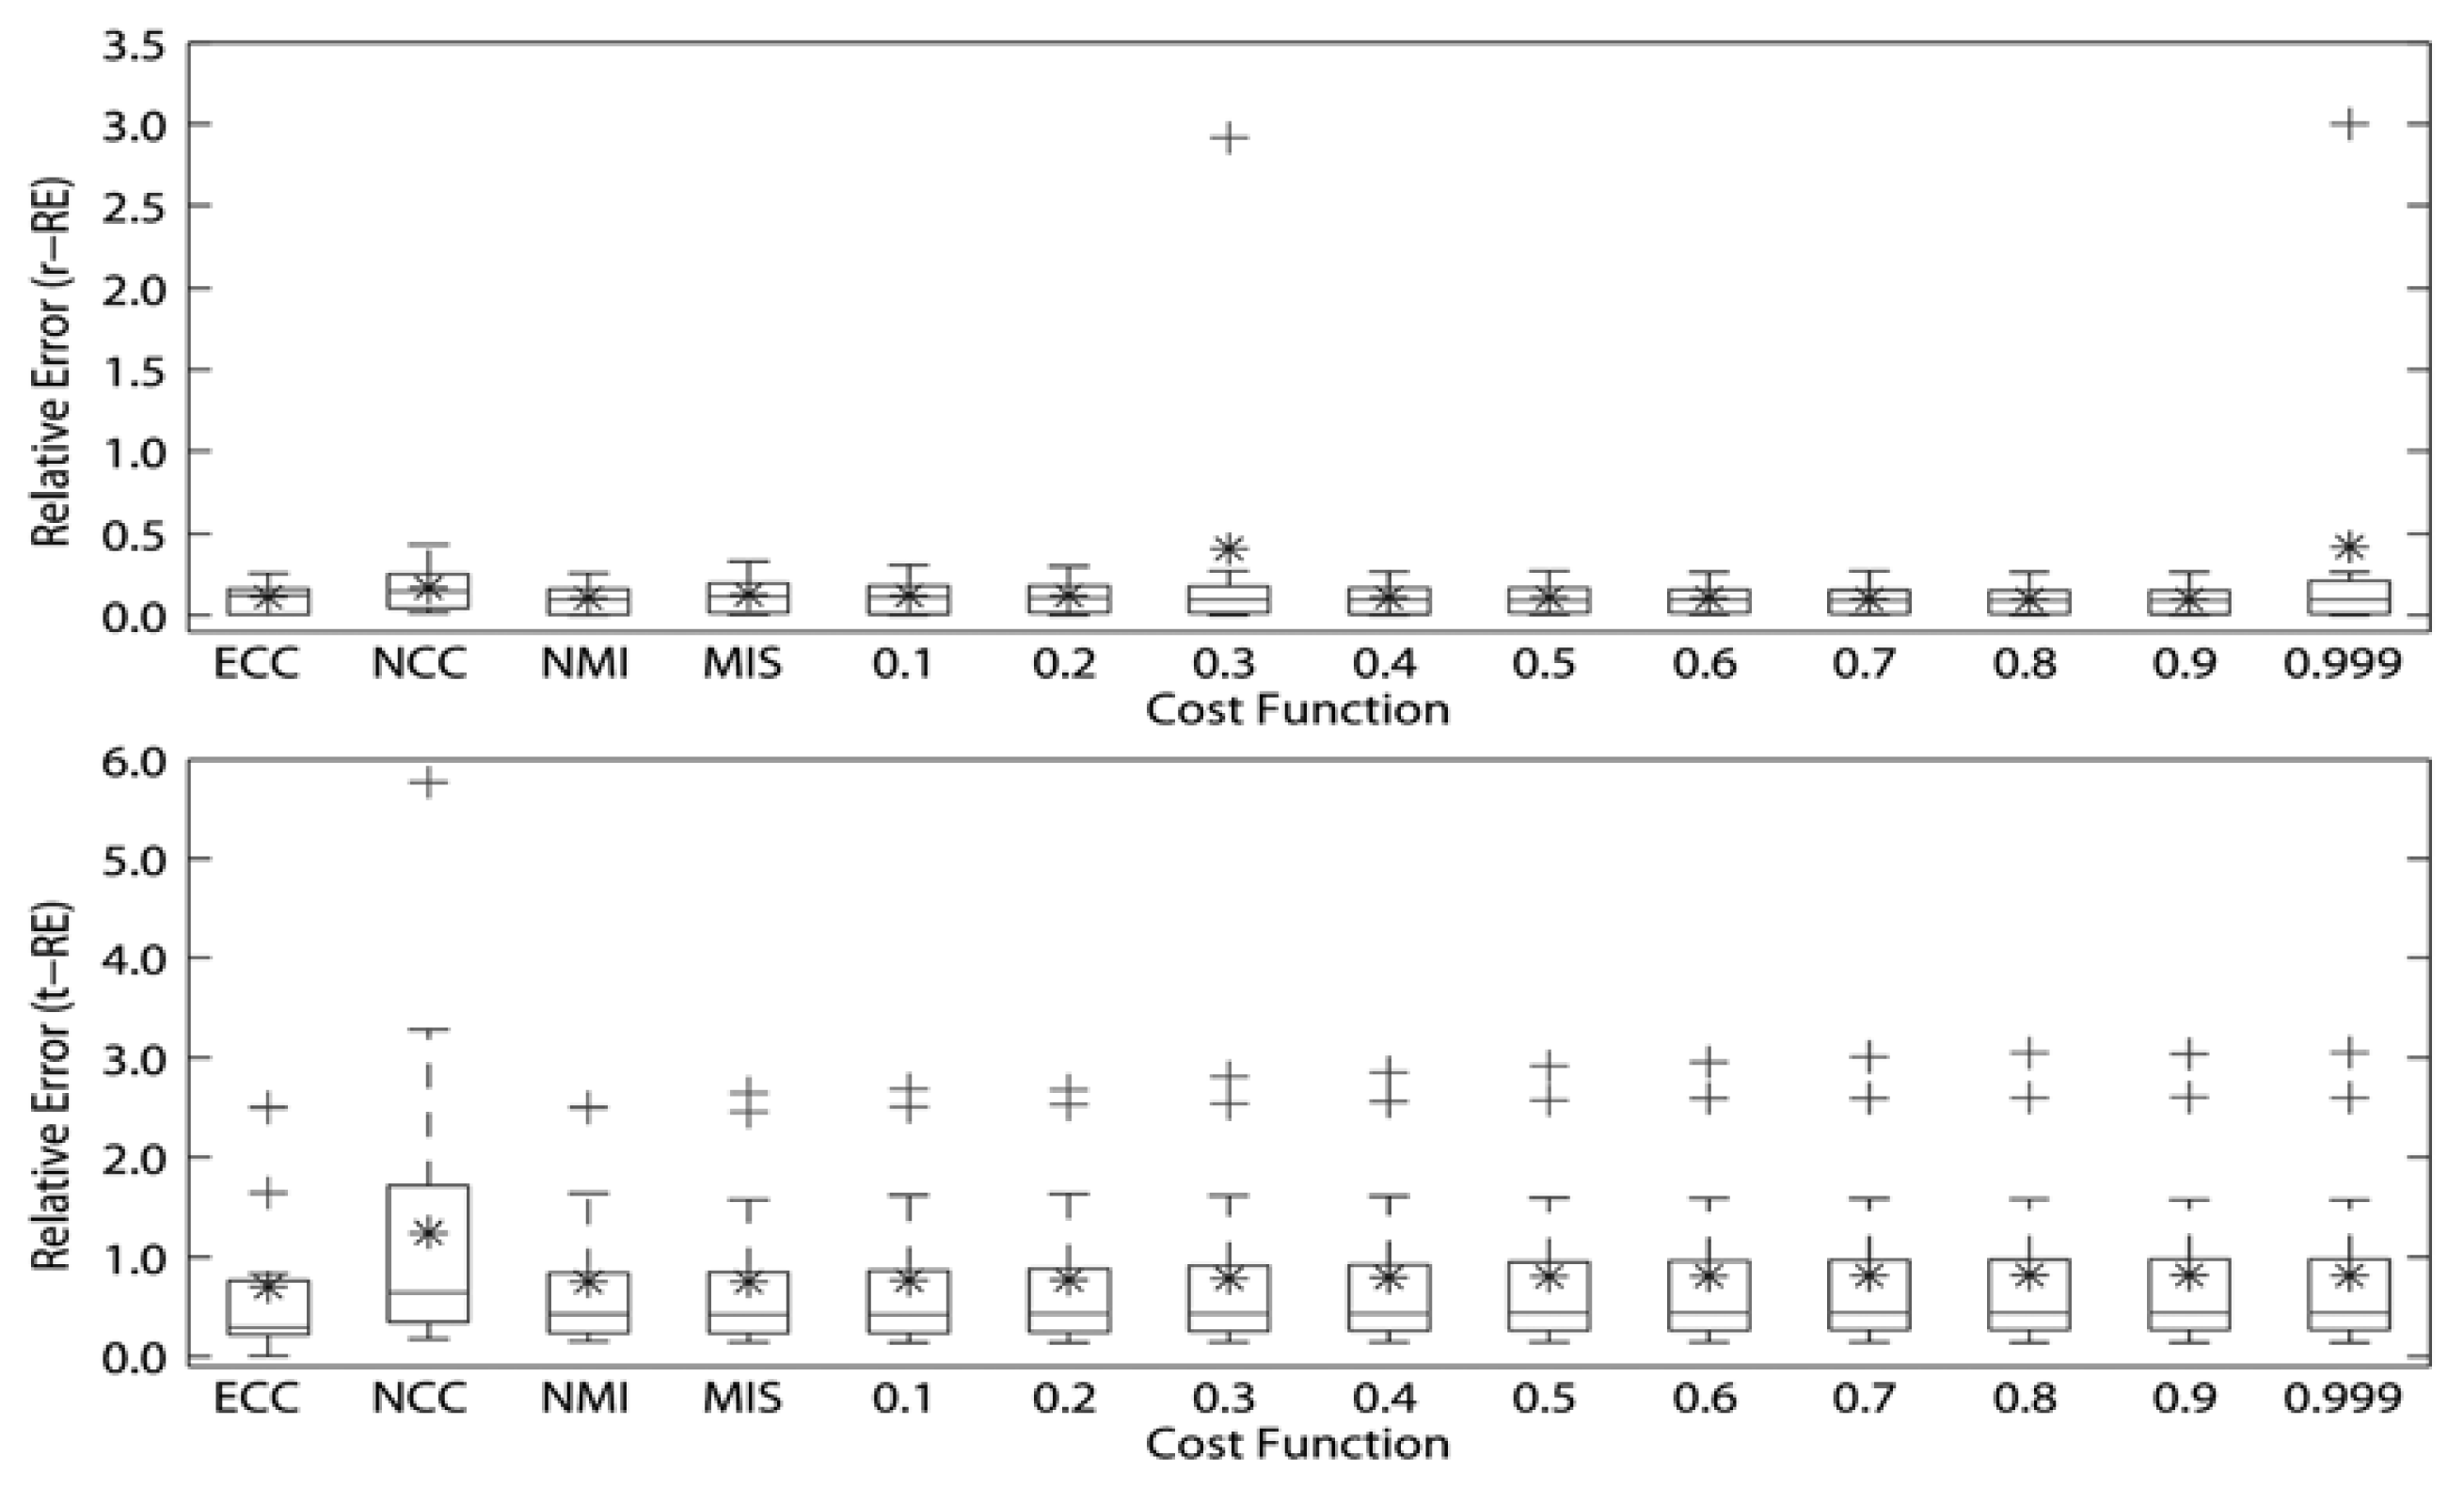
All RE of the rotational and translational simulations of the cost functions for inter-modality registrations of MRI and SPECT volumes are presented in Table 3 and Figure 6. The MITq = 0.9 presented the best registration for rotational transformations of the SPECT volumes to MRI (r-RE = 9.6244645 × 10⁻²), while the ECC presented the best registration for translational transformations (t-RE = 6.94952593 × 10⁻¹), followed by MIS (t-RE = 7.48891111 × 10⁻¹), NMI (t-RE = 7.50359259 × 10⁻¹) and MITq = 0.1 (t-RE = 7.6336963 × 10⁻¹). We noticed that for rotational simulations, only MITq = 0.9 and MITq = 0.999 presented r-RE = 0 (1 registration), however, MITq = 0.999 had a remarkable superior outlier (r-RE = 3) while MITq = 0.9 did not present any outliers. For translational simulations, MIT and traditional cost functions showed similar performance (the lowest mean t-RE was 6.94952593 × 10⁻¹ (ECC) and the highest mean t-RE was 8.1523925 × 10⁻¹ (MITq = 0.9)), however, ECC presented both the lowest superior limit and outliers.
4. Discussion
The comparative analysis between cost functions assessed in this study evidenced that the Mutual Information method (MIT) using the Tsallis Entropy presented better alignments in five of the six parameters assessed (i.e., MRI and SPECT intra-modality rotational and translational transformations registrations, and the SPECT—MRI inter-modality rotational registration). The MIT did not show the best alignment only for the SPECT—MRI inter-modality translational registration, which was achieved by the ECC.
In the first step, a pilot study was conducted with the objective to identify the range of MITq values that we could use to better investigate the comparison of the MIT with the traditional cost functions. We identified that the best range of q values was between 0.1 and 0.999. This finding was of great importance since MITq values higher than 1.0 resulted in significant misalignments. After this preliminary study, we then conducted specific investigations of both rotational and translational transformations applied for each of the intra or inter modality MRI and SPECT registrations.
For intra-modality MRI registration, the MIT using different q values presented higher performance than the traditional cost functions. These best q values were 0.3 for rotational and 0.5 for translational MRI registrations. Likewise, Wachowiak et al. [30] found that Tsallis Entropy in the Normalized Mutual Information (NMI) presented the best MRI intra-modality alignment, with the difference that the lower errors were obtained with a higher q value (q = 1.1). In their study, the authors used the Euclidean Distance and Root Mean Square (RMS) error to determine the Correctness Ratio (Cr), and results showed that Tsallis Entropy generally had better performance (in terms of producing fewer misregistration) than Shannon NMI for q value very close to 1 (q = 0.9, 1.1) [31]. They argue that the poor performance of low q values in their study might be due to the use of the Powell optimization method for registration. Nevertheless, we also used Powell’s optimization method for 3D-3D MRI registration, and we found that the q values near 1 has the worst result for both translational and rotational transformations in comparison to the low q values ranging from 0.3 to 0.5. We believe the difference between these two studies may result from the set of simulators used. Wachowiak et al. [32] used 2D-3D registrations while we used 3D-3D ones. Despite this difference, both studies suggest that Tsallis Entropy resulted in best MRI registration performance. This suggests that Tsallis Entropy is a promising method for intra-modality 3D registration, contradicting early studies which indicated the MIS as the best cost function for the intra-modality registrations. Currently, the SPM8 recommends using MIS, NMI and ECC as possible cost functions for inter-modality registrations. For intra-modality registrations, SPM8 allows to use the NCC as an alternative technique, in addition to the aforementioned cost functions [33–36].
Martin et al. [24] showed huge improvements using Tsallis entropy in 2D images of MRI T1, MRI T2 and CT. Their algorithm achieved up to seven times faster convergence and four times more precise registration using Tsallis entropy instead of the classic form of entropy using Shannon. The best results were achieved using q = 0.7, which differs from our results and can be explained by the differences in the image dimensionalities, optimization technique, and registration evaluation method.
Tedeschi et al. [25] used Tsallis entropy in fMRI analysis and found that the optimization of q values restricts the range to (−1.0, 0.0) and (0.5, 1.0), which partially is coincident with our results; their optimum results were found for q = 0.7 and −0.5.
For intra-modality SPECT registration, the MIT q values near 1.0 presented higher performance than the traditional cost functions. Interestingly, q = 0.9 resulted in the best performance for both rotational and translational SPECT registrations. As we previously mentioned, SPM8 also recommends MIS, NMI and ECC for both inter and intra-modality registrations. For SPECT and PET images, NMI has been reported to be more stable and robust than MIS for intra-modality SPECT [37] and PET registration [14]. On the other hand, studies have suggested either NCC [22] or other less commonly used algorithms [38] specifically for intra-modality SPECT registrations. Traditionally, correlation coefficients like NCC have shown good performance for intra-modality registrations [39], similar to the findings of our study.
Unfortunately, so far no investigation has evaluated the use of Tsallis Entropy in the SPECT volume registration. We are very interested in finding out what future studies could be carried out using Tsallis Entropy for either SPECT or PET intra-modality registration in order to evaluate its performance in comparison to the traditional cost functions.
For inter-modality MRI and SPECT registrations, both the Tsallis Entropy using q = 0.9 and ECC presented the highest performance for rotational and translational transformations, respectively, when compared to the other traditional cost functions. It was interesting to note that ECC showed better registration performance than MIS, NMI and MITq for the inter-modality registration. In order to verify the accuracy of this result, we repeated our experiment several times and we obtained the same result, i.e., for MRI and SPECT inter-modality registrations, ECC presented smaller translational relative errors than MIS and NMI. In fact, few studies have used ECC for this specific application [40], and the SPM8 also recommends the ECC as a cost function for multi-modality registration. Nonetheless, even though the difference between the relative errors of the translation transformations are small, using ECC and MIS or even MITq = 0.9, for instance, we believe that future studies should be carried out in order to confirm or not if ECC is actually the best cost function for inter-modality translational registrations.
This discussion is important because MIS and NMI have been commonly recommended for inter-modality neuroimaging registrations [41–43]. In comparative studies [44,45], as many as 16 retrospective registration methods from 12 research groups worldwide were evaluated with respect to the MIS and NMI performance in rigid multimodal brain images registration. Ground truth was obtained using bone-implanted skull markers [46]. Their results showed that the two methods that were based on the mutual information outperformed all other methods and reached approximately the same order of accuracy as the gold standard. These comparative studies suggested that the mutual information registration method is suitable for both monomodal and multimodal image registration [14]. It is worth noting that NMI is based on MIS and its performance is similar to MIS to some extent, but with some important differences. NMI is more stable and robust than MIS for both intra- and inter-modality registrations because it is almost an overlap invariant [47]. And this is quite remarkable for PET registrations where MIS often fails. In this setting, and in our study, the Tsallis Entropy presented better alignments than MIS and NMI based on the relative errors. Further studies shall be carried out to evaluate the stability and robustness of the Tsallis Entropy for intra- and inter-modality registrations based on overlapping invariance.
Actually, Tsallis entropy is not a novelty for general medical image registration purposes. Few previous studies had already described the applicability of this non-additive entropy in different image modalities (ultrasound, histological, CT and MRI). However these were quite limited once they were based on single pair of images [25,26]. No extensive analyzes were performed until now.
As strengths of our study, we concentrated the experiments only in MRI and SPECT images, performing 1008 registrations in 48 simulators (336 procedures per registration modality) which provided a considerable number of image processing. Additionally, this is the first study to propose the use of the Tsallis entropy for intra-modality SPECT registration and inter-modality MRI/SPECT registration.
As limitations, our study exhibited a lack of an annotated “ground truth” (landmarks and or labels) on the images, and evaluated a relative small sample of scans, even though we have exhaustively tested the performance of the Tsallis entropy. Considering that fixed landmarks are related to invasive procedures and external landmarks (for example, skin landmarks) are not reliable, here we use well-known geometric transformation as ground truth.
Despite of the limitations described, this study launches a new applicability of the Tsallis Entropy for SPECT registration and its potential contribution for several research and clinical applications. Further studies should be addressed to test this performance of the Tsallis Entropy in real clinical contexts.
Regarding the computation time, all the registrations were done from 100 to 250 s. As expected, intra-modality registrations were faster than the inter-modalities and generally simulators with smaller transformations were more robust as well, however we did not find strong correlations (Pearson Correlation) which could demonstrate relevant improvement in processing time among the cost functions which provided the lowest errors. In the other hand, those cost functions which presented the highest errors generally were slower, since they were not able to converge properly, sometimes they used more iterations looking for the suitable solution, but unsuccessfully.
Since the processing time among the best cost functions were quite similar, it was not considered an important variable in this study, which the main focus was evaluate the registration error.
5. Conclusions
We concluded that the Tsallis Entropy showed the highest performance for almost all transformations in the intra and inter-modality MRI and SPECT images registration for the SPM8, except for the translational transformation of the inter-modality MRI and SPECT registration, in which the ECC performed better. If confirmed by further studies, this finding may give rise to many other applications of the Tsallis Entropy for neuroimaging registrations, either for clinical or research purposes. We believe that studies should be addressed to confirm the high performance of the Tsallis Entropy for SPECT and MRI registration or for other neuroimaging modalities like PET and X-Ray Computed Tomography techniques. Additionally, further studies must be carried out to confirm the stability and robustness of the Tsallis Entropy for multi-modality registration, investigating the overlapping invariance.
Acknowledgments
We gratefully acknowledge the very helpful participation of physicians, colleagues, and technical staff of the Nuclear Medicine Division, Computation and Math Department and the Image Science and Medical Physics Center. The authors also gratefully acknowledge Professor Anthony Finkelstein (Department of Computer Science, University College of London—UCL) for his very helpful comments. Funding Support: (a) “São Paulo Research Foundation”—FAPESP, Grants# 2008/03369-7; 2010/10979-6 and 2013/08240-0 (Henrique Tomaz Amaral-Silva); (b) “Foundation of Support to Teaching, Research and Assistance“—(FAEPA) of the Medical Center, Ribeirão Preto Medical School, University of São Paulo—USP, SP, Brazil (Lauro Wichert-Ana and Paulo Mazzoncini de Azevedo-Marques); (c) “The National Council for Scientific and Technological Development” (CNPq), Ministry of Science and Technology, Brazilian Federal Government, Grant# 304255/2010-0 (Paulo Mazzoncini de Azevedo-Marques) and Grant# 305129/2008-2 (Lauro Wichert-Ana); (d) “FINEP/MCT/INFRA—Research and Projects Financing”, Ministry of Science and Technology, Brazilian Federal Government, Grant# 01.09.0117.00, Reference# 0199/08; (e) “Provost’s Office for Research, University of São Paulo—USP”, Núcleo de Apoio à Pesquisa em Neurociência Aplicada–NAPNA–USP, Grant# 2011.1.9333.1.3 (Lauro Wichert-Ana). We confirm that we have read the Journal’s position on issues involved in ethical publication and affirm that this report has the approval of our institutional ethics committee (Process HCRP n° 9241/2009).
Conflicts of Interest
The authors declare no conflict of interest.
- Author ContributionsThis research was designed by Lauro Wichert-Ana, Luiz Otávio Murta and Paulo Azevedo-Marques; the research was performed by Henrique Amaral-Silva and Emerson Itikawa; the data analysis was performed by Henrique Amaral-Silva and Emerson Itikawa; and the paper was written by Henrique Amaral-Silva, Lauro Wichert-Ana, Larissa Romualdo-Suzuki and Geraldo Filho Bussato.
References
- Doi, K.; Huang, H.K. Computer-Aided Diagnosis (CAD) and Image-Guide Decision Support. Comput. Med. Imaging Graph 2007, 31, 195–197. [Google Scholar]
- Azevedo-Marques, P.M.; Oliveira, M.C.; Oliveira, L.F.; Rodrigues, L.C.; Ribeiro, L.T.; Caetano, G.F.; Araújo, D.; Wichert-Ana, L. Free-software in scientific research: NeuroCAD—An open-source neurology computer-aided toolkit. Braz. J. Biomed. Eng 2003, 19, 69–75. [Google Scholar]
- Hajnal, J.V.; Hill, D.L.G.; Hawkes, D.J. Medical Image Registration; the Biomedical Engineering Series; CRC Press: Boca Raton, FL, USA, 2008. [Google Scholar]
- Hill, D.L.G.; Batchelor, P.G.; Holden, M.; Hawkes, D.J. Medical Image Registration. Phys. Med. Biol 2001, 46, R1–R45. [Google Scholar]
- Ashburner, J.; Friston, K.J. Rigid Body Registration. In Human Brain Function; Academic Press: Waltham, MA, USA, 2004; pp. 1–18. [Google Scholar]
- Gianfranco, L.; Dominietto, M.; Manfredda, I.; Mones, E.; Carríero, A.; Inglese, E.; Krengli, M.; Brambilla, M. Acceptance Test of a Commercially Available Software for Automatic Image Registration of Computed Tomography (CT), Magnetic Resonance Imaging (MRI) and 99TmTc-methoxyisobutylisonitrile (MIBI) Single-Photon Emission Computed Tomography (SPECT) Brain Images. J. Digit. Imaging 2008, 21, 329–337. [Google Scholar]
- McNally, K.A.; Paige, A.L.; Varghese, G.; Zhang, H.; Novotny, S.S., Jr.; Spencer, S.S.; Zubal, G.; Blumenfeld, H. Localizing Value of Ictal-Interictal SPECT Analyzed by SPM (ISAS). Epilepsia 2005, 46, 1450–1464. [Google Scholar]
- Maintz, J.B.A.; Viergever, M.A. A Survey of Medical Image Registration. Med. Image Anal 1998, 2, 1–37. [Google Scholar]
- Oliveira, F.P.M.; Faria, D.B.; Costa, D.C.; Tavares, J.M.R.S. A Robust Computational Solution for Automated Quantification of a Specific Binding Ratio Based on [123I]FP-CIT SPECT Images. Q. J. Nucl. Med. Mol. Imaging 2014, 58, 74–84. [Google Scholar]
- Oliveira, F.P.M.; Tavares, J.M.R.S. Medical Image Registration: A Review. Comput. Methods Biomech. Biomed. Eng 2004, 17, 73–93. [Google Scholar]
- Shannon, C.E. A Mathematical Theory of Communication. Bell Syst. Tech. J 1948, 27, 379–423. [Google Scholar]
- Collignon, A.; Maes, F.; Delaere, D.; Vandermeulen, D.; Suetens, P.; Marchal, G. Automated Multi-modality Image Registration Based on Information Theory. Proceedings of the XIVth International Conference on Information Processing in Medical Imaging, Computational Imaging and Vision, Ile de Berder, France, 26–30 June 1995; Springer: New York, NY, USA, 1995; pp. 263–274. [Google Scholar]
- Viola, P.; Wells, W.M., III. Alignment by Maximization of Mutual Information. Int. J. Comput. Vis 1997, 24, 137–154. [Google Scholar]
- Gao, Z.; Gu, B.; Lin, J. Monomodal Image Registration Using Mutual Information Based Methods. Image Vis. Comput 2008, 26, 164–173. [Google Scholar]
- Pluim, J.P.W.; Maintz, J.B.; Viergever, M.A. Interpolation Arteacts in Mutual Information-Based Image Registration. Comput. Vis. Image Underst 2000, 77, 211–232. [Google Scholar]
- Lopes, R.; Betrouni, N. Fractal and Multifractal Analysis: A Review. Med. Image Anal 2009, 13, 634–649. [Google Scholar]
- Tsallis, C. Possible generalization of Boltzmann-Gibbs statistics. J. Stat. Phys 1988, 52, 479–487. [Google Scholar]
- Dos Santos, R.J.V. Generalization of Shannon’s Theorem of Tsallis Entropy. J. Math. Phys 1997, 38. [Google Scholar] [CrossRef]
- Tsekouras, G.A.; Tsallis, C. Generalized Entropy Arising a Distribution of q Indices. Phys. Rev 2005, 71, 046144. [Google Scholar]
- Carvalho, A.R.F.; Tavares, J.M.R.S.; Principe, J.C. A Novel Nonparametric Distance Estimator for Densities with Error Bounds. Entropy 2013, 15, 1609–1623. [Google Scholar]
- Albuquerque, M.P.; Esquef, I.A.; Mello, A.R.G. Image Thresholding Using Tsallis Entropy. Pattern Recognit. Lett 2004, 25, 1059–1065. [Google Scholar]
- Cvejic, N.; Canagarajah, C.N.; Bull, D.R. Image Fusion Metric Based on Mutual Information and Tsallis Entropy. Electron. Lett 2006, 42, 626–627. [Google Scholar]
- Diniz, P.R.B.; Murta, L.O., Junior; Brum, D.G.; Araújo, D.B.; Santos, A.C. Brain Tissue Segmentation Using q-entropy in Multiple Sclerosis Magnetic Resonance Images. Braz. J. Med. Biol. Res 2010, 43, 77–84. [Google Scholar]
- Martin, S.; Morison, G.; Nailon, W.; Durrani, T. Fast and Accurate Image Registration Using Tsallis Entropy, and Simultaneous Perturbation of Stochastic Approximation. Electron. Lett 2004, 40, 595–597. [Google Scholar]
- Tedeschi, W.; Muller, H.P.; de Araujo, D.B.; Santos, A.C.; Neves, U.P.C.; Erné, S.N.; Baffa, O. Generalized Mutual Information fMRI Analysis: A Study of the Tsallis q Parameter. Physica A 2004, 344, 705–711. [Google Scholar]
- Goshtasby, A.A. Image Registration: Principles, Tools, and Methods; Springer: New York, NY, USA, 2012. [Google Scholar]
- Crippa, J.A.S.; Zuardi, A,W.; Garrido, G.E.; Wichert-Ana, L.; Guarnieri, R.; Ferrari, L.; Azevedo-Marques, P.M.; Hallak, J.E.C.; McGuire, P.K.; Busatto, G.F. Effects of Cannabidiol (CBD) on Regional Cerebral Blood Flow. Neuropsychopharmacology 2004, 29, 417–426. [Google Scholar]
- Rorden, C. MRIcro Software. Available online: http://www.mricro.com accessed on 31 January 2014.
- SPM8 Package, Available online: http://www.fil.ion.ucl.ac.uk/spm/ accessed on 31 January 2014.
- Wachowiak, M.P.; Smolíková, R.; Peters, T.M. Multiresolution Biomedical Image Registration Using Generalized Information Measures. Proceedings of the Medical Image Computing and Computer-Assisted Intervention (MICCAI), Montreal, QC, Canada, 15–18 November 2003; pp. 846–853.
- Wachowiak, M.P.; Smolíková, R.; Tourassi, G.D.; Elmaghraby, A.S. Similarity Metrics Based on Nonadditive Entropies for 2D-3D Multimodal Biomedical Image Registration. Proceedings of the SPIE of Medical Imaging, San Diego, CA, USA, 16 May 2003; SPIE: Bellingham, WA, USA, 2003; pp. 1090–1100. [Google Scholar]
- Wachowiak, M.P.; Smolíková, R.; Zurada, J.M.; Elmaghraby, A.S. An Approach to Multimodal Biomedical Image Registration Utilizing Particle Swarm Optimization. IEEE Trans. Evol. Comput 2004, 8, 289–301. [Google Scholar]
- Maintz, J.B.A.; Beekman, F.J.; van de Bruin, W.; del Elsen, P.A.; van Rijk, P.P.; Viergever, M.A. Automatic Registration and Intensity Scaling of SPECT brain images. J. Nucl. Med 1996, 37 Suppl 5, 213. [Google Scholar]
- Maes, F.; Collignon, A.; Vandermeulen, D.; Marchal, G.; Suetens, P. Multimodality Image Registration by Maximization of Mutual Information. IEEE Trans. Med. Imaging 1997, 16, 187–198. [Google Scholar]
- Viola, P.A. Alignment by Maximization of Mutual Information. Ph.D. Thesis, Massachusetts Institute of Technology, Cambridge, MA, USA, 1995. [Google Scholar]
- Wells, W.M., III; Viola, P.; Atsumi, H.; Nakajima, S.; Kikinis, R. Multi-Modal Volume Registration by Maximization of Mutual Information. Med. Image Anal 1996, 1, 35–51. [Google Scholar]
- Radau, E.P.; Slomka, P.J.; Julin, P.; Svensson, L.; Wahlund, L.O. Evaluation of Linear Registration Algorithms for Brain SPECT and the Error Due to Hypoperfusion lesions. Med. Phys 2001, 28, 1660–1668. [Google Scholar]
- Pavia, J.; Ros, D.; Catafau, A.M.; Lomeña, F.J.; Huguet, M.; Setoain, J. Three-dimensional Realignment of Activation Brain Single-photon Emission Tomographic Studies. Eur. J. Nucl. Med 1994, 21, 1298–1302. [Google Scholar]
- Lemieux, L.; Jagoe, R. Effect of Fiducial Marker Localization on Stereotactic Target Coordinate Calculation in CT Slices and Radiographs. Phys. Med. Biol 1994, 39, 1915–1928. [Google Scholar]
- Itou, T.; Shinohara, H.; Sakaguchi, K.; Hashimoto, T.; Yokoi, T.; Souma, T. Multimodal Image Registration Using IECC as the Similarity Measure. Med. Phys 2011, 38, 1103–1115. [Google Scholar]
- Gupta, S.; Ramesh, K.P.; Blash, E.P. Mutual Information Metric Evaluation for PET/MRI Image Fusion. Proceedings of the IEEE National Aerospace and Electronics Conference (NAECON), Dayton, OH, USA, 16–18 July 2008; pp. 305–311.
- Cahill, G.C. Normalized Measure of Mutual Information with General Definitions of Entropy for Multimodal Image Registration. Proceeding of the 4th International Workshop, WBIR, Lübeck, Germany, 11–13 July 2010; LNCS 6204. pp. 258–268.
- Yokoi, T.; Soma, T.; Shinohara, H.; Matsuda, H. Accuracy and Reproducibility of Co-registration Techniques Based on Mutual Information and Normalized Mutual Information for MRI and SPECT Brain Images. Ann. Nucl. Med 2004, 18, 659–667. [Google Scholar]
- West, J.W.; Fitzpatrick, J.M.; Wang, M.Y.; Dawant, B.M.; Maurer, C.R.; Kessler, R.M.; Maciunas, R.J. Retrospective Intermodality registration techniques for images of the head: Surfaced-based versus volume-based. IEEE Trans. Med. Imaging 1999, 18, 144–150. [Google Scholar]
- West, J.W.; Fitzpatrick, J.M.; Wang, M.Y.; Dawant, B.M.; Maurer, C.R.; Kessler, R.M.; Maciunas, R.J.; Barillot, C.; Lemoine, D.; Collignon, A.; et al. Comparison and Evaluation of Retrospective Intermodality Brain Image Registration Techniques. J. Comput. Assist. Tomogr 1997, 21, 554–566. [Google Scholar]
- Maurer, C.R.; Fitzpatrick, J.M.; Wang, M.Y.; Galloway, R.L.; Maciunas, R.J.; Allen, G.S. Registration of head volume images using implantable fiducial markers. IEEE Trans. Med. Imaging 1997, 16, 447–462. [Google Scholar]
- Studholme, C.; Hill, D.L.G.; Hawkes, D.J. An Overlap Invariant Entropy Measure of 3D Medical Image Alignment. Pattern Recognit 1999, 32, 71–86. [Google Scholar]


| Rotation | Translation | ||
|---|---|---|---|
| Cost function | r-RE | Cost function | t-RE |
| MITq = 0.3 | 7.6442900 × 10⁻⁴ | MITq = 0.5 | 6.00741 × 10⁻⁴ |
| MITq = 0.6 | 8.0681300 × 10⁻⁴ | MITq = 0.7 | 8.10741 × 10⁻⁴ |
| MITq = 0.5 | 9.9785900 × 10⁻⁴ | MITq = 0.8 | 10.58704 × 10⁻⁴ |
| MITq = 0.2 | 9.9790800 × 10⁻⁴ | MITq = 0.6 | 10.95370 × 10⁻⁴ |
| MITq = 0.8 | 10.4043800 × 10⁻⁴ | MITq = 0.3 | 14.32407 × 10⁻⁴ |
| MITq = 0.4 | 11.6778600 × 10⁻⁴ | MITq = 0.4 | 14.90370 × 10⁻⁴ |
| NMI | 11.6785900 × 10⁻⁴ | NCC | 16.41481 × 10⁻⁴ |
| MITq = 0.7 | 11.8895400 × 10⁻⁴ | MITq = 0.1 | 16.78519 × 10⁻⁴ |
| NCC | 11.8900300 × 10⁻⁴ | MITq = 0.9 | 17.49815 × 10⁻⁴ |
| MITq = 0.1 | 12.5270100 × 10⁻⁴ | MITq = 0.2 | 18.33704 × 10⁻⁴ |
| ECC | 13.1649700 × 10⁻⁴ | NMI | 19.38519 × 10⁻⁴ |
| MIS | 18.6856500 × 10⁻⁴ | ECC | 20.01852 × 10⁻⁴ |
| MITq = 0.9 | 2486.90042 × 10−4 | MIS | 26.97407 × 10⁻⁴ |
| MITq = 0.999 | 5621.92037 × 10−4 | MITq = 0.999 | 889.99815 × 10⁻⁴ |
Abbreviations: r-RE = rotational Relative Error; t-RE = translational Relative Error; ECC = Entropy Correlation Coefficient; MIS: Mutual Information using Shannon Entropy; MIT = different q values for Mutual Information using Tsallis Entropy; NCC = Normalized Cross Correlation and NMI = Normalized Mutual Information.
| Rotation | Translation | ||
|---|---|---|---|
| Cost function | r-RE | Cost function | t-RE |
| MITq = 0.9 | 1.082823 × 10⁻³ | MITq = 0.9 | 5.2463 × 10⁻⁴ |
| NCC | 1.189027 × 10⁻³ | MITq = 0.999 | 6.03333 × 10⁻⁴ |
| MITq = 0.999 | 1.25275 × 10⁻³ | MITq = 0.8 | 10.80741 × 10⁻⁴ |
| MITq = 0.8 | 1.613675 × 10⁻³ | MITq = 0.7 | 13.16111 × 10⁻⁴ |
| MITq = 0.5 | 1.677276 × 10⁻³ | MITq = 0.2 | 13.67407 × 10⁻⁴ |
| NMI | 1.783675 × 10⁻³ | NCC | 17.34444 × 10⁻⁴ |
| MITq = 0.7 | 1.804721 × 10⁻³ | MITq = 0.5 | 18.27593 × 10⁻⁴ |
| MITq = 0.4 | 1.91095 × 10⁻³ | MITq = 0.6 | 20.49815 × 10⁻⁴ |
| ECC | 1.953432 × 10⁻³ | MITq = 0.3 | 20.86111 × 10⁻⁴ |
| MIS | 2.14404 × 10⁻³ | MITq = 0.4 | 22.68148 × 10⁻⁴ |
| MITq = 0.1 | 2.292969 × 10⁻³ | ECC | 25.63704 × 10⁻⁴ |
| MITq = 0.6 | 2.2935780 × 10⁻³ | NMI | 31.63889 × 10⁻⁴ |
| MITq = 0.2 | 2.314478 × 10⁻³ | MITq = 0.1 | 35.30000 × 10⁻⁴ |
| MITq = 0.3 | 2.33567 × 10⁻³ | MIS | 36.73333 × 10⁻⁴ |
Abbreviations: r-RE = rotational Relative Error; t-RE = translational Relative Error; ECC = Entropy Correlation Coefficient; MIS: Mutual Information using Shannon Entropy; MIT = different q values for Mutual Information using Tsallis Entropy; NCC = Normalized Cross Correlation and NMI = Normalized Mutual Information.
| Rotation | Translation | ||
|---|---|---|---|
| Cost function | r-RE | Cost function | t-RE |
| MITq = 0.9 | 9.6244645 × 10⁻² | ECC | 6.94952593 × 10⁻¹ |
| MITq = 0.8 | 9.7476227 × 10⁻² | MIS | 7.48891111 × 10⁻¹ |
| MITq = 0.7 | 10.03424090 × 10⁻² | NMI | 7.50359259 × 10⁻¹ |
| MITq = 0.6 | 10.3909320 × 10⁻² | MITq = 0.1 | 7.6336963 × 10⁻¹ |
| NMI | 10.64781780 × 10⁻² | MITq = 0.2 | 7.68925556 × 10⁻¹ |
| MITq = 0.4 | 10.87292010 × 10⁻² | MITq = 0.3 | 7.8496963 × 10⁻¹ |
| MITq = 0.5 | 10.8729323 × 10⁻² | MITq = 0.4 | 7.92383889 × 10⁻¹ |
| ECC | 11.00871570 × 10⁻² | MITq = 0.5 | 8.01386667 × 10⁻¹ |
| MITq = 0.2 | 12.01092550 × 10⁻² | MITq = 0.6 | 8.06338519 × 10⁻¹ |
| MITq = 0.1 | 12.04068950 × 10⁻² | MITq = 0.7 | 8.12098704 × 10⁻¹ |
| MIS | 12.7412762 × 10⁻² | MITq = 0.999 | 8.14527963 × 10⁻¹ |
| NCC | 16.84977460 × 10⁻² | MITq = 0.8 | 8.15023889 × 10⁻¹ |
| MITq = 0.3 | 40.9058694 × 10⁻² | MITq = 0.9 | 8.1523925 × 10⁻¹ |
| MITq = 0.999 | 41.8411673 × 10⁻² | NCC | 12.44815556 × 10⁻¹ |
Abbreviations: r-RE = rotational Relative Error; t-RE = translational Relative Error; ECC = Entropy Correlation Coefficient; MIS: Mutual Information using Shannon Entropy; MIT = different q values for Mutual Information using Tsallis Entropy; NCC = Normalized Cross Correlation and NMI = Normalized Mutual Information.
© 2014 by the authors; licensee MDPI, Basel, Switzerland This article is an open access article distributed under the terms and conditions of the Creative Commons Attribution license (http://creativecommons.org/licenses/by/3.0/).
Share and Cite
Amaral-Silva, H.; Wichert-Ana, L.; Murta, L.O.; Romualdo-Suzuki, L.; Itikawa, E.; Bussato, G.F.; Azevedo-Marques, P. The Superiority of Tsallis Entropy over Traditional Cost Functions for Brain MRI and SPECT Registration. Entropy 2014, 16, 1632-1651. https://doi.org/10.3390/e16031632
Amaral-Silva H, Wichert-Ana L, Murta LO, Romualdo-Suzuki L, Itikawa E, Bussato GF, Azevedo-Marques P. The Superiority of Tsallis Entropy over Traditional Cost Functions for Brain MRI and SPECT Registration. Entropy. 2014; 16(3):1632-1651. https://doi.org/10.3390/e16031632
Chicago/Turabian StyleAmaral-Silva, Henrique, Lauro Wichert-Ana, Luiz Otavio Murta, Larissa Romualdo-Suzuki, Emerson Itikawa, Geraldo Filho Bussato, and Paulo Azevedo-Marques. 2014. "The Superiority of Tsallis Entropy over Traditional Cost Functions for Brain MRI and SPECT Registration" Entropy 16, no. 3: 1632-1651. https://doi.org/10.3390/e16031632