Article

Using Permutation Entropy to Measure the Changes in EEG Signals During Absence Seizures

1
State Key Laboratory of Cognitive Neuroscience and Learning & IDG/McGovern Institute for Brain Research, Beijing Normal University, Beijing 100875, China
2
Department of Electrical and Automatic Engineering, School of Information Engineering, Nanchang University, Nanchang 330031, China
3
Institute of Electrical Engineering, Yanshan University, Qinhuangdao 066004, China
4
The Comprehensive Epilepsy Center, Departments of Neurology and Neurosurgery, Peking University People's Hospital, Beijing 100044, China
5
Center for Collaboration and Innovation in Brain and Learning Sciences, Beijing Normal University, Beijing 100875, China
*
Author to whom correspondence should be addressed.
Entropy 2014, 16(6), 3049-3061; https://doi.org/10.3390/e16063049
Submission received: 14 April 2014 / Revised: 26 May 2014 / Accepted: 27 May 2014 / Published: 30 May 2014
(This article belongs to the Special Issue Entropy and Electroencephalography)

Abstract

:
In this paper, we propose to use permutation entropy to explore whether the changes in electroencephalogram (EEG) data can effectively distinguish different phases in human absence epilepsy, i.e., the seizure-free, the pre-seizure and seizure phases. Permutation entropy is applied to analyze the EEG data from these three phases, each containing 100 19-channel EEG epochs of 2 s duration. The experimental results show the mean value of PE gradually decreases from the seizure-free to the seizure phase and provides evidence that these three different seizure phases in absence epilepsy can be effectively distinguished. Furthermore, our results strengthen the view that most frontal electrodes carry useful information and patterns that can help discriminate among different absence seizure phases.

Graphical Abstract

1. Introduction

Epilepsy affects more than 50 million individuals worldwide—about 1% of the World’s population, and is characterized by the spontaneous and unforeseeable occurrence of seizures [1]. According to the International League Against Epilepsy (ILAE), seizure types are organized according to whether the source of the seizure within the brain is localized (partial or focal onset seizures) or distributed (generalized seizures) [2]. Partial seizures, having a focal origin, are further divided based on the extent to which consciousness is affected (simple partial seizures and complex partial seizures) [3]. Generalized seizures affect both cerebral hemispheres (sides of the brain) from the beginning of seizures, such as absence seizures [4]. During the past decade, it was confirmed that information extracted from brain activity can provide evidence for the existence of a pre-seizure phase in partial epilepsy [5]. However, the prediction of absence seizures by detectable dynamic changes in the brain activities is still debated in absence patients [6,7].
Electroencephalograms (EEGs), which record the spontaneous electrical activity in the brain, were first measured in humans by Hans Berger in 1929. The EEG has since become one of most useful tools for studying the cognitive processes and the physiology/pathology of the brain [8,9], especially the processes involved in epileptic seizures [10,11]. Currently, these methods mainly include traditional linear methods such as Fourier transforms and spectral analysis [12] and nonlinear methods such as Lyapunov exponents [13], correlation dimension [14] and similarity [15,16]. In particular, a series of entropy-based approaches has been widely used since they can quantify the complexity (regularity) of an EEG signal [17,18,19]. EEG is a measure of the summed activity of approximately 1–100 million neurons lying in the vicinity of the recording electrode, which is a window on cortical processes to some degree [20]. The entropy of the EEG may act as a reliable indicator of changes in cortical neuronal interactions and truly reflect the intra-cortical information flow [21], and thus the term “entropy” may be more than merely a statistical measure of EEG patterns [22]. Recently, Bandt and Pompe proposed the Permutation Entropy (PE) method to measure the irregularity of non-stationary time series [23], where the basic idea is to consider order relations between the values of a time series rather than the values themselves. Compared with approximate entropy and sample entropy [24,25,26], the advantages of the PE method are its simplicity, low complexity in computation without further model assumptions, and robustness in the presence of observational and dynamical noise [23,27]. Cao et al. used permutation entropy to identify various phases of epileptic activity in the intracranial EEG signals recorded from three patients suffering from intractable epilepsy [28]. The authors found a sharp PE drop after the seizures. Nicolaou and Georgiou investigated the use of permutation entropy as a feature for automated epileptic seizure detection [29] and showed that the average sensitivity of 94.38% and average specificity of 93.23%. Bruzzo et al. applied permutation entropy to detect vigilance changes and the preictal phase from scalp EEG in three epileptic patients [30]. It was found that there is a good separability between the seizure-free phase and the pre-seizure phase and the changes of PE values during the pre-seizure phase and seizure onset coincide with changes in vigilance state [30]. Li et al. utilized permutation entropy to predict the absence seizures of Genetic Absence Epilepsy Rats from Strasbourg (GAERS) through EEG recordings. The results showed that permutation entropy can track the dynamical changes of EEG data [31]. Mammone et al. evaluated permutation entropy extracted from different electrodes in patients with typical absences and healthy subjects [32]. The results showed that the PE values gradually evolve towards the seizure phase and PE seems a useful tool to disclose abnormalities of cerebral electric activity not revealed by conventional EEG [32,33].
Absence seizures are a form of generalized seizures accompanied by spike-and-wave complexes in the EEG [34]. These sudden and abrupt seizures are transient signs and/or symptoms of abnormal, excessive, or synchronous neural activities in the brain [4]. People with absence epilepsy have repeated seizures that cause momentary lapses of consciousness [35]. Absence seizures are short in duration, typically lasting from a few seconds up to around a minute, and may recur over 100 times a day [36]. Since these sudden and abrupt seizures most commonly occur in childhood or adolescence, they may have significant impact on the educational development of sufferers [37,38]. Therefore, understanding the transition of brain activity toward an absence seizure, called pre-seizure, is a very demanding task [6,39]. Our previous analysis of dynamic changes in the EEG of GAERS has demonstrated that EEG epochs prior to seizures exhibit a higher degree of regularity/predictability than seizure-free EEG epochs, but they present a lower degree than that in seizure EEG epochs [40,41]. Sitnikova and Luijtelaar showed that the spike-wave discharges (SWD) activity (in Wistar Albino Glaxo/Rijswijk rats) is preceded by short lasting delta and theta precursor activities in cortex and thalamus, but the combination rarely occurs during control periods [42,43]. These EEG precursors in rat models give us a clue in predicting human absence epilepsy. To investigate whether information extracted from the EEG can provide evidence for the existence of a pre-seizure phase in human absence epilepsy, it is necessary to conduct further analysis. More recently, a study by Amor [44] explored the spatiotemporal dynamics of interactions within and between widely distributed cortical sites using magnetoencephalographic recordings of absence seizures and indicated that precursors of absence seizures can be identified with synchronization analysis. Mammone et al. [32] also proposed a spatio-temporal analysis of EEG to check whether the epileptogenic process in absence seizures actually corresponds to the model of a “jump” transition of the underlying dynamical system or a gradual transformation is detectable in advance. Their results indicated an abnormal coupling of different brain areas cooperatively going towards the seizure onset and might yield a contribution for early detection of EEG seizure onsets, which support the view that a gradual transformation goes towards the seizure onset [32]. In this study, we attempt to apply permutation entropy to explore whether or not the changes of EEG can effectively distinguish the pre-seizure phase from the seizure-free and seizure phases in human absence epilepsy.
The organization of this paper is as follows: we introduce the material and methods in Section 2; results are described in Section 3; discussion and conclusions are given in Section 4.

2. Materials and Methods

2.1. EEG Recordings

EEG recordings were obtained from nine patients (five males and four females) with absence epilepsy, aged from 8 to 21 years old. The study protocol had previously been approved by the ethics committee of Peking University People’s Hospital and the patients had signed informed consent that their clinical data might be used and published for research purposes. The EEG data were recorded by the Neurofile NT digital video EEG system from a standard international 10–20 electrode placement (Fp1, Fp2, F3, F4, C3, C4, P3, P4, O1, O2, F7, F8, T3, T4, T5, T6, Fz, Cz and Pz). EEG data was obtained at a sampling frequency of 256 Hz using a 16-bit analogue-to-digital converter and filtered within a frequency band from 0.5 to 35 Hz.
To investigate the permutation entropy of EEG data during different seizure phases, the EEG signals of absence epilepsy were selected and dissected from seizure-free (dataset I), pre-seizure (dataset II) and seizure (dataset III) phases, where 100 × 2 s 19-channel EEG epochs from nine patients were selected for each dataset. The timing of onset and offset in spike-wave discharges (SWDs) was identified by an epilepsy neurologist, and these SWDs were defined as large-amplitude rhythmic 3–4 Hz discharges with typical spike-wave morphology lasting >1.0 s. Short (2 s) EEG recordings were used because: (1) it is clinically difficult to obtain long EEG recordings during absence seizures [45]; and (2) the duration of the pre-seizure phase is only about a few seconds as determined from the rat model [31,46]. The criteria for the selection of the seizure-free, pre-seizure and seizure data are that the interval between the seizure-free data and the beginning point of seizures is greater than 15 s, the interval is between 0 to 2 s prior to seizure onset, and the interval is the first 2 s of the absence seizure, respectively. Figure 1 shows representative examples of 19-channel EEG recordings during seizure-free (A), pre-seizure (B) and seizure (C) phases, respectively. It is found that generalized SWDs with a repetition rate of 3 Hz are typically associated with clinical absence seizures.
Figure 1. Representative examples of 19-channel EEG recordings during seizure-free (A), pre-seizure (B) and seizure (C) phases.
Entropy 16 03049 g001

2.2. Permutation Entropy

Bandt and Pompe recently proposed a new permutation method to map a continuous time series onto a symbolic sequence [23], where the statistics of the symbolic sequences was called permutation entropy. Given a time series {x1, x2, … , xN}, an embedding procedure was used to generate N − (m − 1)l vectors X1, X2, …, XN −(m − 1)l defined by Xt = [xt, xt, … , xt+(m−1)l] with the embedding dimension m and the lag l (here l = 1). The vector Xt can be rearranged in an ascending order as [xt+(j1−1)lxt+(j2−1)l … ≤ xt+(jm−1)l]. For m different numbers, there will be m! possible order patterns π, which are also called permutations. Then we can count the occurrences of the order pattern πi, which is denoted as Ci), i = 1, 2, … m!. Its relative frequency is calculated by p(π) = C(π)/(N − (m − 1)l). The permutation entropy is defined as:
Entropy 16 03049 i001
The largest value of PE is log(m!), which means the time series is completely random; the smallest value of PE is zero, indicating the time series is very regular. In short, the permutation entropy refers to the local order structure of the time series. More details can be found in [23].
Permutation entropy refers to the local order structure of the time series, which can give a quantitative complexity measure for a dynamical time series [47]. Permutation entropy calculation depends only on the selection of m. When m is too small (less than 3), the scheme will not work well since there are only a few distinct states for EEG recordings. On the other hand, the length of EEG recording should be larger than m in order to achieve a proper differentiation between stochastic and deterministic dynamics [46]. In order to allow every possible order pattern of dimension m to occur in a time series of length N, the condition m! ≤ N − (m − 1)l must hold. Moreover, N >> m!+(m − 1)l is required to avoid undersampling. For this reason, given m dimensions, we need to choose N ≥ (m + 1)!. To satisfy this condition, we therefore choose a low dimension m = 4 when calculating permutation entropy.

2.3. Statistical Analysis
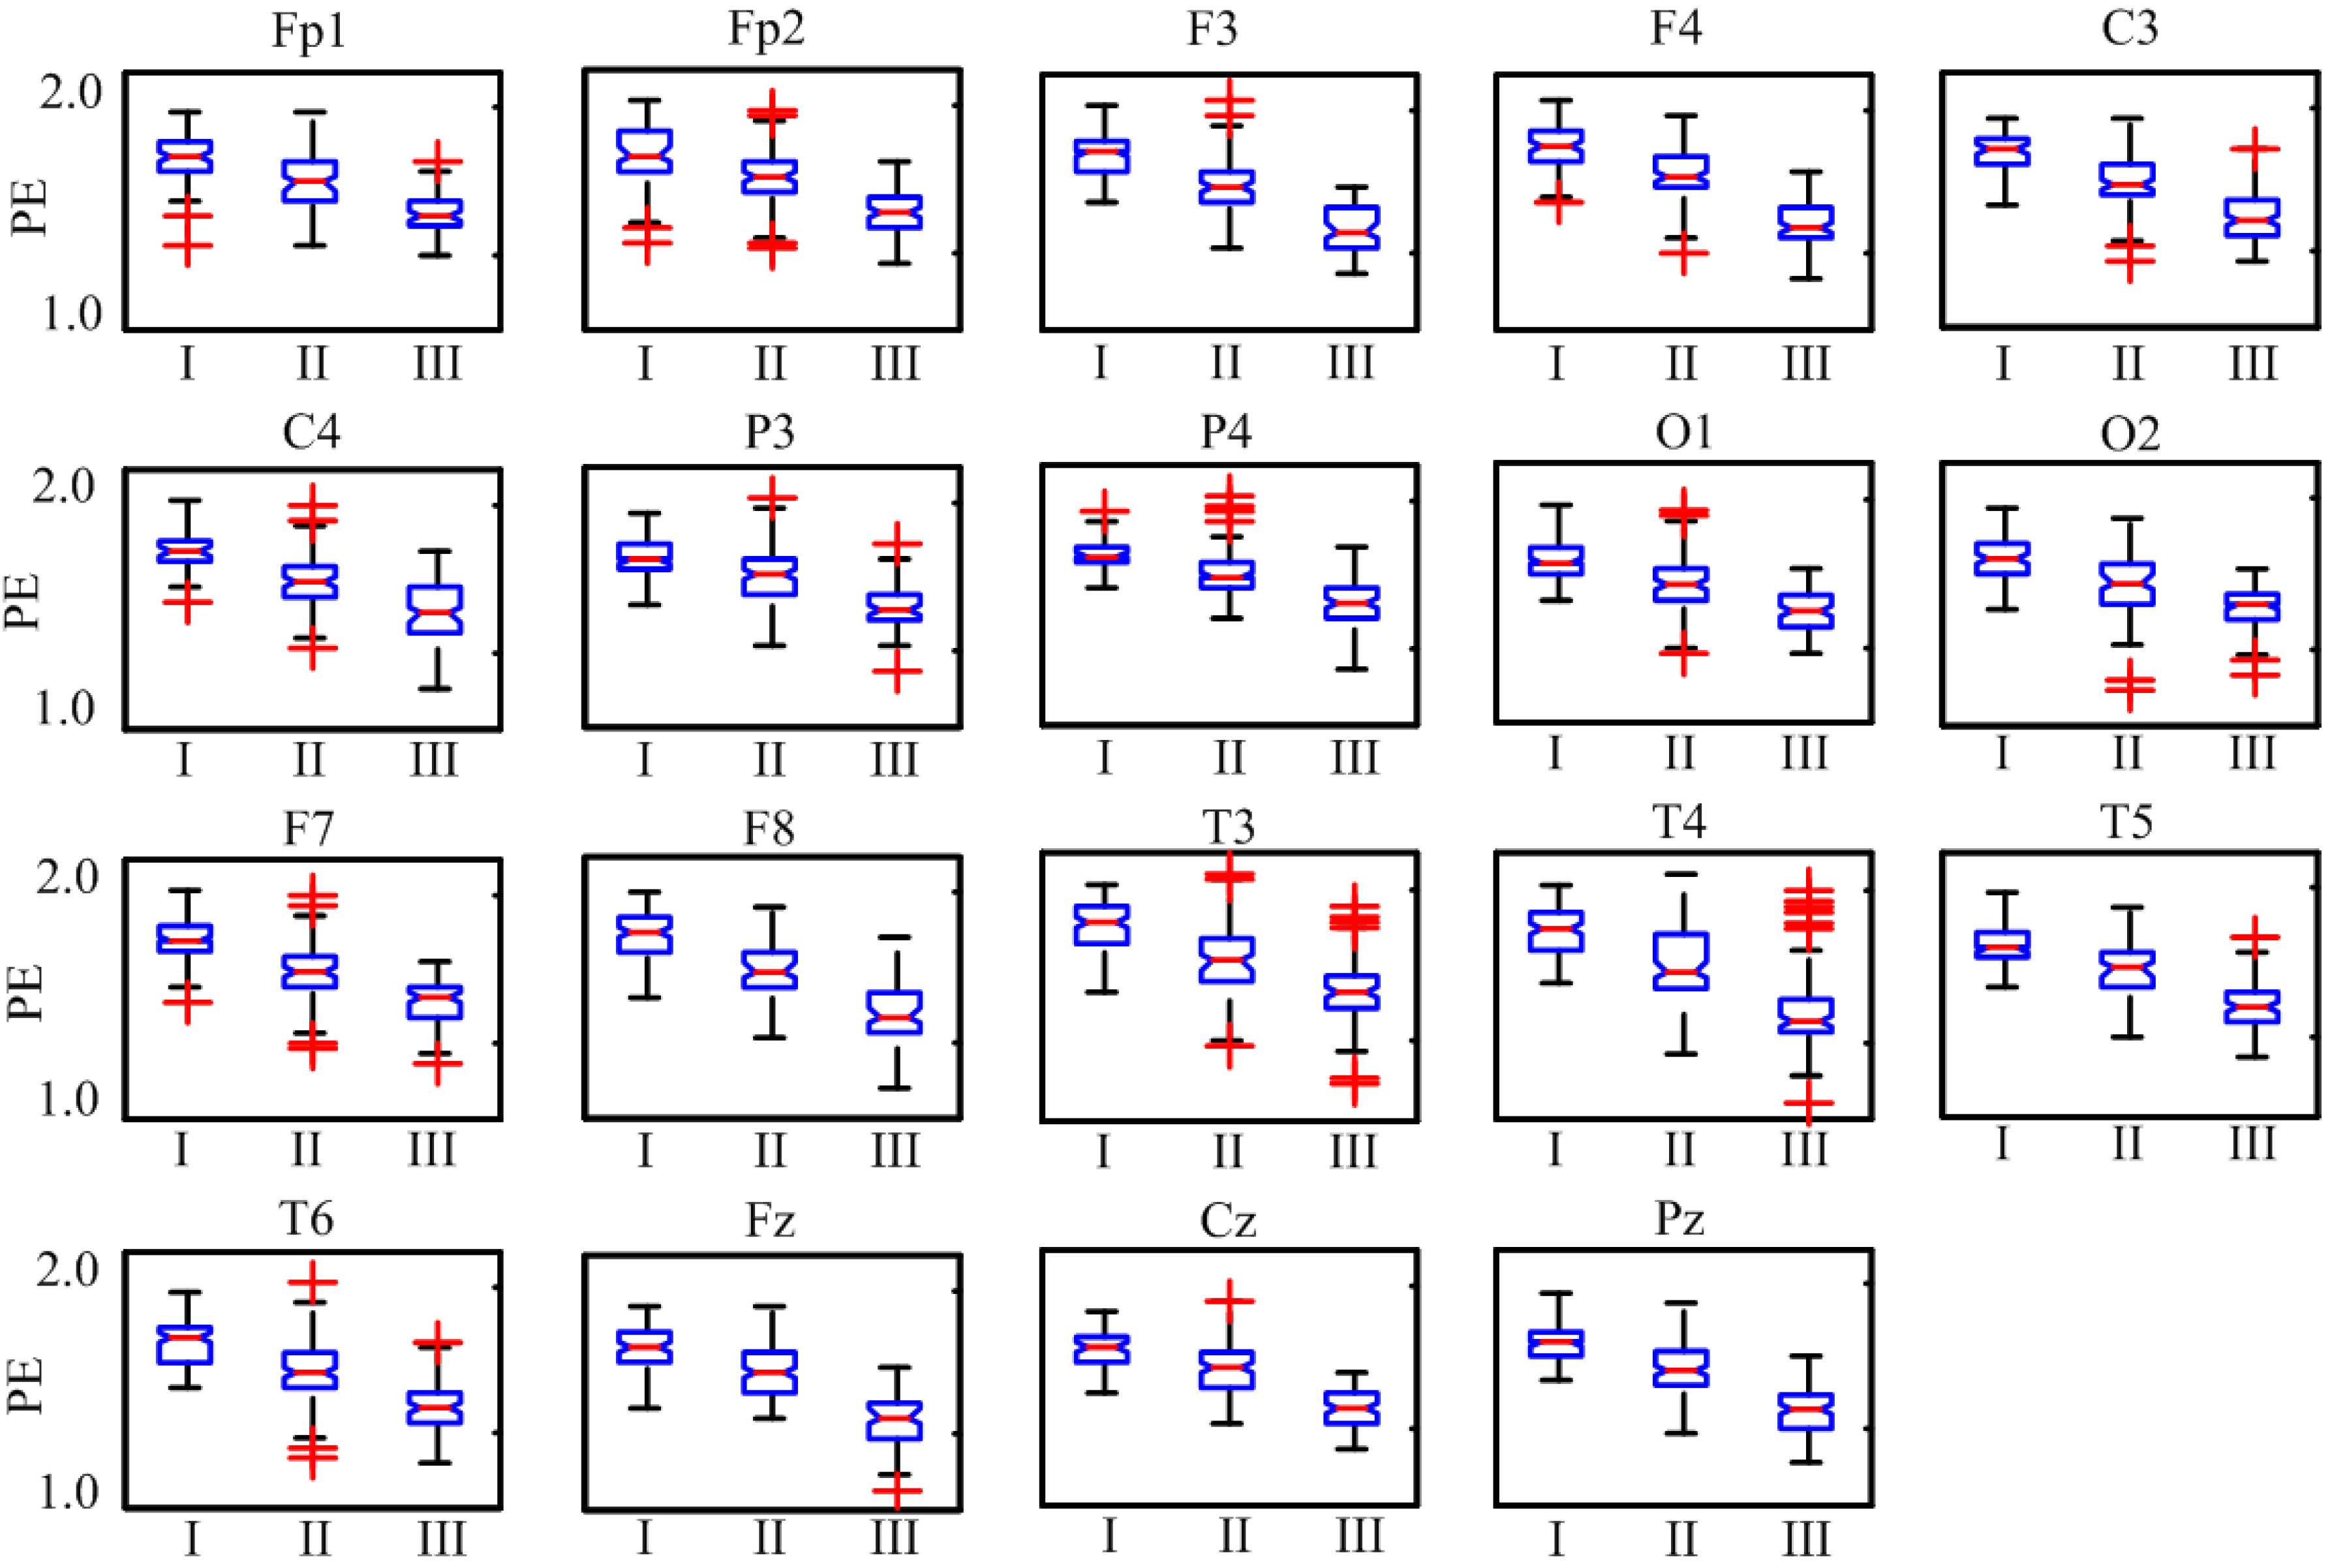
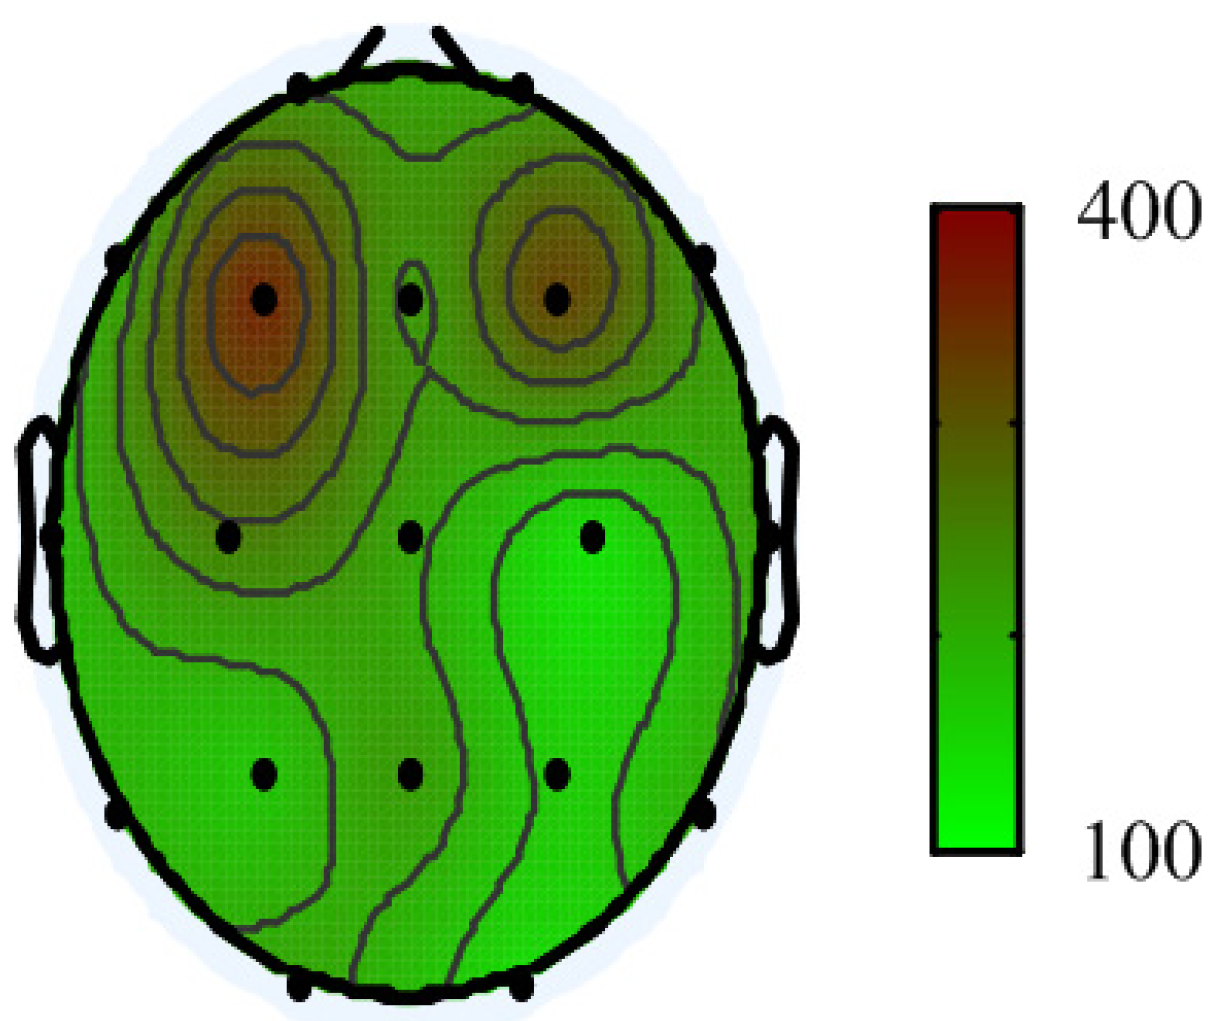
In order to investigate the permutation entropy of EEG recordings in different seizure phases, the statistical analysis for entropy PE is carried out to determine whether their distributions over these three groups are significantly different. A one-way analysis of variance (ANOVA) with Scheffe’s post-hoc test is performed using a standard tool of numerical analysis (MATLAB’s ANOVA routine, statistics toolbox).

3. Results

The permutation entropy is applied to analysing the EEG recordings, with m = 4, during different seizure phases. Using all of the EEG data, we first calculate permutation entropy to determine the degree of complexity present in the signals. To make some general comparisons of EEG complexity among three different seizure phases, PE measures are averaged over all subgroups. Figure 2 shows the group average PE value in each of the three EEG epochs. The height of each bar in Figure 2 represents the mean PE value averaged over all 19 EEG channels. The averaged PE values for the EEG epochs are 1.677 ± 0.060, 1.560 ± 0.099 and 1.407 ± 0.065 (mean ± SD) in dataset I, II and III, respectively. It is indicated that the alterations of absence EEG could be characterized by the measures of PE.
Since the complexity changes seem to vary with EEG channel, a better picture of permutation entropy of EEG with three seizure phases can be seen in a scalp plot. Complexity variation among these three EEG epochs is immediately apparent as shown in Figure 3, which shows the permutation entropy for all 19 channels EEG for seizure-free, pre-seizure and seizure phases. The value of PE in the scalp plot is determined by averaging over all absence patients of each group. It is found that the mean value of PE gradually decreases from seizure-free to seizure phases for all 19 electrodes. For example, the averaged PE values for the EEG epochs from channel 3 (F3 electrode) averaged 1.702 ± 0.088, 1.582 ± 0.108 and 1.374 ± 0.104 (mean ± SD) in dataset I, II and III, respectively. To make some comparisons of the values of entropy with different dimension, the permutation entropy is applied to analyze the EEG recordings, with m = 3 and m = 5, respectively. It is also found that the mean value of PE gradually decreases from seizure-free to seizure phases for all 19 electrodes. These results are similar to the result with m = 4.
Figure 2. Bar graph for the PE values of all EEG epochs, grouped by seizure-free (I), pre-seizure (II) and seizure (III), respectively. Height of each bar represents the mean value of each group, and the horizontal tick above each bar represents the standard deviation (SD).
Entropy 16 03049 g002
Figure 3. Mean permutation entropy in each EEG channel averaged over all absence patients in the seizure-free phase (A); the pre-seizure phase (B) and the seizure phase (C). The electrodes are represented with black dots whereas different PE levels are coded with a coloration going from dark blue (low PE), to dark red (high PE).
Entropy 16 03049 g003
Next, in order to investigate whether their distributions over the three groups are significantly different, the ANOVA test is used for calculating PE values on each channel. Figure 4 shows the population distribution of the PE for each channel as boxplot. As calculated, the critical value is Fcrit(2198) = 4.71 at α = 0.01, at which point the test statistic must exceed to reject the test. For example, Table 1 shows the results of the ANOVA test of EEG data from channel 3 (F3 electrode), where the statistical test yields an F-statistic (F = 352.4) that is much higher than the threshold Fcrit (F = 4.71). In this case, the null hypothesis, i.e., no differences among these three different groups, should be rejected. The results of F-statistic from all 19 channels are shown as topological plot in Figure 5. It can be seen that, on all 19 channels, the values of F-statistic are higher than the threshold Fcrit on each electrode and the F-statistic values from electrodes F3 and F4 are much higher than those from other electrodes. Therefore, the differences among three different EEG epochs are significant at the 1% significance level for all electrodes.
Figure 4. Boxplots for the entropy PE on 19 channels of all the 100 EEG recordings, grouped by seizure-free (I); pre-seizure (II) and seizure (III) phase. Each box presents the interquartile range which contains 50% of values with a line at the median. The whiskers show the overall data range, excluding outlines and extreme values. Outlines (+) are cases with values that are more than 1.5 times the interquartile range.
Entropy 16 03049 g004
Figure 5. Topological plot for the value of F-statistic on each EEG channel. The electrodes are represented with black dots whereas F-statistic levels are coded with a coloration going from dark blue (low F-statistic), to dark red (high F-statistic). If the value of F-statistic is higher; the difference among three different EEG epochs is more significant.
Entropy 16 03049 g005
Thus, a Scheffe’s post-hoc test for all pairwise comparisons between the means is used to determine whether there is statistically significant difference between any two groups. As shown in Table 1, the results of multiple comparison analysis suggest that the PE values for the EEG data from F3 electrode in the pre-seizure phase have significantly lower values than those in the seizure-free phase, but they are significantly higher than those in the seizure phase. Finally, the above statistical test is applied to EEG data from the other 18 electrodes and similar statistical results can also be obtained. In short, it can be concluded that the difference among different groups is statistically significant.
Table 1. ANOVA with comparisons between the means using Scheffe’s test.
ANOVA Source of VariationSums of SquaresDegrees of FreedomMean SquareF-Statistic
Between Samples5.49722.7485352.4 p < 0.01
Error1.5351980.0078
Subject1.44399
Total8.475299
Scheffe’s test: the seizure-free phase vs. the pre-seizure phase S = 46.64 (p < 0.01); the seizure-free phase vs. the seizure phase S = 346.35 (p < 0.01); the pre-seizure phase vs. the seizure phase S = 138.80 (p < 0.01).

4. Discussion and Conclusions

The interactions between neurons play a crucial role in absence seizure generation, and the EEG signal is a reasonable measure of the summed activity of approximately 1–100 million neurons lying in the vicinity of the recording electrodes [21] The entropy of the EEG may act as a reliable indicator of changes in cortical neuronal interactions, i.e., the entropy within the EEG may window a real change in cortical functional organization [22,31]. Therefore, the changes in entropy of the EEG may be expected to indirectly and coarsely measure the changes in the entropy occurring within the neural network itself. In this study, the permutation entropy is applied to analysing the EEG data during different absence seizure phases. The advantages of this method are its simplicity, robustness and low complexity in computation without further model assumptions [23]. Also, the order pattern method is robust in the presence of observational and dynamical noise [48,49]. An ANOVA test with the Scheffe’s post-hoc analysis indicates that the PE value in seizure EEG is statistically lower than that in seizure-free and pre-seizure EEG. It is known that permutation entropy is a regularity measure of a dynamical system. The lowest PE values during the seizure phase imply that local neural networks become more regular during absence seizures. Similar results have been reported based on an approximate entropy measure of EEG data from absence epilepsy patients [50]. This result is consistent with the notion that the firing pattern of the thalamo-cortical neurons shifts to an oscillatory rhythmic synchronized state of the EEG during absence seizures [51,52].
Furthermore, it is found that there is a significant decrease of the PE value of the EEG data from seizure-free to seizure phases in human absence epilepsy. The permutation entropy is a promising method to reveal dynamic changes in absence EEG. This result is consistent with our previous studies in the rat model [31,40]. A previous analysis of single-channel EEG has demonstrated that EEG epochs prior to seizures exhibit a higher degree of regularity/predictability than that in seizure-free EEG epochs, but they present a lower degree than that in seizure EEG epochs [41]. A possible reason is that the absence seizure is the abnormally synchronized activity propagating throughout the cortico-thalamo-cortical loop [53]. Recent evidence has suggested the absence seizure is initiated by abnormally discharging neurons with a focal initiation site in the cortex, which can then recruit and entrain neighboring cortical and thalamic neurons into a critical mass. This process manifests itself as increasing synchronization of neuronal activity [4,54], which indicates an increasing regularity of EEG data. These results are similar to the findings that different EEG rhythms were presented in different pathological brain states [7,20].
In addition, our results show that the maximum differentiation among three different seizure phases is obtained from electrodes F3 and F4, which provide the evidence for supporting the view of fronto-central network in absence epilepsy. The fronto-central neocortex has a greater likelihood of expressing up to a 3-Hz generalized spike-and-wave pattern due to its proximity to the corpus callosum that is capable of facilitating rapid bihemispheric propagation [55]. Amor et al. analysed the characterisation of early cortical activities and explored the spatio-temporal dynamics of interactions within and between local cortical neural networks [44]. Their analyses revealed a reproducible sequence: long-range desynchronisation-increased local synchronisation-increased long-range synchronization and found a multifocal fronto-central network in absence epilepsy [44]. Mammone et al. proposed a spatial-temporal analysis method, based on the concept of permutation entropy, to analyse the EEG recordings from 24 absence epilepsy patients and 40 healthy subjects. It is found that the widely accepted model of “jump” transition to absence seizure should be in some cases coupled by a gradual transition model characteristic of self-organizing networks [32]. Their results also showed that the frontal/temporal electrodes in absence epilepsy patients resulted preferably clustered together in the high-PE (high randomness) cluster whereas the parietal/occipital electrodes showed to be clustered in the low-PE cluster. The EEG of healthy subjects neither shows any similar dynamic behavior nor exhibits any recurrent portrait in PE topography [32]. Ferlazzo et al. also applied permutation entropy to analyse the EEG recordings from patients with typical absences and healthy subjects. Their results suggested patients showed a recurrent behavior of PE topography, with anterior brain regions constantly associated to high PE levels and posterior brain regions constantly associated to low PE levels, during both interictal and ictal phases [33]. Similar results have been reported by Rosso et al., who compared the functional networks in EEG background between absence epilepsy and healthy control individuals and identified which set of electrodes provide the maximum differentiation. This suggested the selection of electrodes F3, F4, C3 and Cz as the most representative ones for the differentiation between control and absence patients [56]. In summary, these results strengthen the view that mostly frontal electrodes carry useful information and patterns that have the potential of discriminating among different absence seizure phases.

Acknowledgments

This research was supported by National Natural Science Foundation of China (61025019, 61105027 and 81341042), Beijing Natural Science Foundation (4143063) and the Fundamental Research Funds for the Central Universities.

Author Contributions

The work presented here was carried out in collaboration between all authors. Jing Li and Gaoxiang Ouyang designed the research; Jing Li, Xianzeng Liu and Gaoxiang Ouyang performed the research; Jiaqing Yan analyzed the data; Jing Li and Gaoxiang Ouyang wrote the paper. All authors have read and approved the final published manuscript.

Conflicts of Interest

The authors declare no conflict of interest.

References

  1. Litt, B.; Echauz, J. Prediction of epileptic seizures. Lancet Neurol. 2002, 1, 22–30. [Google Scholar] [CrossRef]
  2. Engel, J., Jr.; International League Against Epilepsy (ILAE). A proposed diagnostic scheme for people with epileptic seizures and with epilepsy: Report of the ilae task force on classification and terminology. Epilepsia 2001, 42, 796–803. [Google Scholar] [CrossRef]
  3. Anderson, W.S.; Azhar, F.; Kudela, P.; Bergey, G.K.; Franaszczuk, P.J. Epileptic seizures from abnormal networks: Why some seizures defy predictability. Epilepsy Res. 2012, 99, 202–213. [Google Scholar] [CrossRef]
  4. Meeren, H.K.; Pijn, J.P.; van Luijtelaar, E.L.; Coenen, A.M.; Lopes da Silva, F.H. Cortical focus drives widespread corticothalamic networks during spontaneous absence seizures in rats. J. Neurosci. 2002, 22, 1480–1495. [Google Scholar]
  5. Mormann, F.; Andrzejak, R.G.; Elger, C.E.; Lehnertz, K. Seizure prediction: The long and winding road. Brain 2007, 130, 314–333. [Google Scholar] [CrossRef]
  6. Crunelli, V.; Cope, D.W.; Terry, J.R. Transition to absence seizures and the role of gaba(a) receptors. Epilepsy Res. 2011, 97, 283–289. [Google Scholar] [CrossRef]
  7. Stacey, W.C.; Litt, B. Technology insight: Neuroengineering and epilepsy-designing devices for seizure control. Nat. Clin. Pract. Neurol. 2008, 4, 190–201. [Google Scholar]
  8. Stam, C.J. Nonlinear dynamical analysis of EEG and MEG: Review of an emerging field. Clin. Neurophysiol. 2005, 116, 2266–2301. [Google Scholar] [CrossRef]
  9. Kurth, S.; Achermann, P.; Rusterholz, T.; LeBourgeois, M. Development of brain EEG connectivity across early childhood: Does sleep play a role? Brain Sci. 2013, 3, 1445–1460. [Google Scholar] [CrossRef]
  10. Herman, S.T.; Takeoka, M.; Hughes, J.R.; Drislane, F.W. Electroencephalography in clinical epilepsy research. Epilepsy Behav. 2011, 22, 126–133. [Google Scholar] [CrossRef]
  11. Liu, Y.-C.; Lin, C.-C.; Tsai, J.-J.; Sun, Y.-N. Model-based spike detection of epileptic EEG data. Sensors 2013, 13, 12536–12547. [Google Scholar] [CrossRef]
  12. Rogowski, Z.; Gath, I.; Bental, E. On the prediction of epileptic seizures. Biol. Cybern. 1981, 42, 9–15. [Google Scholar] [CrossRef]
  13. Iasemidis, L.D.; Sackellares, J.C.; Zaveri, H.P.; Williams, W.J. Phase space topography and the lyapunov exponent of electrocorticograms in partial seizures. Brain Topogr. 1990, 2, 187–201. [Google Scholar] [CrossRef]
  14. Andrzejak, R.G.; Lehnertz, K.; Mormann, F.; Rieke, C.; David, P.; Elger, C.E. Indications of nonlinear deterministic and finite-dimensional structures in time series of brain electrical activity: Dependence on recording region and brain state. Phys. Rev. E 2001, 64, 061907. [Google Scholar] [CrossRef]
  15. Navarro, V.; Martinerie, J.; le van Quyen, M.; Clemenceau, S.; Adam, C.; Baulac, M.; Varela, F. Seizure anticipation in human neocortical partial epilepsy. Brain 2002, 125, 640–655. [Google Scholar] [CrossRef]
  16. Niknazar, M.; Mousavi, S.R.; Motaghi, S.; Dehghani, A.; Vosoughi Vahdat, B.; Shamsollahi, M.B.; Sayyah, M.; Noorbakhsh, S.M. A unified approach for detection of induced epileptic seizures in rats using ecog signals. Epilepsy Behav. 2013, 27, 355–364. [Google Scholar] [CrossRef]
  17. Gao, J.; Hu, J.; Tung, W.-W. Entropy measures for biological signal analyses. Nonlinear Dyn. 2011, 68, 431–444. [Google Scholar]
  18. Morabito, F.C.; Labate, D.; la Foresta, F.; Bramanti, A.; Morabito, G.; Palamara, I. Multivariate multi-scale permutation entropy for complexity analysis of alzheimer’s disease EEG. Entropy 2012, 14, 1186–1202. [Google Scholar] [CrossRef]
  19. Huang, J.-R.; Fan, S.-Z.; Abbod, M.; Jen, K.-K.; Wu, J.-F.; Shieh, J.-S. Application of multivariate empirical mode decomposition and sample entropy in EEG signals via artificial neural networks for interpreting depth of anesthesia. Entropy 2013, 15, 3325–3339. [Google Scholar] [CrossRef]
  20. Buzsáki, G. Rhythms of the Brain; Oxford University Press: New York, NY, USA, 2006. [Google Scholar]
  21. Sleigh, J.W.; Steyn-Ross, D.A.; Steyn-Ross, M.L.; Grant, C.; Ludbrook, G. Cortical entropy changes with general anaesthesia: Theory and experiment. Physiol. Meas. 2004, 25, 921–934. [Google Scholar] [CrossRef]
  22. Van Drongelen, W.; Nayak, S.; Frim, D.M.; Kohrman, M.H.; Towle, V.L.; Lee, H.C.; McGee, A.B.; Chico, M.S.; Hecox, K.E. Seizure anticipation in pediatric epilepsy: Use of kolmogorov entropy. Pediatr. Neurol. 2003, 29, 207–213. [Google Scholar] [CrossRef]
  23. Bandt, C.; Pompe, B. Permutation entropy: A natural complexity measure for time series. Phys. Rev. Lett. 2002, 88, 174102. [Google Scholar] [CrossRef]
  24. Pincus, S.M. Approximate entropy as a measure of system complexity. Proc. Natl. Acad. Sci. USA 1991, 88, 2297–2301. [Google Scholar] [CrossRef]
  25. Richman, J.S.; Moorman, J.R. Physiological time-series analysis using approximate entropy and sample entropy. Am. J. Physiol. Heart Circ. Physiol. 2000, 278, H2039–H2049. [Google Scholar]
  26. Wei, Q.; Liu, Q.; Fan, S.-Z.; Lu, C.-W.; Lin, T.-Y.; Abbod, M.; Shieh, J.-S. Analysis of EEG via multivariate empirical mode decomposition for depth of anesthesia based on sample entropy. Entropy 2013, 15, 3458–3470. [Google Scholar] [CrossRef]
  27. Zanin, M.; Zunino, L.; Rosso, O.A.; Papo, D. Permutation entropy and its main biomedical and econophysics applications: A review. Entropy 2012, 14, 1553–1577. [Google Scholar] [CrossRef]
  28. Cao, Y.; Tung, W.W.; Gao, J.B.; Protopopescu, V.A.; Hively, L.M. Detecting dynamical changes in time series using the permutation entropy. Phys. Rev. E 2004, 70, 046217. [Google Scholar] [CrossRef]
  29. Nicolaou, N.; Georgiou, J. Detection of epileptic electroencephalogram based on permutation entropy and support vector machines. Expert Syst. Appl. 2012, 39, 202–209. [Google Scholar] [CrossRef]
  30. Bruzzo, A.A.; Gesierich, B.; Santi, M.; Tassinari, C.A.; Birbaumer, N.; Rubboli, G. Permutation entropy to detect vigilance changes and preictal states from scalp EEG in epileptic patients. A preliminary study. Neurol. Sci. 2008, 29, 3–9. [Google Scholar] [CrossRef]
  31. Li, X.; Ouyang, G.; Richards, D.A. Predictability analysis of absence seizures with permutation entropy. Epilepsy Res. 2007, 77, 70–74. [Google Scholar] [CrossRef]
  32. Mammone, N.; Labate, D.; Lay-Ekuakille, A.; Morabito, F.C. Analysis of absence seizure generation using EEG spatial-temporal regularity measures. Int. J. Neural Syst. 2012, 22, 1250024. [Google Scholar] [CrossRef]
  33. Ferlazzo, E.; Mammone, N.; Cianci, V.; Gasparini, S.; Gambardella, A.; Labate, A.; Latella, M.A.; Sofia, V.; Elia, M.; Morabito, F.C.; et al. Permutation entropy of scalp EEG: A tool to investigate epilepsies: Suggestions from absence epilepsies. Clin. Neurophysiol. 2014, 125, 13–20. [Google Scholar] [CrossRef]
  34. Gorji, A.; Mittag, C.; Shahabi, P.; Seidenbecher, T.; Pape, H.C. Seizure-related activity of intralaminar thalamic neurons in a genetic model of absence epilepsy. Neurobiol. Dis. 2011, 43, 266–274. [Google Scholar] [CrossRef]
  35. Cavanna, A.E.; Monaco, F. Brain mechanisms of altered conscious states during epileptic seizures. Nat. Rev. Neurol. 2009, 5, 267–276. [Google Scholar] [CrossRef]
  36. Bai, X.; Vestal, M.; Berman, R.; Negishi, M.; Spann, M.; Vega, C.; Desalvo, M.; Novotny, E.J.; Constable, R.T.; Blumenfeld, H. Dynamic time course of typical childhood absence seizures: EEG, behavior, and functional magnetic resonance imaging. J. Neurosci. 2010, 30, 5884–5893. [Google Scholar] [CrossRef]
  37. Killory, B.D.; Bai, X.; Negishi, M.; Vega, C.; Spann, M.N.; Vestal, M.; Guo, J.; Berman, R.; Danielson, N.; Trejo, J.; et al. Impaired attention and network connectivity in childhood absence epilepsy. NeuroImage 2011, 56, 2209–2217. [Google Scholar] [CrossRef]
  38. Blumenfeld, H. Impaired consciousness in epilepsy. Lancet Neurol. 2012, 11, 814–826. [Google Scholar] [CrossRef]
  39. Rosso, O.A.; Mendes, A.; Rostas, J.A.; Hunter, M.; Moscato, P. Distinguishing childhood absence epilepsy patients from controls by the analysis of their background brain electrical activity. J. Neurosci. Methods 2009, 177, 461–468. [Google Scholar] [CrossRef]
  40. Ouyang, G.; Li, X.; Dang, C.; Richards, D.A. Using recurrence plot for determinism analysis of EEG recordings in genetic absence epilepsy rats. Clin. Neurophysiol. 2008, 119, 1747–1755. [Google Scholar] [CrossRef]
  41. Ouyang, G.; Li, J.; Liu, X.; Li, X. Dynamic characteristics of absence EEG recordings with multiscale permutation entropy analysis. Epilepsy Res. 2013, 104, 246–252. [Google Scholar] [CrossRef]
  42. Sitnikova, E. Thalamo-cortical mechanisms of sleep spindles and spike-wave discharges in rat model of absence epilepsy (a review). Epilepsy Res. 2010, 89, 17–26. [Google Scholar]
  43. Sitnikova, E.; van Luijtelaar, G. Electroencephalographic precursors of spike-wave discharges in a genetic rat model of absence epilepsy: Power spectrum and coherence EEG analyses. Epilepsy Res. 2009, 84, 159–171. [Google Scholar] [CrossRef]
  44. Amor, F.; Baillet, S.; Navarro, V.; Adam, C.; Martinerie, J.; Quyen Mle, V. Cortical local and long-range synchronization interplay in human absence seizure initiation. NeuroImage 2009, 45, 950–962. [Google Scholar] [CrossRef]
  45. Sadleir, L.G.; Farrell, K.; Smith, S.; Connolly, M.B.; Scheffer, I.E. Electroclinical features of absence seizures in sleep. Epilepsy Res. 2011, 93, 216–220. [Google Scholar] [CrossRef]
  46. Ouyang, G.; Dang, C.; Richards, D.A.; Li, X. Ordinal pattern based similarity analysis for EEG recordings. Clin. Neurophysiol. 2010, 121, 694–703. [Google Scholar] [CrossRef]
  47. Ouyang, G.; Li, X.; Dang, C.; Richards, D.A. Deterministic dynamics of neural activity during absence seizures in rats. Phys. Rev. E 2009, 79, 041146. [Google Scholar] [CrossRef]
  48. Rosso, O.A.; Larrondo, H.A.; Martin, M.T.; Plastino, A.; Fuentes, M.A. Distinguishing noise from chaos. Phys. Rev. Lett. 2007, 99, 154102. [Google Scholar] [CrossRef]
  49. Li, X.; Ouyang, G. Estimating coupling direction between neuronal populations with permutation conditional mutual information. NeuroImage 2010, 52, 497–507. [Google Scholar]
  50. Burioka, N.; Cornelissen, G.; Maegaki, Y.; Halberg, F.; Kaplan, D.T.; Miyata, M.; Fukuoka, Y.; Endo, M.; Suyama, H.; Tomita, Y.; et al. Approximate entropy of the electroencephalogram in healthy awake subjects and absence epilepsy patients. Clin. EEG Neurosci. 2005, 36, 188–193. [Google Scholar]
  51. Steriade, M.; McCormick, D.A.; Sejnowski, T.J. Thalamocortical oscillations in the sleeping and aroused brain. Science 1993, 262, 679–685. [Google Scholar]
  52. Futatsugi, Y.; Riviello, J.J., Jr. Mechanisms of generalized absence epilepsy. Brain Dev. 1998, 20, 75–79. [Google Scholar] [CrossRef]
  53. Polack, P.O.; Guillemain, I.; Hu, E.; Deransart, C.; Depaulis, A.; Charpier, S. Deep layer somatosensory cortical neurons initiate spike-and-wave discharges in a genetic model of absence seizures. J. Neurosci. 2007, 27, 6590–6599. [Google Scholar] [CrossRef]
  54. Meeren, H.; van Luijtelaar, G.; Lopes da Silva, F.; Coenen, A. Evolving concepts on the pathophysiology of absence seizures: The cortical focus theory. Arch. Neurol. 2005, 62, 371–376. [Google Scholar] [CrossRef]
  55. Holmes, M.D.; Brown, M.; Tucker, D.M. Are “generalized” seizures truly generalized? Evidence of localized mesial frontal and frontopolar discharges in absence. Epilepsia 2004, 45, 1568–1579. [Google Scholar] [CrossRef]
  56. Rosso, O.A.; Mendes, A.; Berretta, R.; Rostas, J.A.; Hunter, M.; Moscato, P. Distinguishing childhood absence epilepsy patients from controls by the analysis of their background brain electrical activity (ii): A combinatorial optimization approach for electrode selection. J. Neurosci. Methods 2009, 181, 257–267. [Google Scholar] [CrossRef]

