Article

The Solute-Exclusion Zone: A Promising Application for Mirofluidics

1
Bioengineering Department, University of California, Merced, CA 94343, USA
2
MicroBase Technology Corp., Bade City, Taoyuan, 33464, Taiwan
3
Center for Biomedical Engineering, Chang Gung University, Taoyuan, 33302, Taiwan
*
Author to whom correspondence should be addressed.
Entropy 2015, 17(3), 1466-1476; https://doi.org/10.3390/e17031466
Submission received: 1 July 2014 / Revised: 9 March 2015 / Accepted: 16 March 2015 / Published: 23 March 2015
(This article belongs to the Special Issue Entropy and EZ-Water)

Abstract

:
While unique phenomena exist at fluid-solid phase intersections, many interfacial phenomena manifest solely on limited scales—i.e., the nm-μm ranges—which stifles their application potential. Here, we constructed microfluidic chips that utilize the unique long-distance interface effects of the Solute-Exclusion Zone (EZ) phenomenon to mix, separate, and guide samples in desired directions within microfluidic channels. On our “EZ Chip”, we utilized the interfacial force generated by EZs to transport specimens across streamlines without the need of an off-chip power source. The advantages of easy-integration, low fabrication cost, and no off-chip energy input make the EZ suitable for independent, portable lab-on-chip system applications.

1. Introduction

The characteristic water molecular interactions within interfaces have been studied across a broad range of fields—e.g., nanoengineering, intracellular molecular motility, and protein folding. For instance, related research has revealed that reduced intracellular water mobility interoperated with polarized water layers formed within a cytoplasm [1,2]; ordered water molecules result in the oscillatory salvation force at liquid–solid interfaces [3,4]; and interfacial forces were applied for nanoparticle assembly [5]. Moreover, structural water molecules may account for protein folding and may be involved in signal transductions in aquatic solutions [2,6,7]. Though hydrogen-bond water networks are widely recognized and appreciated on sub-micron scales, interfacial forces have not been fully explored for distances greater than one micrometer [2,4].
Solute-exclusion zones (EZs) were initially observed in the vicinity of hydrophilic surfaces [8]. The discovery that water can form several-hundred-micron-thick, ordered layers when adjacent to hydrophilic surfaces—to effectively exclude colloidal particles and other solutes hundreds of microns from its surface—opened up promising interfacial water applications within the liquid-solid phase [8]. Indeed, the concept of EZs prompted on-going investigation into novel applications of interfacial water. Within the EZ, microspheres were excluded ~600 μm from polymer surfaces at various velocities, depending on microsphere surface modifications [9]; macromolecules, such as pH indicator dyes, were excluded as well [10]. The interfacial forces generated from EZs have been well documented [8,11] near diverse interfaces with various solvent parameters, such as ion concentrations and pH, where similar phenomenon have been reported [9,12].
Molecular dynamic simulations predicted the formation of a pseudo-crystal water lattice at polymer-water interfaces [13]. Additionally, the hydration shell assembly and interfacial water clusters were proposed to interpret the formation of the exclusion force [2,14]. The energy stored within an EZ was investigated recently as well [15,16], and these studies confirmed the robust observations of EZ formation in the vicinity of various surfaces and interfaces. While the notable length scales of EZs range several hundred micrometers, herein, we applied EZ characteristics to perform basic manipulations, such as sorting, separation, and guided movement within microfluidic chip.

2. Results and Discussion

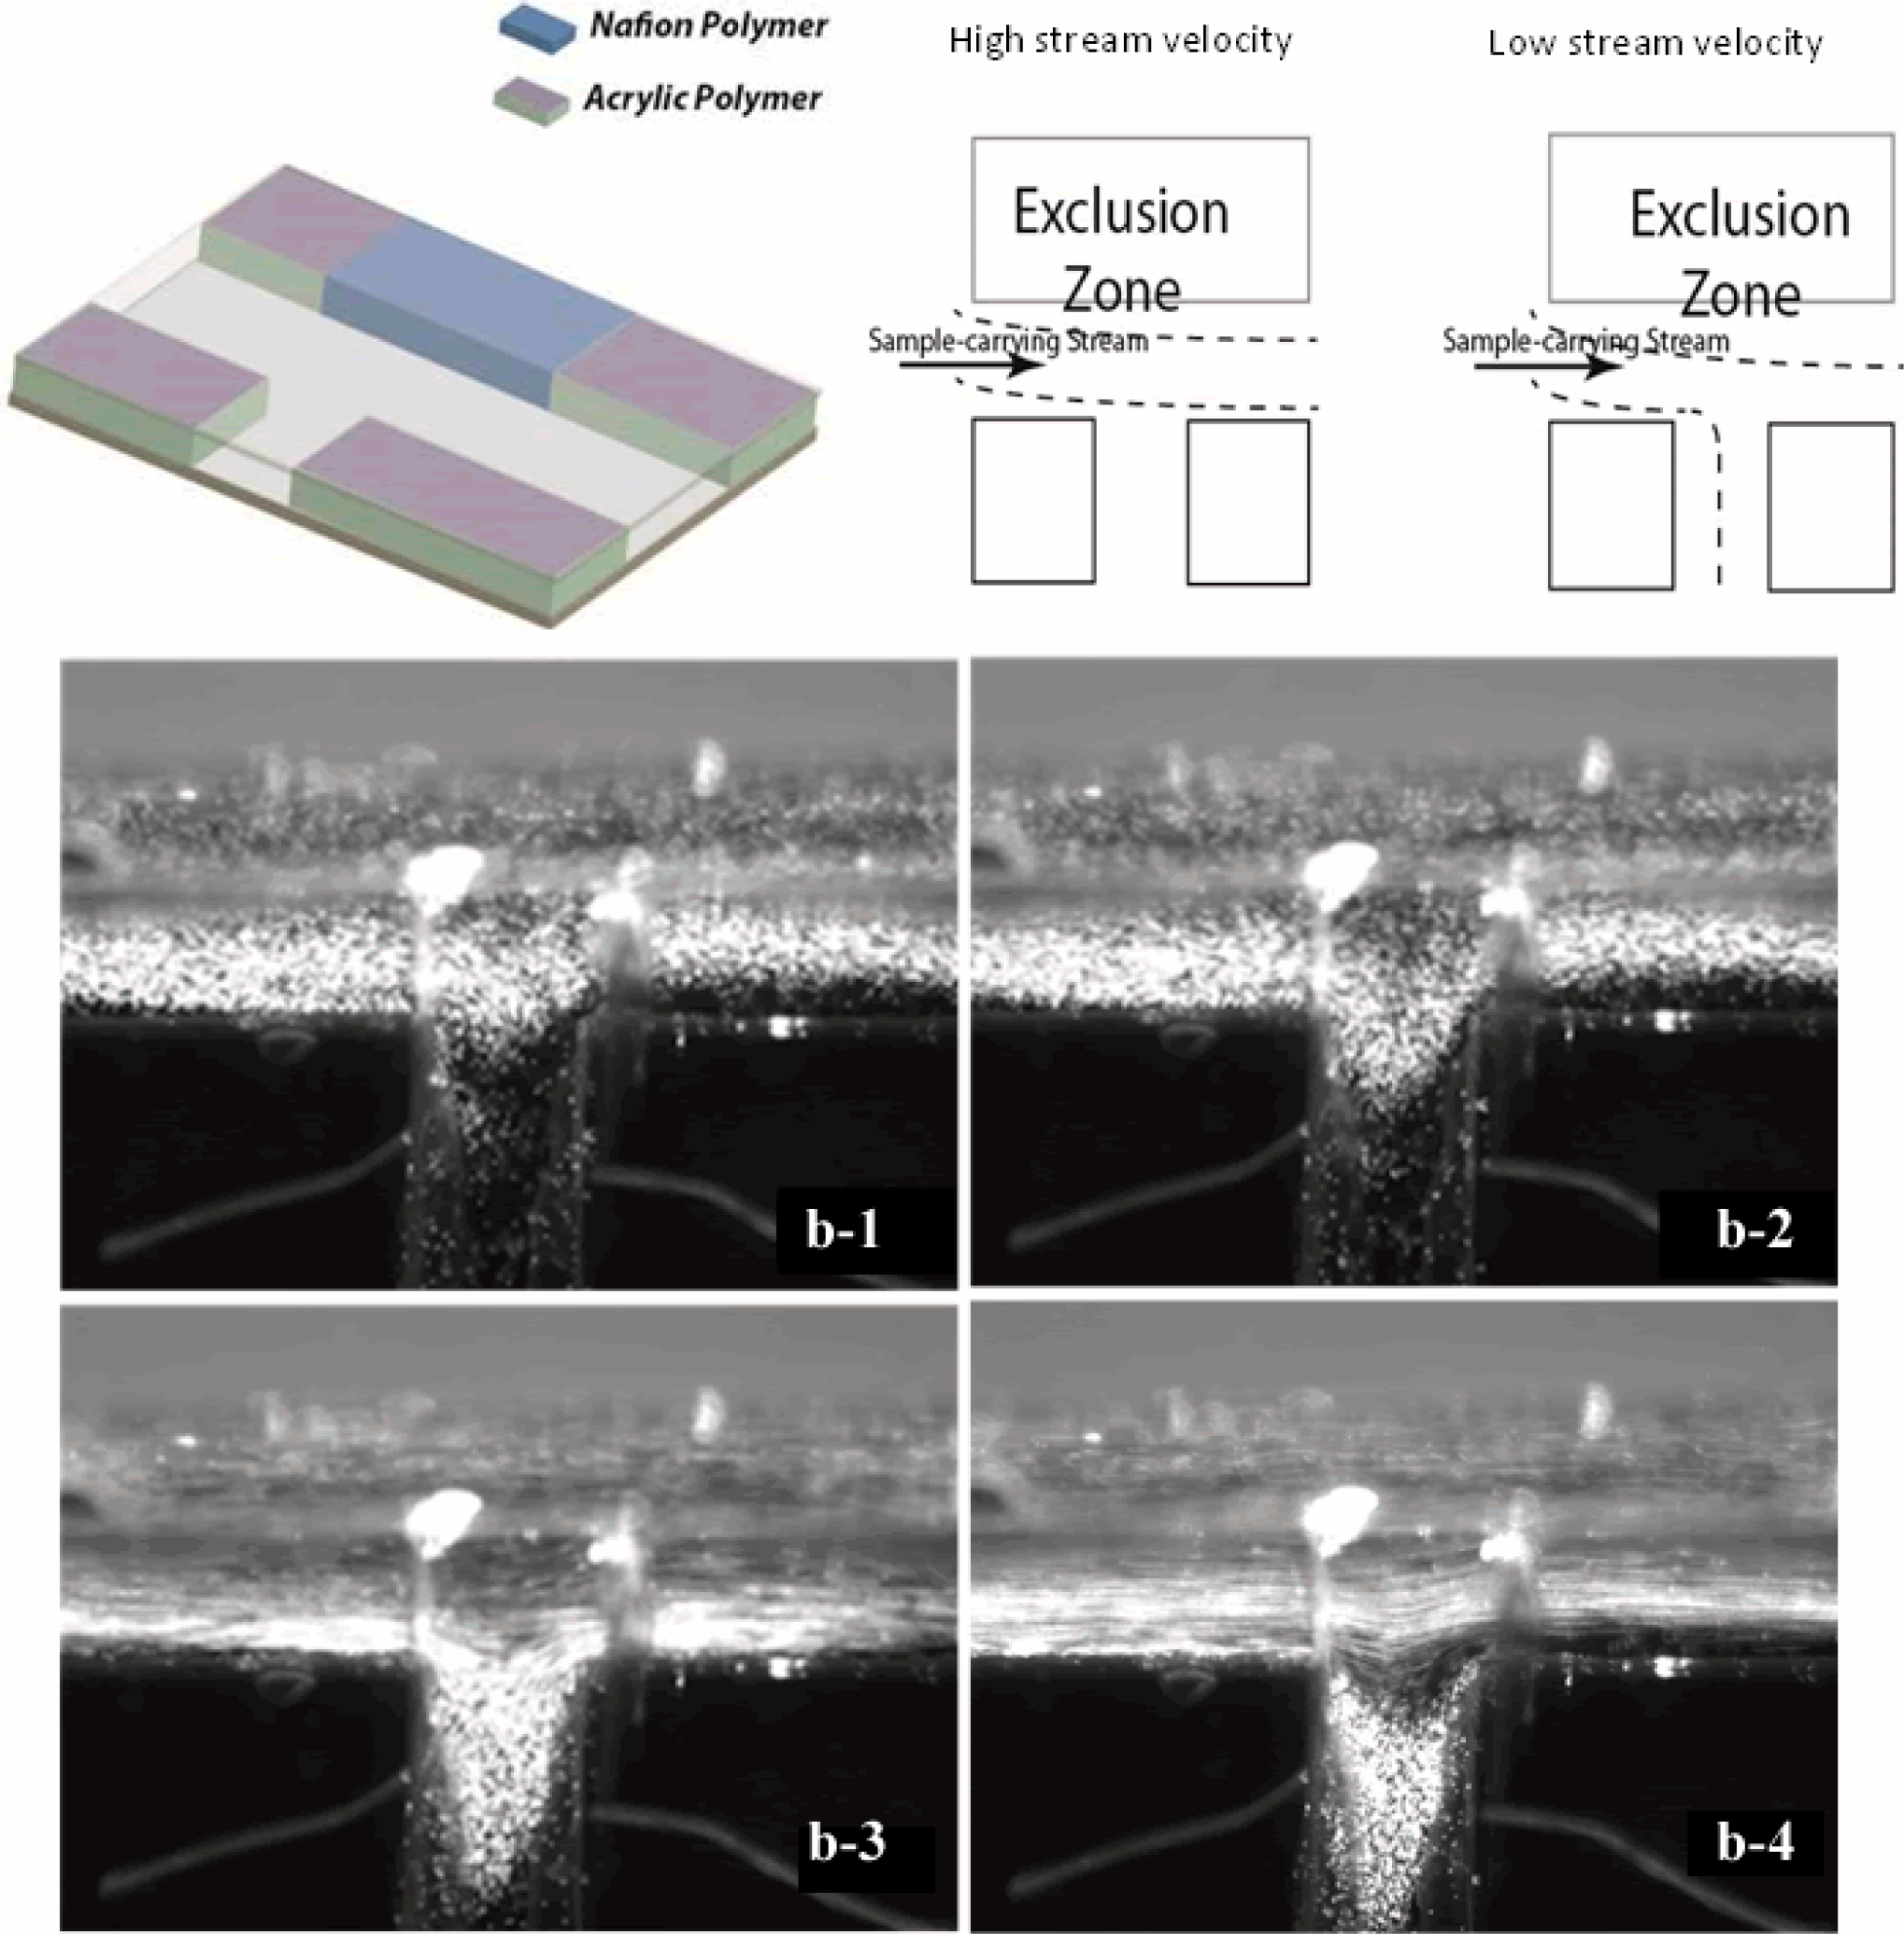
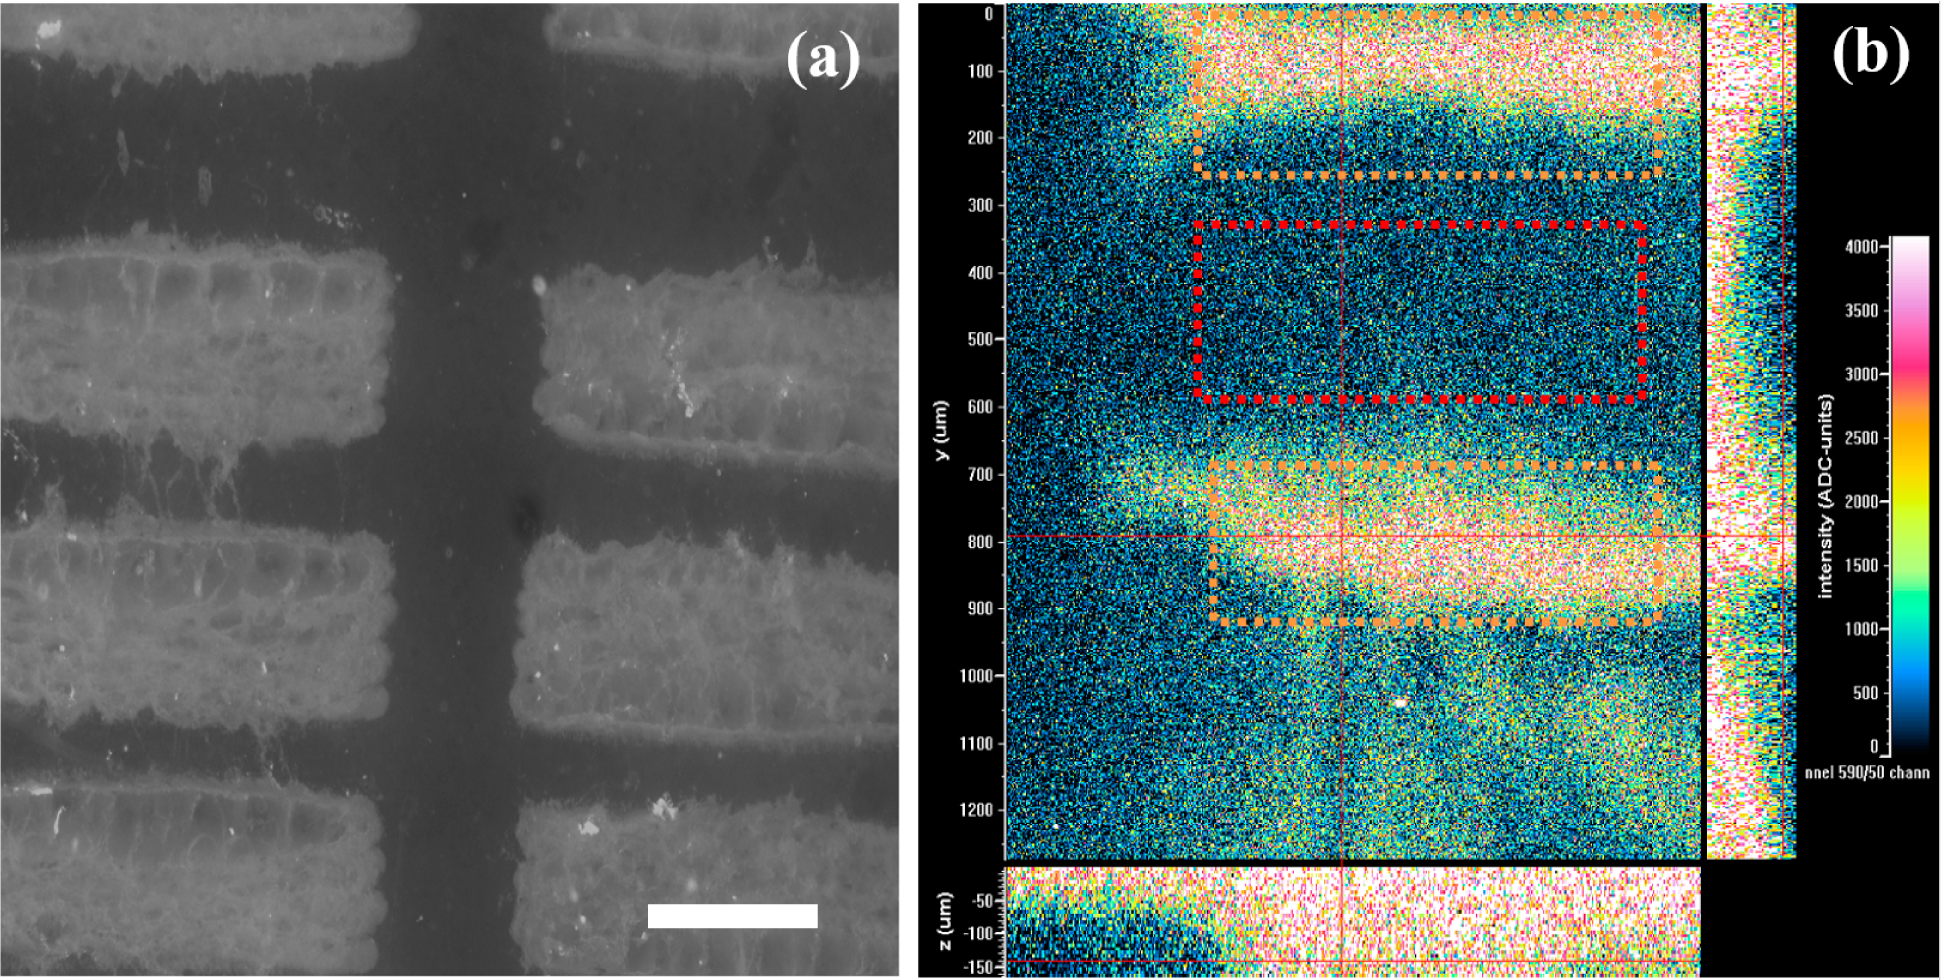
2.1. Observable Specimen Movements in Microfluidic Flow

We first demonstrated that the EZ force can drive the movement of samples in laminar flow within microchannels. Nafion 117, which has a carbon-fluorine backbone and hydrophilic perfluoro side-chains, was chosen to trigger EZ formation because it is an established means of doing so [8,11]. A straight microchannel was fabricated with Nafion 117 on one side opposite a side of acrylic polymers (Figure 1a). A specimen stream containing 0.5 μm carboxyl-functionalized fluorescent microspheres and a DI water stream were flowed through T-shaped inlets respectively, as indicated in Figure 1b.1. Here, we used a dashed line to represent the sample trajectory line. We observed that, in the presence of EZs, fluorescent microspheres moved perpendicular to the stream direction. Without off-chip energy input, our data showed that microspheres were continuously excluded from the Nafion surface (Figure 1b.2).
By changing channel geometry and flow rate, we demonstrated that the redistribution of microspheres was adjustable (Figures 1b.3 and 1b.4): In contrast to specimens transported at high velocity (~5 mm/s, Figure 1b.3), more microspheres were excluded into the DI stream at lower velocity (~0.5 mm/s, Figure 1b.4). In general, even when carried in dynamic water flow, specimens remained in an EZ. There are several alternative mechanisms in the established literature to explain the fundamental driving forces of EZs [9,11,17].
However, because our study focuses on the microfluidic applications of the EZ, it does not favor/support any particular EZ mechanism over another—and any discussion here of associated mechanisms remains speculative. Instead, our study focuses on applying the EZ to practical microfluidic manipulations. We consider that because the continuous flow passes the Nafion surface—where the microspheres stay in the EZ for only seconds—the contribution of gel dissolution and polymer brush effects can be eliminated in our system. Our data support that EZs exist in the laminar flow. We therefore can speculate that similar liquid-crystalline properties may contribute significantly to the EZ formation in dynamic flow [18]. However, considering the high diffusion coefficient of monovalent ions, the contribution of diffusiophoresis in dynamic EZ formation should be considered as well [17]. Indeed, additional studies are warranted to determine whether the laminar flow can carry the formed EZ structure, or whether EZs form dynamically during flow passing Nafion surfaces.
To evaluate particle movement using varying flow rates and flow path lengths, fluorescent microspheres that passed an EZ were collected from the T-shaped outlets. Microsphere concentrations were then quantified using spectrofluorophotometery. The EZ’s efficacy was evaluated by using:
Lateral  displacement = I out 2 I out 1 + I out 2
where Iout represented the microsphere concentration from the T-shape outlet streams. Spectrofluorophotometeric data indicated that more than 50% of microspheres were excluded from the EZ, and pushed across the interfaces between streams in ~6 s (Figure 1c). In the control group, some microspheres escaped from the sample-carrying stream into Outlet 2, which could have been caused by diffusion occurring at stream interfaces or by an undesired microchannel layout. Without an EZ, at low Reynolds number conditions (Re = 3~30) based on diffusion alone, it should have taken ~14 h for 0.5 μm microsphere to travel through a 200 μm-wide channel. Here, without off-chip energy input, we demonstrated that an EZ can drive microspheres through streamline interface boundaries to travel hundreds of microns in seconds. Our results indicate that design parameters such as flow velocities and EZ geometry can be applied to adjust the magnitude of the EZ influence.
Within microchannels, without active manipulations, cross-channel solute transportation is mainly dominated by diffusion, which is less efficient as solute size increases [19]. In order to increase the efficiency, many active approaches have been developed, including methods such as electrokinetics, optical manipulation, and ultrasonic agitation [19,20]. However, the requirement of off-chip energy sources can greatly jeopardize the portability and self-sustainability of lab-on-chip systems [20]. Our data support the potential capability of EZs to serve as embedded power sources, thereby presenting an alternative approach to microfluidic system operation. EZ Chips may serve as a starting point to build highly-flexible, easily-integrated, and low cost lab-on-a-chip devices—all without the need of an off-chip power source.

2.2. EZ Chip: Mixing, Separating, and Guiding

In this study, we expand on the solute-repelling capacity of the EZ to drive diverse sample manipulation. With specific microchannel designs, many fundamental “operation units” were included on our EZ Chips. When we considered the needs for clinical applications to assess dilute samples, the possibility of an EZ biological sample concentrator was examined (Figure 2a). To address this conceptually, fluorescent-labeled murine fibroblast cells were first suspended in Dulbecco’s phosphate buffered saline solution and then flowed into the EZ Chip.
Within the designed EZ concentrating region, the cells were excluded by EZs on both side channels. The result was an observable concentration of fibroblast cells in the middle of the microchannel within 30 s (Figure 2b).
Compared to abiotic samples—e.g., plastic microspheres and molecular dyes [8,9,11]—we demonstrated a proof of concept that EZ microfluidic effects may be applicable to biotic samples, which broadens the applications of EZs to clinic assays if additional attention is given to relevant parameters (e.g., survival rates). Therefore, because this experiment served only to demonstrate a biological concentrator conceptually, we speculate that future studies may determine if EZs can contribute to a range of mammalian cell assays. These studies can help determine, for instance, if EZs may be utilized to separate cells from serum in blood samples.
We then utilized EZ Chips to perform a widely-applied function: particle separation. Pre-mixed microspheres (diameters of 2 μm and 15 μm) were flowed through a fabricated EZ-sorter. To create the EZ-sorter, we utilized Nafion on one channel wall to generate an EZ across the channel (Figure 2c). A previous study demonstrated that microspheres with different diameters experience different exclusive forces in a static EZ [9]. We confirmed similar results with our EZ-sorter: In laminar flow, we observed that 2 μm microspheres showed larger excluded movement than 15 μm microspheres. To quantify the separation efficiency, we used a nestled DI water stream to extract partitioned samples within the EZ (Figure 2c). The size distribution of microspheres collected from respective streams was analyzed using flow cytometry (LSR II, Becton Dickson, Franklin Lakes, NJ, USA). Compared to the 8% of 15 μm microspheres carried in Stream 1, only 2% of 15 μm microspheres were identified in Stream 2, which confirmed that the EZ-sorter functioned based on the microsphere size (Figure 2d). Compared to more developed sorting technologies—e.g., fluorescence activated cell sorting [21]—EZ sorting by means of particle size remains limited in its application. However, when the values of cost efficiency and system portability are taken into account, a simple particle size EZ-sorter may serve as an effective disposable microfluidic system.
Various operation units, such as dielectrophoresis electrodes and surface acoustic waves [20], have been integrated into microfluidic chips to guide specimen transport. To further broaden the potential applications of EZs to microfluidic systems, we demonstrated a primary approach to specimen manipulation with an on-chip EZ. In this system, we aimed to transport microspheres from the main channel to the side reservoir, and switched the on-off states of the solute-exclusion by controlling flow rate. The Nafion was set up at the intersection of the main channel and the side-reservoir; microspheres were carried in the stream next to the Nafion surface, and another DI water stream was introduced to serve as a liquid boundary to prevent undesired microspheres from entering into the side-reservoir (Figure 3a). At a relatively high stream velocity (~1 mm/s), samples (0.5 μm fluorescent microspheres) passing the channel/reservoir intersection stayed in the main channel (Figure 3b-1–b-4). The transportation direction of microspheres was switched by the EZ once the stream velocity lowered to less than 150 μm/s. Time-lapse images showed the switch of microsphere movement; the microsphere flux started to cross the DI barrier to enter into the reservoir when the stream velocity was below 150 μm/s (Figure 3b-1 and Figure 3b-2). Once the stream velocity increased again, the samples in the reservoir were effectively trapped, isolated from samples in the main channel (Figure 3b-3 and 3b-4).

3. Experimental Section

Considering that an easily-accessed and low-cost fabrication process can facilitate the general use of microfluidic systems [22,23], in this study two methods that met these criteria were applied to fabricate the polymer-based EZ Chips. The first method was mechanical shearing. A low-cost mechanical shearing fabrication protocol, which provides sub-millimeter resolution, was applied to etch microchannels on polymer films directly [24]. EZ Chips can be rapidly prototyped using this method, which also provides flexibility to fabricate microstructures on various polymeric materials. Nafion polymer sheets (Nafion 117, Sigma Aldrich, St. Louis, MO, USA), with their carbon-fluorine backbones and hydrophilic perfluoro side-chains, were chosen to trigger EZ formation because they are an established means of doing so [8,11].
In EZ Chips, double-sided tape (3M Crop, St. Paul, MN, USA) was chosen to serve as construction layers. Polydimethylsiloxane (PDMS, Sylgard 184 silicone elastomer kit, Dow Corning, Midland, MI, USA) was temporarily adhered to the top of the device as tubing connectors [25]. In our second method, low-power laser (VesaLASER 2.30, Universal Laser systems, Scottsdale, AZ, USA), was used to address the desired EZ patterns in specific regions. This method allowed selective “deactivation” of the polymer surface (Figure 4a), as we observed that Nafion regions treated by the low-power laser lost the ability to form EZs adjacent to the treated surface. Laser scanning confocal microscopy was used to assess 3-dimensional EZs created by laser-patterned stripes on the Nafion surface. By suspending fluorescent microspheres in solution, we observed that specimens halted in the 200 μm-wide laser-patterned regions and formed clusters inversely correlated to the patterned surface (Figure 4b). This data suggested that, after Nafion surface deactivation, the Nafion surface lost the capacity to trigger EZs. Both methods provided high flexibility for EZ Chip designs and further extended the applications with a simple and low-cost fabrication processes.
In order to quantitatively monitor the exclusion ratio under different flow rates, stream velocities were controlled by a dual-channel syringe-pump (KD Scientific, Holliston, MA, USA). Fluorescent microspheres (Bangs Laboratories, Fishers, IN, USA) were used as representative samples, and the microsphere concentrations were quantified using spectrofluorophotometery (RF-1501, Shimadzu, Columbia, MD, USA). In summary, pre-mixed microsphere solution (sample-carry stream) and DI water were injected from individual inlets into EZ chip as indicated in Figure 1b.1. ~1 mL sample solutions passed EZ were collected separately into microcentrifuge tube for spectroflurophotometeric measurement.
The murine embryonic fibroblast cells (Millipore, Billerica, MA, USA) were used to study the possible applicability of the EZ Chip to biological sample assays. Before flowing into EZ Chips, cells were labelled with the Cell Tracker (CellTracker Red CMTPX, Invitrogen, Grand Island, NY, USA) for easy identification under the microscope. D-PBS and other cell culturing reagents were purchased from Invitrogen without specific indication. Images were acquired using epi-fluorescent microscopy (TE-2000, Nikon Instruments, Melville, NY, USA) and analyzed using image software (ImageJ, NIH, Bethesda, MD, USA).

4. Conclusions

We demonstrated how microfluidic chips (“EZ Chips”) may be manufactured to perform basic manipulations, such as sorting, separation, and guided movement within microfluidic channels. In doing so, we developed a laser ablation method for EZ Chip manufacturing. Among their many applications, microfluidic systems provide promising applications to diagnosis technologies [22]. When we consider the dearth of reliable energy sources in resource-limited regions, low-cost, disposable, and self-sustained microfluidic chips seem critically needed. Without the need of off-chip energy input, we demonstrate the feasibility of utilizing the EZ phenomenon to drive microfluidic systems, which may serve to broaden the practical applications of microfluidic systems generally. EZs can be used to drive specimens within channels using carefully design patterns, only some of which were explored in this study. Here, we demonstrated the capacity to fabricate basic functional units on an EZ Chip. With our developing fabrication protocols, EZ units can be modified at desired locations to facilitate “operation unit” integration. Although our observations remain limited to specific functions, when we consider the simplicity and compartmentalized operations carried out by EZ Chips, we posit that future EZ Chips may carry additional potential to contribute to the next generation of disposable microfluidic systems.

Acknowledgments

This work was supported in part by grants from National Heart, Lung, and Blood Institute (1R15-HL-095039), National Science Foundation (CBET-0932404), Linkou Chang Gung Memorial Hospital (CMRPD1C0031), and University of California Center for Information Technology Research in the Interest of Society (UC CITRIS) Program.

Author Contributions

Wei-Chun Chin and Chi-Shuo Chen conceived of the research subject of this paper. Erik Farr, Jesse Anaya, and Chi-Shuo Chen designed the microfluidics and carried out the experiments. Wei-Chun Chin, Chi-Shuo Chen, Jesse Anaya, and Erik Farr drafted the paper and approved the final version to be published. Wei-Chun Chin and Eric Chen contributed to the conception and critical suggestions of the paper. All authors have read and approved the final manuscript.

Conflicts of Interest

The authors declare no conflict of interest.

References

  1. Wiggins, P.M. Role of water in some biological processes. Microbiol. Rev. 1990, 54, 432–449. [Google Scholar]
  2. Chaplin, M. Opinion—do we underestimate the importance of water in cell biology? Nat. Rev. Mol. Cell Biol. 2006, 7, 861–866. [Google Scholar]
  3. Israelachvili, J.N.; Pashley, R.M. Molecular layering of water at surfaces and origin of repulsive hydration forces. Nature 1983, 306, 249–250. [Google Scholar]
  4. Israelachvili, J.; Wennerstrom, H. Role of hydration and water structure in biological and colloidal interactions. Nature 1996, 379, 219–225. [Google Scholar]
  5. Min, Y.; Akbulut, M.; Kristiansen, K.; Golan, Y.; Israelachvili, J. The role of interparticle and external forces in nanoparticle assembly. Nat. Mater. 2008, 7, 527–538. [Google Scholar]
  6. Hummer, G.; Rasaiah, J.C.; Noworyta, J.P. Water conduction through the hydrophobic channel of a carbon nanotube. Nature 2001, 414, 188–190. [Google Scholar]
  7. Tu, Y.; Xiu, P.; Wan, R.; Hu, J.; Zhou, R.; Fang, H. Water-mediated signal multiplication with y-shaped carbon nanotubes. Proc. Natl. Acad. Sci. USA. 2009, 106, 18120–18124. [Google Scholar]
  8. Zheng, J.-M.; Pollack, G. Long-range forces extending from polymer-gel surfaces. Phys. Rev. E 2003, 68, 031408. [Google Scholar]
  9. Zheng, J.-M.; Wexler, A.; Pollack, G.H. Effect of buffers on aqueous solute-exclusion zones around ion-exchange resins. J. Colloid Interf. Sci. 2009, 332, 511–514. [Google Scholar]
  10. Chai, B.; Mahtani, A.G.; Pollack, G.H. Unexpected presence of solute-free zones at metal-water interfaces. Contemp. Mater. 2012, 3, 1–12. [Google Scholar]
  11. Zheng, J.-M.; Chin, W.-C.; Khijniak, E.; Khijniak, J.E.; Pollack, G.H. Surfaces and interfacial water: Evidence that hydrophilic surfaces have long-range impact. Adv. Colloid Interface Sci. 2006, 127, 19–27. [Google Scholar]
  12. Pollack, G.H.; Chin, W.-C. Phase Transitions in Cell Biology; Springer: Amsterdam, The Netherlands, 2008. [Google Scholar]
  13. Disalvo, E.A.; Lairion, F.; Martini, F.; Tymczyszyn, E.; Frías, M.; Almaleck, H.; Gordillo, G.J. Structural and functional properties of hydration and confined water in membrane interfaces. Biochim. Biophys. Acta Biomembr. 2008, 1778, 2655–2670. [Google Scholar]
  14. Vybíral, B.; Voráček, P. Long term structural effects in water: Autothixotropy of water and its hysteresis. Homeopathy 2007, 96, 183–188. [Google Scholar]
  15. Rohani, M.; Pollack, G.H. Flow through horizontal tubes submerged in water in the absence of a pressure gradient: Mechanistic considerations. Langmuir 2013, 29, 6556–6561. [Google Scholar]
  16. O’Rourke, C.; Klyuzhin, I.; Park, J.S.; Pollack, G.H. Unexpected water flow through nafion-tube punctures. Phys. Rev. E 2011, 83, 056305. [Google Scholar]
  17. Florea, D.; Musa, S.; Huyghe, J.M.R.; Wyss, H.M. Long-range repulsion of colloids driven by ion exchange and diffusiophoresis. Proc. Natl. Acad. Sci. USA. 2014, 111, 6554–6559. [Google Scholar]
  18. Klyuzhin, I.; Symonds, A.; Magula, J.; Pollack, G.H. New method of water purification based on the particle-exclusion phenomenon. Environ. Sci. Technol. 2008, 42, 6160–6166. [Google Scholar]
  19. Pamme, N. Continuous flow separations in microfluidic devices. Lab Chip. 2007, 7, 1644–1659. [Google Scholar]
  20. Haeberle, S.; Zengerle, R. Microfluidic platforms for lab-on-a-chip applications. Lab Chip. 2007, 7, 1094–1110. [Google Scholar]
  21. Fu, A.Y.; Spence, C.; Scherer, A.; Arnold, F.H.; Quake, S.R. A microfabricated fluorescence-activated cell sorter. Nat. Biotechnol. 1999, 17, 1109–1111. [Google Scholar]
  22. Martinez, A.W.; Phillips, S.T.; Whitesides, G.M. Three-dimensional microfluidic devices fabricated in layered paper and tape. Proc. Natl. Acad. Sci. USA. 2008, 105, 19606–19611. [Google Scholar]
  23. Selimović, Š.; Piraino, F.; Bae, H.; Rasponi, M.; Redaelli, A.; Khademhosseini, A. Microfabricated polyester conical microwells for cell culture applications. Lab Chip. 2011, 11, 2325–2332. [Google Scholar]
  24. Yuen, P.K.; Goral, V.N. Low-cost rapid prototyping of flexible microfluidic devices using a desktop digital craft cutter. Lab Chip. 2010, 10, 384–387. [Google Scholar]
  25. Kim, J.; Surapaneni, R.; Gale, B.K. Rapid prototyping of microfluidic systems using a pdms/polymer tape composite. Lab Chip. 2009, 9, 1290–1293. [Google Scholar]
Figure 1. (a) Sketch of microfluidic chip. To investigate EZ effects in a microfluidic chip, acrylic polymers were used to define channel geometry, while Nafion was used to trigger the on-chip EZ. A polydimethylsiloxane (PDMS) layer was temporarily adhered to the top of the device, acting both to seal and to support the connected tubing. (b.1) Sketch of sample streams in the EZ Chip. Samples were flowed from Inlet 1, repelled by the EZ generated near the Nafion surface, and separated into the respective outlet channels. Samples were excluded by the EZ and redistributed in microfluidic channels. (b.2) Top-view image of fluorescent microsphere movement in the microchannel under the influence of an EZ. Microspheres entered the chip from Inlet 1 (bottom-left side of this image, as sketched in b.1) and flowed through the EZ created by Nafion (bottom side in this image). Image showed that microspheres carried in the stream were gradually repelled from one side to the other. (White arrow indicates the stream direction, and yellow arrow indicates the repelling direction.) (b.3; b.4) Selected images of microsphere redistribution at outlet. Under different experimental conditions (decreased flow rate, narrower channel width), the redistribution of nanoparticles changed significantly. Scale bar: 1 mm (c) EZ efficacy was tested with various flow rates and Nafion widths. Without Nafion (controls), few microspheres were observed in the outlet collection, which may be explained by the influence of convection and diffusion. Data show that, at the same flow rate, longer exposure to the EZ on 30 mm-long chips led to more microspheres being repelled when compared to 10 mm channels (holding all else constant). The results also indicate that microspheres are more strongly repelled by Nafion at slower flow rates.
Entropy 17 01466f1
Figure 2. (a) Sketch of EZ Chip for concentrating biological cells. In order to concentrate the samples, Nafion was set on both channel walls to repel samples to the center. (b) Fluorescent microscopy image of murine fibroblast cells flowed through an EZ Chip. Images showed that cells experienced an EZ force and appeared to concentrate near the center, which supports the potential for future biological applications of the EZ. Scale bar = 300 μm. Murine fibroblast cell resilience to the EZ concentrator was not assessed, which limits this application; we submit this experiment as a concept to spur research into EZ biological assays. (c) Sketch of EZ Chip for specimen separation. Microsphere mixtures were flowed into the EZ from Inlet 1. During their transport, microspheres experienced a size-dependent repelling force, and redistributed according to their size. Separated microspheres were collected from two different outlets respectively. (d) Flow-cytometry analysis of the two collected microsphere subgroups from (c). The population ratio of particles with different sizes (15 μm: 2 μm) was 1:12 from Outlet 1, and 1:50 from Outlet 2.
Entropy 17 01466f2
Figure 3. (a) Sketch of sample manipulation on the EZ Chip. An EZ was positioned at the fabricated chip’s intersection to redirect sample transport. The direction of sample transportation was regulated by stream velocity: samples move in the main channel at high stream velocities, and move to the side reservoir at low stream velocities. (b) The sample transport influenced by different flow-velocities was recorded with time-sequenced images (frame rate: 3 s per image), (b-1; b-2). By decreasing the stream velocity to ~100 μm/s, nanoparticles repelled by the EZ started to move perpendicular to the sample flow direction, and entered into the side reservoir (b-3; b-4). By increasing the stream velocity to 1 mm/s, samples were transported into the carrying stream, and samples stopped flowing into the reservoir.
Entropy 17 01466f3
Figure 4. (a) Light microscopy image of laser-etched Nafion membrane. The Nafion membrane was selectively patterned with laser etching (etched areas shown in light color, Nafion membrane in dark gray). Scale bar: 200 μm (b) 3-D section fluorescent confocal microscopy image. 500 nm fluorescent nanoparticles were added to indicate the magnitude of the EZ. Laser-etched Nafion surface was 100 μm behind the image plane. (Etched regions were marked with orange frames, and the Nafion EZ was marked with a red frame.) In the 3D confocal images, detected fluorescent intensity was presented with persuade color. Within 10 s, nanoparticles were repelled from the non-etched Nafion surface, accumulating near the etched areas. This heterogeneous distribution of nanoparticles suggested that laser-etched Nafion polymers lost the capacity to generate an EZ. The results here demonstrate that Nafion surfaces can be selectively patterned to generate exclusion zones at desired locations, which provides a means to create specialized designs (and, by extension, functions) in microfluidic systems.
Entropy 17 01466f4

