
Healthcare Teams Neurodynamically Reorganize When Resolving Uncertainty

Abstract
:1. Introduction
1.1. Background
1.2. Neurodynamic Modeling
2. Materials and Methods
2.1. Simulations
2.2. Electroencephalography
3. Results
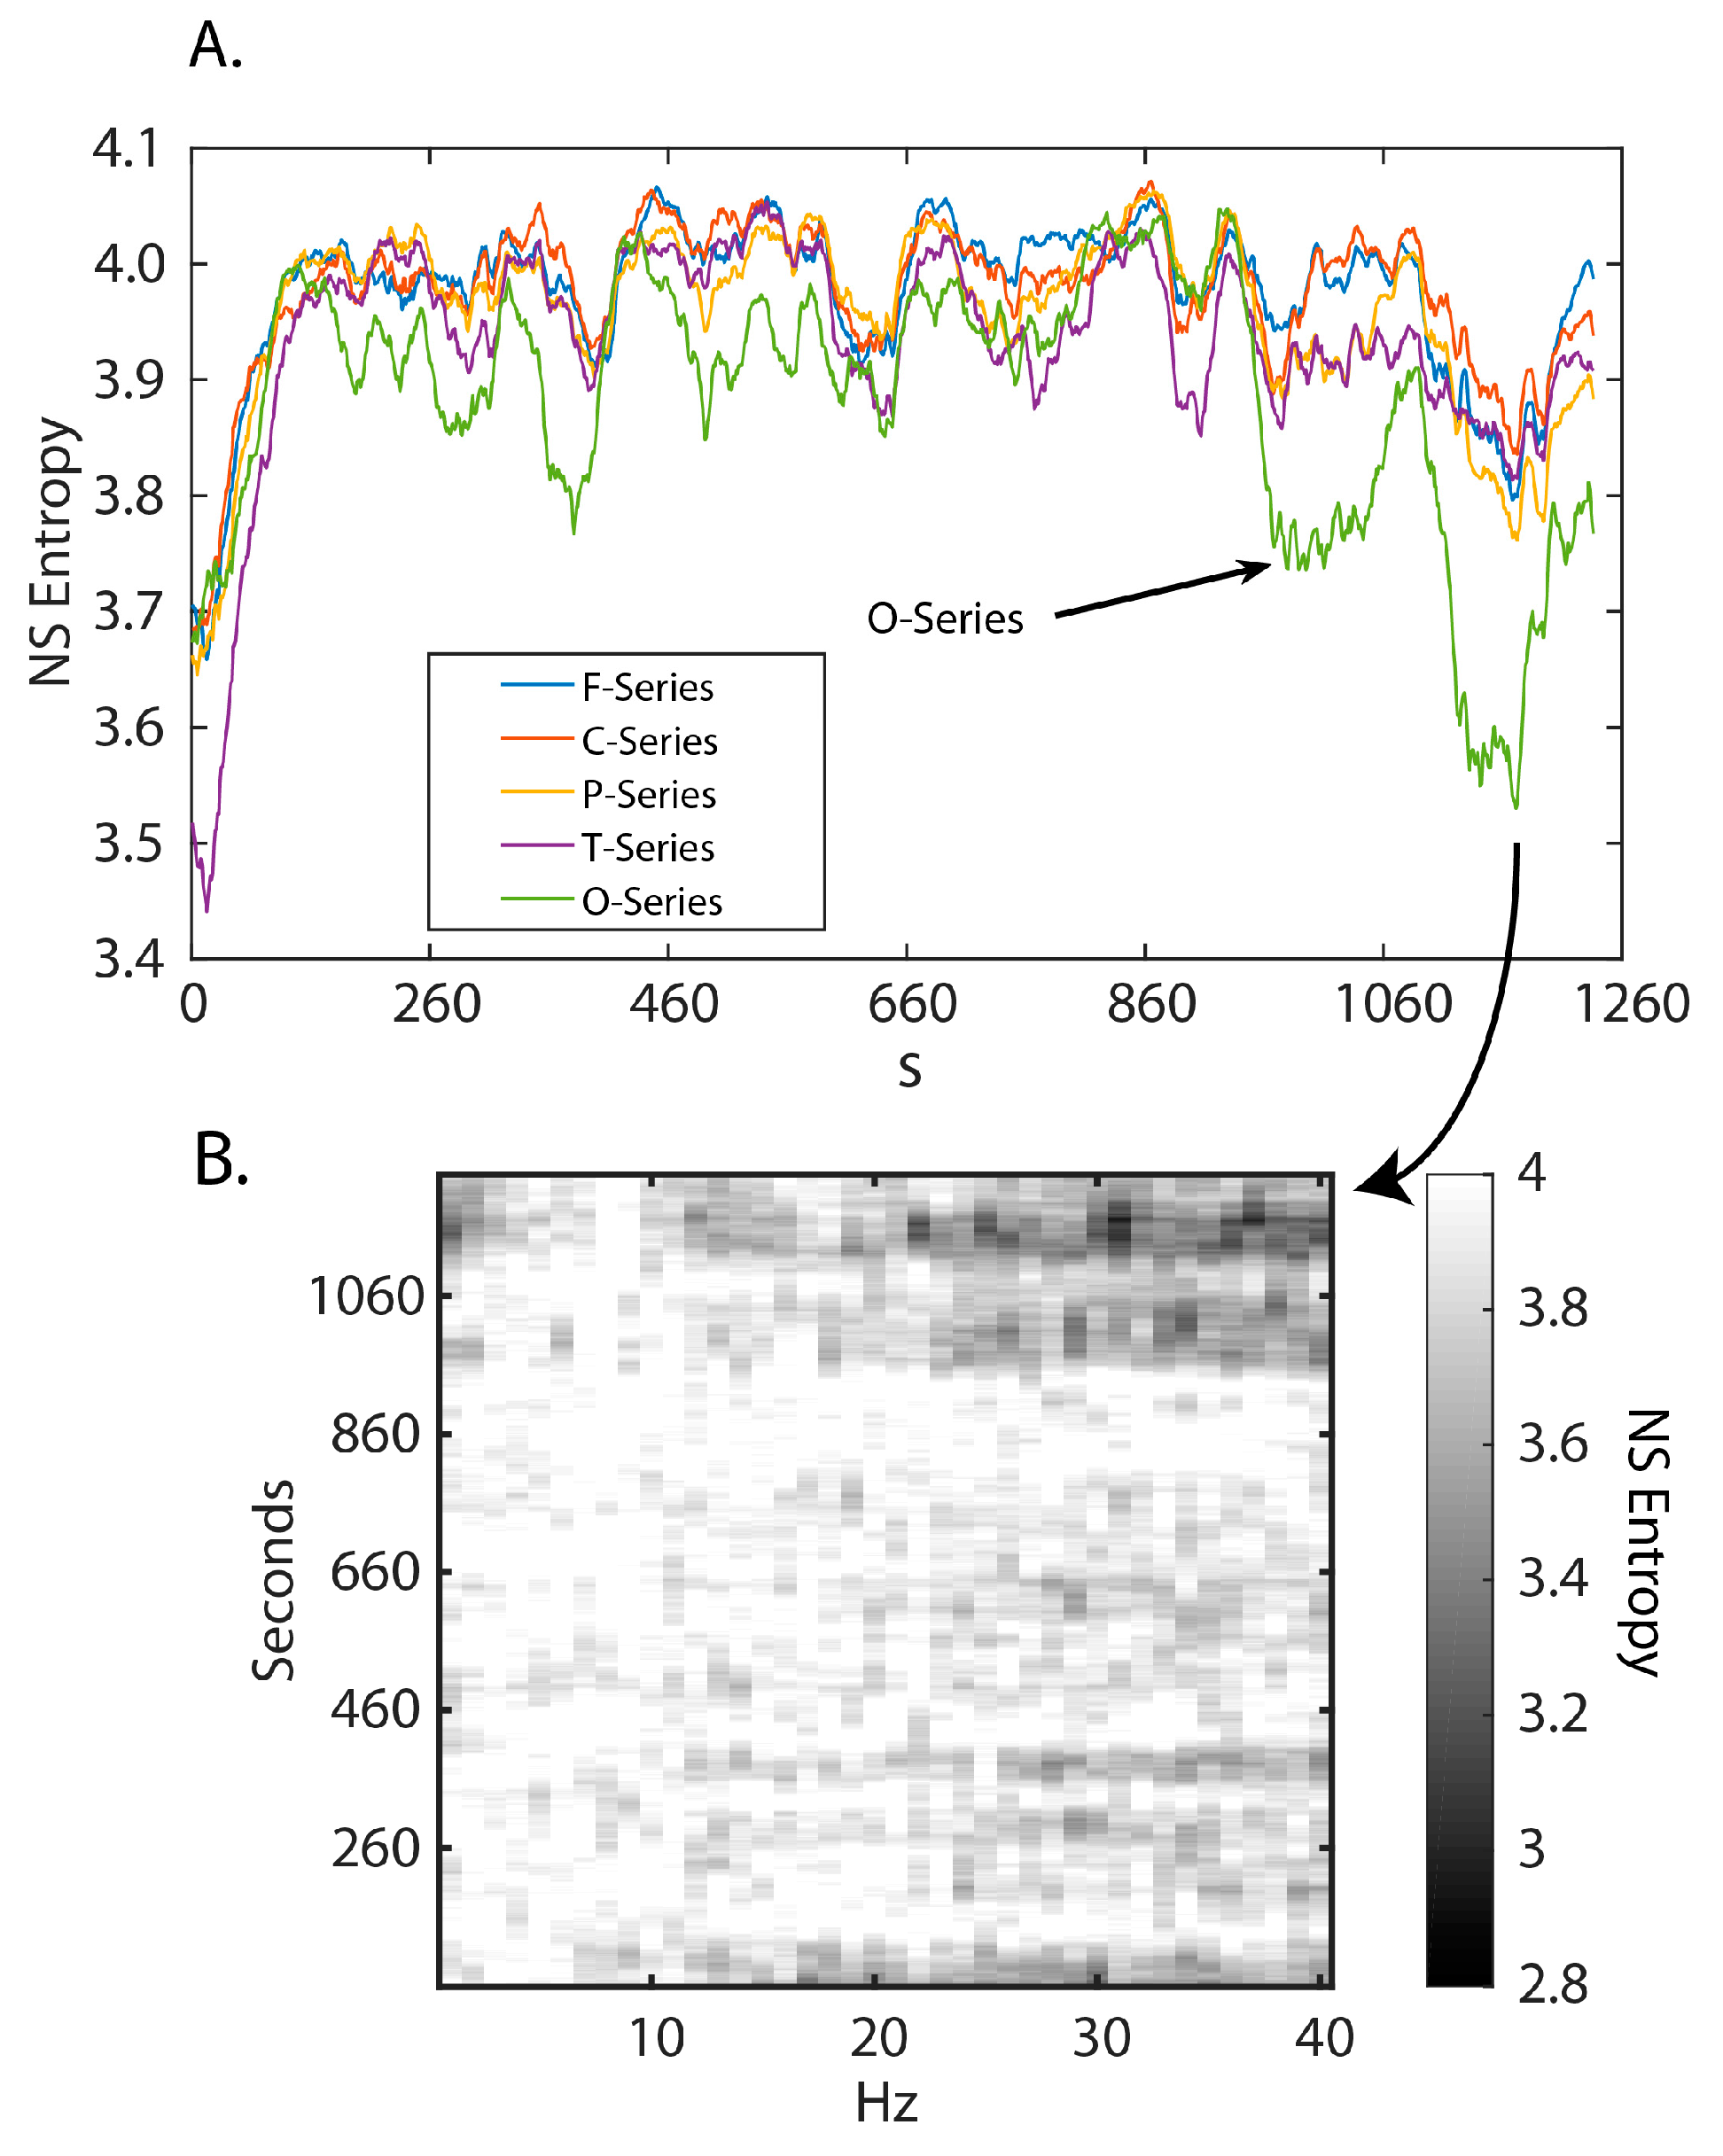
3.1. Neurodynamic Fluctuations at Different Sensor Channels
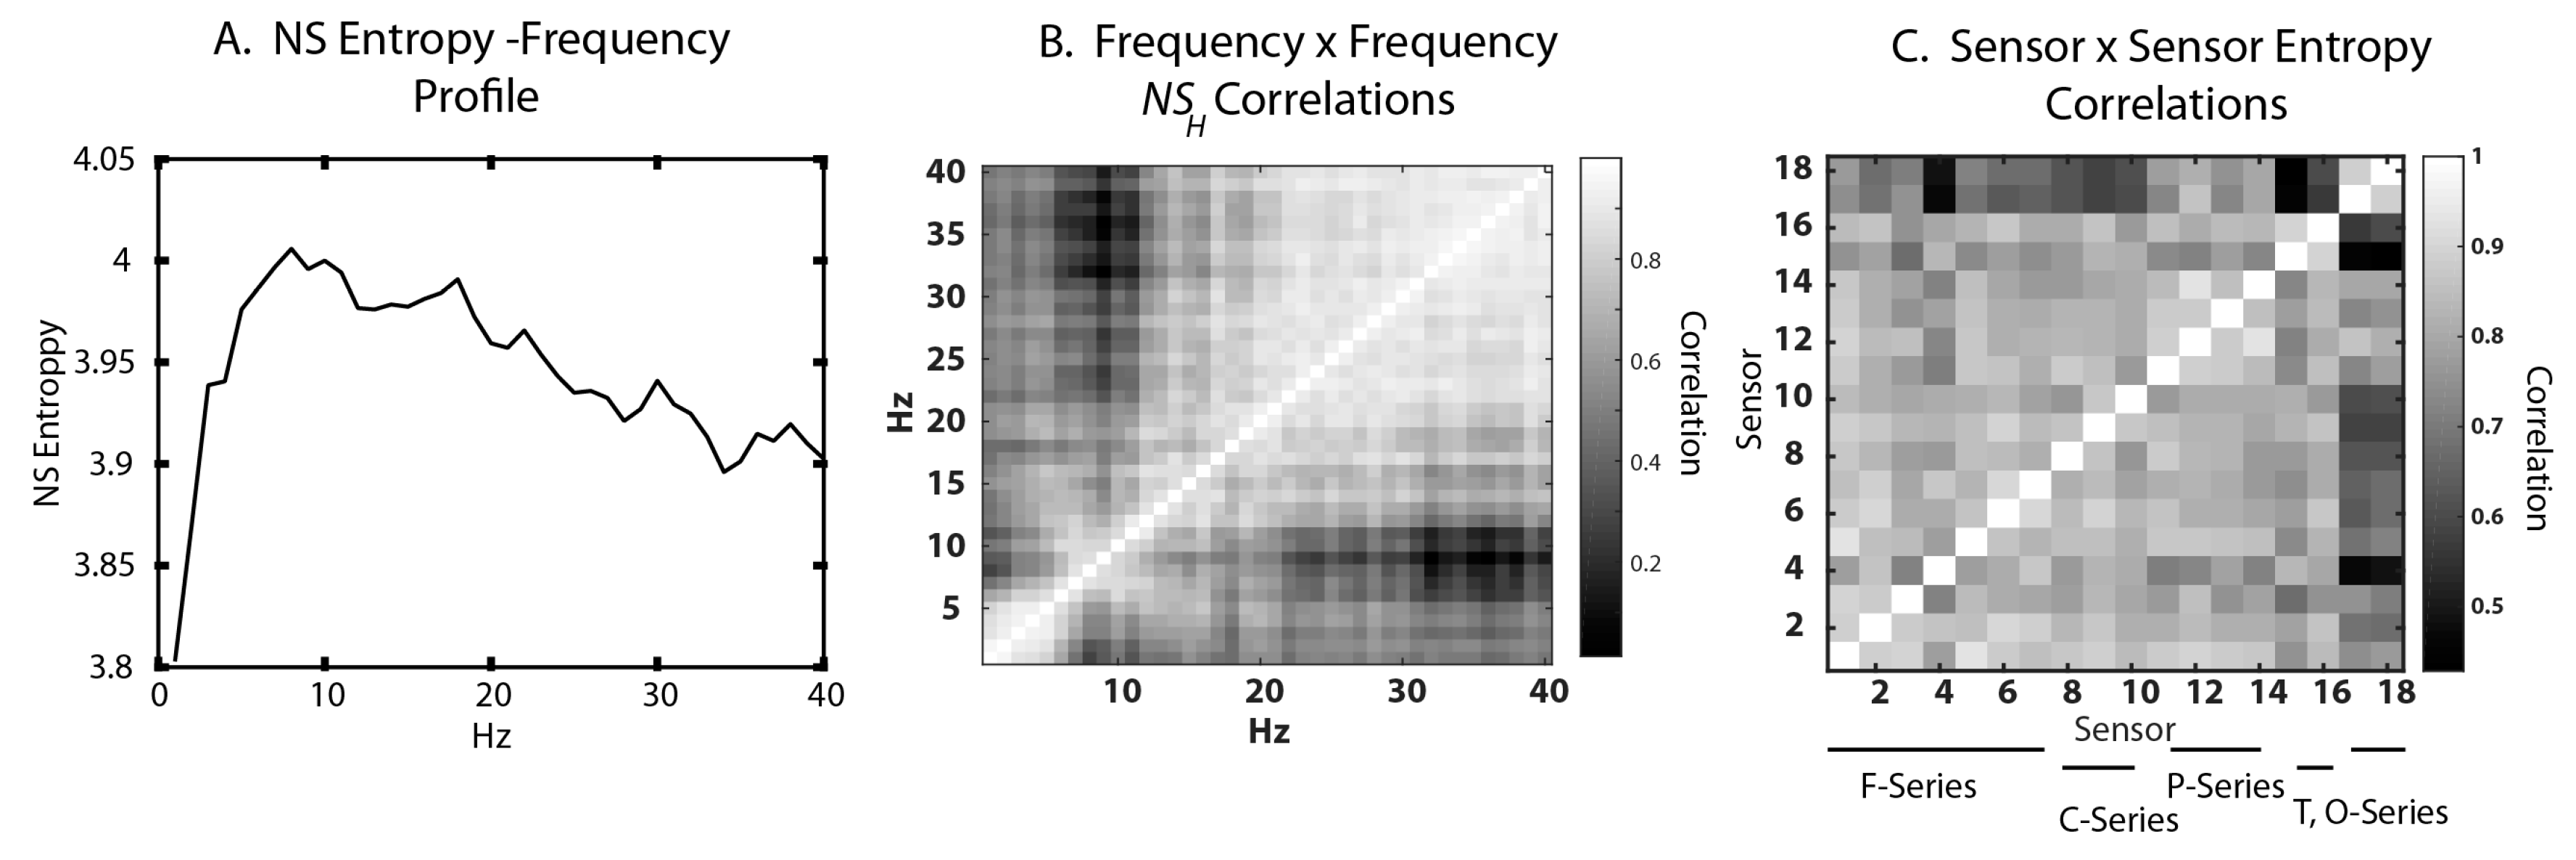
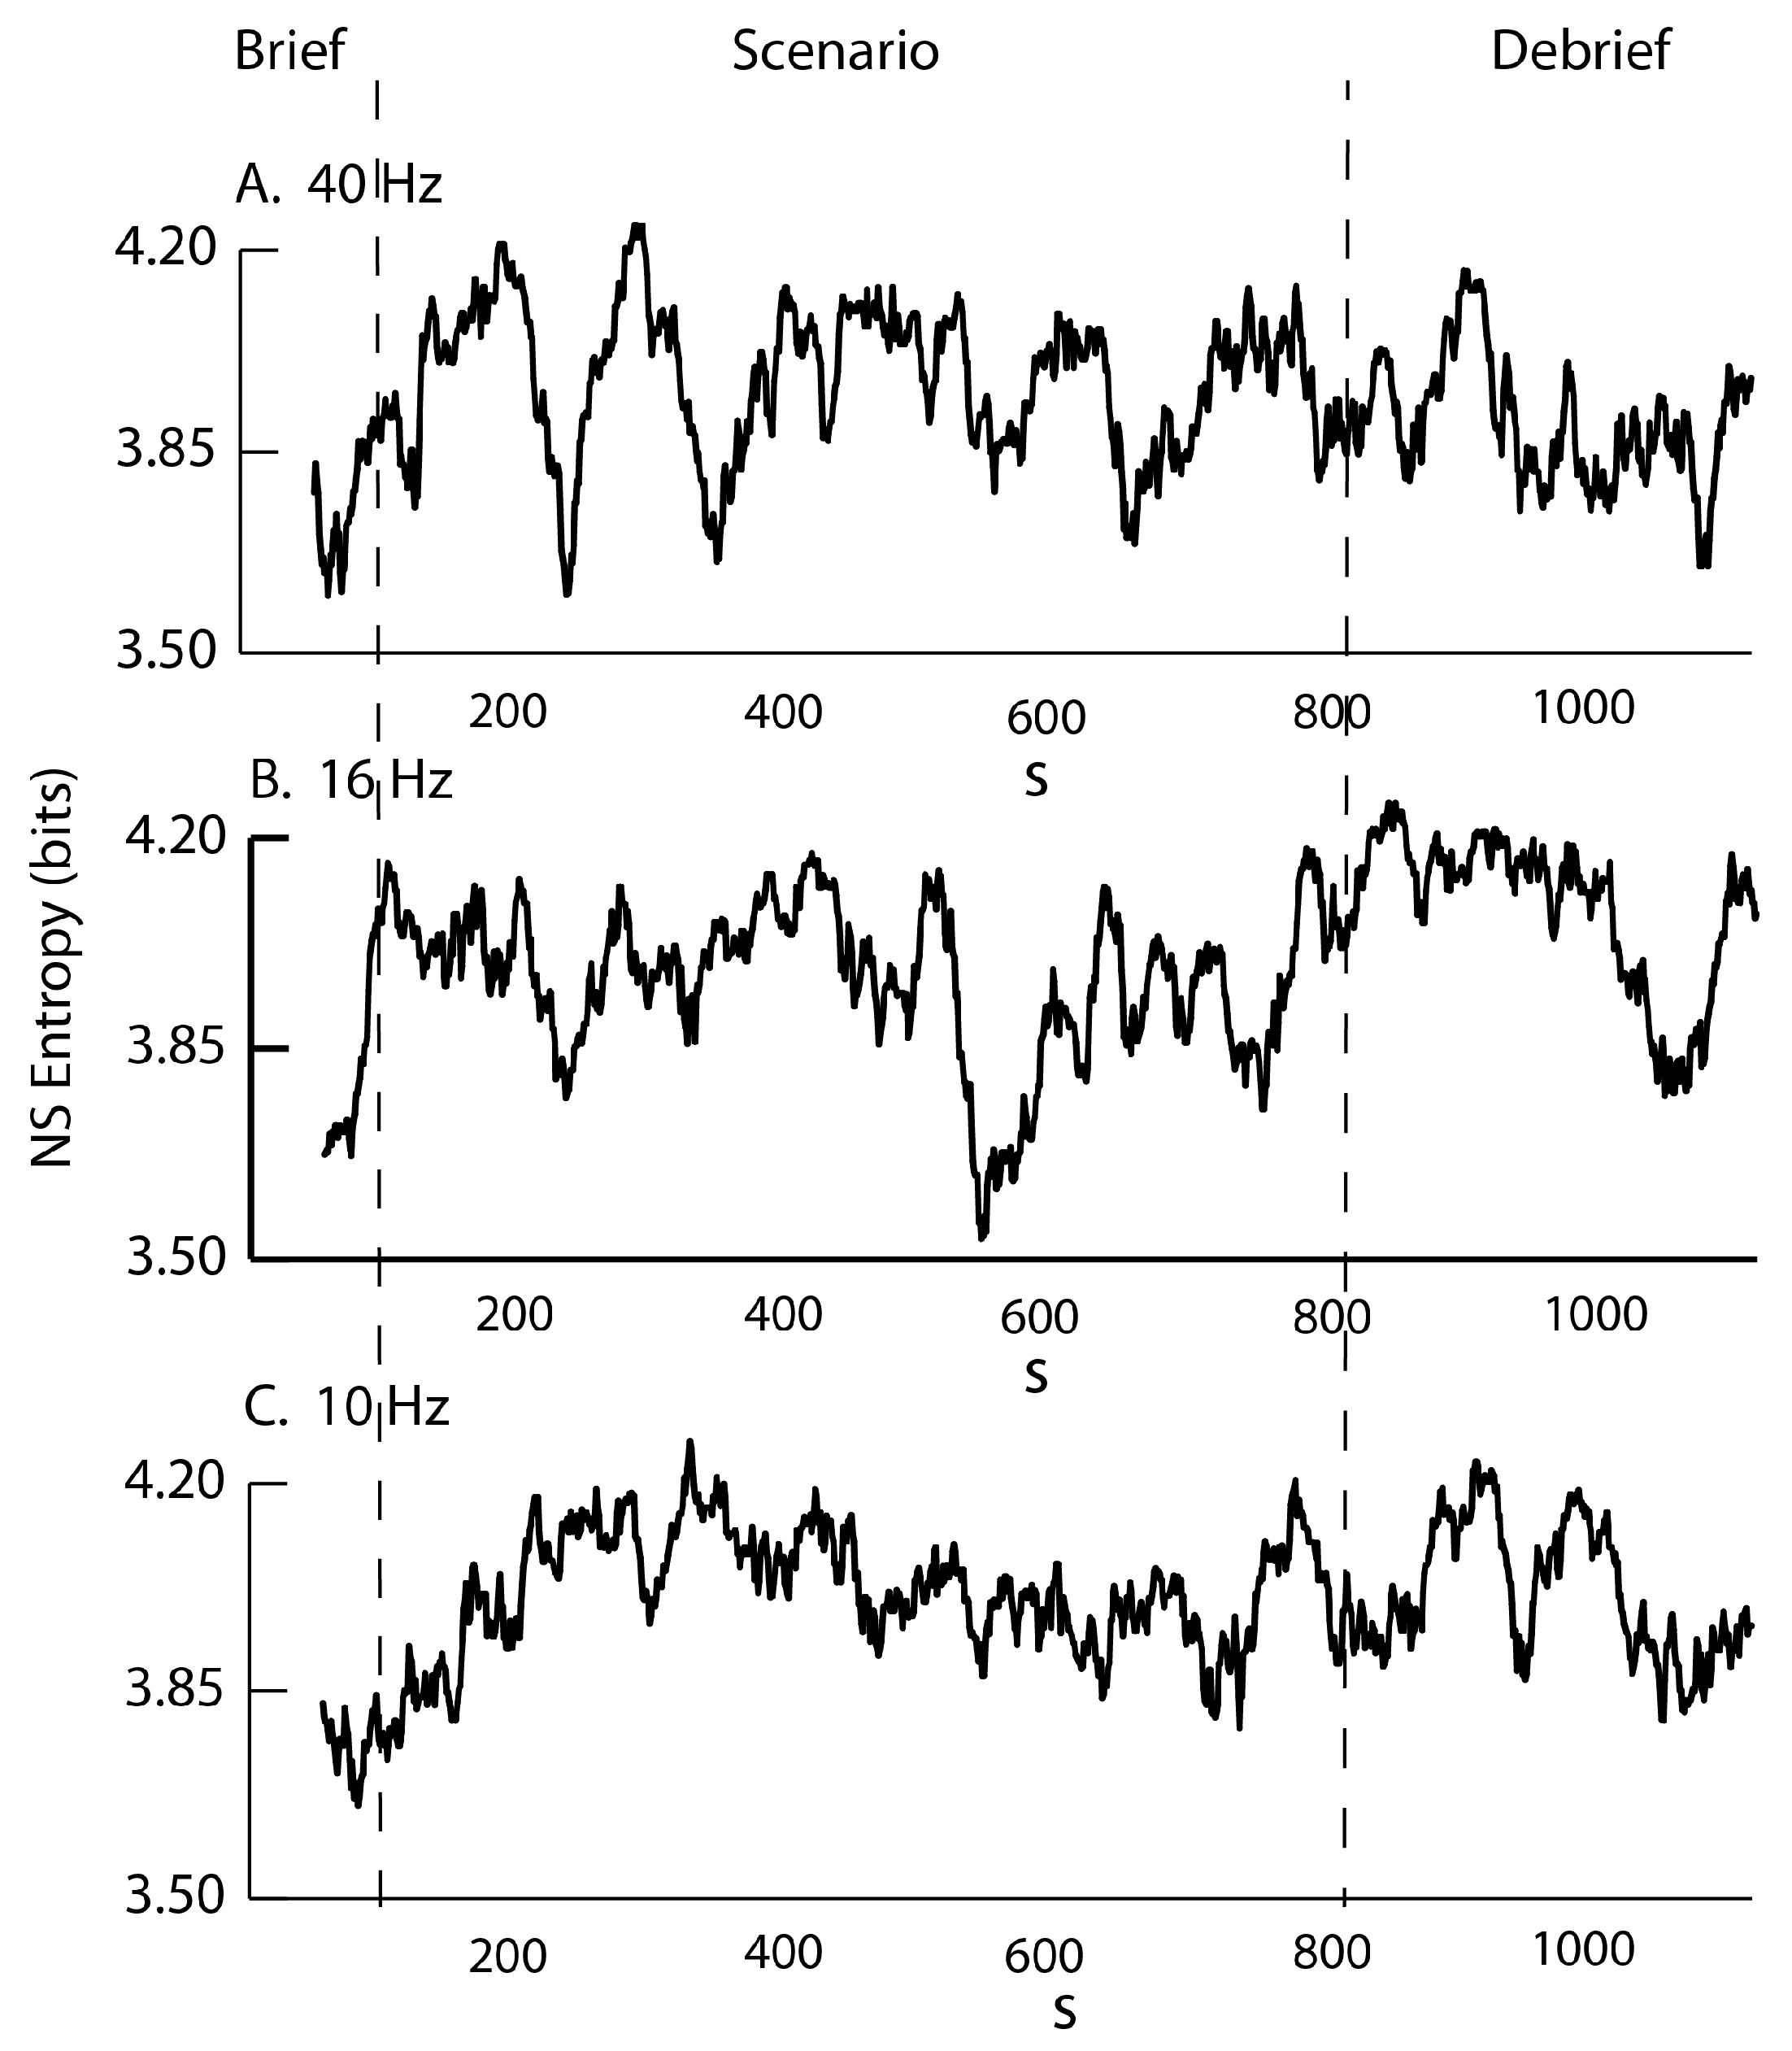
3.2. Frequency–Entropy Differences
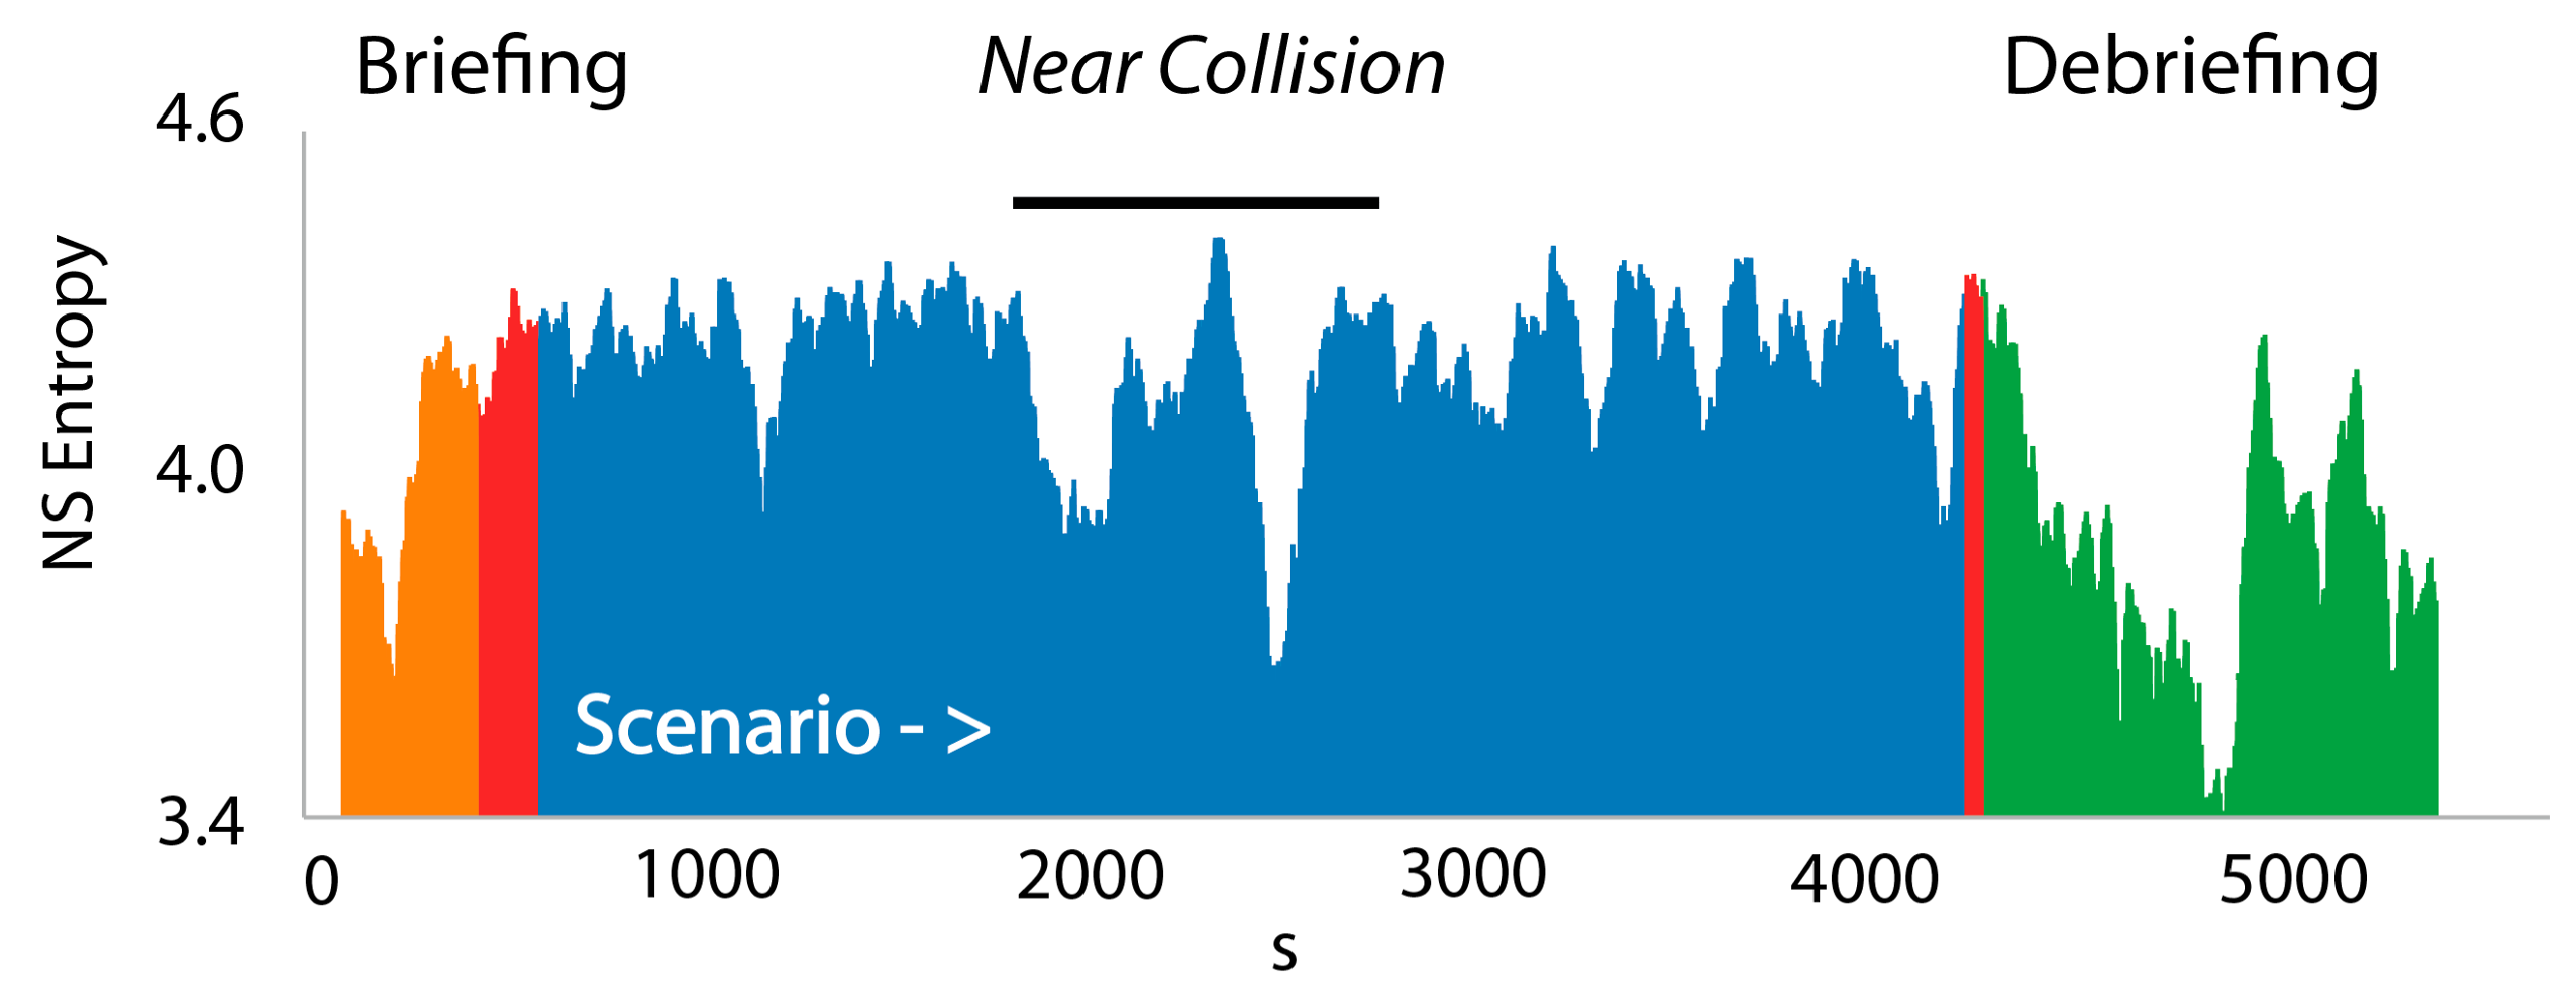
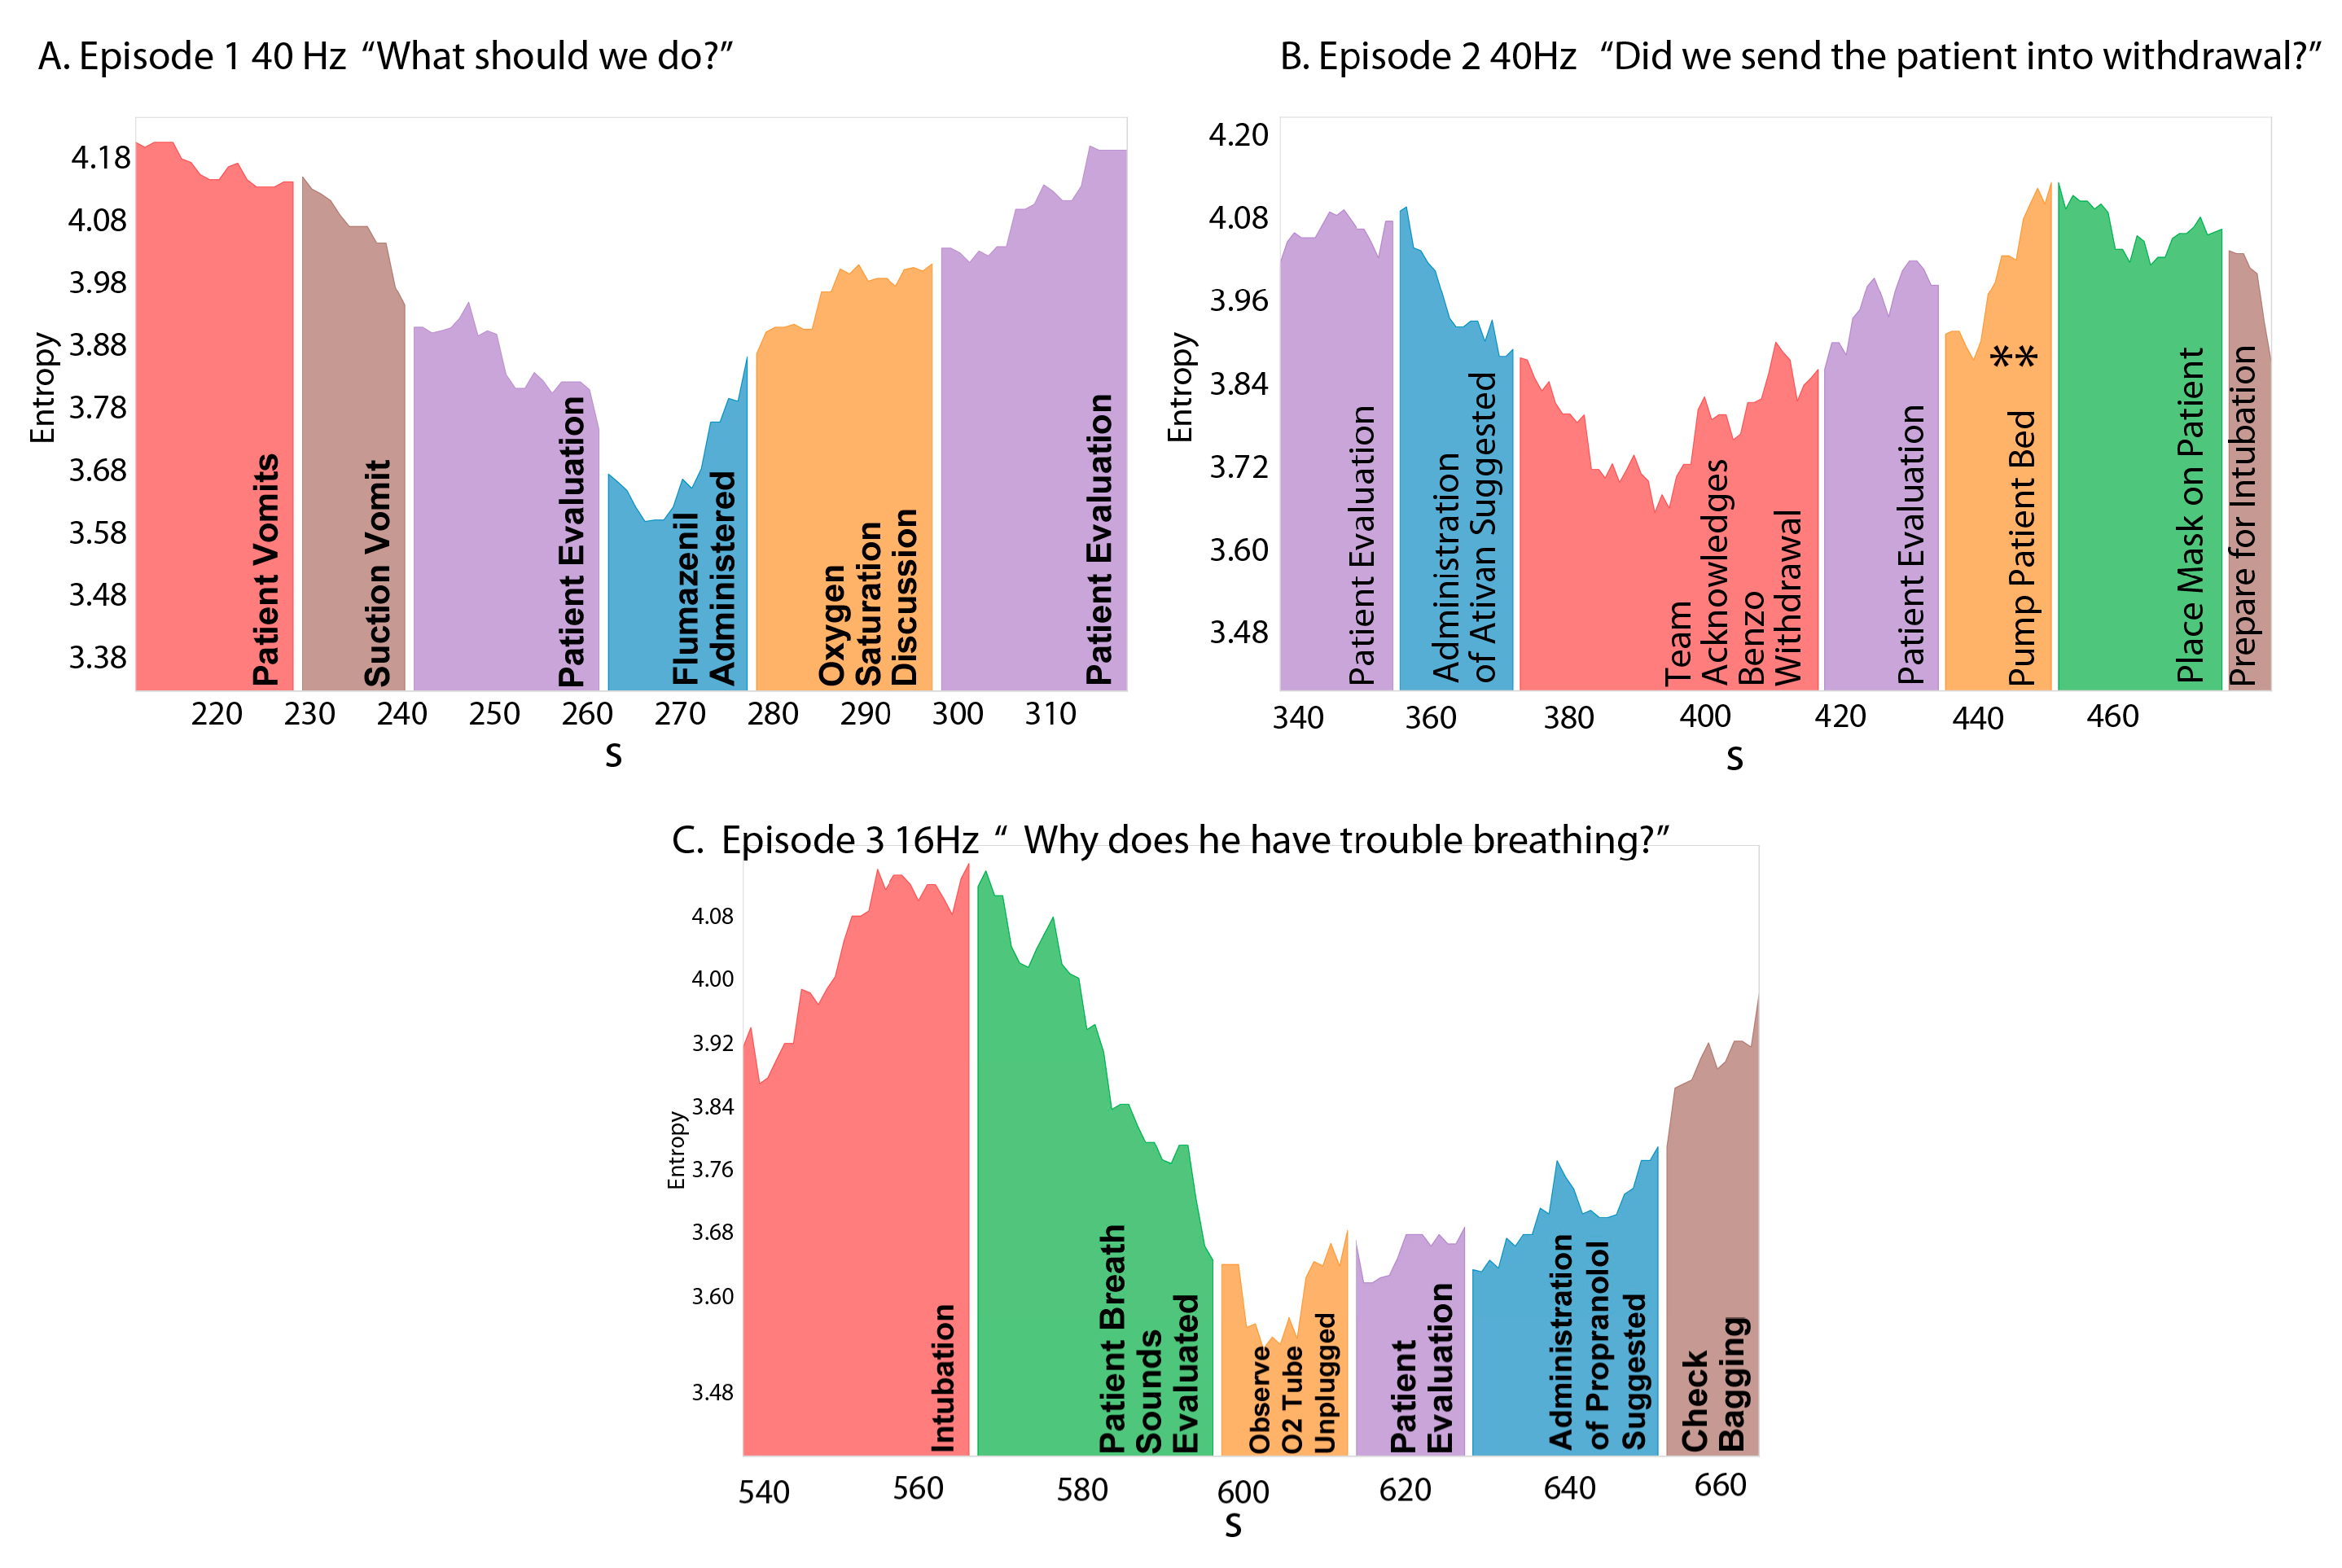
3.3. NSH Decreases Reflect Teams in the Process of Resolving Uncertainty
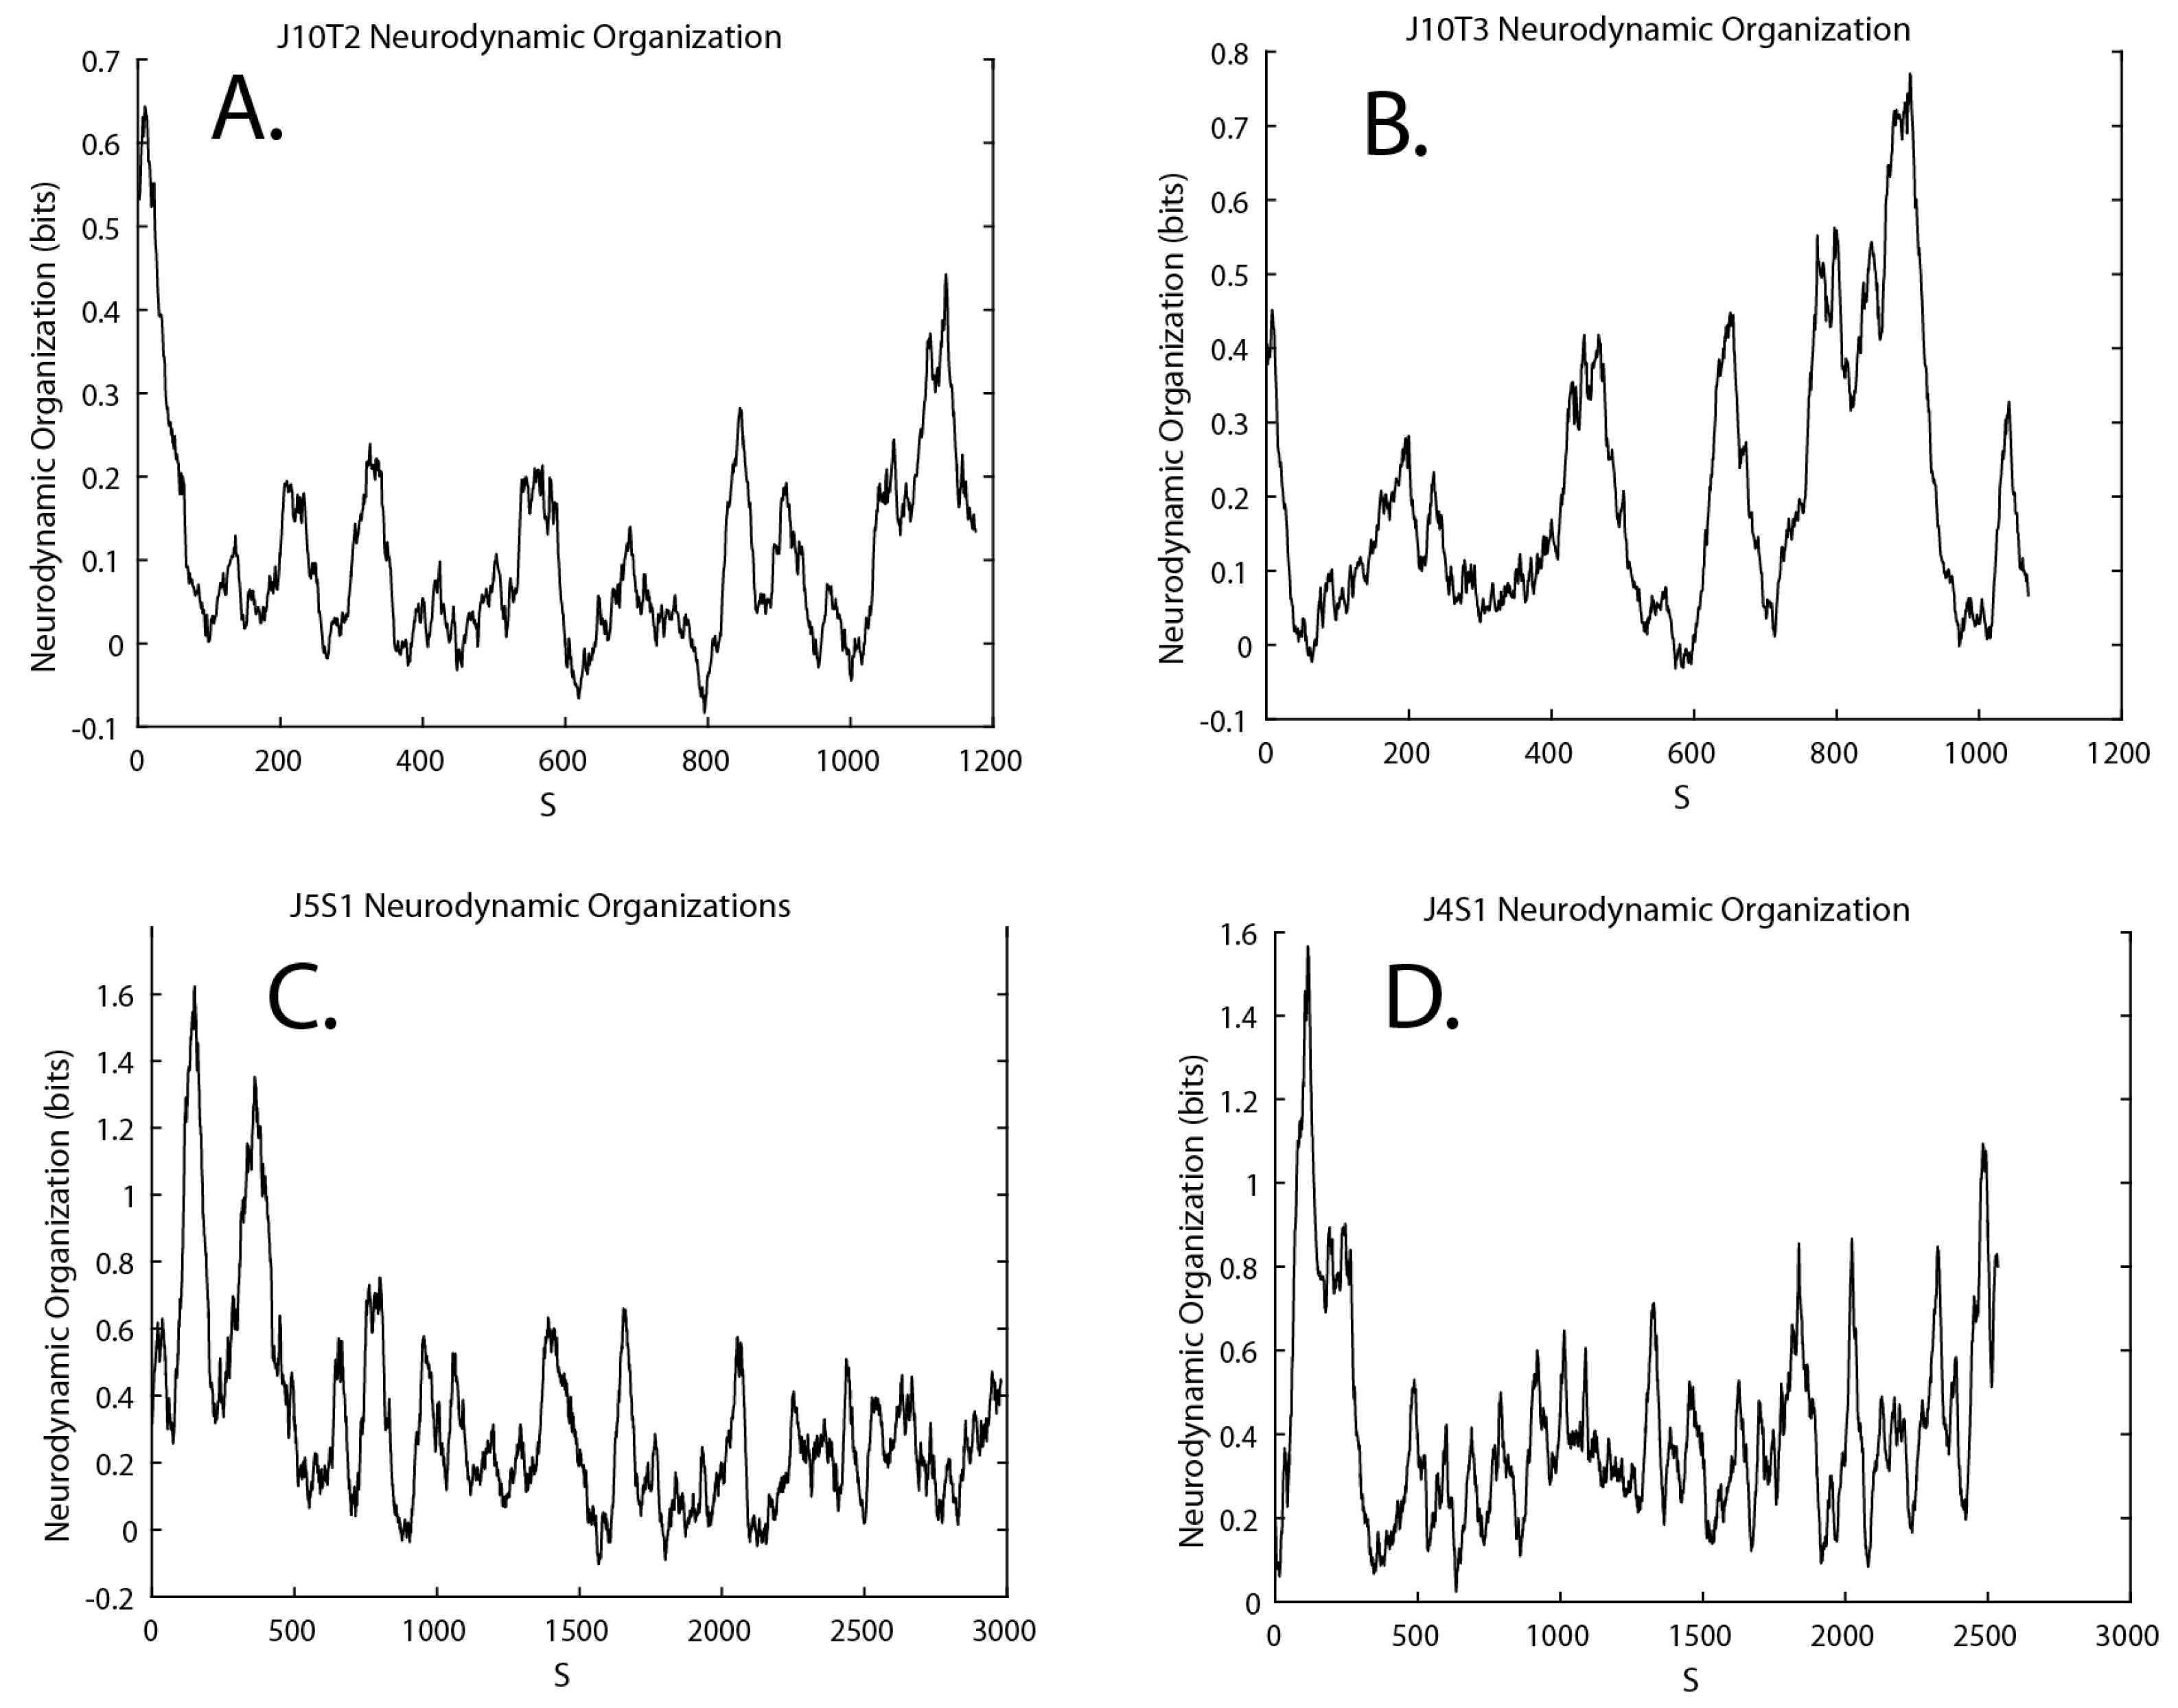
3.4. Neurodynamic Organizations
4. Discussion
5. Conclusions
Acknowledgments
Author Contributions
Conflicts of Interest
Glossary of Terms
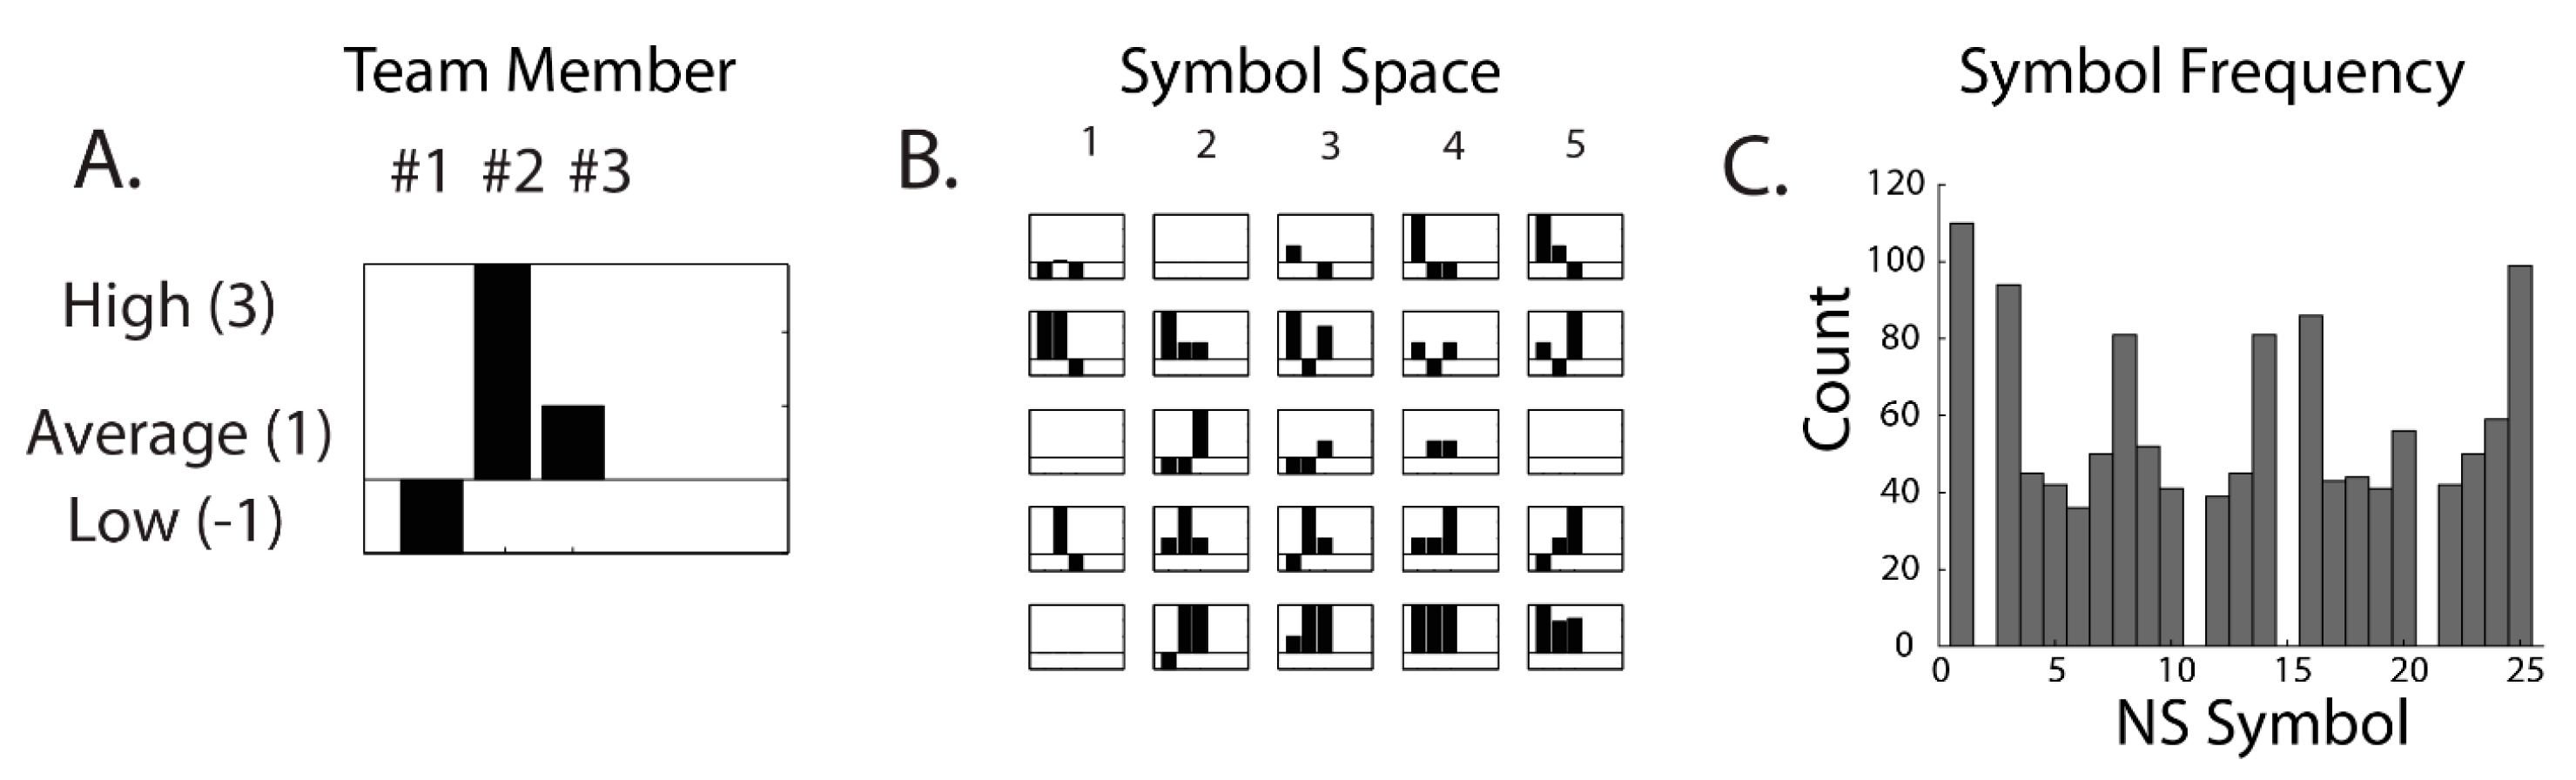
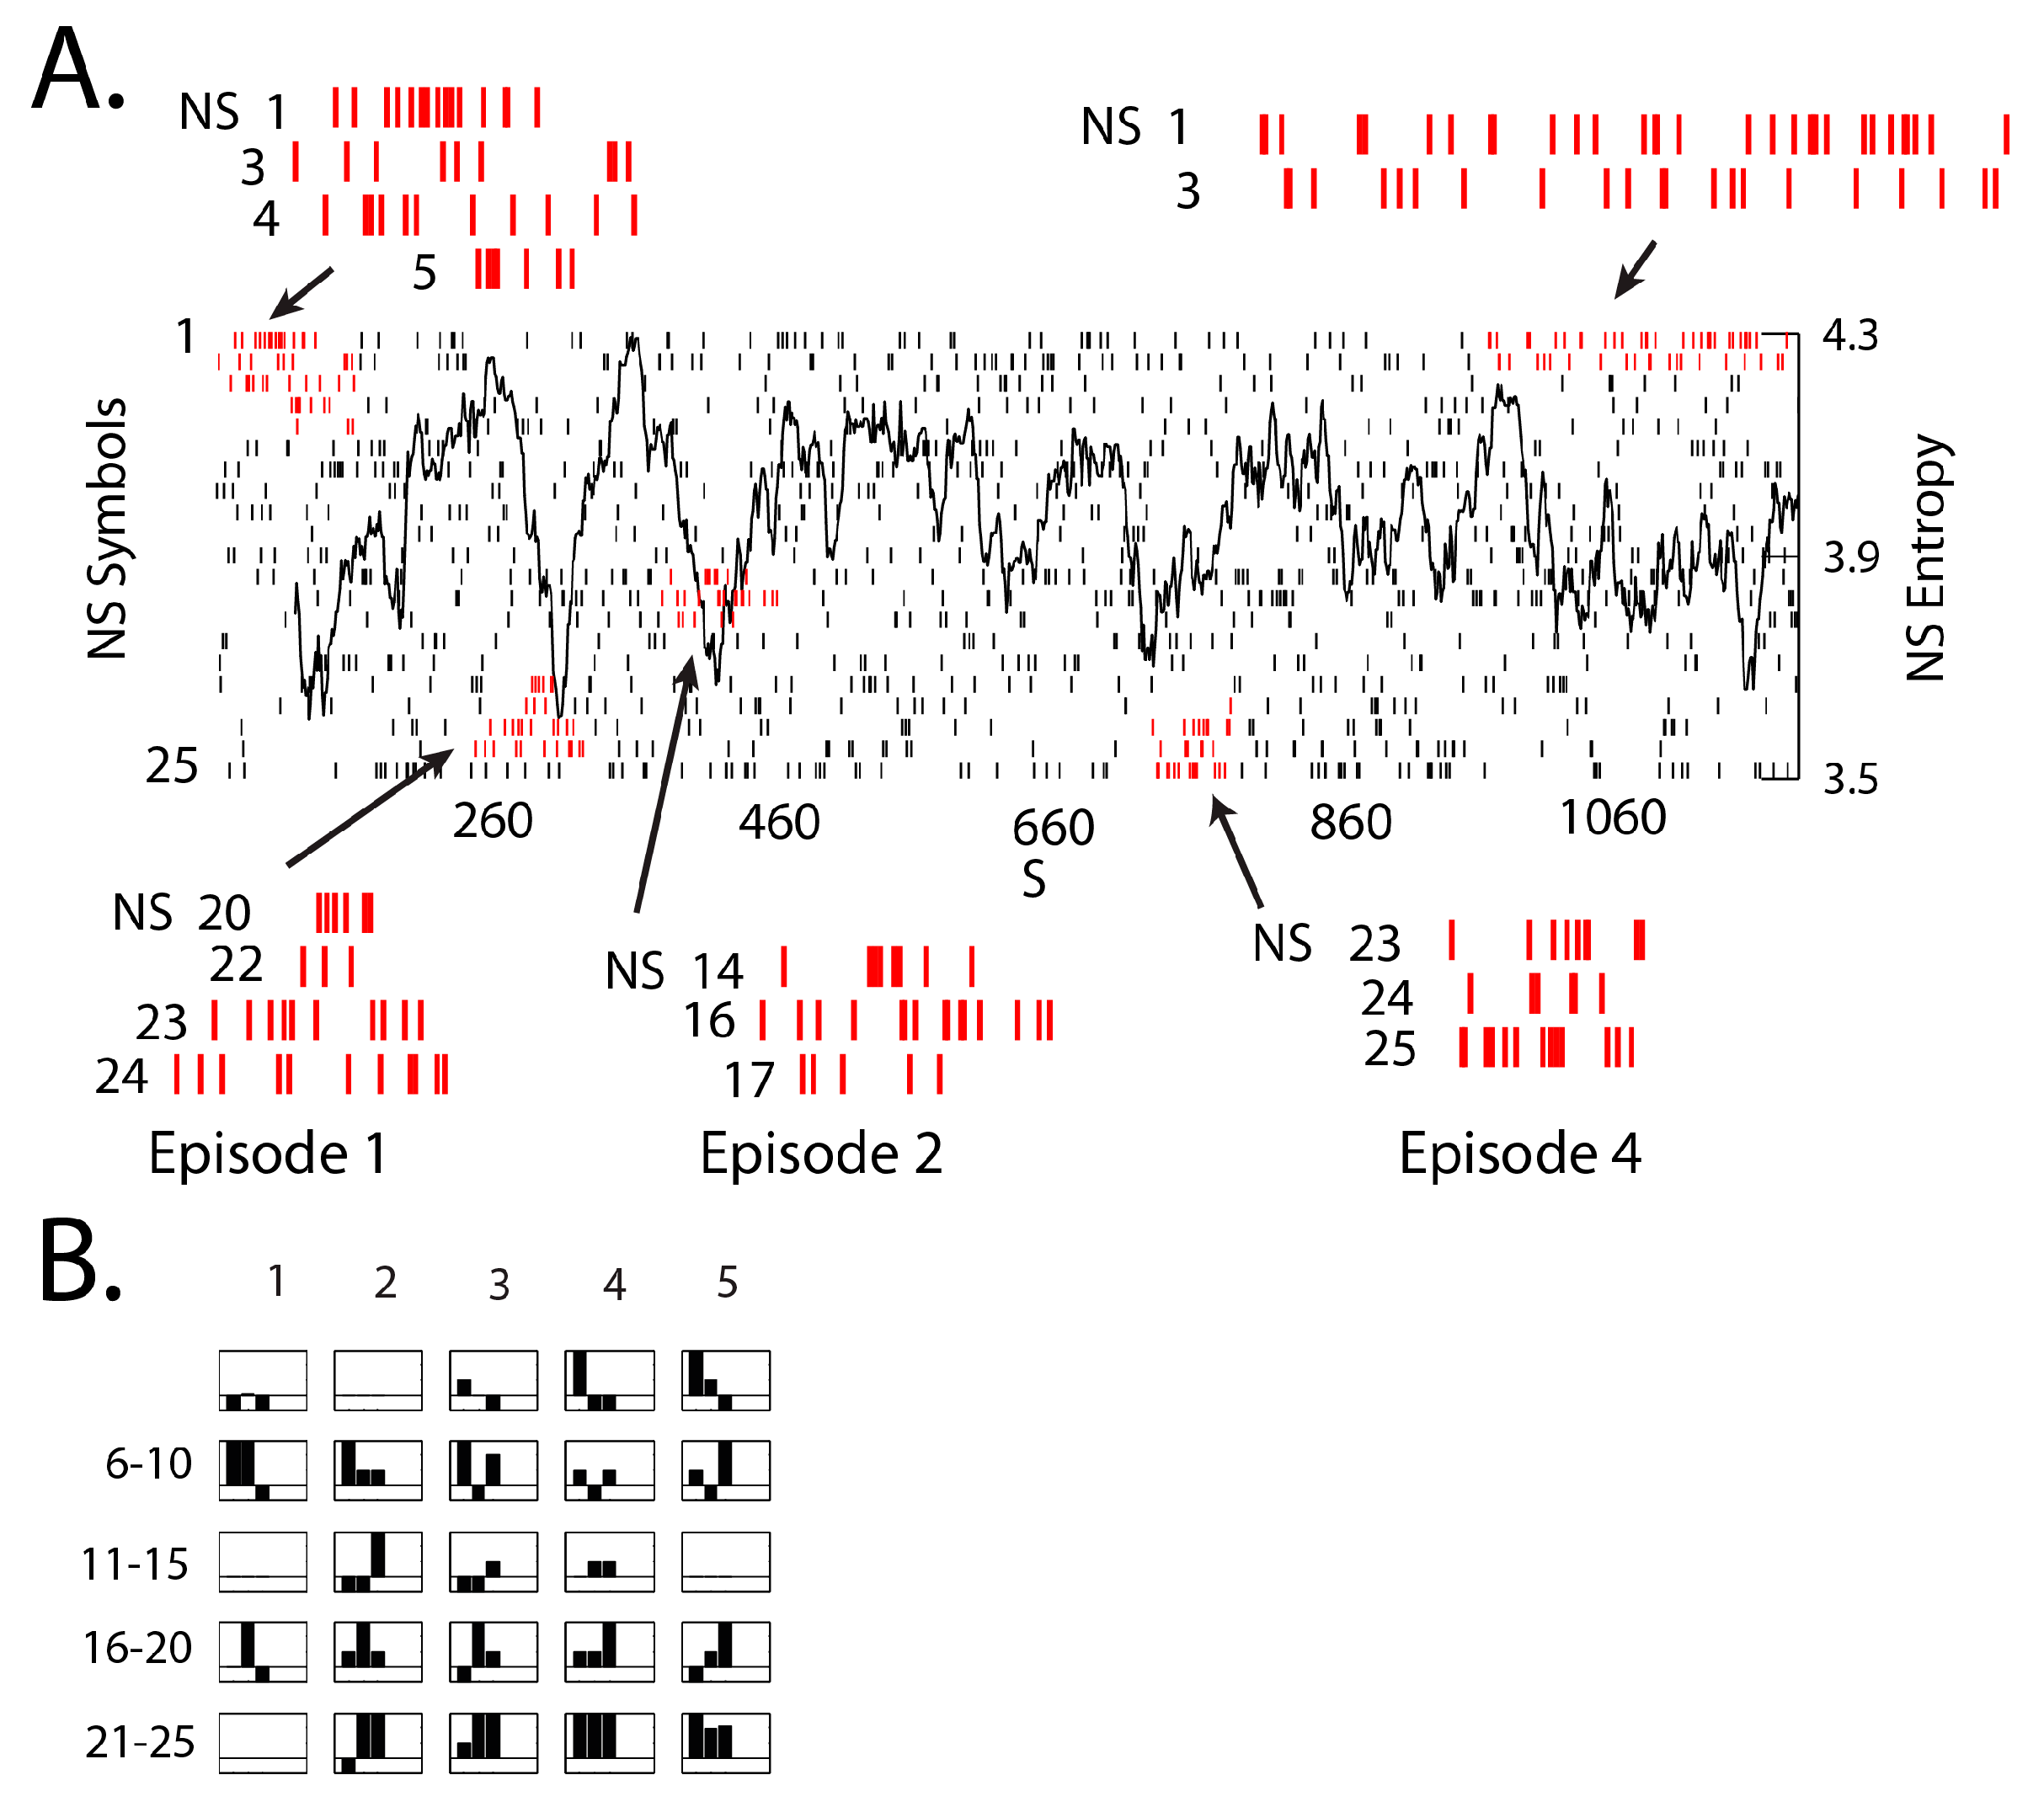
| Neurodynamic Symbols (NS) | symbolic representations of the momentary EEG power levels of a neurodynamic marker for each team member |
| Neurodynamic Symbol States (NSS) | a collection of NS that together describe a team performance |
| Neurodynamic Data Streams (NDS) | the second-by-second concatenated sequences of NS that temporally span a task performed by the team |
| Neurodynamic Entropy (NSH) | a quantitative measure of the distributions of NS in a NDS when examined over a moving window of time, often 60–100 s |
| Neurodynamic Organization (NDΩ) | a quantitative estimate of organization reflecting periods of increased neurodynamic order. NDΩ is calculated by subtracting the Shannon entropy of the NDS obtained over a 60 s or 100 s moving window from the entropy of the NS stream after it has been randomized (i.e., NDΩ = NSH random − NSH) |
References
- Cooke, N.J.; Gorman, J.C.; Kiekel, P. Communication as team-level cognitive processing. In Macrocognition in Teams; Letsky, M.P., Warner, N.W., Fiore, S.M., Smith, C.A.P., Eds.; Ashgate Publishing Ltd.: Burlington, VT, USA, 2008. [Google Scholar]
- Schippers, M.; Roebroeck, A.; Renken, R.; Nanetti, L.; Keysers, C. Mapping the information flows from one brain to another during gestural communication. Proc. Natl. Acad. Sci. USA 2010, 107, 9388–9393. [Google Scholar] [CrossRef] [PubMed]
- Caetano, G.; Jousmaki, V.; Hari, R. Actor’s and observers primary motor cortices stabilize similarly after seen or heard motor actions. Proc. Natl. Acad. Sci. USA 2007, 104, 9058–9062. [Google Scholar] [CrossRef] [PubMed]
- Shockley, K.; Santana, M.-V.; Fowler, C.A. Mutual interpersonal postural constraints are involved in cooperative conversation. J. Exp. Psychol. Hum. Percept. Perform. 2003, 29, 326–332. [Google Scholar] [CrossRef] [PubMed]
- Anders, S.; Heinzle, J.; Weiskopf, N.; Ethofer, T.; Haynes, J. Flow of affective information between communicating brains. Neuroimage 2011, 54, 439–446. [Google Scholar] [CrossRef] [PubMed]
- Menoret, M.; Varnet, L.; Fargier, R.; Cheylus, A.; Curie, A.; des Portes, V.; Nazir, T.A.; Paulignan, U. Neural correlates of non-verbal social interactions: A dual-EEG study. Neurophyschologia 2014, 55, 85–91. [Google Scholar] [CrossRef] [PubMed]
- Gardezi, F.; Lingard, L.; Espin, S.L.; Whyte, S.; Orser, B.; Baker, G.R. Silence, power and communication in the operating room. J. Adv. Nurs. 2009, 65, 1390–1399. [Google Scholar] [CrossRef]
- Tognoli, E.; Kelso, J.A. The coordination dynamics of social neuromarkers. arXiv, 2015; arXiv:1310.7275. [Google Scholar]
- Palva, J.M.; Zhigalov, A.; Hirvonen, J.; Korhonen, O.; Linkenkaer-Hansen, K.; Palva, S. Neuronal long-range temporal correlations and avalanche dynamics are correlated with behavioral scaling laws. Proc. Natl. Acad. Sci. USA 2013, 110, 3565–3590. [Google Scholar] [CrossRef] [PubMed]
- Proekt, A.; Banavar, J.R.; Maritan, A.; Pfaff, D.W. Scale invariance in the dynamics of spontaneous behavior. Proc. Natl. Acad. Sci. USA 2012, 109, 10564–10569. [Google Scholar] [CrossRef] [PubMed]
- Gilden, D.L.; Thornton, T.; Mallon, M.W. 1/f noise in human scaling. Science 1995, 5205, 1837–1839. [Google Scholar] [CrossRef]
- Van Orden, G.C.; Holden, J.G.; Turvey, M.T. Human cognition and 1/f scaling. J. Exp. Psychol. 2005, 134, 117–133. [Google Scholar] [CrossRef] [PubMed]
- Butner, J.; Pasupathi, M.; Vallejos, V. When the facts just don’t add up: The fractal nature of conversational stories. Soc. Cogn. 2008, 26, 670–699. [Google Scholar] [CrossRef]
- Flack, J.C. Multiple time-scales and the developmental dynamics of social systems. Philos. Trans. R. Soc. B Biol. Sci. 2012, 367, 1802–1810. [Google Scholar] [CrossRef] [PubMed]
- Stevens, R.H.; Galloway, T.; Wang, P.; Berka, C.; Tan, V.; Wohlgemuth, T.; Lamb, J.; Buckles, R. Modeling the neurodynamic complexity of submarine navigation teams. Comput. Math. Organ. Theory 2012, 19, 346–369. [Google Scholar] [CrossRef]
- Stevens, R.H.; Galloway, T. Modeling the neurodynamic organizations and interactions of teams. Soc. Neurosci. 2015, 11, 123–139. [Google Scholar] [CrossRef] [PubMed]
- Hari, R. Action perception connection and the cortical mu-rhythm. Prog. Brain Res. 2006, 159, 253–260. [Google Scholar] [PubMed]
- Klimesch, W.; Sauseng, P.; Hanslmayr, S. EEG alpha oscillations: The inhibition-timing hypothesis. Brain Res. Rev. 2007, 53, 63–88. [Google Scholar] [CrossRef] [PubMed]
- Klimesch, W. Alpha-band oscillations, attention and controlled access to stored information. Trends Cogn. Sci. 2012, 16, 606–617. [Google Scholar] [CrossRef] [PubMed]
- Roux, F.; Uhlhaas, P. Working memory and neural oscillations: Alpha-gamma versus theta-gamma codes for distinct WM information? Trends Cogn. Sci. 2014, 18, 16–25. [Google Scholar] [CrossRef] [PubMed]
- Bonnefond, M.; Jensen, O. Gamma activity coupled to alpha phase as a mechanism for top-down controlled gating. PLoS ONE 2015, 10, e012866. [Google Scholar] [CrossRef] [PubMed] [Green Version]
- Stevens, R.H.; Galloway, T. Toward a quantitative description of the neurodynamic organizations of teams. Soc. Neurosci. 2014, 9, 160–173. [Google Scholar] [CrossRef] [PubMed]
- Fishel, S.R.; Muth, E.R.; Hoover, A.W. Establishing appropriate physiological baseline procedures for real-time physiological measurement. J. Cogn. Eng. Decis. Mak. 2007, 1, 286–308. [Google Scholar] [CrossRef]
- Shannon, C.E. Prediction and entropy of printed English. Bell Syst. Tech. J. 1951, 30, 50–64. [Google Scholar] [CrossRef]
- Stevens, R.H.; Gorman, J.C.; Amazeen, P.; Likens, A.; Galloway, T. The organizational dynamics of teams. Nonlinear Dyn. Psychol. Life Sci. 2013, 17, 67–86. [Google Scholar]
- Likens, A.D.; Amazeen, P.G.; Stevens, R.; Galloway, T.; Gorman, J.C. Neural signatures of team coordination are revealed by multifractal analysis. Soc. Neurosci. 2014, 9, 219–234. [Google Scholar] [CrossRef] [PubMed]
- Delorme, A.; Palmer, J.; Onton, J.; Oostenveld, R.; Makeig, S. Independent EEG sources are dipolar. PLoS ONE 2012, 12, e30135. [Google Scholar] [CrossRef] [PubMed]
- Yong, X.; Ward, R.K.; Birch, G.E. Facial EMG contamination of EEG signals: Characteristics and effects of spatial filtering. In Proceedings of the IEEE 3rd International Symposium on Communications, Control and Signal Processing (ISCCSP), St. Julians, Malta, 12–14 March 2008.
- Baker, D.P.; Amodeo, A.M.; Krokos, K.J.; Slonim, A.; Herrera, H. Assessing teamwork attitudes in healthcare: Development of the TeamSTEPPS® teamwork attitudes questionnaire. Qual. Saf. Health Care 2010, 19, e49. [Google Scholar] [CrossRef] [PubMed]
- Oostenveld, R.; Fries, P.; Maris, E.; Schoffelen, J.-M. FieldTrip: Open source software for advanced analysis of MEG, EEG, and invasive electrophysiological data. Comput. Intell. Neurosci. 2011, 2011, 156869. [Google Scholar] [CrossRef] [PubMed]
- Delorme, A.; Sejnowski, T.; Makeig, S. Enhanced detection of artifacts in EEG data using higher-order statistics and independent component analysis. Neuroimage 2007, 34, 1443–1449. [Google Scholar] [CrossRef] [PubMed]
- Will, U.; Berg, E. Brainwave synchronization and entrainment to periodic stimuli. Neurosci. Lett. 2007, 424, 55–60. [Google Scholar] [CrossRef] [PubMed]
- Hasson, U.; Ghazanfar, A.; Glantucci, B.; Garrod, S.; Keysers, C. Brain-to-brain coupling: A mechanism for creating and sharing a social world. Trends Cogn. Sci. 2011, 17, 413–425. [Google Scholar] [CrossRef] [PubMed]
- Bluedorn, A.C. The Human Organization of Time: Temporal Realities and Experience; Stanford University Press: Stanford, CA, USA, 2002. [Google Scholar]
- Adrian, E.D.; Matthews, B.H.C. The interpretation of potential waves in the cortex. J. Physiol. 1934, 81, 440–471. [Google Scholar] [CrossRef] [PubMed]
- Galambos, R.; Makeig, S.; Talmachoff, P.J. A 40-Hz auditory potential recorded from the human scalp. Proc. Natl. Acad. Sci. USA 1981, 78, 2643–2647. [Google Scholar] [CrossRef] [PubMed]
- Van Noorden, L.; Moelants, D. Resonance in the perception of musical pulse. J. New Music Res. 1999, 28, 43–66. [Google Scholar] [CrossRef]
- Moreno, I.; de Vega, M.; León, I. Understanding action language modulates oscillatory mu and beta rhythms in the same way as observing actions. Brain Cogn. 2013, 82, 236–242. [Google Scholar] [CrossRef] [PubMed]
- Hasson, U.; Nir, Y.; Levy, I.; Fuhrmann, G.; Malach, R. Inter-subject synchronization of cortical activity during natural vision. Science 2004, 303, 1634–1640. [Google Scholar] [CrossRef] [PubMed]
- Nummenmaa, L.; Gleran, E.; Viinikainen, M.; Jaaskelainen, P.; Hari, R.; Sams, M. Emotions promote social interaction by synchronizing brain activity across individuals. Proc. Natl. Acad. Sci. USA 2012, 109, 9599–9604. [Google Scholar] [CrossRef] [PubMed]
- Dmochowski, J.P.; Sajda, P.; Dias, J.; Parra, L. Correlated components of ongoing EEG point to emotionally laden attention—A possible marker of engagement? Front. Hum. Neurosci. 2012, 6, 112. [Google Scholar] [CrossRef] [PubMed]
- Wray, C.M.; Loo, L.K. The diagnosis, prognosis and treatment of medical uncertainty. J. Med. Educ. 2015, 7, 523–527. [Google Scholar] [CrossRef] [PubMed]


© 2016 by the authors; licensee MDPI, Basel, Switzerland. This article is an open access article distributed under the terms and conditions of the Creative Commons Attribution (CC-BY) license (http://creativecommons.org/licenses/by/4.0/).
Share and Cite
Stevens, R.; Galloway, T.; Halpin, D.; Willemsen-Dunlap, A. Healthcare Teams Neurodynamically Reorganize When Resolving Uncertainty. Entropy 2016, 18, 427. https://doi.org/10.3390/e18120427
Stevens R, Galloway T, Halpin D, Willemsen-Dunlap A. Healthcare Teams Neurodynamically Reorganize When Resolving Uncertainty. Entropy. 2016; 18(12):427. https://doi.org/10.3390/e18120427
Chicago/Turabian StyleStevens, Ronald, Trysha Galloway, Donald Halpin, and Ann Willemsen-Dunlap. 2016. "Healthcare Teams Neurodynamically Reorganize When Resolving Uncertainty" Entropy 18, no. 12: 427. https://doi.org/10.3390/e18120427