Backtracking and Mixing Rate of Diffusion on Uncorrelated Temporal Networks


1
Namur Institute for Complex Systems, University of Namur, B-5000 Namur, Belgium
2
Institute of Information and Communication Technologies, Electronics and Applied Mathematics, Université catholique de Louvain, B-1348 Louvain-la-Neuve, Belgium
3
Mathematical Institute, University of Oxford, OX2 6GG Oxford, UK
4
Center for Operations Research and Econometrics, Université catholique de Louvain, B-1348 Louvain-la-Neuve, Belgium
*
Author to whom correspondence should be addressed.
Entropy 2017, 19(10), 542; https://doi.org/10.3390/e19100542
Submission received: 31 August 2017
/
Revised: 6 October 2017
/
Accepted: 9 October 2017
/
Published: 13 October 2017
(This article belongs to the Special Issue Statistical Mechanics of Complex and Disordered Systems)
Abstract
:We consider the problem of diffusion on temporal networks, where the dynamics of each edge is modelled by an independent renewal process. Despite the apparent simplicity of the model, the trajectories of a random walker exhibit non-trivial properties. Here, we quantify the walker’s tendency to backtrack at each step (return where he/she comes from), as well as the resulting effect on the mixing rate of the process. As we show through empirical data, non-Poisson dynamics may significantly slow down diffusion due to backtracking, by a mechanism intrinsically different from the standard bus paradox and related temporal mechanisms. We conclude by discussing the implications of our work for the interpretation of results generated by null models of temporal networks.
1. Introduction
Random walks (RWs) play a key role in network theory [1]. RWs are at the core of algorithms to explore the network structure and to uncover its important features, such as the centrality of the nodes [2,3]) or the presence of communities and modules [4,5]. RWs are also often used as a simplified model for the diffusion of an entity, e.g., people in a network of places, a virus or information on a social network, etc., and several works have focused on the impact of static properties of a network, e.g., its degree distribution, on the dynamical properties of a RW [6]. Driven by the availability of longitudinal data of empirical networked systems, and the increased importance of temporal networks [7,8], it is only much more recently that researchers have considered how the temporal properties of a network affect diffusion. Empirical observations have shown that temporal properties of networks strongly differ from classical homogeneous Poisson processes, due to their non-stationarity [9], correlations between the activation times of network entities [10,11,12] and fat-tailed inter-event times of activations [13]. A central question is to understand the mechanisms that either accelerate or slow down the diffusion, for instance through the characteristic time for the dynamics to converge to the equilibrium state. This question has been considered by means of numerical simulations, by simulating a diffusive process on empirical temporal network data [14], and comparing its speed with the same process run on randomized null models [15]. A theoretical approach, which we also adopt here, consists in neglecting correlations between activations of different edges, and modelling their dynamics as independent renewal processes [16,17]. In the taxonomy of RWs on networks, this corresponds to the popular edge-centric passive RW [1]. In particular, we explore in detail the implications of an apparently paradoxical situation [17,18]: despite the fact that edges are independent processes, they cease to be independent along the path of a walker when the inter-event time distribution is non-exponential, which may lead to biases in its dynamics and non-Markovian trajectories.
In this paper, we illustrate and analyse this effect for a specific dependency pattern between successive jumps, namely the tendency for the random walker to backtrack, i.e., return to the previously visited node more than a purely Markovian walker would. Our contributions are twofold. We first compute the backtrack probability as a function of the shape of the inter-event time distribution. Second, we estimate the impact of the resulting bias to backtrack on the mixing rate of the process. Taken together, these results allow to quantify a mechanism that may either slow down or accelerate diffusion, by changing the number of steps leading to mixing, which is inherently different from well-known mechanisms such as the bus paradox [19] or other temporal mechanisms [20], only affecting the time to relaxation, and not the number of steps. Our observations also allow us to gain insight into unexpected properties of a standard null model for temporal network analysis.
2. Random Walk on Temporal Network
2.1. Bias on the Probability of Backtracking
The edge-centric passive RW is defined as follows. Edges are activated for an infinitesimal duration. The time between two consecutive activations of an edge is governed by a renewal process, with i.i.d. inter-activation times distributed according to a probability density function. The activation processes on different edges are independent. For the sake of notation, we consider the same inter-activation distributions for every edge; nonetheless, the forthcoming analytical derivations hold for distinct edge activities as well. The random walker waiting on a node jumps through the first edge incident to the node that is activated. As we consider continuous inter-activation distributions, the probability that two edges activate simultaneously is almost surely zero, and the walker never has to choose between multiple available edges. In order to describe the process, it is crucial to estimate the waiting time distribution , i.e., the time that the random walker arriving on a node has to wait before a given edge activates. Under the assumption that the arrival of the walker on the node is independent of the edge activation, the relation between the inter-activation distribution on the given edge and the waiting-time distribution is given by:
where is the mean inter-activation time. The observation that may have very different moments from , for instance a much larger mean is known under the name of bus paradox, or inspection paradox [19]. In a popular example, one may think of someone arriving at a bus stop and having to wait (mean of g) for a bus much longer than the mean inter-arrival time between two buses (mean of f).
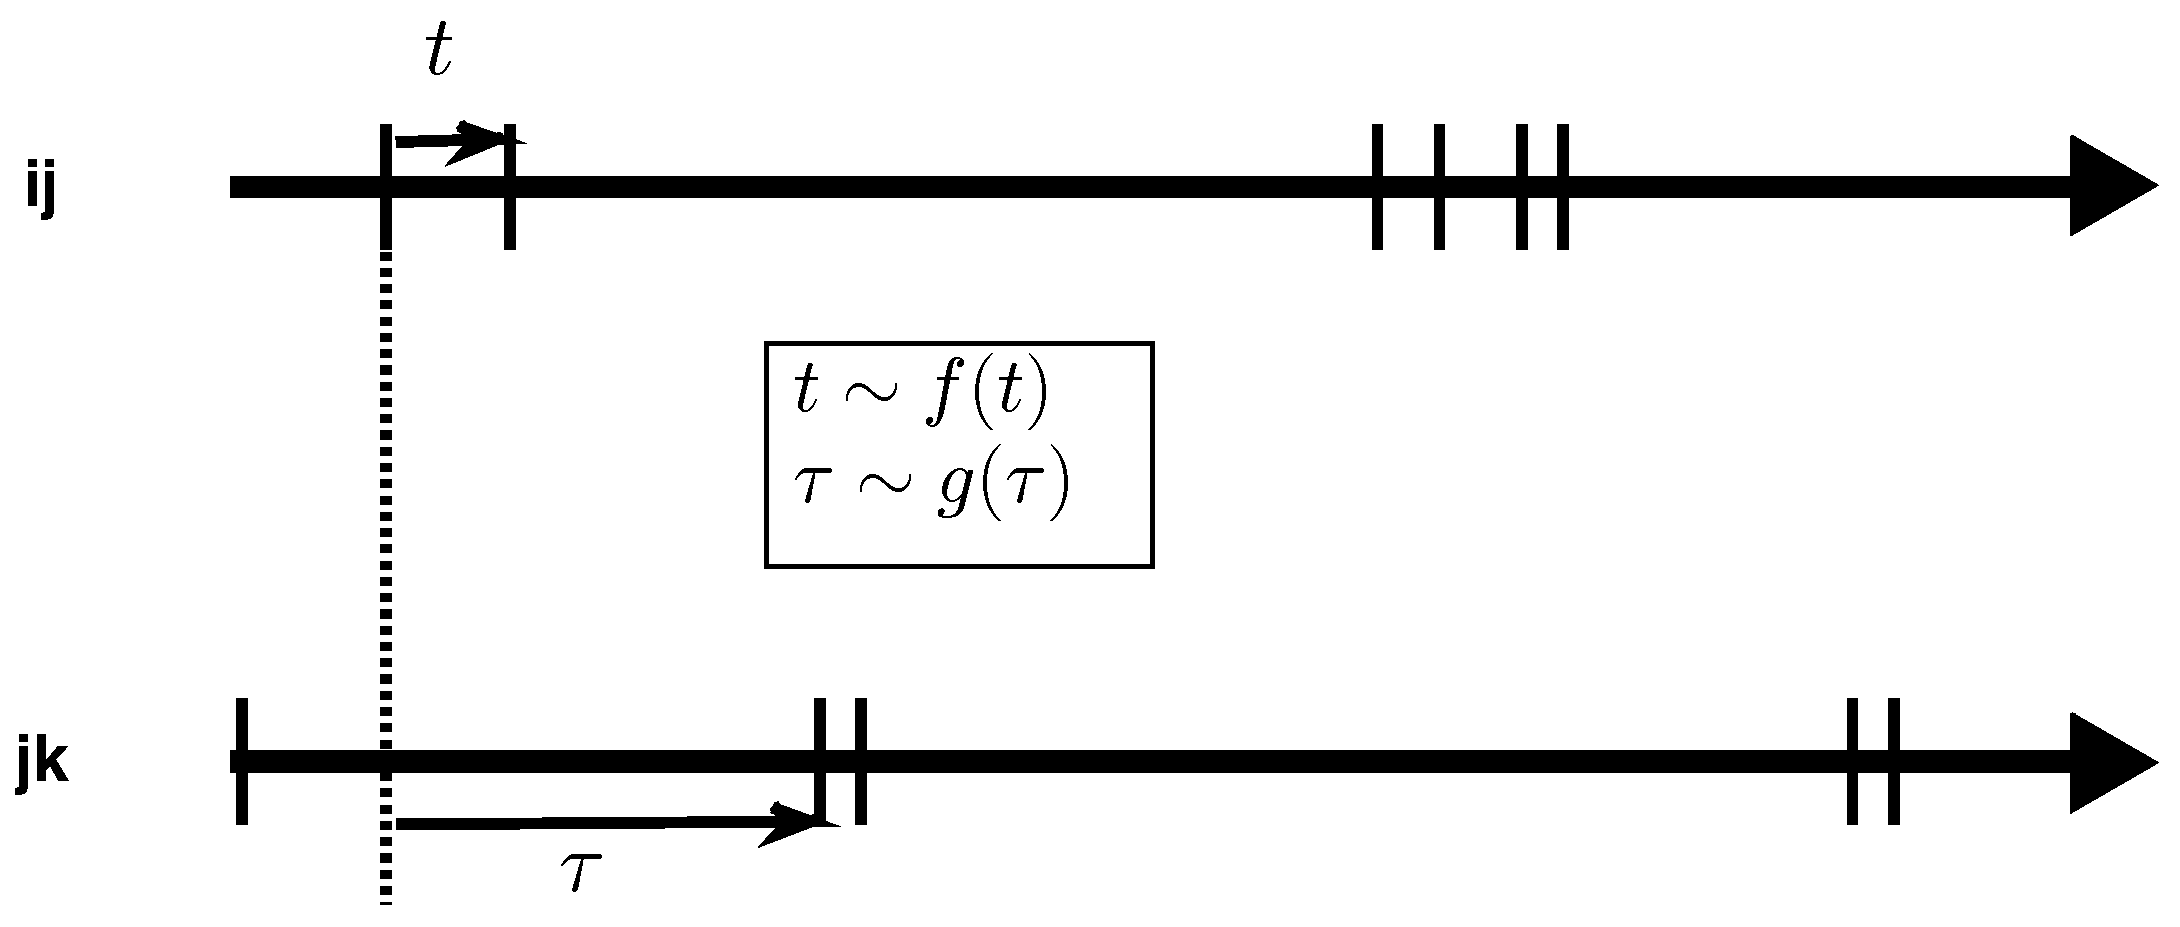
It is important to note that this independence assumption is, in general, not respected if the walker passes several times by the same edge, as information about the previous passage time may help to predict the next activation time. This effect is most apparent for undirected networks, which we consider from now on. Consider a walker taking an edge from i to j. While activation times to nodes different from i may be affected by the bus paradox, this is not the case for the edge going back from j to i, i.e., the backtracking transition, see Figure 1. The waiting-time distribution for j to i is thus the inter-activation distribution , while we assume it is reasonably approximated by for other edges (we neglect, in particular, memory effects due to the random walker exploring other short cycles such as triangles, leading to a similar if attenuated effect, see Discussion). The resulting statistical difference between backtracking and non-backtracking transitions may thus lead to biases in the dynamics of the walk, as the backtracking edge will be either favoured or penalized compared to the other edges depending on the underlying dynamics.
Let us now determine the probability that the walker performs a backtracking jump as a function of the degree d of a node. Denoting as the independent identically distributed waiting-times for the activation of the other competing edges, we have
The independence of the edges implies
where we have assumed that each edge has the same inter-activation distribution for the sake of simplicity. When this assumption is not verified, the forthcoming development holds using Equation (3) instead of (4).
The expression of can also be rewritten so that the cumulative density function of appears explicitly:
where is the cumulative density function of , and .
The probability depends on the number of competing edges but also on the shape of the distribution. In particular, the presence of powers of r in the integral indicates that the shape of the distribution impacts the backtracking probability at least through its first moments and thus through its variance. In the Poisson case, where is an exponential distribution , the backtracking probability simplifies into the memoryless case as expected. Another interesting case is the power-law
for and for with (since the expression of assumes finite mean), where
Numerical simulations illustrate these results in Figure 2 where follows various distributions including the exponential, gamma and power-law distributions. Note that the numerical convergence of the simulation is not guaranteed when the variance of the waiting-time distribution becomes infinite, which happens, for instance, for power-law distributions of exponent . For each of these families of distributions, the higher the variance, the higher the probability of backtracking. However, as mentioned before, the backtracking probability depends, in general, on the full shape of the distribution.
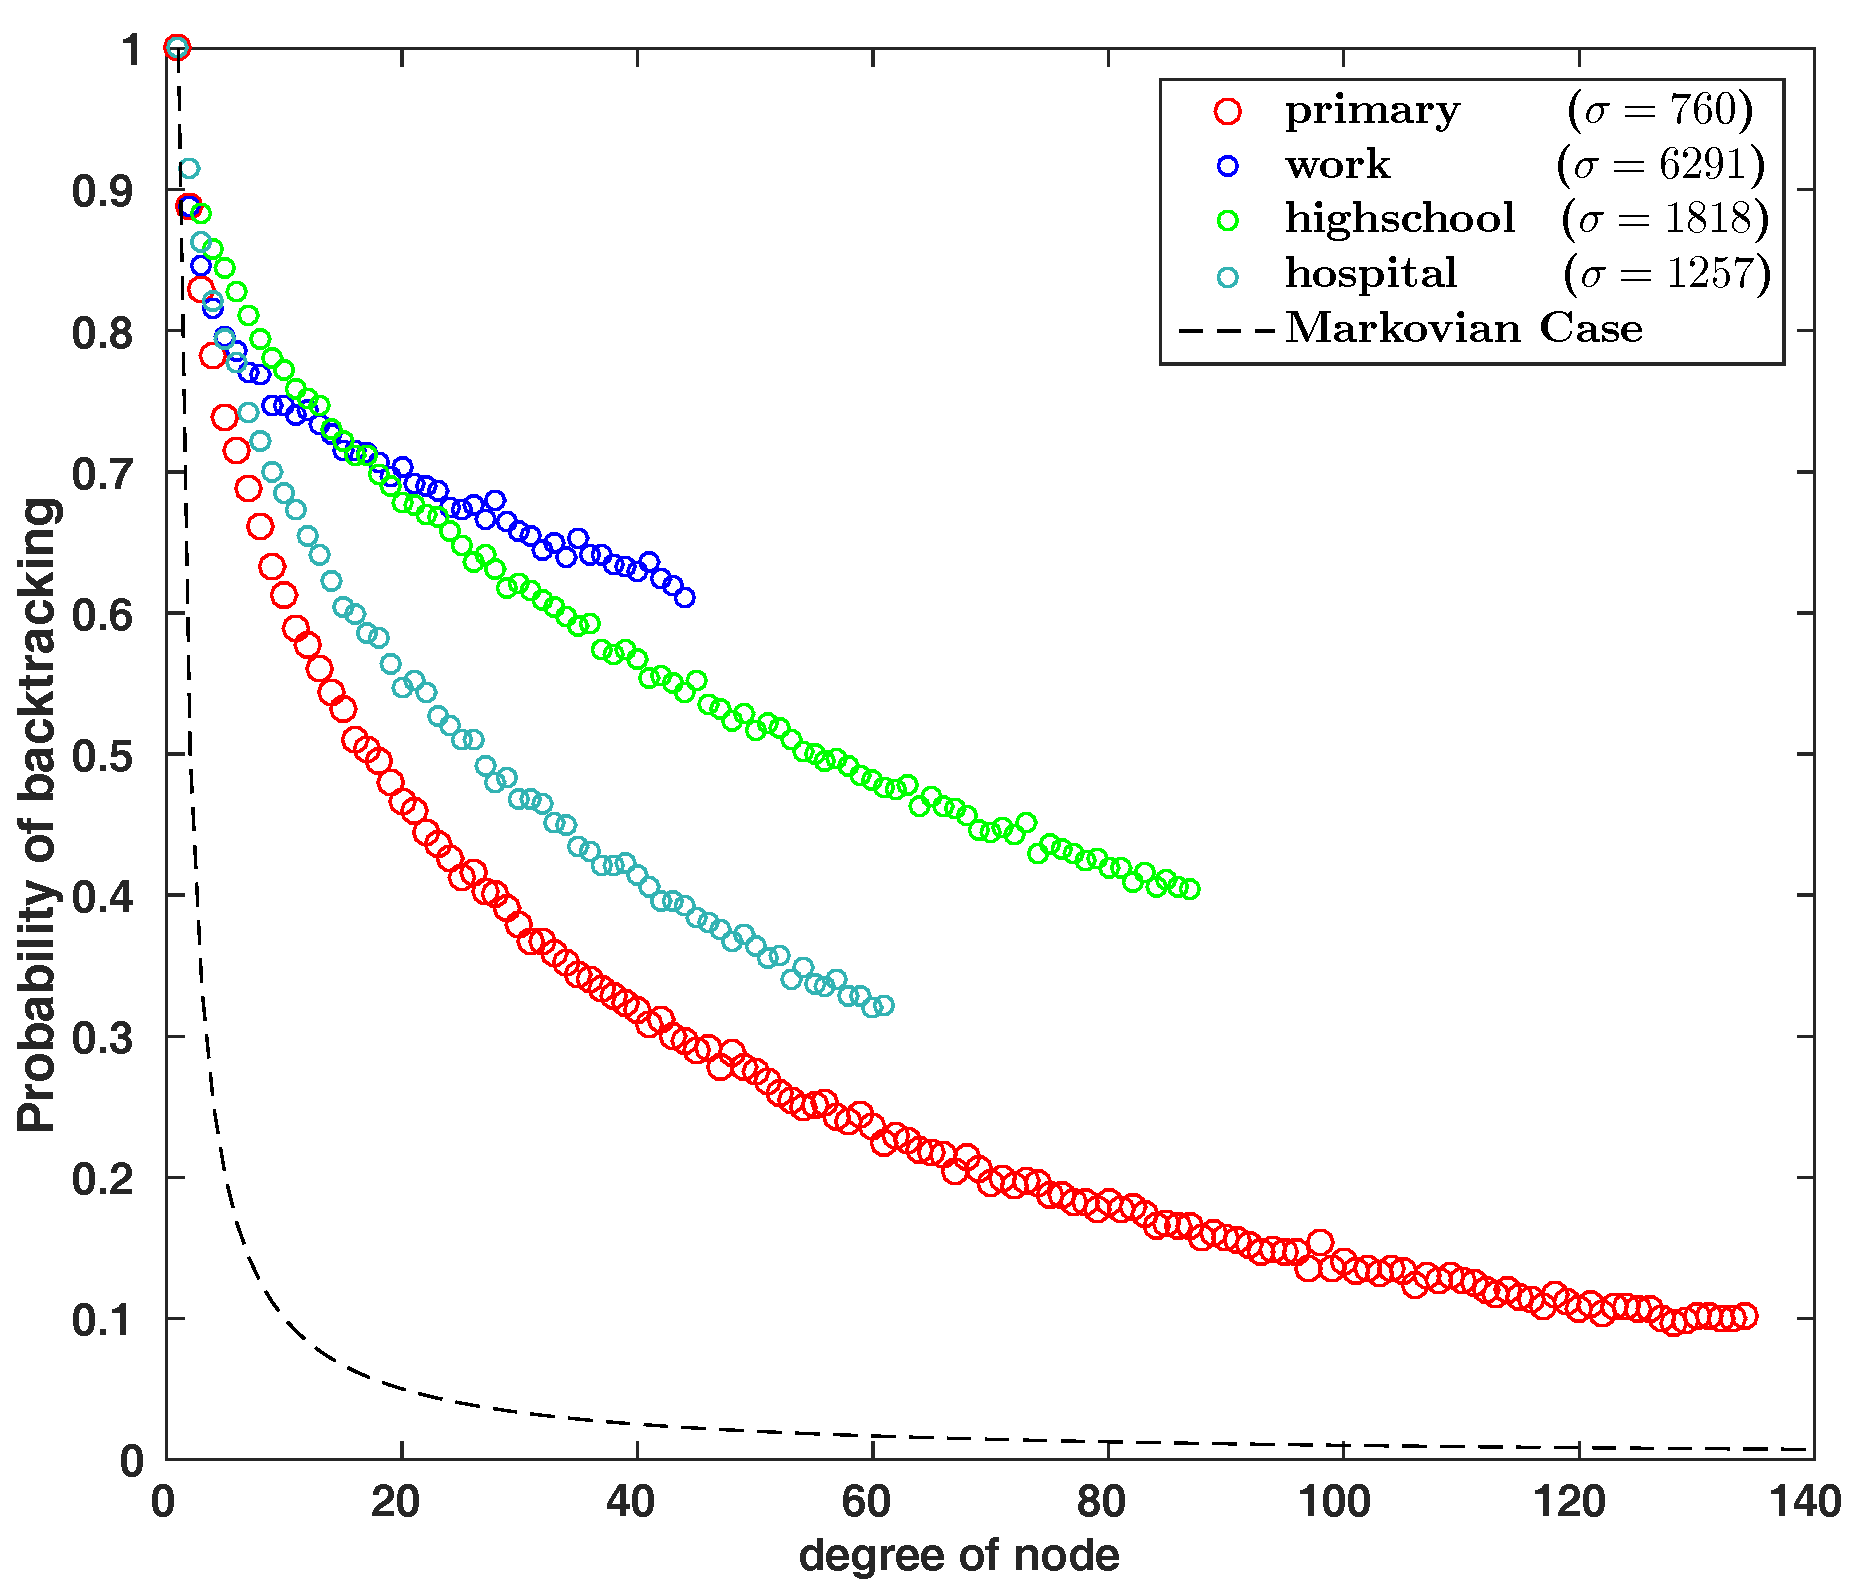
As a next step, we test the importance of this effect in real-world systems by considering four datasets of face-to-face contacts described in [21,22,23,24,25]. From the recorded contacts, we obtain the largest component with a typical size of a few hundred nodes. We extract the inter-activation times between each pair of individuals, and aggregate them in the empirical inter-activation distribution . We simulate a RW on the corresponding homogeneous network where every edge activity is a renewal process governed by . The probability of backtracking as a function of the nodes degree, computed up to the largest node degree of the network , is displayed in Figure 3. We observe in the real-world data that backtracking is, overall, higher than in the memoryless case. This result shows that the backtracking bias is inherent to random walk processes, even when edge activities are uncorrelated. The paradox lies in the fact that the random walker has a tendency to take one particular edge over the others, even if each edge is statistically equivalent.
2.2. Impact of Backtracking on the Mixing Rate of the Random Walk
In the previous section, we have shown that the shape of the inter-activation distribution may induce a backtracking bias for random walkers on a temporal network. We now estimate how this bias impacts the speed of diffusion, by estimating the mixing rate of the process. From now on, we take a discrete-time perspective and no longer consider the timings at which events take place. Time is measured by the number of steps k performed by the walker, thus focusing on the question: on average, how many steps does a walker have to perform for the process to reach equilibrium. This approach is in contrast with previous works focusing on the impact of the inter-activation distribution on the mixing time [20] and neglecting backtracking biases.
We first consider a standard memoryless RW process, i.e., where no backtracking bias is present. In that case, the mixing rate is obtained from the second dominant eigenvalue of the transition matrix of the process, equivalent to the spectral gap of the corresponding normalized Laplacian of the graph. As we show in Appendix A, the spectral properties of the transition matrix are equivalent to those of a transition matrix defined on the so-called line graph, where edges of the original graph define nodes in the line graph. This equivalence is relatively intuitive, as both processes are essentially equivalent (only their representation changes), but it is crucial as a line graph formulation is natural to represent second-order Markov processes. In the following, we thus consider the spectral gap of the transition matrix of the line graph, defined as , where is the eigenvalue with the second largest module. The corresponding eigenmode describes the asymptotic dynamics of the process and is associated to the presence of bottlenecks/modules in the network [5]. The spectral gap provides information on the speed of convergence to stationarity since the distance between the transient state of the initial condition and the stationary state decays to 0 as for large k. Therefore, the characteristic number of jumps for relaxation to stationarity is of the order .
Table 1 compares the spectral gaps of the Markovian walker and the backtracking walker (with a backtracking probability computed by (5)) for four datasets, showing a significant slowdown of mixing due to backtracking alone. As a next step, we quantify this intuitive effect by performing a first-order approximation around the Markovian case, and focusing on regular networks for the sake of simplicity. Take an undirected network of nodes and edges, with an adjacency matrix A. From A, we get the stochastic transition matrices of the network, and of its line graph G associated to the standard memoryless RW. Importantly, it can be shown that both transition matrices and share the same non-zero eigenvalues (See Appendix A for details) and correspond to the same linear dynamics described from the point of view of nodes and edges respectively.
We now consider a system where the trajectories of the walker are non-Markovian, such that the transition matrix on the line graph differs from the transition matrix of the line graph associated to the Markovian case . We consider a small deviation due to the probability of backtracking, by adding a perturbation matrix P :
Each row of P captures the bias of backtracking from edge to edge compared to a Markovian RW on . The line of matrix P corresponding to the jump transition from an edge is made of the entry on the column corresponding to edge , and for the other edges leaving the node j, where is the degree of node j. For the sake of simplicity, we calculate the impact of on the spectrum of for regular networks, where the degree is constant and the backtracking bias is thus for every edge . In this case, each eigenvalue of is associated to an eigenvalue of through the equality , where the perturbation is to be determined.
Standard derivations lead to the first order approximation (see Appendix B for details) :
where , , and correspond to left and right eigenvectors of and respectively, associated to . The sign of the corresponding shift can be determined as follows. On the one hand, is positive definite, on the other hand, is symmetric diagonally dominant with real non-negative diagonal entries by construction, hence positive semidefinite. Therefore, the sign of takes the sign of , and consequently the spectral gap of decreases when the dynamics favours backtracking, and increases otherwise.
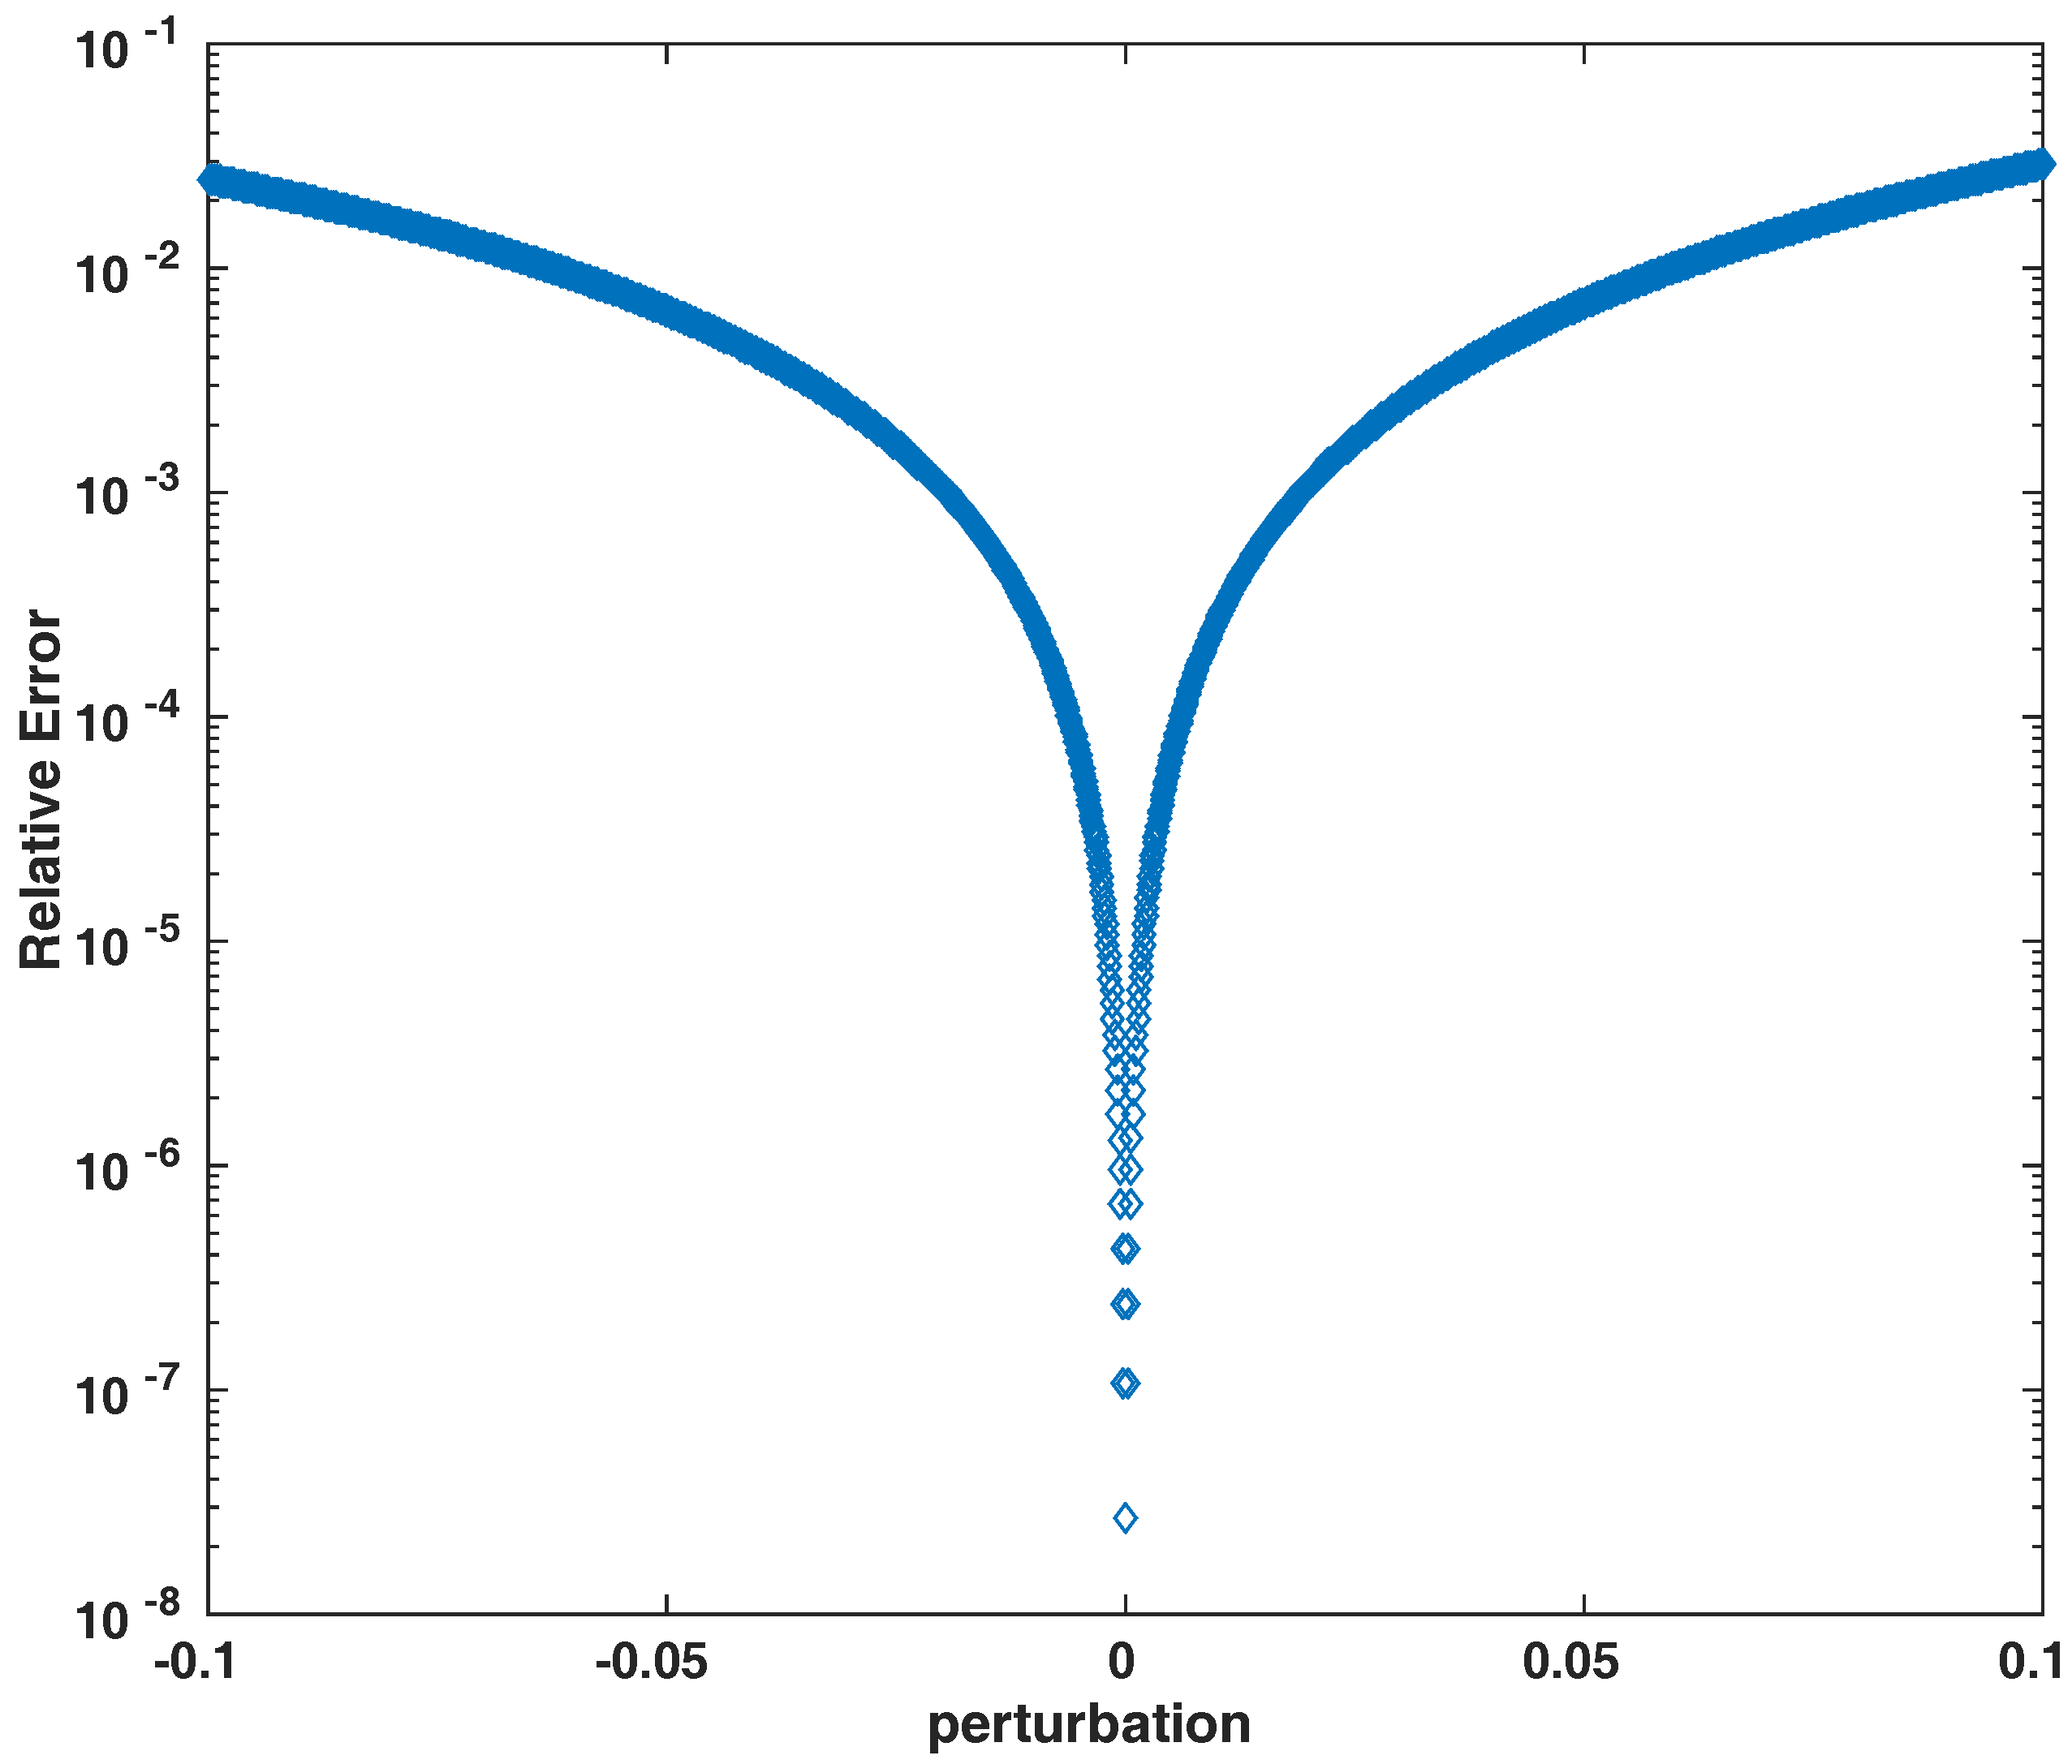
Finally, we validate our linear approximation of the real shift of the spectral gap with respect to the backtracking perturbation by computing the relative error on the spectral shift
on several regular graphs. As an illustration, Figure 4 shows the results for a regular network made of two communities of 50 nodes each, which is in the typical range of size of the four studied real-world networks (from 75 to 327 nodes). In each case, the approximation provides small relative error on the estimation of the spectral gap. Moreover, numerical simulations show that the linear approximation gives a lower bound to the true value of the spectral gap, and confirm the trend of slowing-down of the process under positive backtracking bias.
3. Discussion
The main purpose of this paper was to highlight the existence of a neglected, yet important, correlation taking place in a null model actually designed to destroy temporal correlations in temporal networks. In models where edges are undirected and their activations are independent stochastic processes, dependencies between successive jumps of a random walker are introduced, making the RW non-Markovian. Although we focused on backtracking in this paper, it is clear that further memory is created in the RW by triangles, or short cycles in general. Thus, while backtracking is absent in directed networks (as a return, edge does not necessarily exist or is ruled by an independent activation process), the effects from short cycles remain, and as such, are an interesting topic for further research.
Our findings question the relevance of standard models of diffusion on temporal networks: in the presence of bursty activation patterns, one cannot avoid correlations between events, either in the activation process or in the jumping process—making it a non-trivial task to characterize the ‘simplest’ diffusion process with a given degree of burstiness. While we do know that real-world diffusion in social or mobility network exhibits non-Markovian patterns [12,26], those patterns sometimes favour, and sometimes reject backtracking regardless of the degree of burstiness of the process, making it clear that they cannot be entirely accounted for by the effect at play in this paper. Whether the burstiness-induced memory is an undesirable artefact of the model or a useful and economical way to generate non-Markovian walks remains to be seen.
We have computed the effect of backtracking on the mixing rate of the diffusion process, due to its modification of the trajectories of the RW. This effect should be further amended by the effect of triangles or longer cycles, likely leading to a further asymptotic slowdown of the diffusion. This is a new mechanism for the impact of network temporality on diffusive processes, adding to intrinsically different mechanisms such as the bus paradox, where a walker may sit on a node for a very long time [11,19], and the further fact that the mixing time of bursty walker may be much larger than the naive estimate given by the number of jumps required to explore the network multiplied by the average waiting time of the walker at each step [20]. This is a tribute to the extraordinary richness of phenomena brought by the sole departure from a Poisson or discrete-time diffusion process. A comprehensive theory articulating all these effects on a general temporal network while yielding useful insight into the diffusion in a complex environment is yet to be established.
Acknowledgments
The authors acknowledge support from FRS-FNRS; the Belgian Network DYSCO (Dynamical Systems, Control and Optimisation) funded by the Interuniversity Attraction Poles Programme initiated by the Belgian State Science Policy Office; and the ARC (Action de Recherche Concertée) on Mining and Optimization of Big Data Models funded by the Wallonia-Brussels Federation.
Author Contributions
Martin Gueuning, Jean-Charles Delvenne and Renaud Lambiotte conceived the project, derived the results and wrote the manuscript. Martin Gueuning performed the numerical simulations.
Conflicts of Interest
The authors declare no conflict of interest.
Appendix A. Shared Eigenvalues of the Transition Matrix and Its Associated Transition Line Graph
We provide here proof that the transition matrix of a network and of its associated line graph share the same non-zero eigenvalues.
We consider an undirected network of nodes and edges, with an adjacency matrix A and its associated incidence matrix K, listing each edge of the network in two consecutive column of K with a entry and a entry for the two extremities of the edge—the extremity of which receives a or a being arbitrary. We decompose the incidence matrix into the difference of two binary matrices .
First, it is direct that the adjacency matrix A and its associated line graph G share the same non-zero eigenvalues, since they are the commutated product of the same two rectangular matrices of in and out incidence:
As a side note, G has at least zero eigenvalues, where and are respectively the number of nodes and edges of A. The transition matrices are obtained by normalizing the adjacency matrices by the degree of the nodes:
where and are the diagonal matrices of degrees of A and G respectively, and verify
Let be a non-zero eigenvalue of , and v an associated eigenvector of .
Then, is a right eigenvector of associated to . Indeed:
Similarly, the left eigenvector of associated to is given by .
Appendix B. First Order Approximation of the Spectral Gap for Regular Network
We provide here the development to obtain the first order approximation of the shift of the spectral gap of a regular network. The eigenvalue of the transition matrix is , where is an eigenvalue of . The goal is to find the perturbation on the eigenvalue . The right eigenvector of associated to may also be expressed as , where is a right eigenvector of associated to , and this leads to
As discussed, takes the sign of , so under positive backtracking bias , the eigenvalues of the transition matrix are shifted away from 0, resulting in a decrease of the spectral gap.
References
- Masuda, N.; Porter, M.A.; Lambiotte, R. Random walks and diffusion on networks. arXiv 2016, arXiv:1612.03281. [Google Scholar] [CrossRef]
- Brin, S.; Page, L. The anatomy of a large-scale hypertextual Web search engine. Comput. Netw. ISDN Syst. 1998, 30, 107–117. [Google Scholar] [CrossRef]
- Gleich, D.F. PageRank Beyond the Web. SIAM Rev. 2015, 57, 321–363. [Google Scholar] [CrossRef]
- Rosvall, M.; Bergstrom, C.T. Maps of random walks on complex networks reveal community structure. Proc. Natl. Acad. Sci. USA 2008, 105, 1118–1123. [Google Scholar] [CrossRef] [PubMed]
- Delvenne, J.C.; Yaliraki, S.N.; Barahona, M. Stability of graph communities across time scales. Proc. Natl. Acad. Sci. USA 2010, 107, 12755–12760. [Google Scholar] [CrossRef] [PubMed] [Green Version]
- Chung, F.R.K. Spectral Graph Theory. In CBMS Regional Conference Series in Mathematics; American Mathematical Society: Providence, RI, USA, 1996; Volume 92. [Google Scholar]
- Holme, P.; Saramäki, J. Temporal networks. Phys. Rep. 2012, 519, 97–125. [Google Scholar] [CrossRef]
- Masuda, N.; Lambiotte, R. A Guide to Temporal Networks; World Scientific Publishing Europe Ltd.: London, UK, 2016. [Google Scholar]
- Jo, H.H.; Karsai, M.; Kertész, J.; Kaski, K. Circadian pattern and burstiness in mobile phone communication. New J. Phys. 2012, 14, 013055. [Google Scholar] [CrossRef]
- Lambiotte, R.; Salnikov, V.; Rosvall, M. Effect of memory on the dynamics of random walks on networks. J. Complex Netw. 2014, 3, 177–188. [Google Scholar] [CrossRef]
- Karsai, M.; Kaski, K.; Barabási, A.L.; Kertész, J. Universal features of correlated bursty behaviour. Sci. Rep. 2012, 2, 397. [Google Scholar] [CrossRef] [PubMed] [Green Version]
- Scholtes, I.; Wider, N.; Pfitzner, R.; Garas, A.; Tessone, C.J.; Schweitzer, F. Causality-driven slow-down and speed-up of diffusion in non-Markovian temporal networks. Nat. Commun. 2014, 5. [Google Scholar] [CrossRef]
- Barabasi, A.L. Bursts: The Hidden Patterns Behind Everything We Do, from Your E-mail to Bloody Crusades; Plume: New York, NY, USA, 2010. [Google Scholar]
- Starnini, M.; Baronchelli, A.; Barrat, A.; Pastor-Satorras, R. Random walks on temporal networks. Phys. Rev. E 2012, 85, 056115. [Google Scholar] [CrossRef] [PubMed]
- Karsai, M.; Kivelä, M.; Pan, R.K.; Kaski, K.; Kertész, J.; Barabási, A.L.; Saramäki, J. Small but slow world: How network topology and burstiness slow down spreading. Phys. Rev. E 2011, 83, 025102. [Google Scholar] [CrossRef] [PubMed]
- Hoffmann, T.; Porter, M.A.; Lambiotte, R. Random Walks on Stochastic Temporal Networks. In Understanding Complex Systems; Springer: Berlin/Heidelberg, Germany, 2013; pp. 295–313. [Google Scholar]
- Speidel, L.; Lambiotte, R.; Aihara, K.; Masuda, N. Steady state and mean recurrence time for random walks on stochastic temporal networks. Phys. Rev. E 2015, 91, 012806. [Google Scholar] [CrossRef] [PubMed]
- Saramäki, J.; Holme, P. Exploring temporal networks with greedy walks. Eur. Phys. J. B 2015, 88. [Google Scholar] [CrossRef]
- Lambiotte, R.; Tabourier, L.; Delvenne, J.C. Burstiness and spreading on temporal networks. Eur. Phys. J. B 2013, 86. [Google Scholar] [CrossRef]
- Delvenne, J.C.; Lambiotte, R.; Rocha, L.E.C. Diffusion on networked systems is a question of time or structure. Nat. Commun. 2015, 6. [Google Scholar] [CrossRef] [PubMed]
- Génois, M.; Vestergaard, C.L.; Fourner, J.; Panisson, A.; Bonmarin, I.; Barrat, A. Data on face-to-face contacts in an office building suggest a low-cost vaccination strategy based on community linkers. Netw. Sci. 2015, 3, 326–347. [Google Scholar] [CrossRef] [Green Version]
- Gemmetto, V.; Barrat, A.; Cattuto, C. Mitigation of infectious disease at school: Targeted class closure vs. school closure. BMC Infect. Dis. 2014, 14, 695. [Google Scholar] [CrossRef] [PubMed] [Green Version]
- Stehlé, J.; Voirin, N.; Barrat, A.; Cattuto, C.; Isella, L.; Pinton, J.F.; Quaggiotto, M.; den Broeck, W.V.; Régis, C.; Lina, B.; et al. High-Resolution Measurements of Face-to-Face Contact Patterns in a Primary School. PLoS ONE 2011, 6, e23176. [Google Scholar] [CrossRef] [PubMed] [Green Version]
- Mastrandrea, R.; Fournet, J.; Barrat, A. Contact Patterns in a High School: A Comparison between Data Collected Using Wearable Sensors, Contact Diaries and Friendship Surveys. PLoS ONE 2015, 10, e0136497. [Google Scholar] [CrossRef] [PubMed] [Green Version]
- Vanhems, P.; Barrat, A.; Cattuto, C.; Pinton, J.F.; Khanafer, N.; Régis, C.; Kim, B.; Comte, B.; Voirin, N. Estimating Potential Infection Transmission Routes in Hospital Wards Using Wearable Proximity Sensors. PLoS ONE 2013, 8, e73970. [Google Scholar] [CrossRef]
- Rosvall, M.; Esquivel, A.V.; Lancichinetti, A.; West, J.D.; Lambiotte, R. Memory in network flows and its effects on spreading dynamics and community detection. Nat. Commun. 2014, 5. [Google Scholar] [CrossRef] [PubMed]
Figure 1.
Illustration of the backtracking bias on an edge . When the walker arrives on j via , the next activation time t of the edge is given by the distribution of the renewal process, whereas the next activation time of another independent edge is given by the distribution associated to the bus paradox .

Figure 2.
Probability of backtracking on an edge for various distributions: Power-law, Gamma (standard deviation and Exponential). Monte-Carlo simulations (circle) and theoretical curves obtained with (5) (solid line) coincide. For a given family, the higher the variance , the higher the probability of backtracking. For power-law distributions with small exponent, the backtracking probability remains large and decreases slowly as the degree increases.
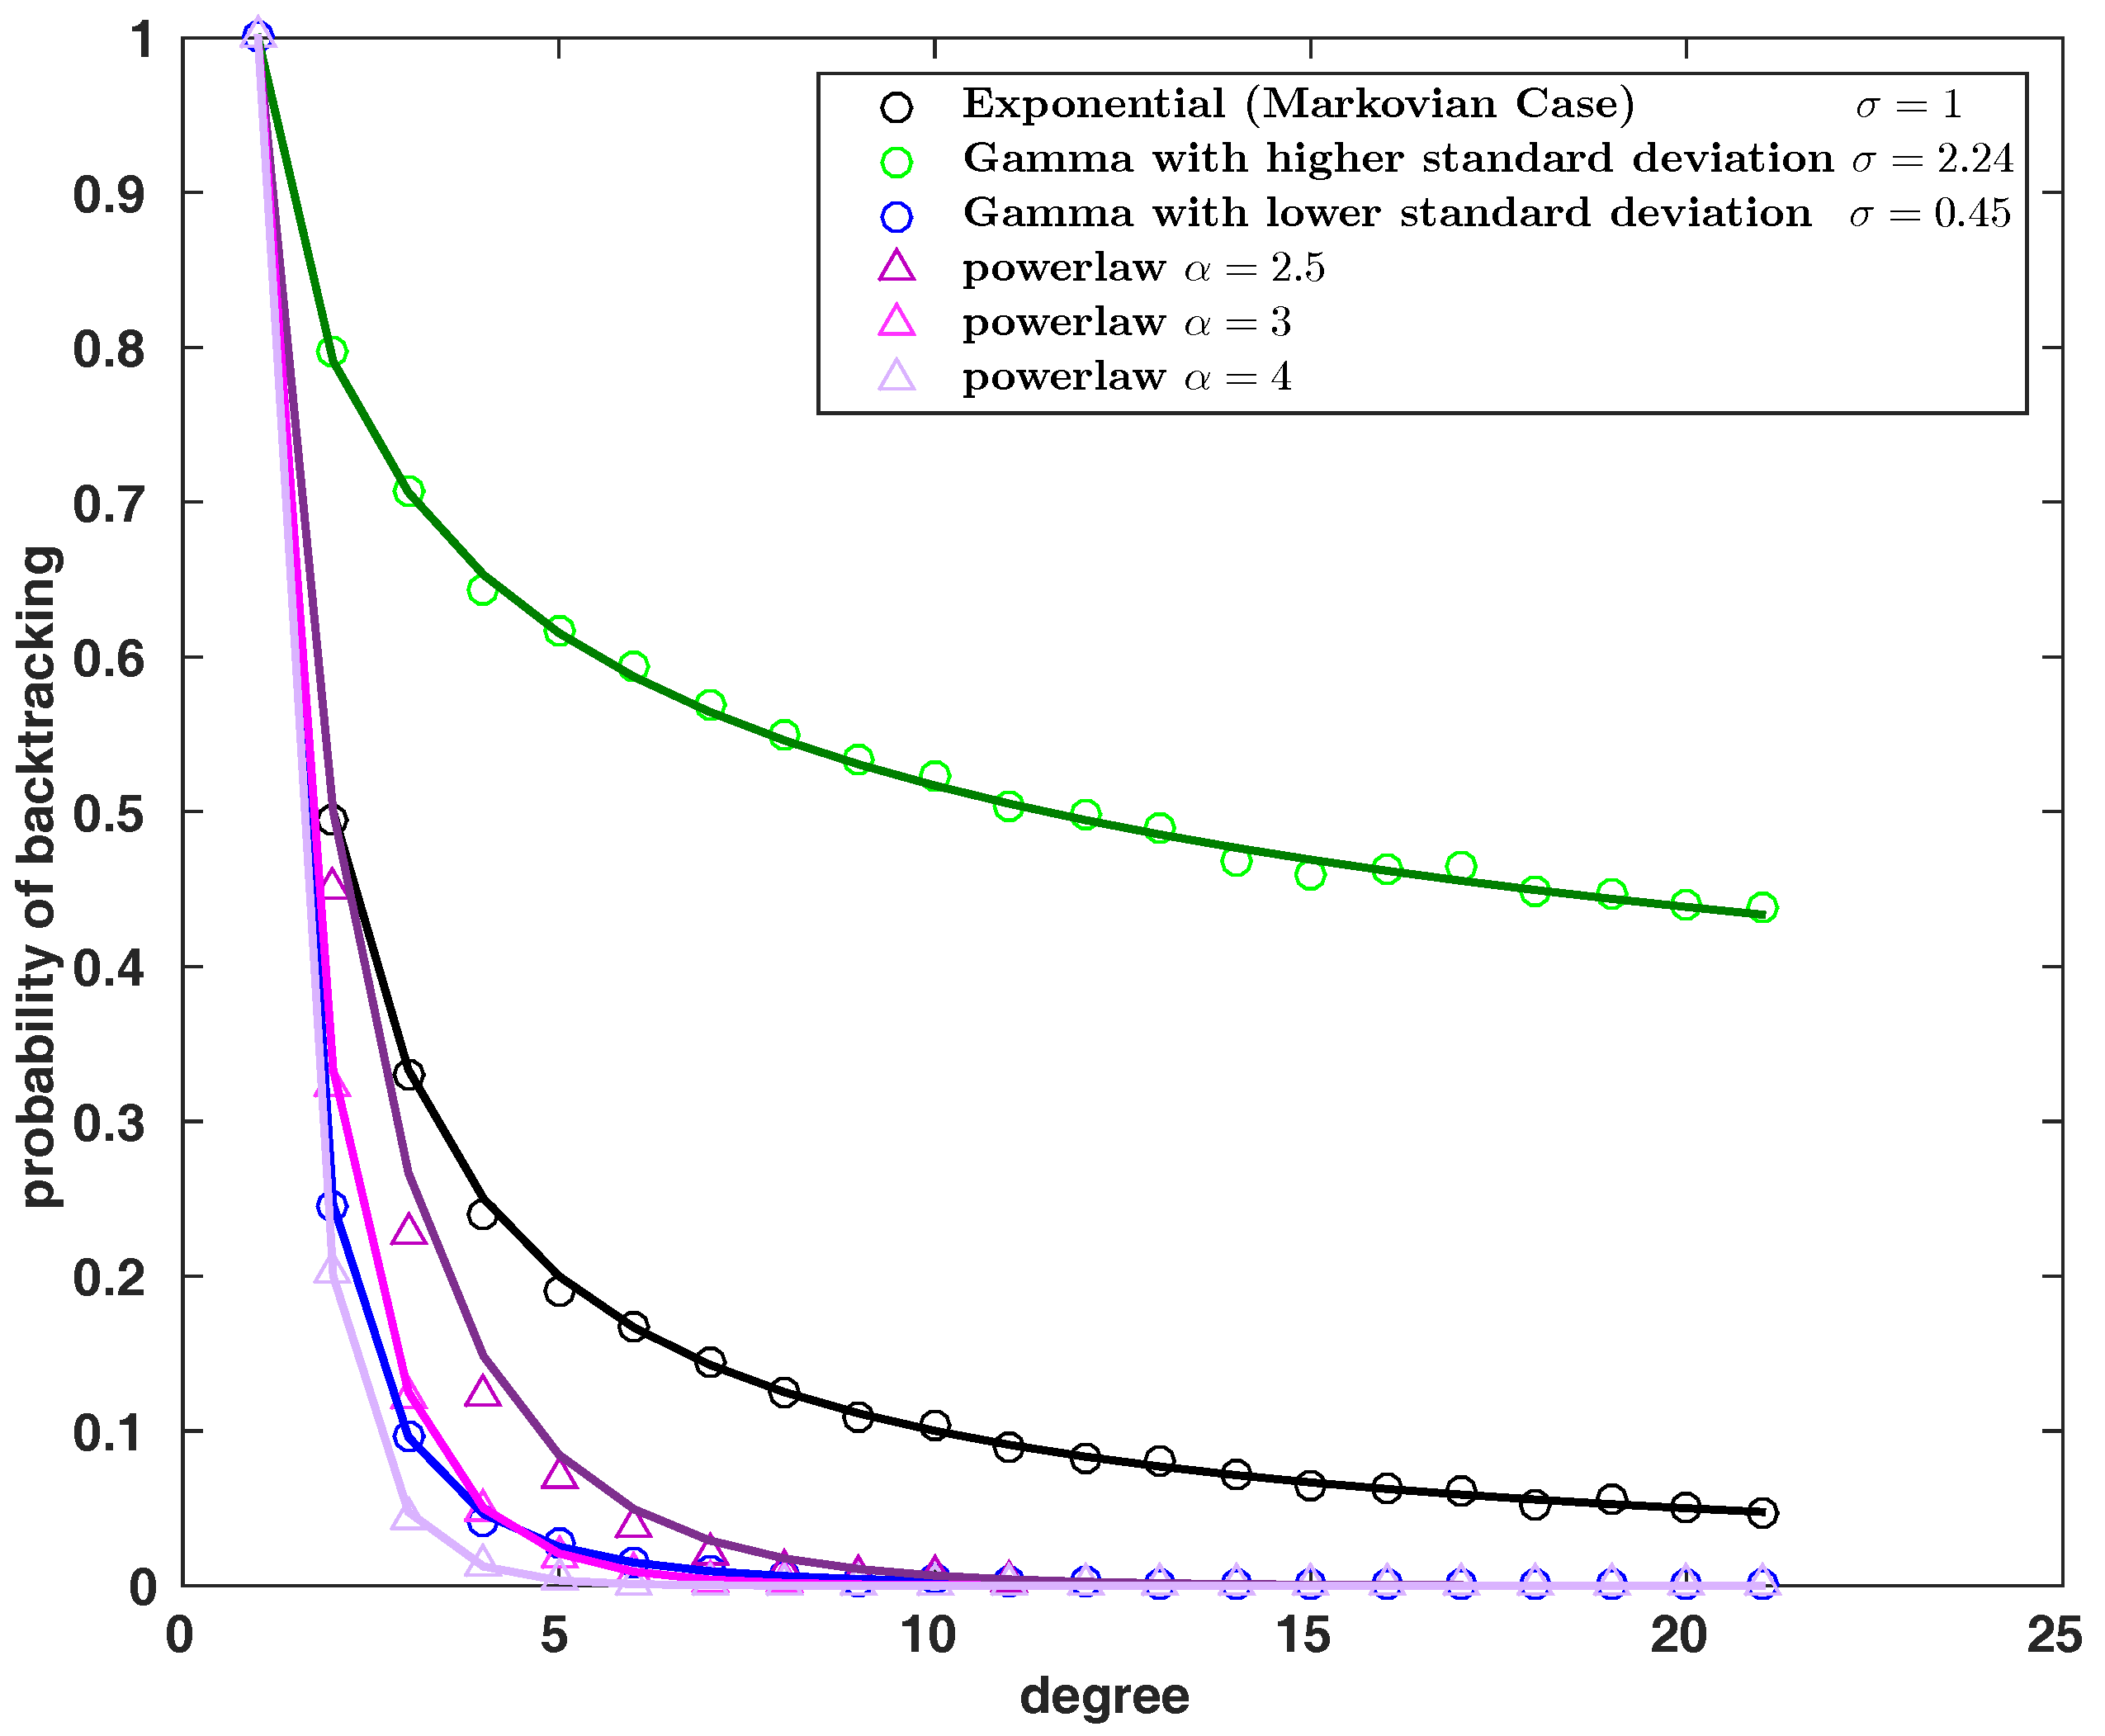
Figure 3.
Probability of backtracking on an edge for real-data. Each edge is governed by an i.i.d. renewal processes. All inter-activation times on all edges have been aggregated to a unique global distribution . The probability of backtracking is much larger than (corresponding to the Markovian case), even under destruction of the correlations between edges activities. Standard deviation of the empirical inter-activation distributions are given in parentheses. For each dataset, the probabilities have been computed up to the largest nodes degree in the corresponding network.

Figure 4.
Relative error of the linear approximation (9) in a network composed of 2 communities (2 cliques of 50 nodes of degree 50).
Figure 4.
Relative error of the linear approximation (9) in a network composed of 2 communities (2 cliques of 50 nodes of degree 50).

Table 1.
Shift of the spectral gap of the transition matrix due to the backtracking bias induced by the network temporality. The spectral gap is largely reduced, showing the strong impact of the inter-activity distribution on the number of steps required to explore the network.
Table 1.
Shift of the spectral gap of the transition matrix due to the backtracking bias induced by the network temporality. The spectral gap is largely reduced, showing the strong impact of the inter-activity distribution on the number of steps required to explore the network.
| Spectral Gap of Markovian RW | Spectral Gap of Backtracking RW | |
|---|---|---|
| Primary | 0.4151 | 0.2738 |
| Work | 0.3057 | 0.0569 |
| Highschool | 0.1349 | 0.0396 |
| Hospital | 0.5695 | 0.2105 |
© 2017 by the authors. Licensee MDPI, Basel, Switzerland. This article is an open access article distributed under the terms and conditions of the Creative Commons Attribution (CC BY) license (http://creativecommons.org/licenses/by/4.0/).
Share and Cite
MDPI and ACS Style
Gueuning, M.; Lambiotte, R.; Delvenne, J.-C. Backtracking and Mixing Rate of Diffusion on Uncorrelated Temporal Networks. Entropy 2017, 19, 542. https://doi.org/10.3390/e19100542
AMA Style
Gueuning M, Lambiotte R, Delvenne J-C. Backtracking and Mixing Rate of Diffusion on Uncorrelated Temporal Networks. Entropy. 2017; 19(10):542. https://doi.org/10.3390/e19100542
Chicago/Turabian StyleGueuning, Martin, Renaud Lambiotte, and Jean-Charles Delvenne. 2017. "Backtracking and Mixing Rate of Diffusion on Uncorrelated Temporal Networks" Entropy 19, no. 10: 542. https://doi.org/10.3390/e19100542
Note that from the first issue of 2016, this journal uses article numbers instead of page numbers. See further details here.