Forewarning Model of Regional Water Resources Carrying Capacity Based on Combination Weights and Entropy Principles


1
School of Civil Engineering and Environmental Engineering, Anhui Xinhua University, Hefei 230088, China
2
Institute of Safety and Environmental Assessment, Anhui Xinhua University, Hefei 230088, China
3
School of Civil Engineering, Hefei University of Technology, Hefei 230009, China
4
Key Laboratory for Water and Sediment Sciences of Ministry of Education, School of Environment, Beijing Normal University, Beijing 100875, China
*
Author to whom correspondence should be addressed.
Entropy 2017, 19(11), 574; https://doi.org/10.3390/e19110574
Submission received: 5 September 2017
/
Revised: 7 October 2017
/
Accepted: 19 October 2017
/
Published: 25 October 2017
(This article belongs to the Special Issue Entropy Applications in Environmental and Water Engineering)
Abstract
:As a new development form for evaluating the regional water resources carrying capacity, forewarning regional water resources of their carrying capacities is an important adjustment and control measure for regional water security management. Up to now, most research on this issue have been qualitative analyses, with a lack of quantitative research. For this reason, an index system for forewarning regional water resources of their carrying capacities and grade standards, has been established in Anhui Province, China, in this paper. Subjective weights of forewarning indices can be calculated using a fuzzy analytic hierarchy process, based on an accelerating genetic algorithm, while objective weights of forewarning indices can be calculated by using a projection pursuit method, based on an accelerating genetic algorithm. These two kinds of weights can be combined into combination weights of forewarning indices, by using the minimum relative information entropy principle. Furthermore, a forewarning model of regional water resources carrying capacity, based on entropy combination weight, is put forward. The model can fully integrate subjective and objective information in the process of forewarning. The results show that the calculation results of the model are reasonable and the method has high adaptability. Therefore, this model is worth studying and popularizing.
1. Introduction
With the continuous development of the economy and the increase in population in China, the contradiction between the rapid and steady development of the economy, the health of the ecological environment and the sustainable development of water resources has become increasingly prominent [1]. The water resources carrying capacity is a comprehensive index, which measures whether the water resources system is sustainable or not. The water resources carrying capacity is the largest scale for the development of economy and society that can be supported by regional water resources in a particular area and the specific historical stage, which is based on the designed available water resources, the predictable technology and the development level of economic and social factors, and takes into account the principles of sustainable development and a good ecological environment. This index is a “bottle neck” that determines whether the water resources can support the population and the coordinated development of economy and environment in a water shortage area [2]. Therefore, the forewarning and control of the regional water resources carrying capacity are significant for ensuring the safety of water resources.
Based on a comprehensive analysis of the factors affecting the regional water resources carrying capacity, the forewarning index system and corresponding grade standard of regional water resources carrying capacity have been set up. The actual values of the forewarning indices in different periods of the study area are compared with the corresponding standard values at different levels, to judge and identify the warning status of the study area. Currently, there are many studies on the evaluation of the water resources carrying capacity. Xiang et al. simplified seven factors, which included irrigation rate, the utilization rate of water resources, the developmental degree of water resources, a water supply module, a water requirement module, the per capita water supply and the ecological environment water use rate, into two principal components, with a principal component analysis. In addition, the corresponding principal component evaluation criteria of the water resources carrying capacity were obtained, based on the classification criteria of the evaluation parameters. On this basis, the water resources carrying capacity of each district was evaluated [3]. Zhou et al. calculated the comprehensive score of the water resources carrying capacity in Guiyang City, according to the three principal components of the water resources carrying capacity that were selected by the principal component analysis and their weights were calculated by entropy [4]. Gong et al. evaluated the current situation of the water resource capacity in Lanzhou and its dynamic trends, by using the method of fuzzy comprehensive evaluation, based on historical data over a 40-year period in Lanzhou [5]. Based on the analysis of the main factors affecting the carrying capacity, Liang et al. used a factor analysis method to determine their weights. Then the comprehensive index value of each partition in the Shiyang river basin was calculated, to evaluate the water resources carrying capacity [6]. Zhao et al. analyzed the water resources carrying capacity in Ningxia, during 2004–2014, by using the principal component analysis and factor analysis. Then, based on these analyses, the water resources utilization index and classification criteria in different areas of Ningxia were obtained [7]. Chen et al. put forward a new fuzzy model, according to the Jaynes maximum entropy in information theory, and applied this model in assessing the water resources carrying capacity in Henan province [8]. Wang et al. constructed a set pair analysis model, based on entropy weight, and calculated the average connection degree of each region with this model, to rank their water resources carrying capacities [9]. Li et al. simulated changes in the carrying capacity of water resources under the conditions of future water management policies, by using a system dynamics model [10]. However, from a theoretical and practical point of view, the regional water resources carrying capacity warning is a new form of development for evaluating the regional water resources carrying capacity, and is still in its infancy.
Anhui Province was chosen as the study area in this paper. This province lies in the Eastern part of China. Floods and droughts occur frequently in this province. Water use in agriculture and industry, accounts for the majority of water consumption in this area. The water resources in Anhui account for only 2.7% of the total water resources in China and the water resources per capita are much lower than the world average. Thus, it is necessary to study the water resources carrying capacity in Anhui Province. The forewarning index system and grade standards of regional water resources carrying capacity were established according to the regional situation. The combination weights, which are a combination of subjective weights and objective weights, were calculated based on the principle of minimum relative information entropy. The forewarning model of the water resources carrying capacity was established according to the corresponding relationship between the “non-warning” membership degree, and the comprehensive forewarning index, of the standard grade sample value series.
2. Summary of the Study Area
2.1. Hydrological and Climatic Conditions
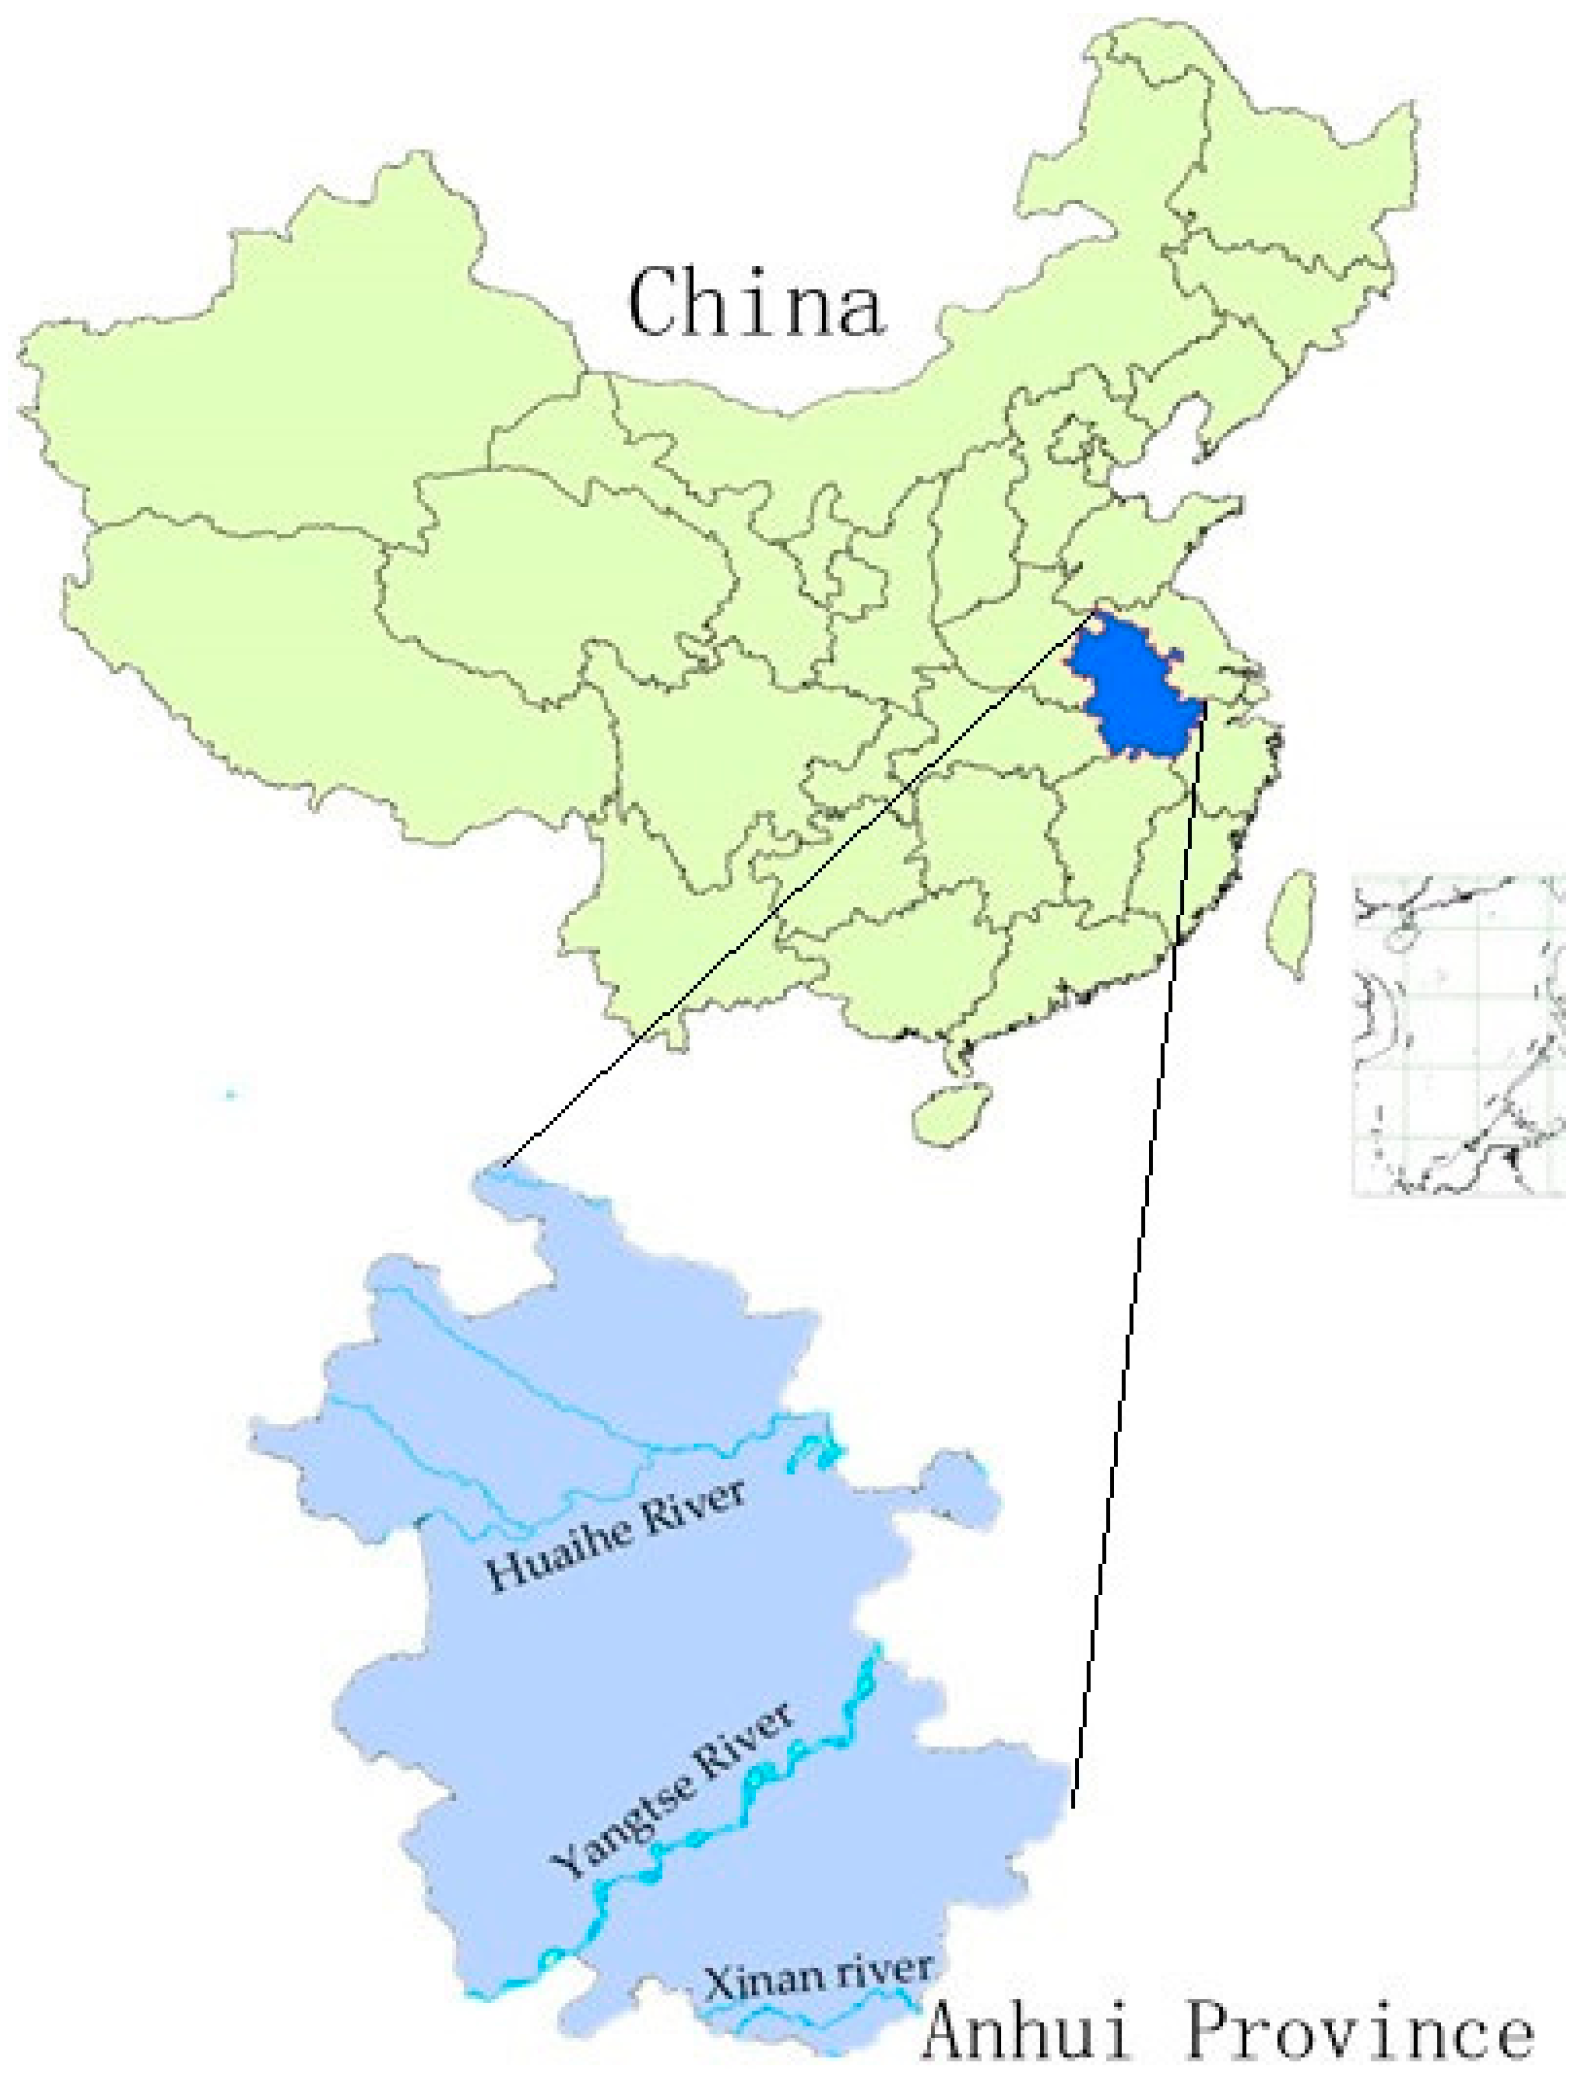
Anhui Province, located in the east of China’s mainland (Figure 1), is a total area of 1.396 × 10⁵ square kilometers, accounting for about 1.45% of the area of China. The main rivers in Anhui Province are the Yangtze river, Huaihe river and Xin’An river, as well as one of the five largest freshwater lakes, Chaohu lake. It belongs to the transition zone between the warm temperate zone and the subtropical zone, whose climate is warm and humid, and the monsoon climate is obvious. The annual average temperature is about 14–17 °C and the relative humidity is about 70–80%. The distribution of precipitation in time and space is uneven. The precipitation in the south is more than in the north and the precipitation in mountain areas is more than in plain and hilly areas. The variation of annual precipitation is great (Figure 2) and under the influence of the monsoon climate; the precipitation in summer is abundant and accounts for 40–60% of the total annual precipitation. In addition, the monthly precipitation also changes greatly, which often leads to drought and flood disasters. The Northern droughts often appear in spring and summer, while the droughts south of the Huaihe river often appear in summer and autumn. Floods occur mostly in the Huaihe river basin and secondarily, in the Yangtze river basin.
2.2. Situation of Water Resources
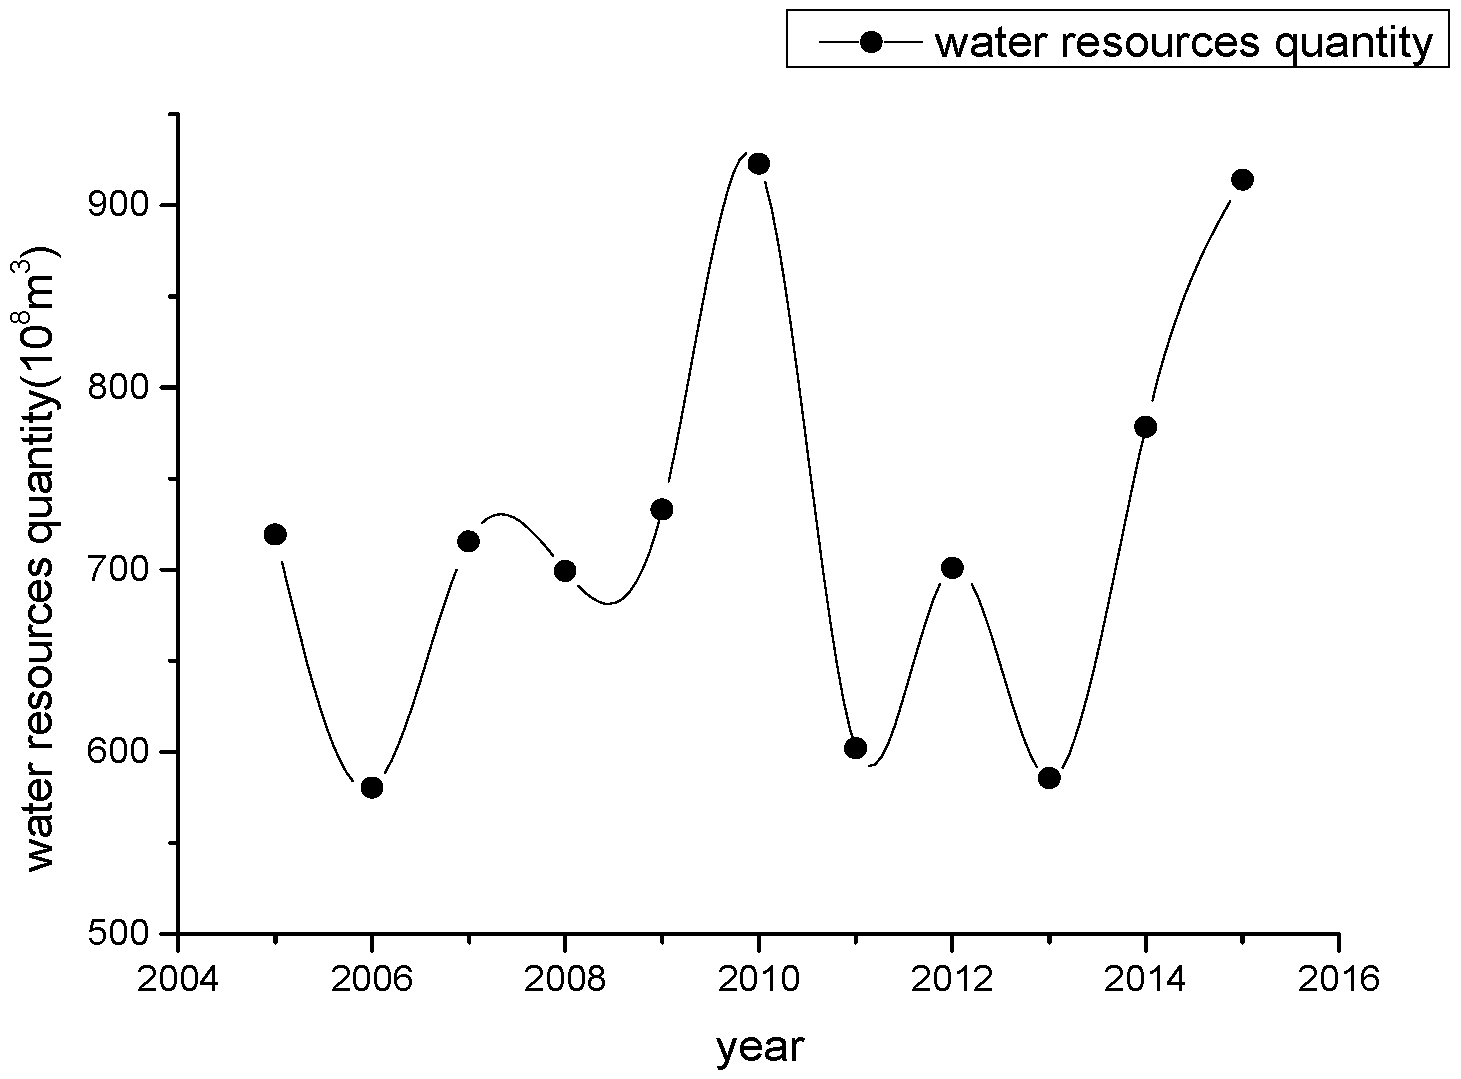
The average annual water resources in Anhui was about 72 billion m3, accounting for only 2.7% of the total water resources in China. The Per capita water resources was about 1190 m3, which accounts for about 59% of the per capita water resources of China. Similar to the precipitation distribution, the water resources also showed a trend of decreasing from the south to the north in space. At the same time, the amount of water resources had an uneven distribution over time (Figure 3).
2.3. Situation of Water Consumption
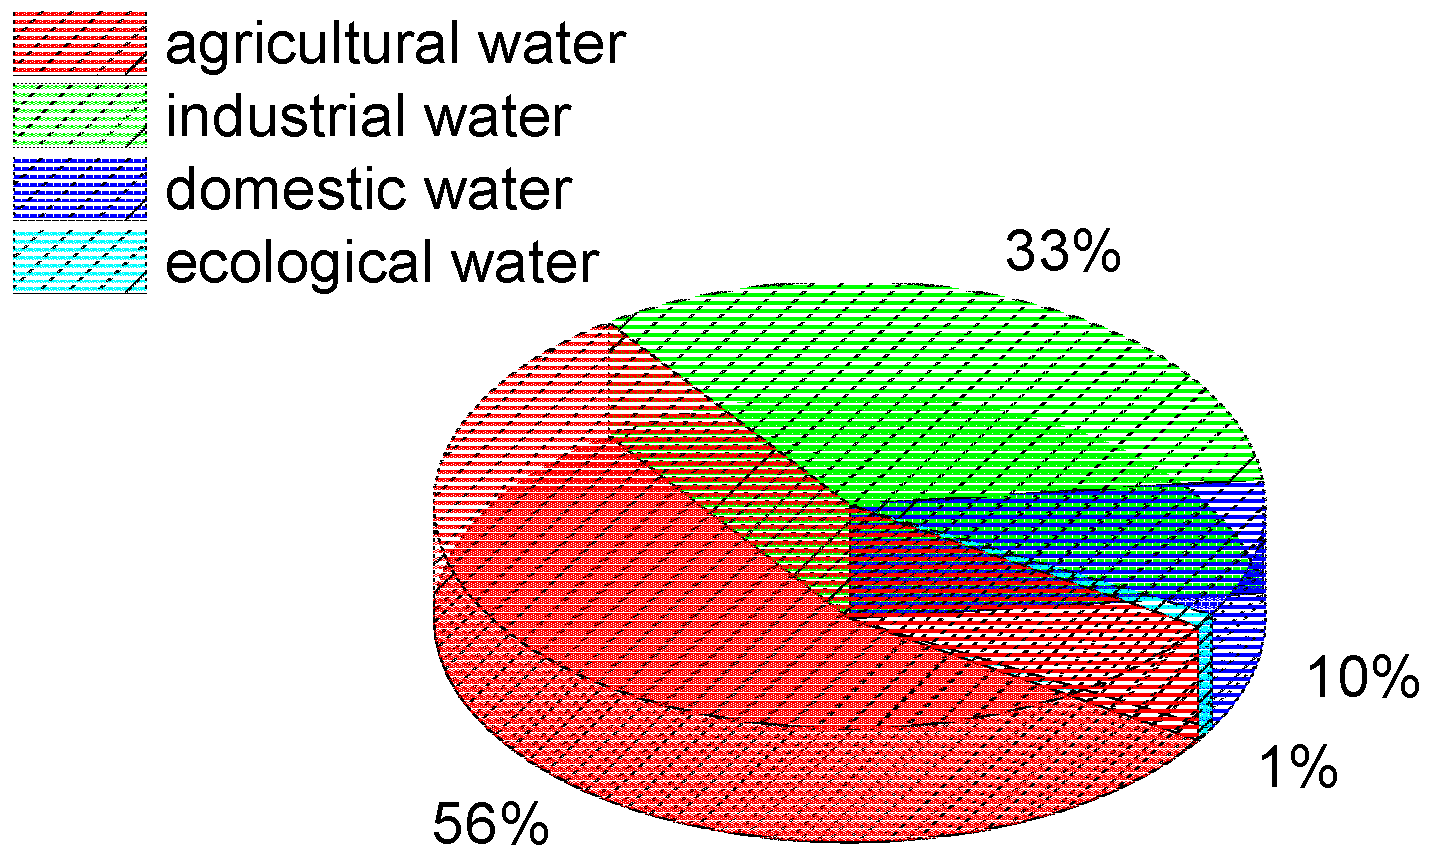
The annual water consumption in Anhui Province varied from 20 to 30 billion cubic meters in 2005–2015, which included a rapid growth trend from 2005–2009, but tended to be stable after 2010 (Figure 4). The structure of water consumption is shown in Figure 5. Agricultural water accounted for about 56% of total water consumption and industrial water, domestic water and ecological water accounted for 33%, 10% and 1%, respectively.
3. Forewarning Model and Application
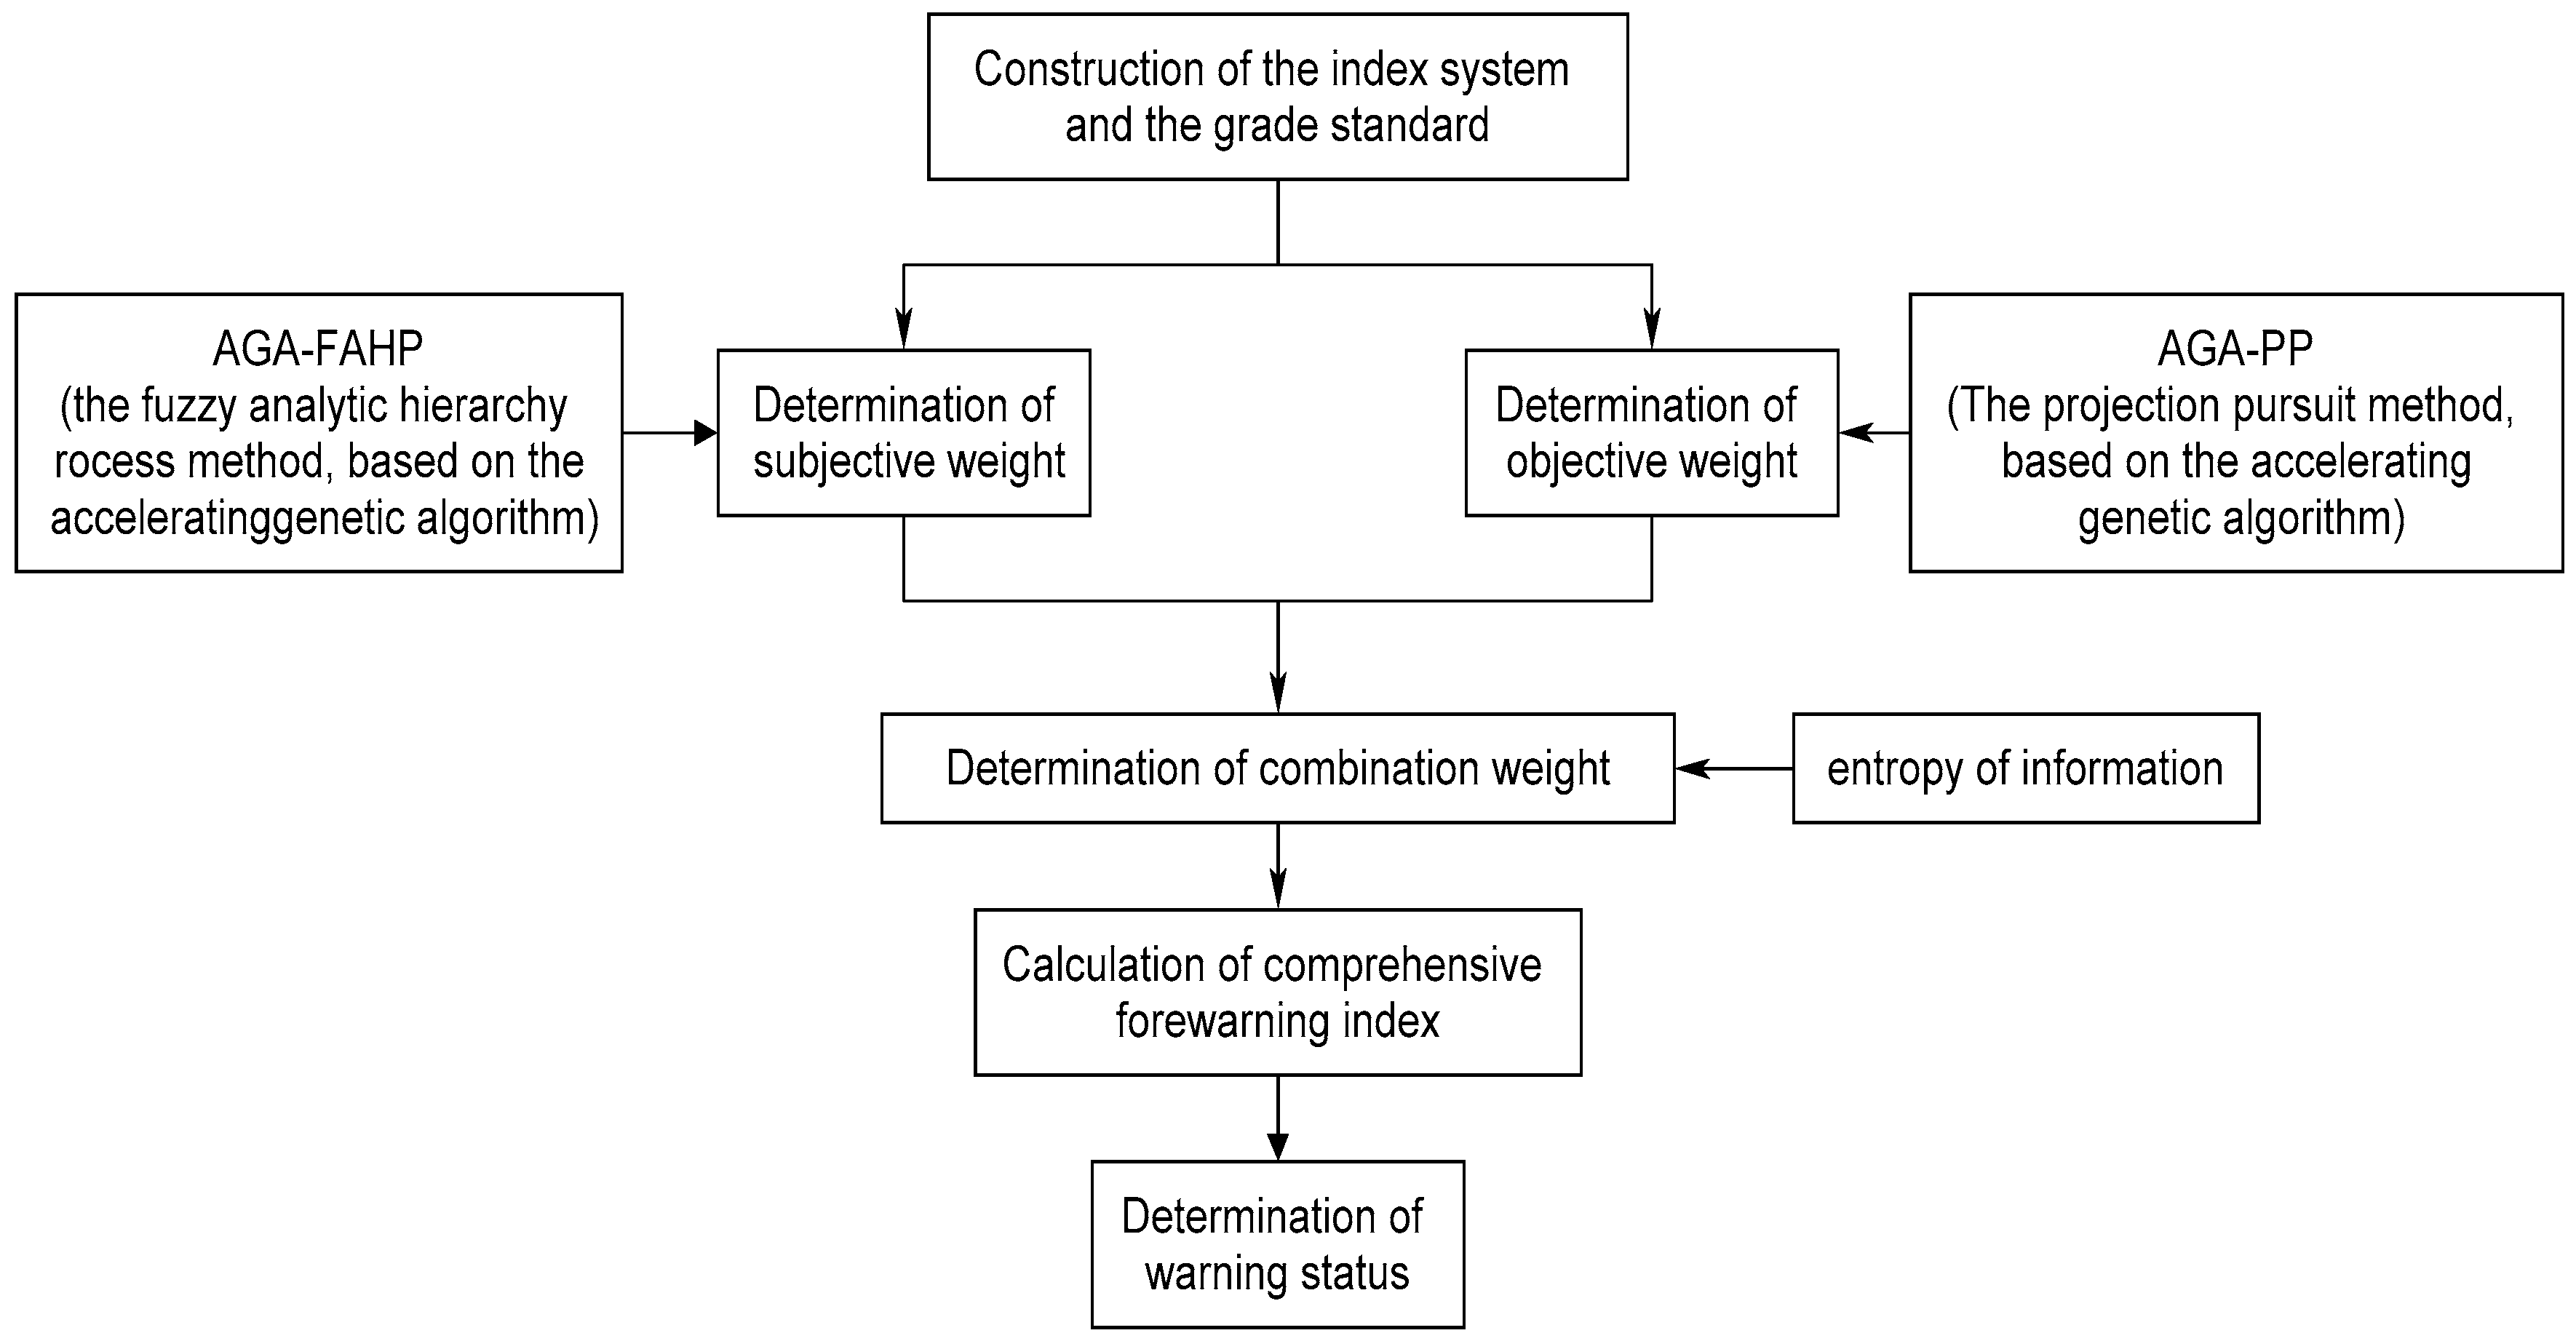
In order to illustrate the modeling steps more clearly, the forewarning model of the water resources carrying capacity in Anhui, China was used as an example to show how this model was established. The procedure of modeling is shown in the diagram of the technical route (Figure 6).
3.1. Construction of the Index System and the Grade Standard
According to the specific situation of Anhui Province, and the construction experience and principles of the index system, the index system of the water resources carrying capacity for Anhui Province was established, as shown in Table 1.
x1 is the per capita water resources. x2 is the modulus of water production. x3 is the water supply quantity. x4 is the vegetation coverage rate. x5 is the water resources development and utilization rate. x6 is the per capita gross domestic product (GDP). x7 is the wastewater discharge compliance rate. x8 is the compliance rate of the water function zone. x9 is the ecological water use rate. x10 is the daily water consumption per capita. x11 is the water consumption per ten thousand yuan GDP. x12 is the water demand per ten thousand yuan of industrial added value. x13 is the population density. x14 is the urbanization rate. x15 is the irrigation quota of farmland.
3.2. Determination of Subjective Weight by AGA-FAHP
The fuzzy analytic hierarchy process method, based on the accelerating genetic algorithm (AGA-FAHP) [11,12,13,14,15,16], was used to determine the subjective weights of each forewarning index. The fuzzy complementary judgment matrix can be defined as:
where aij is the relative importance between indices, i and j. If aij > 0.5, it means that index i is more important than index j. The bigger aij is, the more important index i is. If aij = 0.5, it means that index i is as important as index j. If aij < 0.5, it means that index j is more important than index i.
If A has complete consistency, then there is [17]:
where the bars | | denote the absolute value; {w(j), j = 1,2, …, n} is the subjective weight of each index.
In practical applications, due to the fuzziness and complexity of the evaluation system and the diversity and instability of a person’s cognition, there is no uniform and exact yardstick to measure the importance of indices. Therefore, in practical applications, conditions that matrix A, given by the decision-maker, cannot satisfy with consistency, often occur. Thus,
where the objective function CIC(n) is the consistency index coefficient; n is the order of matrix A.
The weight of each index w(j) can be calculated according to Equation (3). If CIC(n) < 0.1, A is considered to have satisfactory consistency and the corresponding w(j) is the subjective weight of each index [17].
By comparing the indices one by one, the fuzzy complementary judgment matrixes of each subsystem are obtained:
If the nonlinear optimization problem is calculated with Equation (3) by AGA-FAHP, the subjective weights of the indices in each subsystem can be obtained.
The subjective weights of indices x1 to x4, in the holding power subsystem of the water resources carrying capacity, are w1 = (0.3335, 0.3332, 0.2665, 0.0668).
The corresponding CIC is (n) = 2.60 × 10⁻⁴ < 0.1.
The subjective weights of indices x5 to x9 in the regulatory and control subsystems of the water resources carrying capacity are w2 = (0.2968, 0.2427, 0.1469, 0.2167, 0.0969).
The corresponding CIC is (n) = 0.03 < 0.1.
The subjective weights of indices x10 to x15 in the regulatory and control subsystems of the water resources carrying capacity are w3 = (0.0824, 0.1997, 0.1561, 0.2024, 0.1597, 0.1997).
The corresponding CIC is (n) = 0.02 < 0.1.
Then, the importance of three subsystems and the fuzzy complementary judgment matrix can be compared with the following:
Using AGA-FAHP, the weights of these three subsystems can be calculated: w’ = (0.4, 0.2, 0.4).
The corresponding CIC is (n) = 1.19 × 10⁻⁸ < 0.1.
The subjective weights of each index relative to the water resources carrying capacity (ws) can be obtained by multiplying the weights of each index, relative to the subsystems (w1, w2, w3) and by the weights of each subsystem (w’), as shown in Table 2. For example, ws1 = 0.3335 × 0.4 = 0.1334.
3.3. Determination of Objective Weight by AGA-PP
The projection pursuit method, based on the accelerating genetic algorithm (AGA-PP) [16,18,19], was used to determine the objective weight of each index: {wo(j), j = 1,2, …, n}. According to the water resources carrying capacity evaluation standard, the water resources carrying capacity was divided into three grades: 1 (available load state), 2 (critical state), and 3 (overload state). When the grade of the carrying capacity of regional water resources is greater than 1, the state of the water resources carrying capacity is changed from available load to overload. According to the principle of forewarning, the system will enter into the “warning” state. The “non-warning” state of the regional water resources carrying capacity is a fuzzy set, and its membership degree (f) can be defined as follows: When the water resources carrying capacity is in an available load state, the f value is 1; when the water resources carrying capacity is in an overload state, the f value is 0. The “non-warning” membership degree (f) is divided into five sub-intervals: [0.8, 1.0], [0.6, 0.8], [0.4, 0.6], [0.2, 0.4], and [0.0, 0.2], which are defined as the non-warning interval, light warning interval, middle warning interval, heavy warning interval, and great warning interval, respectively. In order to determine the objective weights of each index, nine standard grade sample values were interpolated linearly between the critical values of each index. At the same time, the “non-warning” membership (f) was also interpolated linearly in [0, 1]. Therefore, together with the two critical sample values, there were 11 standard rank sample values of each index obtained, which are shown as the sample numbers 1–11 in Table 3. In Table 3, the meanings of the warning indices x1–x15 are the same as those in Table 1. The sample numbers 12–22 are the sample value series of the water resources carrying capacity of Anhui Province in 2005–2015.
The sample value series are denoted as {x(i,j)|i = 1,2, …, m; j = 1,2, …, n}. For this example: m = 22 and n = 15. In order to eliminate the dimension effect of each index and make the modeling universal, it was necessary to standardize the x(i,j).The standardized result was recorded as y(i,j). For positive indices (the larger the index value is, the greater the water resources carrying capacity is)
For negative indices (The larger the index value, the smaller the carrying capacity of water resources)
where the xmin(j) is the minimum value of the j index in the sample value; xmax(j) is the maximum value of the j index in the sample value series. In addition, in this example, the indices, x1–x4 and x6–x8 are the positive indices. The negative indices include x5 and x10–x15.
Projection pursuit (PP) [20,21] is a type of statistical technique which involves finding the optimal possible projections in multidimensional data. In this example, it was used to make fifteen-dimensional data {y(i,j)} into a one-dimensional projection value date p(i), whose unit length projection direction was a = (a(1), a(2), …, a(15)):
In the projection process, the projection value, p(i), should extract the change information in {y(i,j)} as much as possible, and make the projection of the clusters as far as possible. This means the standard deviation (S) of p(i) is as large as possible. The local projection points should be as dense as possible, and it is best to condense into a number of clusters. In addition, according to Jaynes maximum entropy principle [22], when only partial information is grasped, the distribution of a2(j) which makes the information entropy maximum and meets the condition of Equation (7), should be adopted. Based on this, the projection index function can be constructed as [16]:
where S(a) is the standard deviation of p(i); D(a) is the local density of p(i); and E(a) is the information entropy of a2(j).
where p is the meaning of the sequence {p(i)}. R is the window radius for calculating the local density, the selection of which should not only make the average number of projection points contained in the window not too little, but also make it not increase too fast with an increase in sample size. Normally, R = 0.1S. rij = |p(i) − p(j)|. u(t) is a unit step function. When t < 0, the function value of u(t) is 0. Otherwise the function value of u(t) is 1.
When the sample value series are given, the projection index function (Q(a)) will only change with the projection direction a. In addition, the classification and sorting feature structure of high-dimensional index data can be exposed by the most likely optimal projection. Therefore, the optimal projection direction can be estimated by solving the maximization of the projection index function
where a2(j) is the objective weight wo(j) of the index xj.
This is a nonlinear optimization problem with a(j) as a variable. It can be solved by AGA [13,23], which simulates biological population evolution and genetic mechanisms. For this example, the best projection direction is
a = (0.2270, 0.2426, 0.0470, 0.2288, 0.2973, 0.1759, 0.2356, 0.1171, 0.2674, 0.3666, 0.3609, 0.0100, 0.3826, 0.2946, 0.2777)
3.4. Determination of Combination Weight by Entropy of Information
After combining the subjective weights, ws(j) and objective weight, wo(j), the combination weight wc(j) of each index can be obtained. Obviously, wc(j), ws(j) and wo(j) should be as close as possible. According to the principle of minimum relative entropy [24]
where F is the relative entropy.
The Lagrange multiplier method [25] can be used to solve the above optimization problems:
Equation (14) shows that in all combinations of weights which satisfy Equation (13), the geometric average requires the least amount of information. Taking other forms of combination weights adds tangible or intangible additional information that is not actually available. According to the index of Equation (14), the combination weights of indices 1–15 can be calculated, as shown in Table 2.
3.5. Calculation of Comprehensive Forewarning Index
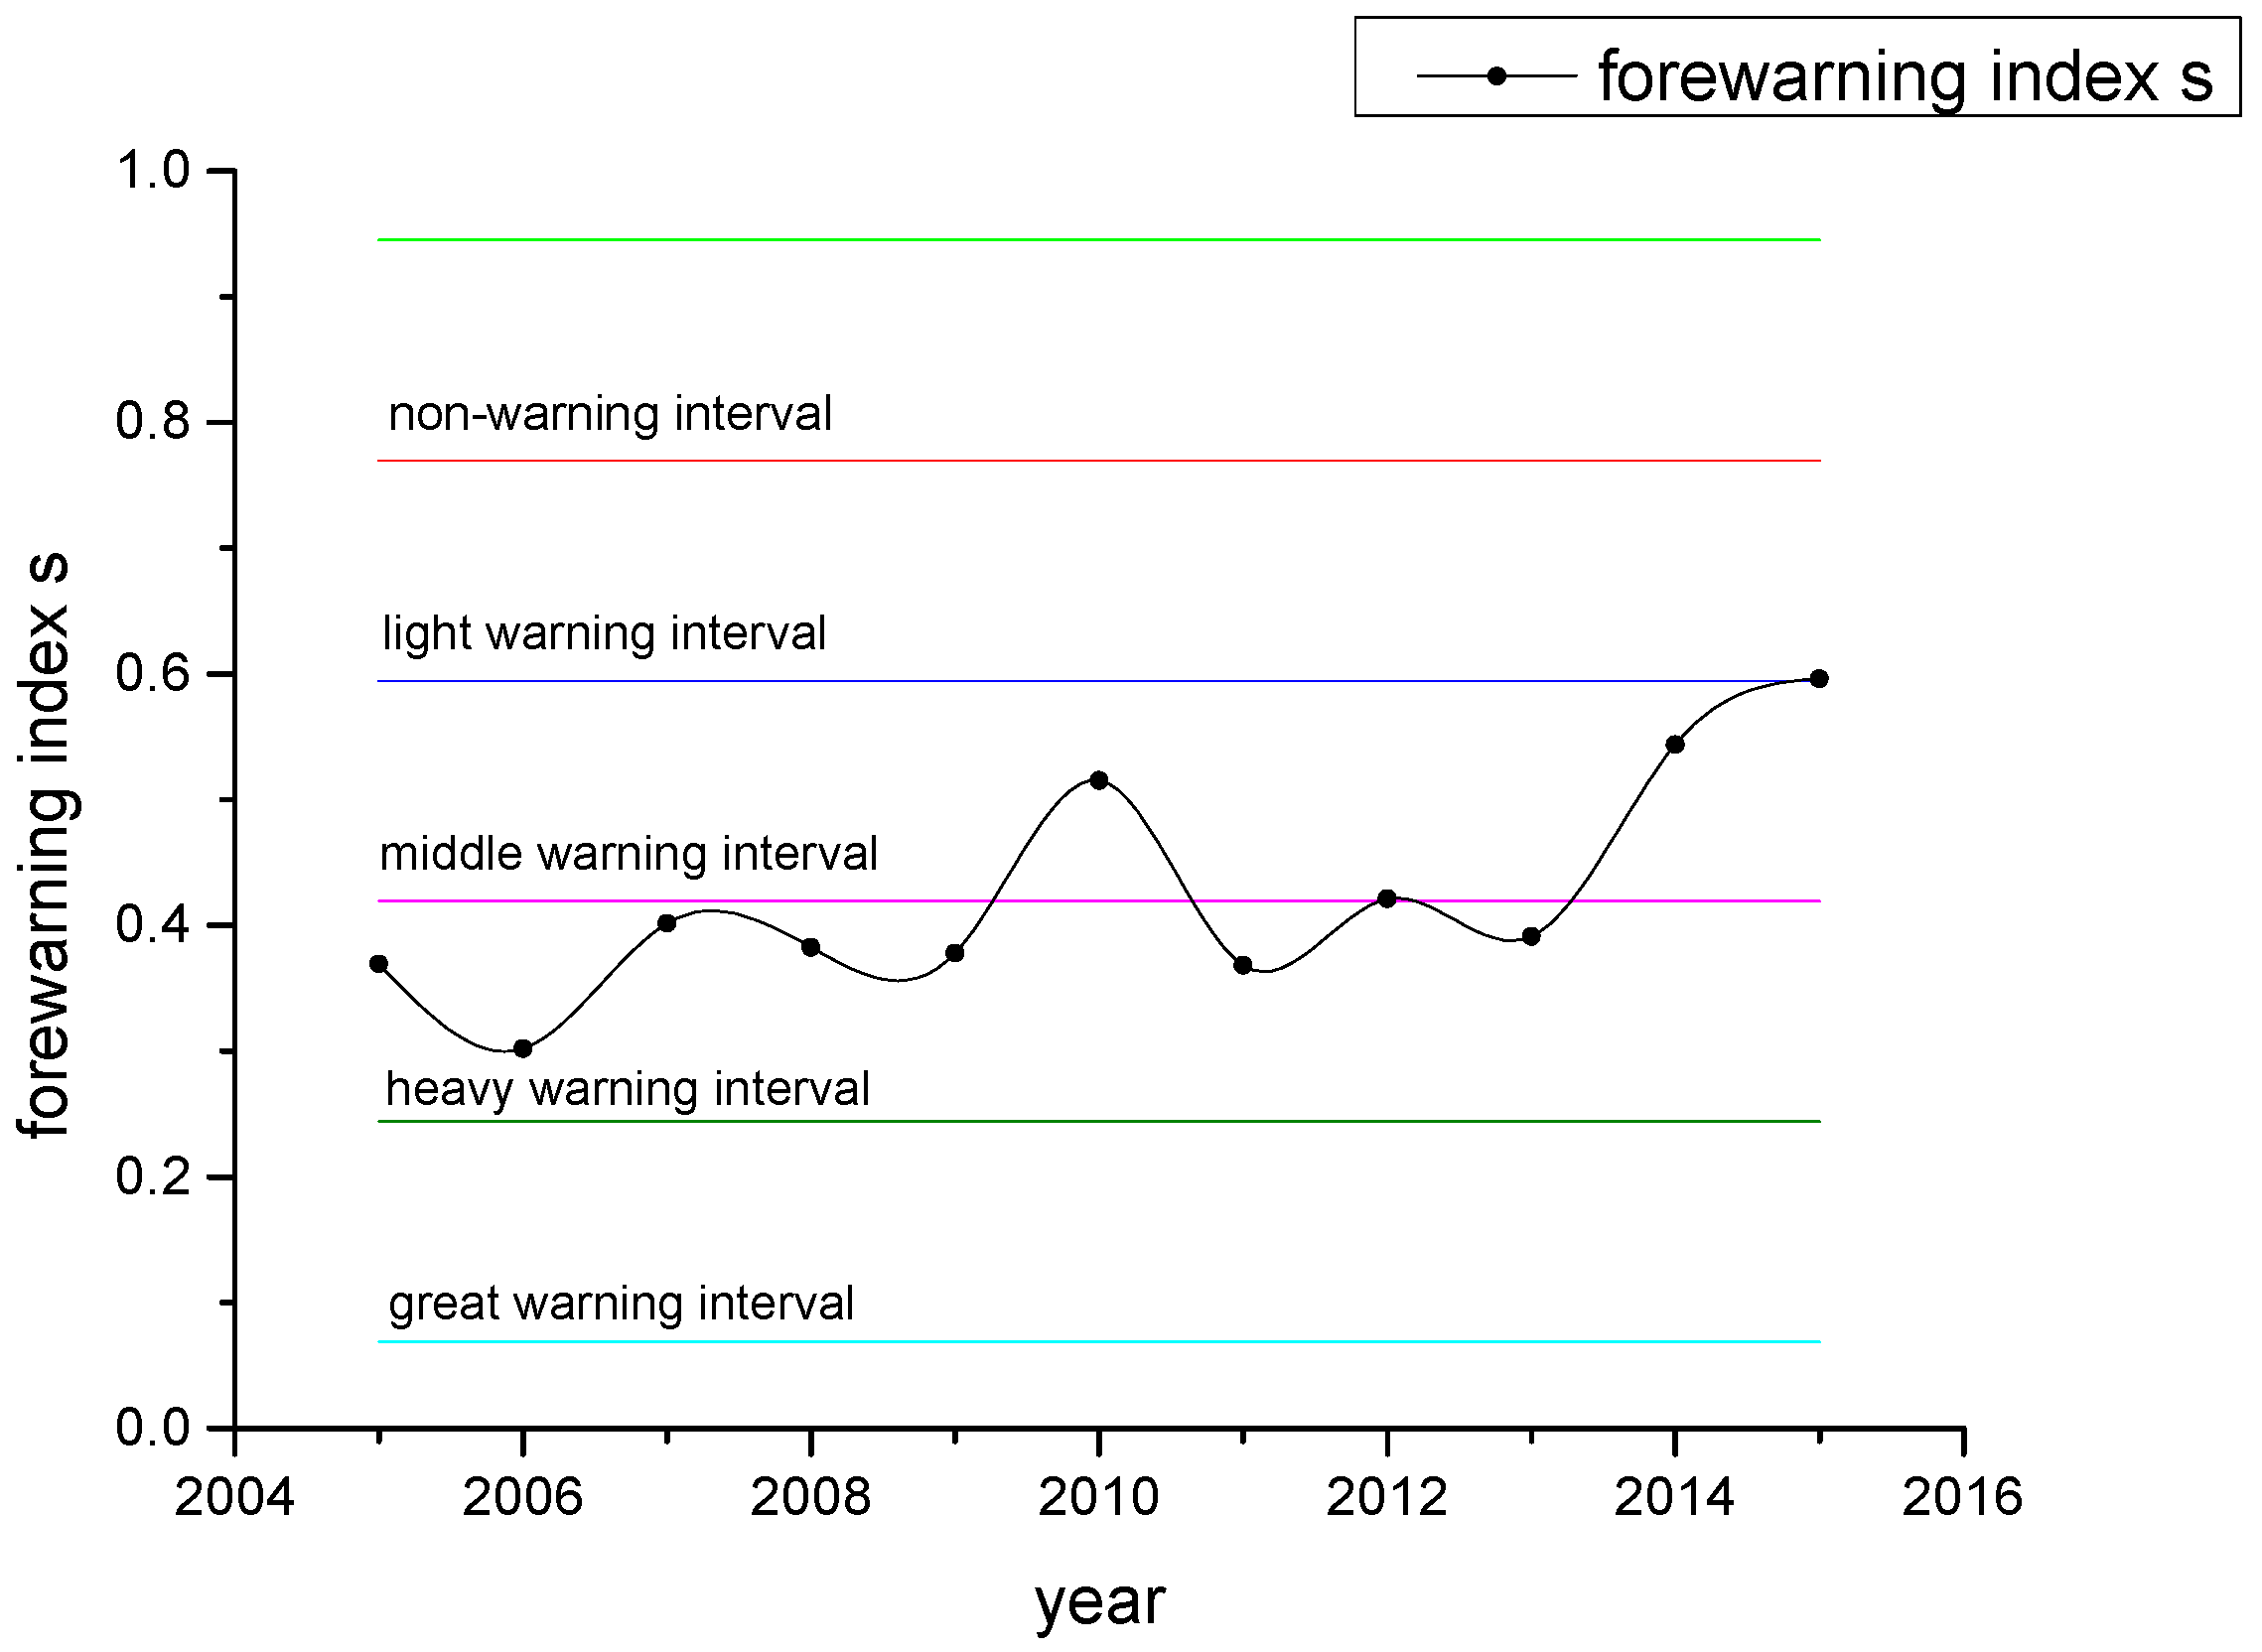
According to the corresponding relationship between the “non-warning” membership degree f(i) and the forewarning comprehensive index s(i), the forewarning interval corresponding to the forewarning comprehensive index can be obtained. The corresponding relationship is a forewarning model of the regional water resources carrying capacity based on entropy combination weights.
4. Results and Discussions
4.1. Determination of the Warning Status of the Water Resources Carrying Capacity
According to the previous introduction, we know that when the “non-warning” membership degree is f(i) ∈ [0.8, 0.1], it means that the forewarning state of the water resources carrying capacity in that year is non-warning. As shown in Table 3, the interval of the comprehensive forewarning index corresponding to the non-warning interval is [0.7697, 0.9449]. Similarly, when s(i) belongs to [0.5945, 0.7697], [0.4193, 0.5945], [0.2441, 0.4193], [0.0689, 0.2441], the corresponding warning status of the water resources carrying capacity is light warning status, middle warning status, heavy warning status, and great warning status, respectively. Taking 2005 as an example, the comprehensive forewarning index of 2005 which is equal to 0.3694 belongs to [0.2441, 0.4193]. This means that the warning status of the water resources carrying capacity in 2005 is a heavy warning status. Similarly, the warning status of the water resources carrying capacity over the years 2006–2015 can be obtained (Table 3).
Figure 7 shows the yearly variation curve of the comprehensive warning indices and the range of each warning interval. As shown in Figure 7, the water resources carrying capacity in Anhui showed an overall trend of improvement. But most years had a heavy warning status. Although the state of the water resources carrying capacity did not enter the overload state, it still should arouse our attention and measures must be taken to prevent further reduction of the water resources carrying capacity.
4.2. Results Comparison
Because the research on the water resources carrying capacity forewarning is less established, the results of this study are compared with only two other studies on the water resources carrying capacity in Anhui.
Huang and Chen selected twelve indicators from aspects of water resources, environmental development, economic development and the ecological environment, and evaluated the water resources carrying capacity in Anhui Province in 2006–2015. The water resources carrying capacity index (CCI) was used to determine the status of water resources carrying capacity. If CCI < 1, it means that the carrying capacity of water resources is in the loaded state. If CCI > 1, it means that the carrying capacity of water resources is in the overload state. And if CCI = 1, it means that the carrying capacity of water resources is in the critical load state. This standard shows that there was hardly ever a critical state. The results show that the value of CCI was between 0.9–1.3 [26]. This is basically consistent with the results of this paper which show that most warning statuses of water resources are in the middle and heavy warning statuses.
Liu and Yu used entropy weight and an analytic hierarchy process to evaluate the water resources carrying capacity in Anhui Province in 2007–2010. The comprehensive score of the water resources carrying capacity was used to measure the size of the water resources carrying capacity. The closer the value is to 0, the higher the carrying capacity is, and the closer is to 1, the lower the carrying capacity is. The result showed that the water resources carrying capacity comprehensive evaluation values in 2007–2010 were between 0.46 and 0.49, which means that the state was a critical load state [27]. This implies that the water resources in Anhui have been developed to a certain extent, no longer in the status of higher carrying capacity, but they can still provide necessary water for life and production. This is also consistent with the result of this paper.
4.3. Results Analysis
It is obvious that the forewarning comprehensive index of Anhui Province in 2015 was the highest from the last 11 years, which means that the water resources carrying capacity water resources in 2015 was the highest in the last 11 years. With reference to Figure 3, we can see that the water resources quantity in Anhui Province in 2015 was close to that of 2010, both of which were much larger than other years. However, the water resources carrying capacity in 2015 was larger than in 2010, obviously. This was because the irrigation quota of farmland in Anhui province in 2010 (358.6 cubic meters per mu) was far more than that in 2015 (282.4 cubic meters per mu) and water consumption per 10,000 GDP only accounted for about 55% in 2010 (Table 3). In addition, the water resources quantities in 2006, 2011 and 2013 were less, but the water resources carrying capacity gradually increased. This is because the water consumption per 10,000 yuan GDP of these three years had gradually decreased (Table 3). This indicates that the water use efficiency has a great influence on the water resources carrying capacity when the water resources quantity is similar. Correspondingly, when the water efficiency gap is not large, the total amount of water resources has a significant impact on the size of the water resources carrying capacity, such as in the years of 2005 and 2006.
The above analysis results are consistent with the results from the weights of influence factors analysis. According to the combination weights, the five indices which have the greatest influence on water resources carrying capacity are population density, 10,000 yuan GDP water consumption, water production modulus, per capita water resources and irrigation quota of farmland. The population density changed slowly over the past 11 years. Thus, the water use efficiency and water resources quantity are the most important factors affecting the water resources carrying capacity in Anhui Province.
Therefore, in order to improve the regional water resources carrying capacity, it is necessary to improve the efficiency of water use. In addition, some methods can be used to increase the amount of available water resources, such as improving the sewage discharge rate and utilization rate of reclaimed water.
5. Conclusions
- (1)
- In this model, for the determination of the weight of each index, the forewarning index system and the grade standards of water resources carrying capacity were established, according to the actual situation of the study area. AGA-FAHP was used to calculate the subjective weight of each index. AGA-PP was used to calculate the objective weight of each index. In addition, the minimum relative information entropy principle was used to calculate the combination weights. Then, the forewarning comprehensive index was calculated to find out the relationship between the forewarning comprehensive index and the membership degree of “non-warning”. On this basis, the forewarning model of the regional water resources carrying capacity was established. This model combined expert experience and objective information in the research area. In addition, the calculation results were reasonable. This can be used in other forewarning systems by modifying the index system and grade standards for its universality.
- (2)
- As a basic natural resources and strategic economic resources, water resources are an important guarantee for the sustainable development of economy and society. Therefore, the water resources carrying capacity forewarning, based on theory and technology, has an important significance for guiding the water resources development and management, scientifically and reasonably. With this forewarning model, we can evaluate the status of the water resources carrying capacity, study the variation trend of water resources carrying capacity and analyze the main influence factors of the water resources carrying capacity. Based on this we can forecast the status of the water resources carrying capacity, guide the strategy of the development and utilization of water resources, according to the results of forewarning and the main influence factors, and find ways to improve the water resources carrying capacity.
- (3)
- In order to improve the water resources carrying capacity, product consumption must be reduced and the water recycling rate must be improved through scientific management and technological innovation. The efficient use of water resources, the reasonable development and utilization of water resources must be ensured through the optimal allocation of water resources and the adjustment of economic structure. Overall, it is time to promote the construction of a water-saving society and building a harmonious environment between human and water.
Acknowledgments
The authors would like to thank the support of the National Key Research and Development Program of China under Grant No. 2016YFC0401305 and No. 2016YFC0401303, the National Natural Science Foundation of China under Grant No. 51579059 and Higher Education Supporting Project of China under Grant No. JZ2016YYPY0065.
Author Contributions
Rongxing Zhou was responsible for the data analysis and code programming; Rongxing Zhou wrote the paper; Zhengwei Pan contributed the data; Juliang Jin constructed the research framework and designed the study; Chunhui Li and Shaowei Ning reviewed and edited the manuscript. All of the authors have read and approved the final manuscript.
Conflicts of Interest
The authors declare no conflict of interest.
References
- Mei, H. Advances in study on water resources carrying capacity in China. Procedia Environ. Sci. 2010, 2, 1894–1903. [Google Scholar] [CrossRef]
- Xiong, H.; Fu, J.H.; Wang, K.-L. Evaluation of water resource carrying capacity of Qitai Oasis in Xinjiang by entropy method. Chin. J. Eco-Agric. 2012, 20, 1382–1387. [Google Scholar] [CrossRef]
- Fu, X.; Ji, C.M. A comprehensive evaluation of the regional water resource carrying capacity—Application of Main Component Analysis Method. Resour. Environ. Yangtza Basin 1999, 2, 168–173. [Google Scholar]
- Zhou, L.; Liang, H. A Study on the Evolution of Water Resource Carrying Capacity in Karst Area Based on Component Analysis and Entropy. J. Nat. Resour. 2006, 21, 827–833. [Google Scholar]
- Gong, L.; Jin, C. Fuzzy comprehensive evaluation for carrying capacity of regional water resources. Water Resour. Manag. 2009, 23, 2505–2513. [Google Scholar] [CrossRef]
- Liang, M.; Wang, Z.; Liu, J. Evaluation model of water resources carrying capacity based on factor analysis. Yellow River 2010, 32, 62–65. [Google Scholar]
- Zhao, Z.; Li, W.; Wang, C. Study on Water Resources Carrying Capacity in Ningxia Based on Principal Component Analysis and Factor Analysis. Hydrology 2017, 37, 64–72. [Google Scholar]
- Chen, N.X.; Ban, P.L.; Zhang, W.B. Fuzzy evaluation of the water resources carrying capacity based on the maximum entropy theory. J. Irrig. Drain. 2008, 27, 57–60. [Google Scholar]
- Li, F.; Chen, Y.; Li, W. The Application of Set Pair Analysis Based on Entropy Weight to Evaluation of Sustainable Water Resources Utilization—A Case Study in the Three Sources of Tarim River. J. Glaciol. Geocryol. 2010, 32, 723–730. [Google Scholar]
- Feng, L.H.; Zhang, X.C.; Luo, G.Y. Application of system dynamics in analyzing the carrying capacity of water resources in Yiwu City, China. Math. Comput. Simul. 2008, 79, 269–278. [Google Scholar] [CrossRef]
- Guo, Q.; Tian, Z.; Zeng, L. Application of AGA-FAHP in Bids Evaluation of Construction Projects. Water Sav. Irrig. 2010, 9, 62–64. [Google Scholar]
- Jin, J.; Yang, X.; Wei, Y. System Evaluation Method Based on Fuzzy Preferential Relation Matrix. Syst. Eng. Theory Methodol. Appl. 2005, 14, 364–368. [Google Scholar]
- Jin, J.; Yang, X.; Ding, J. An Improved Simple Genetic Algorithm—Accelerating Genetic Algorithm. Syst. Eng. Theory Methodol. Appl. 2001, 21, 8–12. [Google Scholar]
- Mon, D.L.; Cheng, C.H.; Lin, J.C. Evaluating weapon system using fuzzy analytic hierarchy process based on entropy weight. Fuzzy Sets Syst. 1994, 62, 127–134. [Google Scholar] [CrossRef]
- Tesfamariam, S.; Sadiq, R. Risk-based environmental decision-making using fuzzy analytic hierarchy process (F-AHP). Stoch. Environ. Res. Risk Assess. 2006, 21, 35–50. [Google Scholar] [CrossRef]
- Wen, J.; Li, J.; Jin, J. Forewarning Model of Regional Water Resources Sustainable Utilization Based on Combined Weights and Entropy Principles. Water Resour. Power 2006, 24, 6–10. [Google Scholar]
- Xu, Z. Research on Compatibility and Consistency of Fuzzy Complementary Judgment Matrices. PLA UST 2002, 3, 94–96. [Google Scholar]
- Wang, M.; Jin, J.; Li, L. Application of method based on raga to assessment of sand liquefaction potential. Chin. J. Rock Mech. Eng. 2004, 23, 631–634. [Google Scholar]
- Jin, J.; Wang, M.; Wei, Y. Objective Combined Evaluation Model for Optimizing Water Resource Engineering Schemes. Syst. Eng. Theory Methodol. Appl. 2004, 24, 111–116. [Google Scholar]
- Friedman, J.H.; Tukey, J.W. A projection pursuit algorithm for exploratory data analysis. IEEE Trans. Comput. 1974, 100, 881–890. [Google Scholar] [CrossRef]
- Jones, M.C.; Sibson, R. What is projection pursuit. J. R. Stat. Soc. Ser. A (Gen.) 1987, 150, 1–37. [Google Scholar] [CrossRef]
- Jaynes, E.T. On the rationale of maximum-entropy methods. Proc. IEEE 1982, 70, 939–952. [Google Scholar] [CrossRef]
- Jin, J.; Yang, X. Real Coding Based Acceleration Genetic Algorithm. J. Sichuan Univ. Eng. Sci. Ed. 2000, 32, 20–24. [Google Scholar]
- Woodbury, A.D.; Ulrych, T.J. Minimum relative entropy: Forward probabilistic modeling. Water Resour. Res. 1993, 29, 2847–2860. [Google Scholar] [CrossRef]
- Bertsekas, D.P. Nonlinear Programming; Athena Scientific: Belmont, MA, USA, 1999. [Google Scholar]
- Huang, T.; Chen, C. Evaluation of water resources carrying capacity in Anhui Province based on analytic hierarchy process. J. Chifeng Univ. (Nat. Sci. Ed.) 2017, 33, 19–21. [Google Scholar]
- Liu, C.; Yu, W. Fuzzy comprehensive evaluation of water resources carrying capacity in Anhui based on entropy weight and AHP. Harnessing Huaihe River 2013, 2, 21–22. [Google Scholar]
Figure 1.
The location of Anhui Province in China.

Figure 2.
Annual variation curve of precipitation in Anhui Province (2005–2015).
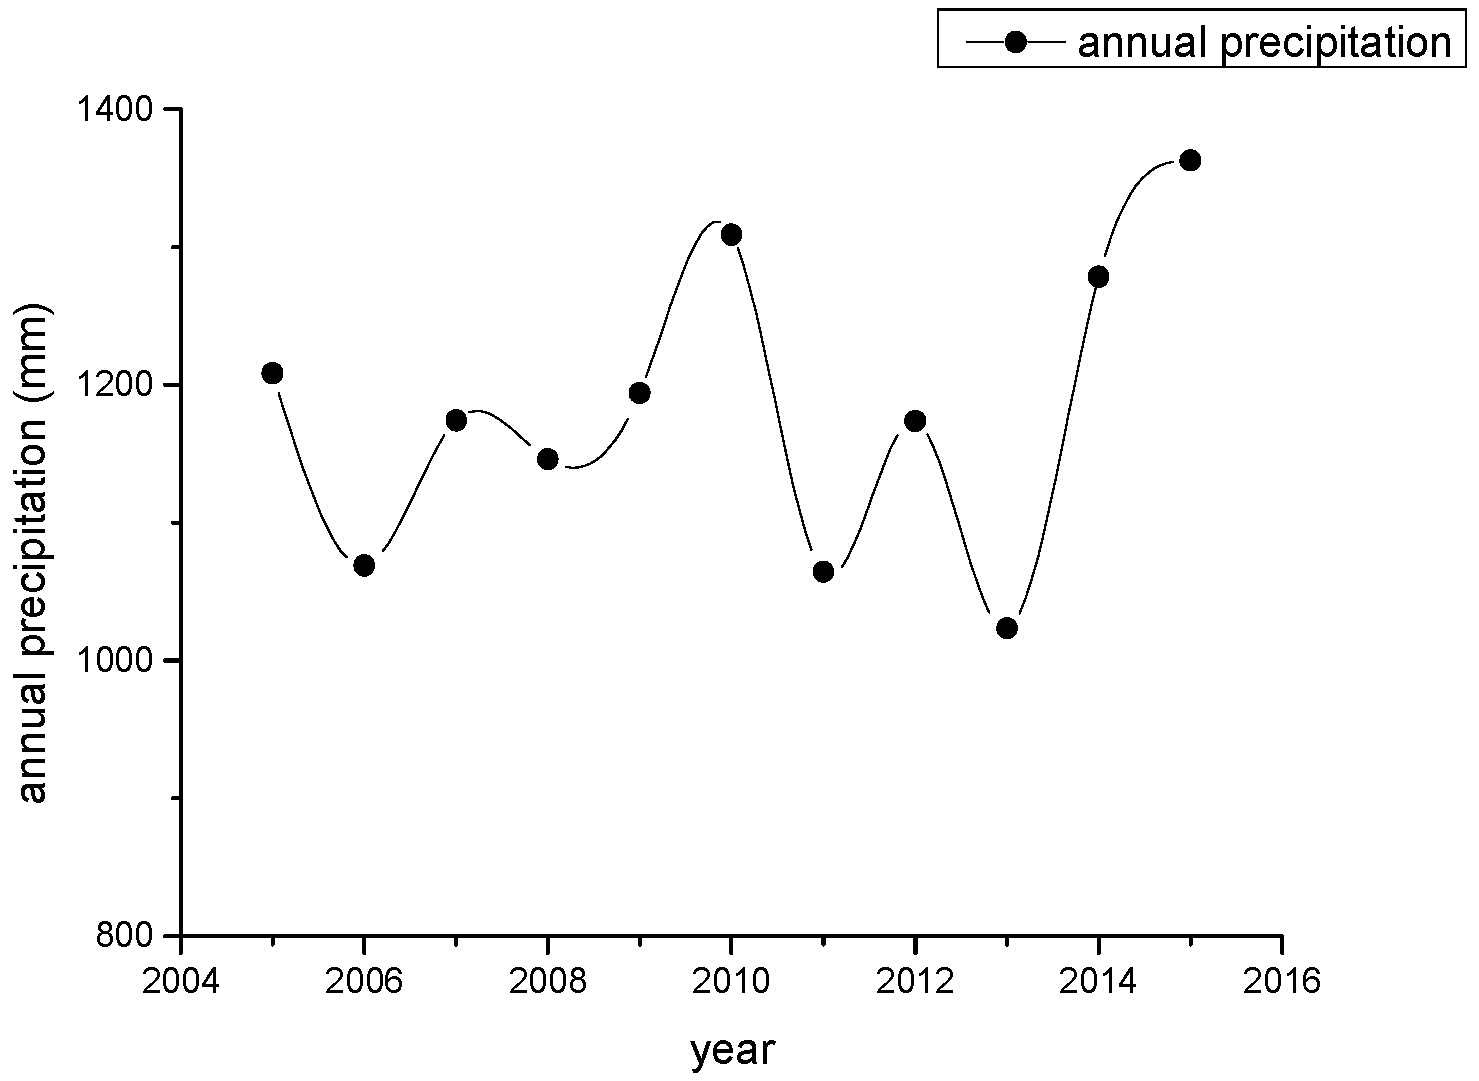
Figure 3.
Annual variation curve of water resources in Anhui Province (2005–2015).

Figure 4.
Annual variation curve of water consumption in Anhui Province (2005–2015).
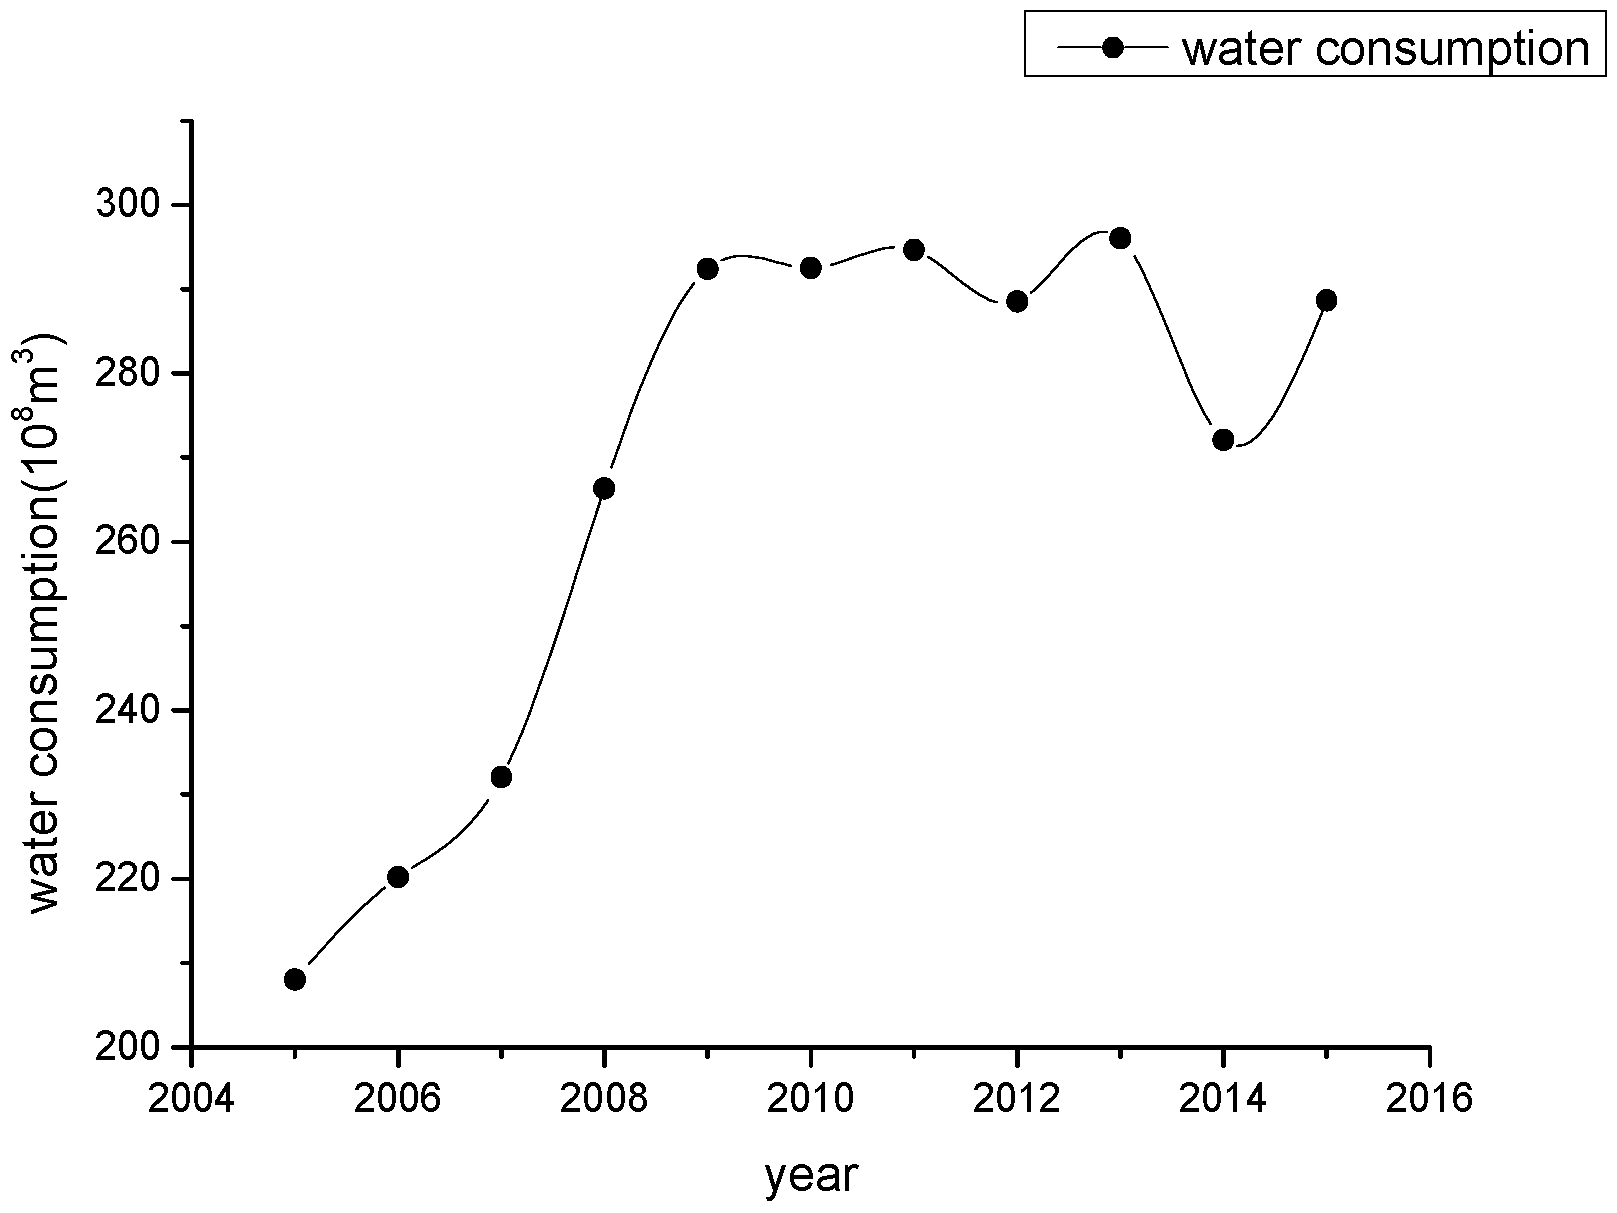
Figure 5.
The structure of water consumption in Anhui Province.

Figure 6.
Diagram of the technical route.

Figure 7.
The change chart of the forewarning comprehensive indices.

Table 1.
Forewarning Index System of the Water Resources Carrying Capacity for Anhui Province and its Grade Standard.
Table 1.
Forewarning Index System of the Water Resources Carrying Capacity for Anhui Province and its Grade Standard.
| Forewarning Index System | Grade Standard | ||||
|---|---|---|---|---|---|
| Target Layer | Subsystem Layer | Index Layer | First Grade | Second Grade | Third Grade |
| Water Resources Carrying Capacity | holding power subsystem | x1 m3 | [1670, +∞) | [1000, 1670) | [0, 1000) |
| x2 104 m3/km2 | [80, +∞) | [50, 80) | [0, 50) | ||
| x3 m3/year | [450, +∞) | [350, 450) | [0, 350) | ||
| x4% | [40, +∞) | [25, 40) | [0, 25) | ||
| regulate and control subsystem | x5% | [0, 40] | (40, 70] | [70, +∞) | |
| x6 yuan | [24,840, +∞) | [6624, 24,840) | [0, 6624) | ||
| x7% | [90, +∞) | [70, 90) | [0, 70) | ||
| x8% | [95, +∞) | [70, 95) | [0, 70) | ||
| x9% | [5, +∞) | [1, 5) | [0, 1) | ||
| pressure subsystem | x10 L/d | [0, 70] | (70, 180] | [180, +∞) | |
| x11 L/d | [0, 100] | (100, 400] | [400, +∞) | ||
| x12 m3 | [0, 50] | (50, 200] | [200, +∞) | ||
| x13 people/km2 | [0, 200] | (200, 500] | [500, +∞) | ||
| x14% | 0, 50] | (50, 80] | [80, +∞) | ||
| x15 m3/mu | [0, 250] | (250, 400] | [400, +∞) | ||
Table 2.
The Subject Weights, the Objective Weights and the Combination Weights of Indices.
| Weight | x1 | x2 | x3 | x4 | x5 | x6 | x7 | x8 |
| ws | 0.1334 | 0.1333 | 0.1066 | 0.0267 | 0.0594 | 0.0485 | 0.0294 | 0.0433 |
| wo | 0.0515 | 0.0589 | 0.0022 | 0.0523 | 0.0884 | 0.0309 | 0.0555 | 0.0137 |
| wc | 0.0952 | 0.1018 | 0.0176 | 0.0429 | 0.0833 | 0.0445 | 0.0464 | 0.0280 |
| Weight | x9 | x10 | x11 | x12 | x13 | x14 | x15 | |
| ws | 0.0194 | 0.033 | 0.0799 | 0.0624 | 0.081 | 0.0639 | 0.0799 | |
| wo | 0.0715 | 0.1344 | 0.1302 | 0.0001 | 0.1464 | 0.0868 | 0.0771 | |
| wc | 0.0428 | 0.0765 | 0.1172 | 0.0029 | 0.1251 | 0.0856 | 0.0902 |
Table 3.
Sample Values of the Regional Water Resources Carrying Capacity Forewarning and its “Non-Warning” Membership Degrees (f) and Comprehensive Forewarning Indices (s).
Table 3.
Sample Values of the Regional Water Resources Carrying Capacity Forewarning and its “Non-Warning” Membership Degrees (f) and Comprehensive Forewarning Indices (s).
| Serial Number | Values of Forewarning Indices | ||||||||
| x1 | x2 | x3 | x4 | x5 | x6 | x7 | x8 | x9 | |
| 1 | 1670.00 | 80.00 | 450.00 | 40.00 | 40.00 | 24,840.00 | 90.00 | 95.00 | 5.00 |
| 2 | 1603.00 | 77.00 | 440.00 | 38.50 | 43.00 | 23,018.40 | 88.00 | 92.50 | 4.60 |
| 3 | 1536.00 | 74.00 | 430.00 | 37.00 | 46.00 | 21,196.80 | 86.00 | 90.00 | 4.20 |
| 4 | 1469.00 | 71.00 | 420.00 | 35.50 | 49.00 | 19,375.20 | 84.00 | 87.50 | 3.80 |
| 5 | 1402.00 | 68.00 | 410.00 | 34.00 | 52.00 | 17,553.60 | 82.00 | 85.00 | 3.40 |
| 6 | 1335.00 | 65.00 | 400.00 | 32.50 | 55.00 | 15,732.00 | 80.00 | 82.50 | 3.00 |
| 7 | 1268.00 | 62.00 | 390.00 | 31.00 | 58.00 | 13,910.40 | 78.00 | 80.00 | 2.60 |
| 8 | 1201.00 | 59.00 | 380.00 | 29.50 | 61.00 | 12,088.80 | 76.00 | 77.50 | 2.20 |
| 9 | 1134.00 | 56.00 | 370.00 | 28.00 | 64.00 | 10,267.20 | 74.00 | 75.00 | 1.80 |
| 10 | 1067.00 | 53.00 | 360.00 | 26.50 | 67.00 | 8445.60 | 72.00 | 72.50 | 1.40 |
| 11 | 1000.00 | 50.00 | 350.00 | 25.00 | 70.00 | 6624.00 | 70.00 | 70.00 | 1.00 |
| 12 | 1135.70 | 51.57 | 319.26 | 26.06 | 28.92 | 7685.40 | 69.81 | 52.20 | 0.66 |
| 13 | 950.10 | 41.62 | 333.95 | 26.06 | 25.46 | 8820.18 | 56.41 | 64.30 | 0.59 |
| 14 | 1164.50 | 51.08 | 347.59 | 26.06 | 32.57 | 10,016.20 | 58.26 | 59.10 | 0.69 |
| 15 | 1139.80 | 50.13 | 395.13 | 26.06 | 38.09 | 11,261.22 | 71.02 | 72.20 | 0.61 |
| 16 | 1195.70 | 52.56 | 430.32 | 26.06 | 39.81 | 12,699.43 | 66.36 | 75.40 | 0.66 |
| 17 | 1578.20 | 67.33 | 428.45 | 27.53 | 31.15 | 15,092.34 | 67.03 | 78.50 | 0.79 |
| 18 | 1008.80 | 43.17 | 428.49 | 27.53 | 48.94 | 16,992.92 | 64.32 | 74.30 | 1.34 |
| 19 | 1170.60 | 50.53 | 418.08 | 27.53 | 41.17 | 17,072.43 | 69.42 | 71.40 | 1.31 |
| 20 | 974.54 | 41.99 | 427.22 | 27.53 | 50.55 | 17,262.21 | 71.92 | 70.50 | 1.37 |
| 21 | 1279.78 | 55.81 | 392.29 | 28.65 | 34.95 | 17,956.27 | 73.01 | 73.60 | 1.71 |
| 22 | 1495.31 | 65.54 | 415.40 | 28.65 | 31.58 | 18,665.40 | 73.68 | 78.90 | 1.70 |
| Serial Number | Values of Forewarning Indices | Warning Status | |||||||
| x10 | x11 | x12 | x13 | x14 | x15 | s(i) | f(i) | ||
| 1 | 70.00 | 100.00 | 50.00 | 200.00 | 50.00 | 250.00 | 0.9449 | 1.00 | -- |
| 2 | 81.00 | 130.00 | 65.00 | 230.00 | 53.00 | 265.00 | 0.8573 | 0.90 | -- |
| 3 | 92.00 | 160.00 | 80.00 | 260.00 | 56.00 | 280.00 | 0.7697 | 0.80 | -- |
| 4 | 103.00 | 190.00 | 95.00 | 290.00 | 59.00 | 295.00 | 0.6821 | 0.70 | -- |
| 5 | 114.00 | 220.00 | 110.00 | 320.00 | 62.00 | 310.00 | 0.5945 | 0.60 | -- |
| 6 | 125.00 | 250.00 | 125.00 | 350.00 | 65.00 | 325.00 | 0.5069 | 0.50 | -- |
| 7 | 136.00 | 280.00 | 140.00 | 380.00 | 68.00 | 340.00 | 0.4193 | 0.40 | -- |
| 8 | 147.00 | 310.00 | 155.00 | 410.00 | 71.00 | 355.00 | 0.3317 | 0.30 | -- |
| 9 | 158.00 | 340.00 | 170.00 | 440.00 | 74.00 | 370.00 | 0.2441 | 0.20 | -- |
| 10 | 169.00 | 370.00 | 185.00 | 470.00 | 77.00 | 385.00 | 0.1565 | 0.10 | -- |
| 11 | 180.00 | 400.00 | 200.00 | 500.00 | 80.00 | 400.00 | 0.0689 | 0.00 | -- |
| 12 | 89.04 | 386.10 | 369.10 | 465.00 | 35.50 | 320.30 | 0.3694 | -- | heavy |
| 13 | 85.69 | 393.80 | 361.90 | 470.00 | 37.10 | 337.60 | 0.3022 | -- | heavy |
| 14 | 91.13 | 305.90 | 287.90 | 479.00 | 38.70 | 287.30 | 0.4019 | -- | heavy |
| 15 | 96.10 | 288.80 | 244.90 | 483.00 | 40.05 | 349.20 | 0.3827 | -- | heavy |
| 16 | 101.21 | 290.30 | 227.60 | 487.00 | 42.10 | 366.10 | 0.3780 | -- | heavy |
| 17 | 107.62 | 238.50 | 166.30 | 490.00 | 43.20 | 358.60 | 0.5154 | -- | middle |
| 18 | 109.53 | 195.00 | 123.10 | 493.00 | 44.80 | 341.50 | 0.3683 | -- | heavy |
| 19 | 109.63 | 167.60 | 120.90 | 495.00 | 46.50 | 362.60 | 0.4212 | -- | middle |
| 20 | 109.99 | 155.50 | 110.20 | 496.00 | 47.86 | 313.90 | 0.3911 | -- | heavy |
| 21 | 110.35 | 131.00 | 97.00 | 497.00 | 49.15 | 259.00 | 0.5439 | -- | middle |
| 22 | 110.94 | 131.20 | 96.80 | 498.00 | 50.50 | 282.40 | 0.5961 | -- | light |
© 2017 by the authors. Licensee MDPI, Basel, Switzerland. This article is an open access article distributed under the terms and conditions of the Creative Commons Attribution (CC BY) license (http://creativecommons.org/licenses/by/4.0/).
Share and Cite
MDPI and ACS Style
Zhou, R.; Pan, Z.; Jin, J.; Li, C.; Ning, S. Forewarning Model of Regional Water Resources Carrying Capacity Based on Combination Weights and Entropy Principles. Entropy 2017, 19, 574. https://doi.org/10.3390/e19110574
AMA Style
Zhou R, Pan Z, Jin J, Li C, Ning S. Forewarning Model of Regional Water Resources Carrying Capacity Based on Combination Weights and Entropy Principles. Entropy. 2017; 19(11):574. https://doi.org/10.3390/e19110574
Chicago/Turabian StyleZhou, Rongxing, Zhengwei Pan, Juliang Jin, Chunhui Li, and Shaowei Ning. 2017. "Forewarning Model of Regional Water Resources Carrying Capacity Based on Combination Weights and Entropy Principles" Entropy 19, no. 11: 574. https://doi.org/10.3390/e19110574
Note that from the first issue of 2016, this journal uses article numbers instead of page numbers. See further details here.