Article

Challenging Recently Published Parameter Sets for Entropy Measures in Risk Prediction for End-Stage Renal Disease Patients

by
Stefan Hagmair
1,2,†,
Martin Bachler
1,2,†,
Matthias C. Braunisch
3,
Georg Lorenz
3,
Christoph Schmaderer
3,
Anna-Lena Hasenau
3,
Lukas Von Stülpnagel
4,
Axel Bauer
4,
Kostantinos D. Rizas
4,
Siegfried Wassertheurer
1 and
Christopher C. Mayer
1,*
1
Biomedical Systems, Center for Health & Bioresources, AIT Austrian Institute of Technology, Donau-City-Str. 1, 1220 Vienna, Austria
2
Institute of Analysis and Scientific Computing, TU Wien, Wiedner Hauptstr. 8–10, 1040 Vienna, Austria
3
Department of Nephrology, Klinikum Rechts der Isar, Technische Universität München, Ismaninger Straße 22, 81675 Munich, Germany
4
Department of Cardiology, Klinikum Großhadern, Ludwig-Maximilians-Universität München, Marchioninistr. 15, 81377 Munich, Germany
*
Author to whom correspondence should be addressed.
These authors contributed equally to this work.
Entropy 2017, 19(11), 582; https://doi.org/10.3390/e19110582
Submission received: 29 September 2017 / Revised: 26 October 2017 / Accepted: 27 October 2017 / Published: 31 October 2017
(This article belongs to the Special Issue Information Theory Applied to Physiological Signals)

Abstract

:
Heart rate variability (HRV) analysis is a non-invasive tool for assessing cardiac health. Entropy measures quantify the chaotic properties of HRV, but they are sensitive to the choice of their required parameters. Previous studies therefore have performed parameter optimization, targeting solely their particular patient cohort. In contrast, this work aimed to challenge entropy measures with recently published parameter sets, without time-consuming optimization, for risk prediction in end-stage renal disease patients. Approximate entropy, sample entropy, fuzzy entropy, fuzzy measure entropy, and corrected approximate entropy were examined. In total, 265 hemodialysis patients from the ISAR (rISk strAtification in end-stage Renal disease) study were analyzed. Throughout a median follow-up time of 43 months, 70 patients died. Fuzzy entropy and corrected approximate entropy (CApEn) provided significant hazard ratios, which remained significant after adjustment for clinical risk factors from literature if an entropy maximizing threshold parameter was chosen. Revealing results were seen in the subgroup of patients with heart disease (HD) when setting the radius to a multiple of the data’s standard deviation ( r = 0.2 · σ ); all entropies, except CApEn, predicted mortality significantly and remained significant after adjustment. Therefore, these two parameter settings seem to reflect different cardiac properties. This work shows the potential of entropy measures for cardiovascular risk stratification in cohorts the parameters were not optimized for, and it provides additional insights into the parameter choice.

1. Introduction

The electrocardiogram (ECG) is one of the most widely analyzed and clinically utilized physiological signals among others such as electroencephalograms (EEGs), electromyograms (EMGs), electrooculograms (EOGs), and respiratory signals. It reflects the electrical signature of the cardiac cycles and thus can be used as the starting point for the quantification of heart rate variability (HRV), which represents the variation of the heart rate and is based on normal-to-normal interbeat intervals. HRV reflects the physiological process of many factors regulating the normal rhythm of the heart on a beat-by-beat basis in order to achieve an—ideally—optimal nourishment of the body by providing cardiac output [1].
More than five decades ago, it was already discovered that HRV could be used as a marker for cardiovascular health status, when a reduction of fetal HRV during labor was associated with distressed babies [2]. Since then, the usefulness of HRV for risk stratification has become more and more evident. In recent years, its predictive value has been demonstrated in several populations, ranging from post-myocardial infarction [3] to chronic kidney disease and end-stage renal disease (ESRD) patients undergoing hemodialysis [4,5], by the use of traditional measures in the time and/or frequency domain to newer nonlinear measures.
A vast number of measures for the quantification of HRV have been introduced in recent decades. Traditional measures originate mainly from the time and/or frequency domain [6,7]. Newer methods (e.g., long-range correlation and fractal analysis, short-term complexity, entropy or detrended fluctuation analysis) can contribute essentially to the understanding of the underlying mechanisms of HRV and to the quantification of the complex regulation mechanisms, which cannot be described by traditional measures accurately [8]. Furthermore, Sassi et al. [8] highlighted in their critical review the so-far rather limited success of these advanced HRV approaches in clinical applications.
Entropy measures are part of this new family quantifying the variability of the heart rate [9]. Their information theory principles have clear potential to better understand the intrinsic dynamics and mechanisms underlying HRV and its physiological origins. This is underlined by their ability to discover certain patterns and shifts in the “apparent ensemble amount of randomness” of a stochastic process [10]. They can measure randomness as well as the predictability of processes [11]. The family of entropy measures has grown immensely in recent years, and these are applied in various domains (e.g., [9]). Particularly for HRV analysis, the following measures can be highlighted: approximate entropy ( ApEn ) [12], sample entropy ( SampEn ) [13], fuzzy entropy ( FuzzyEn ) [14], and their further developments fuzzy measure entropy ( FuzzyMEn ) [15] and corrected ApEn ( CApEn ) [16].
One aspect that all entropy measures have in common is their dependency on the choice of parameters, as these determine their behavior and thus are crucial for the results. In recent years, a large amount of research has been done to define parameter sets for various application fields [13,17,18,19]. These studies were, to our knowledge, mainly based on cross-sectional data. Hence, longitudinal evidence is still scarce. Nevertheless, agreement has been reached on some parameters, and studies’ results for parameter selection are converging for others.
We therefore aim to use recently published parameter sets for different entropy measures for risk prediction in a cohort of ESRD patients undergoing hemodialysis. Questions raised by Holzinger et al. [9] on the clinical applicability of entropy measures and their dependency on the choice of parameters are addressed. Therefore, parameters are not optimized for the data at hand, but they are challenged for risk prediction as reported in a very special and different cohort, that is, on high-risk patients with a five-year survival range between 40% and 50% [20]. As a result, the focus is on ApEn , SampEn , FuzzyEn , FuzzyMEn and CApEn , using the parameter sets recently determined by Mayer et al. [1,19].

2. Materials and Methods

2.1. Data

All data used in this work was from the ISAR (rISk strAtification in end-stage Renal disease) study (ClinicalTrials.gov; identifier number: NCT01152892)—a prospective, longitudinal, observational cohort study, which aims to improve cardiovascular risk stratification in end-stage renal disease [21]. The study protocol was approved by the ethic committees of the Klinikum rechts der Isar of the Technical University Munich and of the Bavarian State Board of Physicians. Between September 2010 and January 2014, 519 patients were recruited. All patients gave written informed consent.
The baseline clinical data included anthropometric measures (height, weight, and body mass index) and blood samples. Cardiovascular risk factors (diabetes, hypertension, and smoking) were obtained at study entry. Furthermore, details of dialysis were traced regarding ultrafiltration volume, dialysis efficiency, and dialysis duration per session. To refine the comparison of risk factors and comorbidities in statistical analysis, the adapted Charlson comorbidity index (CCI) was calculated. This adaption of the CCI is based on the calculation of Liu et al. [22], who further improved the original CCI [23] for ESRD patients.
The 24 h 12-lead ECG data were recorded using the Lifecard CF digital Holter recorder (Delmar Reynolds/Spacelabs Healthcare, Nuremberg, Germany) within the ISAR study. Reference ECG annotation and interbeat (RR) interval determination were performed using evaluated commercial equipment (Pathfinder, version 9.027, Delmar Reynolds/Spacelabs Healthcare, Nuremberg, Germany) [24]. An experienced physician, who was blinded to the patient’s clinical status, manually reviewed and processed the available 391 recordings [21].
Figure 1 summarizes the flow chart of the study population and the final included data. Patients were excluded if they had an implanted cardiac pacemaker or a cardioverter–defibrillator pacing the heart ( n = 27 ), or atrial fibrillation ( n = 54 ). Recordings with less than 75% sinus rhythm beats were also excluded ( n = 20 ). RR-interval data were taken between 2:00 a.m. and 2:30 a.m. to ensure standardized conditions. In total, 265 recordings were included in the final analysis (see Figure 1). The patients were followed up until death and censored after renal transplantation (per transplantation date).
Filtering was done according to Bauer et al. [25]. In detail, RR-intervals needed to be between 300 and 2000 ms, and consecutive RR-interval differences had to be less than 200 ms. Furthermore, RR-intervals with more than a 20% difference to the mean of the last five preceding sinus RR-intervals were filtered. The filtered series of RR-intervals is named NN-interval series to emphasize the difference between normal beats (i.e., normal-to-normal intervals).

2.2. HRV Analysis

Additionally to the entropy measures (see Section 2.3), traditional HRV parameters of the time domain and frequency domain were computed on 5 min NN-segments according to guidelines [7] and were then averaged. Parameters of the time domain were the average time of NN-intervals (AVNN), the standard deviation of NN-intervals (SDNN), the square root of the mean-squared differences of adjacent NN-intervals (RMSSD), the percentage of the number of NN-intervals greater than 50 ms, and the HRV triangular index (HRVTI).
The power spectral density was estimated with the Lomb–Scargle periodogram [26,27]. Total power (total P) determined the variance of the 5 min segment. Variances corresponding to the low-frequency (LF; 0.04–0.15 Hz) and high-frequency (HF; 0.15–0.4 Hz) bands were assessed. Finally, the ratio of LF to HF power spectral components (LF/HF) was calculated.

2.3. Entropy Measures

In information theory, entropy is a measure of unpredictability. This principle can be applied to time series such as NN-intervals by quantifying the likelihood that two similar sequences of template length m remain similar after increasing the length to m + 1 [12]. “Similarity”, in this context, is either defined by a threshold value r or a fuzzy membership function of radius r with exponent n as a weighting factor. Furthermore, some entropy measures distinguish between local and global similarity, therefore requiring local and global radii and exponents ( r L , r F , n L , and n F ). The total length of the time series is denoted as N.
Following previous works, ApEn , CApEn , SampEn , FuzzyEn , and FuzzyMEn were used in this evaluation [1,19,28].
  • As introduced by Pincus et al. [12], the ApEn is calculated as
    ApEn ( m , r , N ) : = 1 N m + 1 i = 1 N m + 1 log C i m ( r ) 1 N m i = 1 N m log C i m + 1 ( r )
    where C i m ( r ) is the number of points within the distance r of any point x ( i ) from x i m : = [ x ( i ) , , x ( i + m 1 ) ] , divided by N m + 1 .
  • Because of self-matches, ApEn is biased towards regularity. Porta et al. [16] therefore introduced the corrected approximate entropy CApEn , where ApEn was reformulated and adapted as
    CApEn ( m , r , N ) : = 1 N m + 1 i = 1 N m + 1 log ( Θ )
    with
    Θ : = ( N m + 1 ) 1 if C i m ( r ) = 1 or C i m 1 ( r ) = 1 C i m ( r ) / C i m 1 ( r ) otherwise
  • Richman and Moorman [13] introduced another approach to correct the bias of ApEn , namely, SampEn . This is calculated as
    SampEn ( m , r , N ) : = log i = 1 N m C i m ( r ) log i = 1 N m C i m + 1 ( r )
    where in this case, C i m ( r ) and C i m + 1 ( r ) do not count self-matches.
  • ApEn and SampEn are sensitive to small variations of r, because C i m ( r ) is a counting function and the condition resembles a Heaviside function. To counteract this problem, Chen et al. [14] introduced FuzzyEn , replacing C i m ( r ) with the fuzzy membership function:
    μ ( x , n , r ) : = exp ( 0.69 · ( x / r ) n )
    FuzzyEn is then calculated as
    FuzzyEn ( m , r , n , N ) : = ln ϕ m ( r , n , N ) ϕ m + 1 ( r , n , N ) , where
    ϕ m ( r , n , N ) : = 1 N m i = 1 N m j i μ ( d ( x i m , x j m ) , n , r ) N m 1
    with d ( x , y ) being the Chebyshev distance defined as
    d ( x , y ) : = max i | x i y i |
  • In order to distinguish between local (using r L and n L ) and global (using r F and n F ) similarity, Liu et al. [15] extended the FuzzyEn to the FuzzyMEn:
    FuzzyMEn ( m , r L , r F , n L , n F , N ) : = ln ϕ m ( r L , n L , N ) ϕ m + 1 ( r L , n L , N ) + ln ϕ m ( r F , n F , N ) ϕ m + 1 ( r F , n F , N )

2.4. Application of Entropy Measures

In order to apply the entropy measures to the NN-interval series, parameter values for m, r, and n, or m, r L , r F , n L , and n F have to be chosen. The parameter N, by contrast, is given by the number of NN-intervals of the respective time series. Because a duration of 30 min was evaluated from each recording, the condition of N > 1000 , as suggested by previous studies [13,17,18,19], was satisfied.
Numerous studies agree on the template length m, and the most frequent suggestion is to set m = 2 [14,15,18,19,29,30,31,32]. Therefore, this setting was also chosen for the evaluations in this work.
The selection of the threshold parameter or radius of the fuzzy membership function r is more controversial. The most frequently used approaches are the selection of values depending on the standard deviation ( σ ) of the time series in the range r [ 0.1 · σ , 0.25 · σ ] [12,31], abbreviated as r σ , and to choose r such that the resulting entropy values are maximized; this value is referred to as r Chon [32]. Following previous studies, the results for both r Chon and r σ = 0.2 · σ for r, r L , and r F were evaluated in this work [19].
The ideal choice for the value of the weighting factor of the fuzzy membership function n depends on the choice of r; values are commonly in the range n [ 1 , 3 ] [14,15,19]. Again, previous studies provided the values used in this work, as summarized in Table 1 [19].

2.5. Statistical Analysis

Baseline data are presented as the number and percentage for categorical data; quantitative data are presented as means and standard deviation (SD) or median and inter-quartile range (IQR), as appropriate.
Mortality risk was determined using Cox proportional hazards regression models. The hazard ratio (HRs) are presented, including their 95% confidence interval (CI). All-cause mortality was defined as the endpoint in this work. To test for the independency of the risk predictors, Cox models for univariately significant predictors were adjusted according to the literature (Model A) and for covariates significant in univariate analysis (Model B). Input data for the Cox models were visually inspected. Skewed data were transformed by a standard logarithmic transformation, except for CApEn ( r Chon ) , which was transformed by using the two-parametric Box-Cox transformation [33].
Furthermore, interactions between risk predictors and heart disease (HD) status (defined as the presence of heart failure, valvular HD or other heart/vascular diseases) were identified by interaction terms. Significant or borderline significant interaction terms indicated a need for further analyses based on HD status. All computations were performed using MATLAB (The MathWorks, Inc., Natick, MA, USA; R2016b). A test with a p-value of p < 0.05 was considered significant.

3. Results

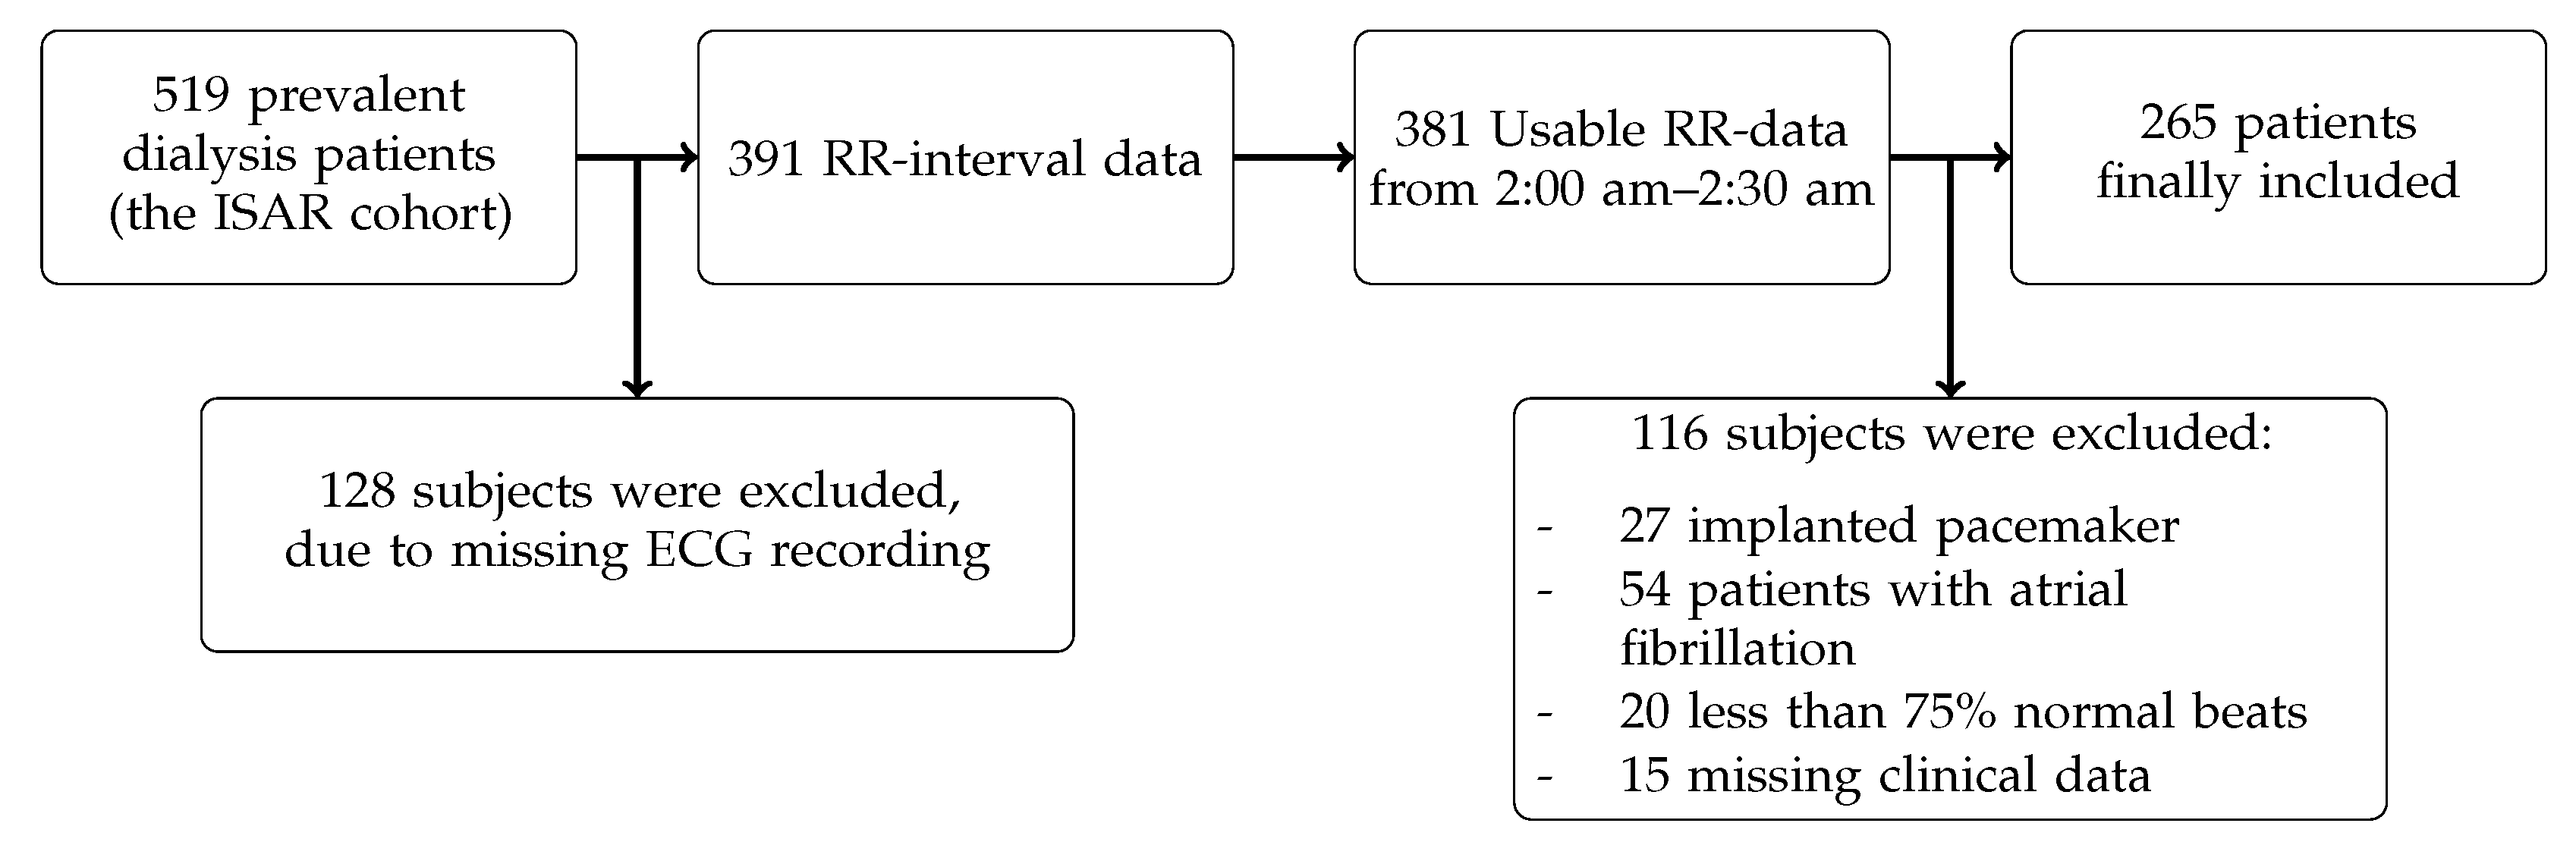
During the median follow-up time of 43 months, 70 out of the 265 patients with ESRD undergoing hemodialysis died (26%). The patient baseline data are shown in Table 2. The mean age of the patients was 62 years, and 175 were male (66%). Of 265 patients, 250 suffered from hypertension, which corresponded to 94%. The median duration per dialysis session was 4.23 h. Table 3 shows the traditional HRV measures, as well as entropy measures at baseline.
Univariate Cox models identified the following independent risk factors: age, height, dialysis duration per session, serum albumin, high-sensitivity C-reactive protein (hsCRP), anticoagulant, and adapted CCI (see Table 4). Adapted CCI and hsCRP showed the highest HRs with values of 1.24 (1.16, 1.33) and 1.26 (1.02, 1.56), respectively. Hence, an increase of one unit in one of either variable increased the risk of death by about 25%. The HR of 0.52 (0.30, 0.89) producing an increase of 1 h per dialysis session indicated that the chance of survival is doubled if the dialysis duration is extended by 1 h. These predictors were used in Model B to adjust the HRV measures for mortality risk. Another set for adjustment is found in the literature and is defined as Model A with the following variables: age, serum albumin, hsCRP, and calcium × phosphate [5].
Table 5 shows unadjusted and adjusted hazard ratios of HRV and entropy measures. Of the standard HRV parameters, SDNN, HRVTI, total P, LF, and LF/HF predicted mortality significantly. The HR of 0.82 (0.69, 0.96) for LF showed that an increase in LF power is associated with an increased chance of survival. After adjustment (with either model), only LF was an independent predictor. LF/HF had a significant predictive value if Model B was used for adjustment and a borderline significance for Model A.
FuzzyEn ( r Chon ) and CApEn ( r Chon ) significantly predicted mortality out of 10 entropy measures in univariate analysis. An increased chance of survival for higher entropy values was manifested by a HR of 0.59 (0.39, 0.90) with an increase of one unit for FuzzyEn ( r Chon ) . After adjusting with Model A, both entropy measures retained significant risk predictors. None of the entropies was a significant predictor of mortality after adjustment with Model B.
Interaction terms testing the interaction between the risk predictors (i.e., entropy measures) and HD status were borderline significant if r = r σ was chosen ( p [ 0.06 , 0.08 ] ). Hence, a subgroup analysis was performed, dividing the cohort into patients with HD ( n = 166 , 38 events) and those without HD ( n = 99 , 32 events). Baseline differences between these groups are provided in the online Supplementary Tables S1 and S2.
The results shown in Table 6 and 
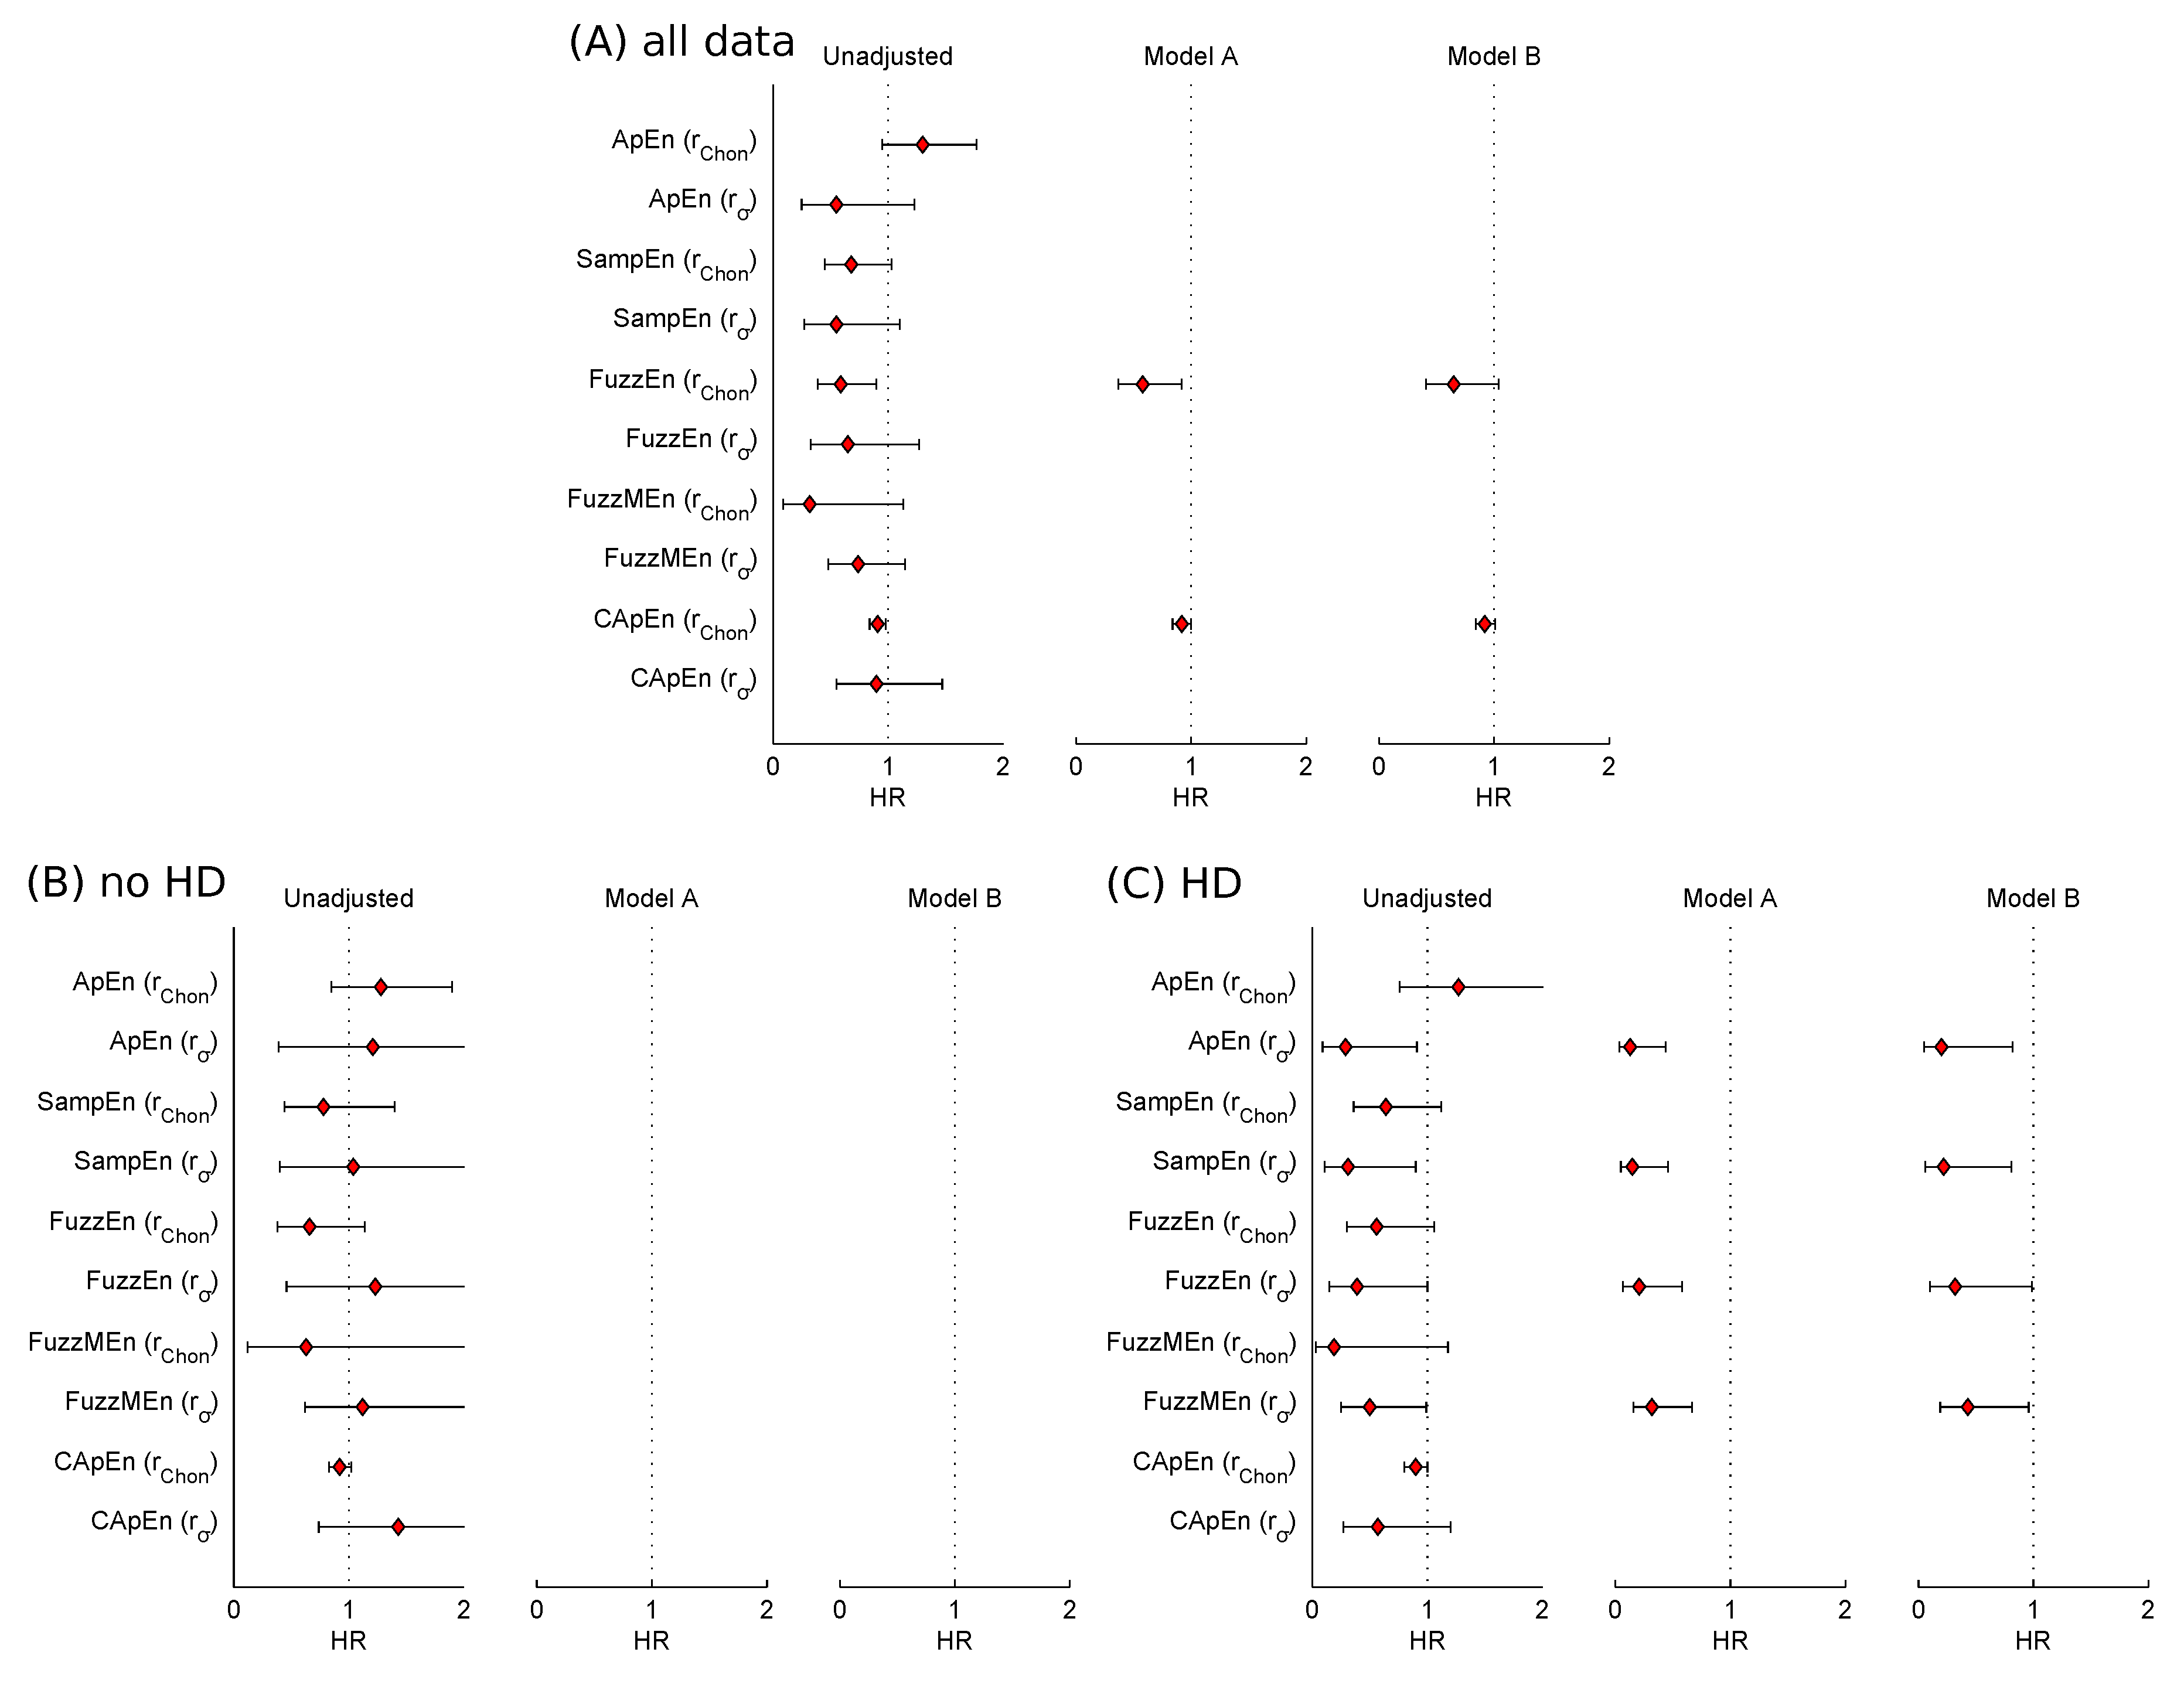
Table 7 confirm the differences between the two subgroups, that is, patients with HD and patients without HD, regarding entropy measures as risk predictors, as already indicated by interaction analysis. For the patients without HD, none of the entropies was a significant predictor of mortality. Considering the subgroup of patients with HD, the results are completely different, as all entropies with r = r σ except CApEn ( r σ ) predicted mortality significantly (see Table 7). After adjustment (with either model), all entropies retained their significant predictive values.
Additionally, Figure 2 visualizes HRs of all entropy measures before adjustment and after adjustment if univariate analysis was significant.

4. Discussion

In this work, we used recently published parameter sets for different entropy measures for risk prediction in a cohort of ESRD patients undergoing hemodialysis. Prior studies have noted the importance of parameter selection for the different entropy measures [14,15,18,31]. Thus, we challenged recently published parameter sets [1,19] in their clinical applicability by testing their prediction value in a very special and different cohort, that is, including high-risk patients with five year survival ranges of between 40% and 50% [20], without optimization of the parameters for the present data.
In general, a higher HRV indicates that the adaption of the organism to internal and external influences is faster and more flexible, as a result of the optimization of the interplay of the sympathetic and parasympathetic nervous system [6]. Furthermore, this complex optimization tends to exhibit chaotic properties [34,35]. Because entropy is a measure of unpredictability and thus quantifies these chaotic properties, it can be concluded that a reduced HRV entropy reflects an impairment of the heart rate regulation. This conclusion is in accordance with the results of this work, as all entropy measures with significant predictive power showed a HR below 1. Hence, an increased HRV entropy is associated with an increased chance of survival.
Baseline clinical, traditional time and frequency domain HRV data were in agreement with a similar HRV study in ESRD patients, although this study used 24 h data as opposed to 30 min segments at night that was used for the present study, and the study was based on Japanese as opposed to Caucasian/German patients [5]. Univariate Cox regression analysis revealed known clinical- and dialysis-related risk factors in ESRD patients as possible confounders, which were used for adjustment (i.e., serum albumin, dialysis duration per session, hsCRP, and the use of anticoagulants).
In univariate Cox regression analysis, the following HRV measures, SDNN, HRVTI, LF, and LF/HF, were identified as significant risk predictors for all-cause mortality, and after adjustment only LF and LF/HF remained (borderline) significant. These results are in agreement with those obtained by Suzuki et al. [5], except that for LF. These findings are again contrary to previous studies with post-myocardial infarction (MI) patients, which have suggested the independent predictive power of traditional HRV measures [36,37,38,39]. Suzuki et al. [5] provided a possible explanation by highlighting the fact that post-MI studies did not adjust for serum albumin and (hs)CRP levels, whose predictive power and their association to cardiac vagal dysfunction might mask effects [7]. Suzuki et al. [5] identified a decreased scaling exponent α 1 , a representative of nonlinear HRV measures, as an independent risk predictor for mortality in chronic hemodialysis patients, improving risk stratification.
One further observation concerns the parameter choice for the entropy calculation. In the analysis of the entire cohort, only entropy values calculated using r Chon showed significant predictive power, while in the subgroup analysis of HD patients, only entropy values with r σ achieved these results. Upon closer inspection of the data, it was found that using r Chon captured effects in the entire cohort, but only resulted in a small change of the respective entropy values. In this case, statistical significance was reached only in the entire cohort as a result of the larger sample size. In contrast, entropy values calculated using r σ captured effects specific to the HD group. Further investigations are required to clarify these differences. A note of caution is due here, as the number of covariates used for adjustment in Model B was borderline in relation to the number of fatal events in the HD and no HD subgroups, respectively [21].
Additionally, the interpretation of HRs of Box-Cox-transformed predictors is not straightforward. If the predictor is not transformed, HRs quantify the risk of additive changes of the predictor: one absolute unit increase in the predictor, holding all other variables constant, is associated with the hazard being multiplied by the respective HR value. Furthermore, if the predictor is ln ( ) -transformed, HRs quantify the risk of multiplicative changes of the predictor; for example, an exp ( 1 ) -fold relative increase in the predictor is associated with the hazard being multiplied by the respective HR value [40,41]. However, there is no such intuitive interpretation relating HR and predictor values after a Box-Cox transformation [33,42]. Therefore, while the HRs certainly contain the same quality of information as for the untransformed or log-transformed cases, the relation of absolute CApEn values and mortality needs to be interpreted carefully. In any case, a Box-Cox transformation for CApEn using r Chon was necessary because of its right-skewed distribution, in order to fulfil assumptions for Cox regression models.
Finally, a number of important limitations of this study need to be considered. First, the generalizability of these results is subject to certain restrictions, as all participants were from dialysis centers in Munich and the suburban area and were mainly Caucasians. Thus, extrapolation of findings to other countries/populations is limited. Second, subgroup analysis based on HD raises some sample-size limitations, as the number of fatal events was rather low for each group and thus calls for full adjustment. Finally, this study suggests that entropy measures may be useful for risk prediction of ESRD patients undergoing hemodialysis with HD, but it is unclear whether reduced entropy is treatable and modifiable by treatment to reduce risk.

5. Conclusions

This work aimed to assess the predictive value of entropy measures based on recently published parameter sets in ESRD patients undergoing hemodialysis. Our results show that the two parameter sets tested in this work are able to significantly predict mortality and therefore show potential for future clinical application. However, the different parameter sets and entropy measures detect different effects in the HRV data. These results help us to understand the predictive value of entropy measures and provide additional insights into the choice of parameters for these measures. Nevertheless, more detailed research is needed to improve the patients’ burdensome life situation due to dependency on hemodialysis.

Supplementary Materials

The following are available online at www.mdpi.com/1099-4300/19/11/582/s1, Table S1: Baseline data of patients grouped by patients without heart disease (HD) and with HD. Data are given as n (%) for categorical data, mean (SD) or median [IQR], Table S2: Heart rate variability (HRV) parameters of the time and frequency domain and entropy measures at baseline for patients without heart disease (HD) and patients with HD. Data are given as mean (SD) or median [IQR].

Acknowledgments

Christoph Schmaderer was the principal investigator of the ISAR study. The direct costs of the ISAR study were funded internally by university grants and by grants of the Else-Kröner-Fresenius Stiftung and Servier (both competitive grants and completely investigator driven). The clinical trials identifier number is NCT01152892 (ClinicalTrials.gov).

Author Contributions

Christopher C. Mayer, Stefan Hagmair and Martin Bachler conceptualized this work. Stefan Hagmair and Martin Bachler chiefly analyzed the data. Matthias C. Braunisch and Anna-Lena Hasenau collected the data. All authors interpreted the results and drafted the manuscript. Christopher C. Mayer significantly revised and finalized the manuscript. All authors read and approved the final manuscript.

Conflicts of Interest

The authors declare no conflict of interest.

References

  1. Mayer, C.; Bachler, M.; Holzinger, A.; Stein, P.K.; Wassertheurer, S. The Effect of Threshold Values and Weighting Factors on the Association between Entropy Measures and Mortality after Myocardial Infarction in the Cardiac Arrhythmia Suppression Trial (CAST). Entropy 2016, 18, 129. [Google Scholar] [CrossRef]
  2. Hon, E.; Lee, S. The fetal Electrocardiogram. I. The Eelectrocardiogram of the dying fetus. Am. J. Obstet. Gynecol. 1963, 87, 804–813. [Google Scholar] [PubMed]
  3. Stein, P.K.; Reddy, A. Non-linear heart rate variability and risk stratification in cardiovascular disease. Indian Pacing Electrophysiol. J. 2005, 5, 210. [Google Scholar] [PubMed]
  4. Drawz, P.; Babineau, D.; Brecklin, C.; He, J.; Kallem, R.; Soliman, E.; Xie, D.; Appleby, D.; Anderson, A.; Rahman, M. Heart Rate Variability Is a Predictor of Mortality in Chronic Kidney Disease: A Report from the CRIC Study. Am. J. Nephrol. 2013, 38, 517–528. [Google Scholar] [CrossRef] [PubMed]
  5. Suzuki, M.; Hiroshi, T.; Aoyama, T.; Tanaka, M.; Ishii, H.; Kisohara, M.; Iizuka, N.; Murohara, T.; Hayano, J. Nonlinear measures of heart rate variability and mortality risk in hemodialysis patients. Clin. J. Am. Soc. Nephrol. 2012, 7, 1454–1460. [Google Scholar] [CrossRef] [PubMed]
  6. Rajendra Acharya, U.; Paul Joseph, K.; Kannathal, N.; Lim, C.; Suri, J. Heart rate variability: A review. Med. Biol. Eng. Comput. 2006, 44, 1031–1051. [Google Scholar] [CrossRef] [PubMed]
  7. American Heart Association Inc.; European Society of Cardiology. Guidelines—Heart rate variability. Eur. Heart J. 1996, 17, 354–381. [Google Scholar]
  8. Sassi, R.; Cerutti, S.; Lombardi, F.; Malik, M.; Huikuri, H.V.; Peng, C.K.; Schmidt, G.; Yamamoto, Y.; Gorenek, B.; Lip, G.H.; et al. Advances in heart rate variability signal analysis: Joint position statement by the e-Cardiology ESC Working Group and the European Heart Rhythm Association co-endorsed by the Asia Pacific Heart Rhythm Society. Europace 2015, 17, 1341–1353. [Google Scholar] [CrossRef] [PubMed]
  9. Holzinger, A.; Hörtenhuber, M.; Mayer, C.; Bachler, M.; Wassertheurer, S.; Pinho, A.J.; Koslicki, D. On Entropy-Based Data Mining. In Interactive Knowledge Discovery and Data Mining in Biomedical Informatics; Lecture Notes in Computer Science; Holzinger, A., Jurisica, I., Eds.; Springer: Berlin/Heidelberg, Germany, 2014; Volume 8401, pp. 209–226. [Google Scholar]
  10. Pincus, S.M. Assessing Serial Irregularity and Its Implications for Health. Ann. N. Y. Acad. Sci. 2001, 954, 245–267. [Google Scholar] [CrossRef] [PubMed]
  11. Hornero, R.; Aboy, M.; Abasolo, D.; McNames, J.; Goldstein, B. Interpretation of approximate entropy: Analysis of intracranial pressure approximate entropy during acute intracranial hypertension. IEEE Trans. Biomed. Eng. 2005, 52, 1671–1680. [Google Scholar] [CrossRef] [PubMed]
  12. Pincus, S.M. Approximate entropy as a measure of system complexity. Proc. Natl. Acad. Sci. USA 1991, 88, 2297–2301. [Google Scholar] [CrossRef] [PubMed]
  13. Richman, J.S.; Moorman, J.R. Physiological time-series analysis using approximate entropy and sample entropy. Am. J. Physiol. Heart Circ. Physiol. 2000, 278, H2039–H2049. [Google Scholar] [PubMed]
  14. Chen, W.; Zhuang, J.; Yu, W.; Wang, Z. Measuring complexity using FuzzyEn, ApEn, and SampEn. Med. Eng. Phys. 2009, 31, 61–68. [Google Scholar] [CrossRef] [PubMed]
  15. Liu, C.; Li, K.; Zhao, L.; Liu, F.; Zheng, D.; Liu, C.; Liu, S. Analysis of heart rate variability using fuzzy measure entropy. Comput. Biol. Med. 2013, 43, 100–108. [Google Scholar] [CrossRef] [PubMed]
  16. Porta, A.; Gnecchi-Ruscone, T.; Tobaldini, E.; Guzzetti, S.; Furlan, R.; Montano, N. Progressive decrease of heart period variability entropy-based complexity during graded head-up tilt. J. Appl. Physiol. 2007, 103, 1143–1149. [Google Scholar] [CrossRef] [PubMed]
  17. Aktaruzzaman, M.; Sassi, R. Parametric estimation of sample entropy in heart rate variability analysis. Biomed. Signal Process. Control 2014, 14, 141–147. [Google Scholar] [CrossRef]
  18. Zhao, L.; Wei, S.; Zhang, C.; Zhang, Y.; Jiang, X.; Liu, F.; Liu, C. Determination of Sample Entropy and Fuzzy Measure Entropy Parameters for Distinguishing Congestive Heart Failure from Normal Sinus Rhythm Subjects. Entropy 2015, 17, 6270. [Google Scholar] [CrossRef]
  19. Mayer, C.; Bachler, M.; Hörtenhuber, M.; Stocker, C.; Holzinger, A.; Wassertheurer, S. Selection of entropy-measure parameters for knowledge discovery in heart rate variability data. BMC Bioinform. 2014, 15, S2. [Google Scholar] [CrossRef] [PubMed]
  20. Saran, R.; Robinson, B.; Abbott, K.C.; Agodoa, L.Y.; Albertus, P.; Ayanian, J.; Balkrishnan, R.; Bragg-Gresham, J.; Cao, J.; Chen, J.L.; et al. US renal data system 2016 annual data report: Epidemiology of kidney disease in the United States. Am. J. Kidney Dis. 2017, 69, A7–A8. [Google Scholar] [CrossRef] [PubMed]
  21. Schmaderer, C.; Tholen, S.; Hasenau, A.L.; Hauser, C.; Suttmann, Y.; Wassertheurer, S.; Mayer, C.C.; Bauer, A.; Rizas, K.D.; Kemmner, S.; et al. Rationale and study design of the prospective, longitudinal, observational cohort study “rISk strAtification in end-stage renal disease” (ISAR) study. BMC Nephrol. 2016, 17, 161. [Google Scholar] [CrossRef] [PubMed]
  22. Liu, J.; Huang, Z.; Gilbertson, D.T.; Foley, R.N.; Collins, A.J. An improved comorbidity index for outcome analyses among dialysis patients. Kidney Int. 2010, 77, 141–151. [Google Scholar] [CrossRef] [PubMed]
  23. Charlson, M.E.; Pompei, P.; Ales, K.L.; MacKenzie, C. A new method of classifying prognostic comorbidity in longitudinal studies: Development and validation. J. Chronic Dis. 1987, 40, 373–383. [Google Scholar] [CrossRef]
  24. Mølgaard, H. Evaluation of the Reynolds Pathfinder II system for 24 h heart rate variability analysis. Eur. Heart J. 1991, 12, 1153–1162. [Google Scholar] [CrossRef] [PubMed]
  25. Bauer, A.; Malik, M.; Schmidt, G.; Barthel, P.; Bonnemeier, H.; Cygankiewicz, I.; Guzik, P.; Lombardi, F.; Müller, A.; Oto, A.; et al. Heart Rate Turbulence: Standards of Measurement, Physiological Interpretation, and Clinical Use: International Society for Holter and Noninvasive Electrophysiology Consensus. J. Am. Coll. Cardiol. 2008, 52, 1353–1365. [Google Scholar] [CrossRef] [PubMed]
  26. Lomb, N. Least-squares frequency analysis of unequally spaced data. Astrophys. Space Sci. 1976, 39, 447–462. [Google Scholar] [CrossRef]
  27. Scargle, J.D. Studies in astronomical time series analysis. II-Statistical aspects of spectral analysis of unevenly spaced data. Astrophys. J. 1982, 263, 835–853. [Google Scholar] [CrossRef]
  28. Bachler, M.; Hörtenhuber, M.; Mayer, C.; Holzinger, A.; Wassertheurer, S. Entropy-Based Data Mining on the Example of Cardiac Arrhythmia Suppression. In Brain Informatics and Health; Lecture Notes in Computer Science; Ślȩzak, D., Tan, A.H., Peters, J., Schwabe, L., Eds.; Springer International Publishing: Cham, Switzerland, 2014; Volume 8609, pp. 574–585. [Google Scholar]
  29. Alcaraz, R.; Abásolo, D.; Hornero, R.; Rieta, J.J. Optimal parameters study for sample entropy-based atrial fibrillation organization analysis. Comput. Methods Progr. Biomed. 2010, 99, 124–132. [Google Scholar] [CrossRef] [PubMed] [Green Version]
  30. Pincus, S.M.; Goldberger, A.L. Physiological time-series analysis: What does regularity quantify? Am. J. Physiol. Heart Circ. Physiol. 1994, 266, H1643–H1656. [Google Scholar]
  31. Yentes, J.; Hunt, N.; Schmid, K.; Kaipust, J.; McGrath, D.; Stergiou, N. The Appropriate Use of Approximate Entropy and Sample Entropy with Short Data Sets. Ann. Biomed. Eng. 2013, 41, 349–365. [Google Scholar] [CrossRef] [PubMed]
  32. Chon, K.; Scully, C.; Lu, S. Approximate entropy for all signals. IEEE Eng. Med. Biol. Mag. 2009, 28, 18–23. [Google Scholar] [CrossRef] [PubMed]
  33. Box, G.E.P.; Cox, D.R. An Analysis of Transformations. J. R. Stat. Soc. Ser. B (Methodol.) 1964, 26, 211–252. [Google Scholar]
  34. Michaels, D.C.; Chialvo, D.R.; Matyas, E.P.; Jalife, J. Chaotic activity in a mathematical model of the vagally driven sinoatrial node. Circ. Res. 1989, 65, 1350–1360. [Google Scholar] [CrossRef] [PubMed]
  35. Hagmair, S.; Bachler, M.; Wassertheurer, S.; Mayer, C. Nonlinear Methods in Heart Rate Variability: Can they Distinguish between Nonpathological and Pathological Subjects? SNE Simul. Notes Eur. 2015, 25, 145–150. [Google Scholar] [CrossRef]
  36. Kleiger, R.E.; Miller, J.; Bigger, J.; Moss, A.J. Decreased heart rate variability and its association with increased mortality after acute myocardial infarction. Am. J. Cardiol. 1987, 59, 256–262. [Google Scholar] [CrossRef]
  37. Bigger, J.T.; Fleiss, J.L.; Steinman, R.C.; Rolnitzky, L.M.; Kleiger, R.E.; Rottman, J.N. Frequency domain measures of heart period variability and mortality after myocardial infarction. Circulation 1992, 85, 164–171. [Google Scholar] [CrossRef] [PubMed]
  38. Zuanetti, G.; Neilson, J.M.; Latini, R.; Santoro, E.; Maggioni, A.P.; Ewing, D.J. Prognostic Significance of Heart Rate Variability in Post–Myocardial Infarction Patients in the Fibrinolytic Era. Circulation 1996, 94, 432–436. [Google Scholar] [CrossRef] [PubMed]
  39. Rovere, M.T.L.; Bigger, J.T., Jr.; Marcus, F.I.; Mortara, A.; Schwartz, P.J. Baroreflex sensitivity and heart-rate variability in prediction of total cardiac mortality after myocardial infarction. Lancet 1998, 351, 478–484. [Google Scholar] [CrossRef]
  40. Cox, D.R.; Oakes, D. Analysis of Survival Data; CRC Press: Boca Raton, FL, USA, 1984; Volume 21. [Google Scholar]
  41. Altman, D.G. Practical Statistics for Medical Research; CRC Press: Boca Raton, FL, USA, 1990. [Google Scholar]
  42. Sakia, R.M. The Box-Cox transformation technique: A review. Statistician 1992, 41, 169–178. [Google Scholar] [CrossRef]
Figure 1. Flow chart of the study population.Flow chart of data.
Entropy 19 00582 g001
Figure 2. Hazard ratios (HR) for (A) all data; (B) subgroup of patients without heart disease (HD); and (C) patients with HD. HRs are plotted as diamonds with their corresponding 95% confidence interval.
Entropy 19 00582 g002
Table 1. Parameter sets used for entropy estimation in this work for template length m, the weighting factor(s) n, n L and n F , and the threshold parameter(s) r, r L and r F .
m n = n L n F r = r L = r F
e n t r o p y ( r Chon ) 221 r Chon
e n t r o p y ( r σ ) 213 0.2 · σ
Table 2. Baseline data of included patients. Data given as number (%) for categorical data, mean (SD) or median [IQR].
VariableAll Data (n = 265)
Age (years)62 (15.1 SD)
Sex—male, n (%)175 (66%)
Body weight (kg)77.1 (19 SD)
Height (m)1.71 (0.0842 SD)
Body mass index (kg/m 2 )25 [22.5, 28.7]
Presence of diabetes, n (%)92 (35%)
Presence of hypertension, n (%)250 (94%)
Current smokers, n (%)72 (27 %)
Adapted CCI (-)2 [1, 5]
Dialysis vintage (mo)47.3 [23.8, 79.4]
Dialysis duration per session (h)4.23 [4.02, 4.55]
UFV (mL)2196 (1157 SD)
Kt/V (-)1.47 (0.398 SD)
Serum albumin (g/dL)4.03 (0.395 SD)
hsCRP (mg/dL)0.368 [0.159, 0.881]
Total cholesterol (mg/dL)181 (44.8 SD)
HDL cholesterol (mg/dL)42 [36, 52]
LDL cholesterol (mg/dL)112 (36 SD)
Calcium × phosphate (mmol 2 /L 2 )3.94 (1.13 SD)
Antihypertensive drugs, n (%)237 (89%)
Statins, n (%)97 (37%)
Anticoagulant, n (%)29 (11%)
Abbreviations: SD = standard deviation; IQR = interquartile range; CCI = Charlson comorbidity index; mo = months; UFV = ultrafiltration volume; hsCRP = high-sensitivity C-reactive protein; Kt/V = dialyzer clearance of urea·dialysis time/volume of distribution of urea; HDL = high-density lipoprotein; LDL = low-density lipoprotein.
Table 3. Heart rate variability (HRV) parameters of the time and frequency domain and entropy measures at baseline. Data given as mean (SD) or median [IQR].
VariableAll Data (n = 265)
AVNN (ms)887 (131 SD)
SDNN (ms)33.9 (17.5 SD)
RMSSD (ms)13.4 [9.42, 20.2]
pNN50 (%)0.539 [0.0838, 2.48]
HRVTI (-)30.3 (9.84 SD)
Total P (ms 2 )1090 [495, 2198]
LF (ms 2 )189 [72, 461]
HF (ms 2 )59.9 [25.6, 158]
LF/HF (-)3.21 [1.37, 6.41]
ApEn ( r Chon ) (-)0.336 [0.184, 0.526]
ApEn ( r σ ) (-)1.05 (0.294 SD)
SampEn ( r Chon ) (-)3.36 (0.597 SD)
SampEn ( r σ ) (-)0.968 (0.345 SD)
FuzzyEn ( r Chon ) (-)3.58 (0.581 SD)
FuzzyEn ( r σ ) (-)0.688 (0.238 SD)
FuzzyMEn ( r Chon ) (-)6.95 [6.29, 7.74]
FuzzyMEn ( r σ ) (-)1.61 (0.552 SD)
CApEn ( r Chon ) (-)7.4 [7.23, 7.53]
CApEn ( r σ ) (-)1.36 (0.488 SD)
Abbreviations: SD = standard deviation; IQR = interquartile range; AVNN = average time of NN-intervals; SDNN = standard deviation of NN-intervals; RMSSD = square root of the mean-squared differences of adjacent NN-intervals; pNN50 = the percentage of the number of NN-intervals greater than 50 ms; HRVTI = HRV triangular index; Total P = total power; LF = low-frequency (0.04–0.15 Hz) power; HF = high-frequency (0.15–0.4 Hz) power; ApEn = approximate entropy; SampEn = sample entropy; FuzzyEn = fuzzy entropy; FuzzyMEn = fuzzy measure entropy; CApEn = corrected approximate entropy.
Table 4. Significant univariate predictors of mortality: conventional risk factors ( n = 265 ).
PredictorUnitHR (95% CI)p
Age1 year1.05 (1.03, 1.07)<0.001
Height1 cm0.97 (0.94, 1.00)0.04
Adapted CCI11.24 (1.16, 1.33)<0.001
Dialysis duration per session1 h0.52 (0.30, 0.89)0.02
Serum albumin1 g/dL0.24 (0.13, 0.45)<0.001
hsCRPlog(1 mg/dL)1.26 (1.02, 1.56)0.04
AnticoagulantNo/Yes0.31 (0.17, 0.55)<0.001
Abbreviations: HR = hazard ratio; CI = confidence interval; CCI = Charlson comorbidity index; hsCRP = high-sensitivity C-reactive protein.
Table 5. Unadjusted and adjusted hazard ratios of heart rate variability (HRV) parameters ( n = 265 ).
VariableUnitUnadjustedModel AModel B
HR (95% CI)pHR (95% CI)pHR (95% CI)p
AVNN10 ms1.01 (0.99, 1.03)0.3----
SDNN log ( ms ) 0.66 (0.43, 1.01)0.050.76 (0.47, 1.21)0.250.67 (0.41, 1.10)0.12
RMSSD log ( ms ) 0.94 (0.63, 1.40)0.75----
pnn50 log ( % ) 1.02 (0.97, 1.07)0.51----
HRVTI10.97 (0.94, 0.99)0.010.98 (0.95, 1.00)0.070.98 (0.95, 1.01)0.12
Total P log ( ms 2 ) 0.81 (0.65, 0.99)0.040.87 (0.69, 1.10)0.250.83 (0.65, 1.05)0.12
LF log ( ms 2 ) 0.82 (0.69, 0.96)0.010.84 (0.70, 1.00)0.050.82 (0.68, 0.99)0.04
HF log ( ms 2 ) 1.02 (0.85, 1.22)0.84----
LF/HF10.74 (0.60, 0.90)0.0030.82 (0.66, 1.01)0.060.74 (0.59, 0.92)0.007
ApEn ( r Chon ) log ( 1 ) 1.30 (0.95, 1.77)0.1----
ApEn ( r σ ) 10.55 (0.25, 1.23)0.15----
SampEn ( r Chon ) 10.68 (0.45, 1.03)0.07----
SampEn ( r σ ) 10.55 (0.27, 1.10)0.09----
FuzzyEn ( r Chon ) 10.59 (0.39, 0.90)0.010.58 (0.37, 0.92)0.020.65 (0.41, 1.04)0.07
FuzzyEn ( r σ ) log ( 1 ) 0.65 (0.33, 1.27)0.21----
FuzzyMEn ( r Chon ) log ( 1 ) 0.32 (0.09, 1.13)0.08----
FuzzyMEn ( r σ ) 10.74 (0.48, 1.15)0.18----
CApEn ( r Chon ) 0.91 (0.84, 0.98)0.010.92 (0.84, 1.00)0.040.92 (0.84, 1.01)0.08
CApEn ( r σ ) 10.90 (0.55, 1.47)0.67----
⋄ Data was Box-Cox transformed with λ = 13.81 and divided by 1 × 10 10 . Abbreviations: HR = hazard ratio; CI = confidence interval; AVNN = average time of NN-intervals; SDNN = standard deviation of NN-intervals; RMSSD = square root of the mean-squared differences of adjacent NN-intervals; pNN50 = the percentage of the number of NN-intervals greater than 50 ms; HRVTI = HRV triangular index; Total P = total power; LF = low-frequency (0.04–0.15 Hz) power; HF = high-frequency (0.15–0.4 Hz) power; ApEn = approximate entropy; SampEn = sample entropy; FuzzyEn = fuzzy entropy; FuzzyMEn = fuzzy measure entropy; CApEn = corrected approximate entropy.
Table 6. Unadjusted and adjusted HRs of entropies for the subgroup patients without heart disease ( n = 166 ).
No Heart Disease
VariableUnitUnadjustedModel AModel B
HR (95% CI)pHR (95% CI)pHR (95% CI)p
ApEn ( r Chon ) log ( 1 ) 1.28 (0.85, 1.90)0.23----
ApEn ( r σ ) 11.21 (0.39, 3.77)0.74----
SampEn ( r Chon ) 10.78 (0.44, 1.40)0.41----
SampEn ( r σ ) 11.04 (0.40, 2.73)0.93----
FuzzyEn ( r Chon ) 10.66 (0.38, 1.14)0.14----
FuzzyEn ( r σ ) log ( 1 ) 1.23 (0.46, 3.26)0.67----
FuzzyMEn ( r Chon ) log ( 1 ) 0.63 (0.12, 3.45)0.60----
FuzzyMEn ( r σ ) 11.12 (0.62, 2.03)0.71----
CApEn ( r Chon ) 0.99 (0.98, 1.00)0.10----
CApEn ( r σ ) 11.43 (0.74, 2.77)0.29----
⋄ Data was Box-Cox transformed with λ = 13.81 and divided by 1 × 10 10 . Abbreviations: HR = hazard ratio; CI = confidence interval; ApEn = approximate entropy; SampEn = sample entropy; FuzzyEn = fuzzy entropy; FuzzyMEn = fuzzy measure entropy; CApEn = corrected approximate entropy.
Table 7. Unadjusted and adjusted HRs of entropies for the subgroup patients with heart disease ( n = 99 ).
Heart Disease (HD)
VariableUnitUnadjustedModel AModel B
HR (95% CI)pHR (95% CI)pHR (95% CI)p
ApEn ( r Chon ) log ( 1 ) 1.27 (0.76, 2.11)0.37----
ApEn ( r σ ) 10.29 (0.09, 0.91)0.030.13 (0.04, 0.44)0.0010.20 (0.05, 0.82)0.02
SampEn ( r Chon ) 10.64 (0.36, 1.12)0.11----
SampEn ( r σ ) 10.31 (0.11, 0.90)0.030.15 (0.05, 0.46)<0.0010.22 (0.06, 0.81)0.02
FuzzyEn ( r Chon ) 10.56 (0.30, 1.06)0.08----
FuzzyEn ( r σ ) log ( 1 ) 0.39 (0.15, 1.00)0.050.21 (0.07, 0.58)0.0030.32 (0.10, 0.99)0.05
FuzzyMEn ( r Chon ) log ( 1 ) 0.19 (0.03, 1.18)0.08----
FuzzyMEn ( r σ ) 10.50 (0.25, 0.99)0.050.32 (0.16, 0.67)0.0020.43 (0.19, 0.96)0.04
CApEn ( r Chon ) 0.99 (0.98, 1.00)0.06----
CApEn ( r σ ) 10.57 (0.27, 1.20)0.14----
⋄ Data was Box-Cox transformed with λ = 13.81 and divided by 1 × 10 10 . Abbreviations: HR = hazard ratio; CI = confidence interval; ApEn = approximate entropy; SampEn = sample entropy;FuzzyEn = fuzzy entropy; FuzzyMEn = fuzzy measure entropy; CApEn = corrected approximate entropy.

