Single-Cell Reprogramming in Mouse Embryo Development through a Critical Transition State


1
SEIKO Life Science Laboratory, SRI, Osaka 540-659, Japan
2
Systems Biology Program, School of Media and Governance, Keio University, Fujisawa 252-0882, Japan
3
Environment and Health Department, Istituto Superiore di Sanitá, 00161 Rome, Italy
4
Faculty of Life and Medical Sciences, Doshisha University, Kyotanabe 610-0394, Japan
*
Author to whom correspondence should be addressed.
Entropy 2017, 19(11), 584; https://doi.org/10.3390/e19110584
Submission received: 3 July 2017
/
Revised: 6 October 2017
/
Accepted: 26 October 2017
/
Published: 2 November 2017
(This article belongs to the Special Issue Entropy and Its Applications across Disciplines)
Abstract
:Our previous work on the temporal development of the genome-expression profile in single-cell early mouse embryo indicated that reprogramming occurs via a critical transition state, where the critical-regulation pattern of the zygote state disappears. In this report, we unveil the detailed mechanism of how the dynamic interaction of thermodynamic states (critical states) enables the genome system to pass through the critical transition state to achieve genome reprogramming right after the late 2-cell state. Self-organized criticality (SOC) control of overall expression provides a snapshot of self-organization and explains the coexistence of critical states at a certain experimental time point. The time-development of self-organization is dynamically modulated by changes in expression flux between critical states through the cell nucleus milieu, where sequential global perturbations involving activation-inhibition of multiple critical states occur from the middle 2-cell to the 4-cell state. Two cyclic fluxes act as feedback flow and generate critical-state coherent oscillatory dynamics. Dynamic perturbation of these cyclic flows due to vivid activation of the ensemble of low-variance expression (sub-critical state) genes allows the genome system to overcome a transition state during reprogramming. Our findings imply that a universal mechanism of long-term global RNA oscillation underlies autonomous SOC control, and the critical gene ensemble at a critical point (CP) drives genome reprogramming. Identification of the corresponding molecular players will be essential for understanding single-cell reprogramming.
1. Introduction
In mammalian embryo development, many molecular-level epigenetic studies [1,2,3] have revealed the presence of stunning global epigenetic modifications on chromatins (DNA + histones) associated with reprogramming processes. However, the genome-wide principle that drives such extremely complex epigenetic modifications is still unknown.
In our previous studies, based on transcriptome experimental data for seven distinct cell fates [4], we recognized that a self-organized criticality (SOC) transition in whole-genome expression plays an essential role in the change in the genome expression state at both the population and single-cell levels (see Methods, for more details [4,5,6]). The essential points of SOC control of overall expression can be summarized as follows:
- (i)
- SOC control of overall expression represents the self-organization of coexisting critical states (distinct response expression domains) through a critical transition. Temporal variance expression (normalized root mean square fluctuation: nrmsf; see Methods) acts as an order parameter in self-organization. Distinct critical states can be observed in a transitional behavior of the ensemble expression profile (e.g., bimodality coefficient) or bifurcation of the ensemble expression state (e.g., probability density profile) according to nrmsf. Coherent behaviors emerge from stochastic expression within critical states (coherent-stochastic behaviors; see non-equilibrium statistical mechanism underpinning the spontaneous emergence of order out of disorder [7]) as the collective behaviors of groups with more than around 50 genes (mean-field approach) [6,8,9].
- (ii)
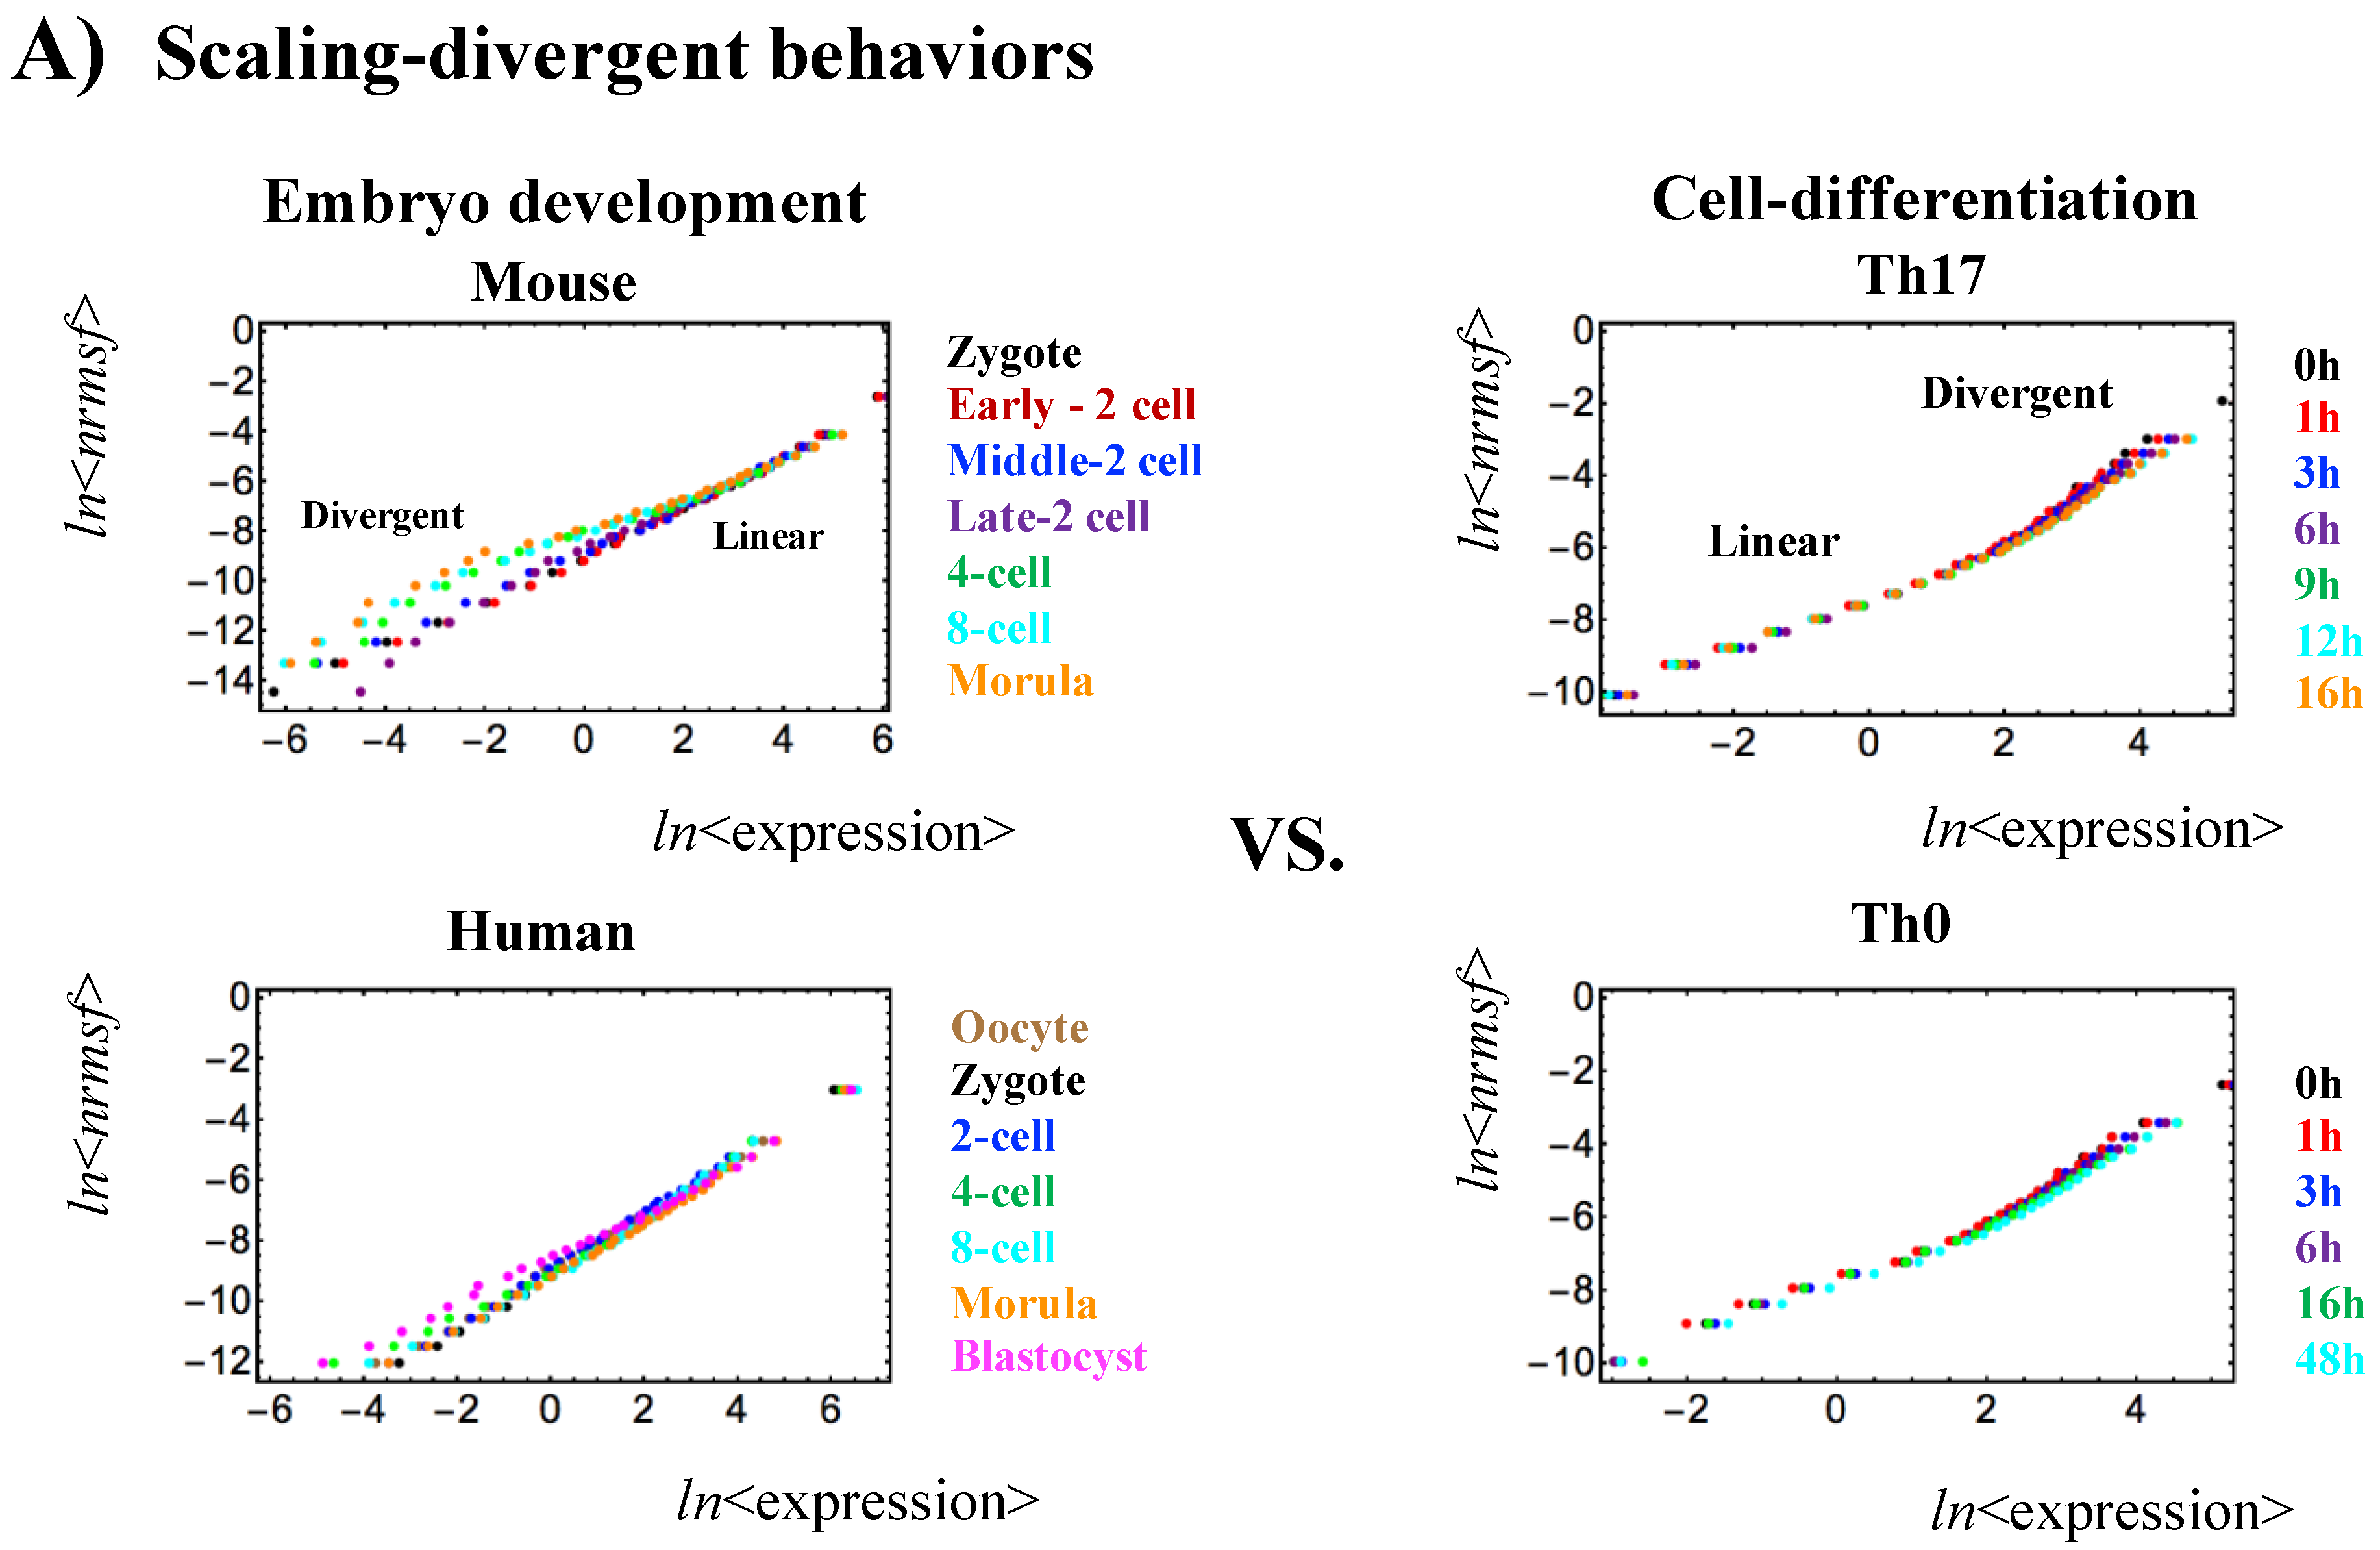
- Self-organization based on SOC occurs through distinctive critical behaviors: sandpile-type critical behavior (criticality) and scaling-divergent behavior. In sandpile-type criticality, the divergence of two different regulatory behaviors occurs at a critical point (summit of the sandpile) that neatly separates up- and down-regulation. Sandpile-type criticality emerges spontaneously by the grouping of different gene expressions according to their fold-change. Reprogramming or cell-fate change is observed as erasure of criticality of an initial-state (such as an early embryo state). Scaling-divergent behavior emerges upon averaging the behavior of gene-group expression according to nrmsf, producing both linear (scaling) and divergent domains in a log-log plot. This divergent behavior anticipates a transition [10]. Since nrmsf is an order parameter, the above separation of scaling domains (Figure 1) shows how self-organization occurs in overall expression and that it is not confined to a few “master genes”.
SOC control of overall expression can be seen in an emergent level of collective behaviors. The presence of a “collective organization layer” in gene expression, while naturally encompassed by the existence of “tissue-specific gene-expression profiles” across the whole genome, seems at odds with most biological experimentation that strictly focuses on gene-specific rules. The contrast of “microscopic rules” versus “collective behavior” is a classical issue in science: it is worth stressing that the presence of microscopic laws does not falsify the statistical approach (which in this condition could be considered to be a surrogate of a more “fundamental” microscopic approach), while a statistical “emergent” approach is valid even in the absence of microscopic deterministic rules [11]. In this latter case, the “fundamental level” corresponds to the collective organization layer [11,12]. As for our specific case, a gene-by-gene set of deterministic microscopic rules that affects thousands of gene products (some of which have very low concentrations inside single cells and thus are undergoing high stochastic fluctuation) is expected to be both more unreliable and more energy-consuming than self-organized criticality that in turn very clearly emerges in different scaling regimens along the order parameter (Figure 1).
Recently, we demonstrated that essentially the same critical-state dynamics that we observed for cell differentiation processes [4,6] are also present in overall RNA expression in single-cell mouse embryo development, which presents further proof of SOC control as a universal characteristic [13]. Overall RNA expression and its dynamics exhibit typical features (genome avalanche and sandpile type criticality) of self-organized criticality (SOC) control in mouse embryo development; Figure 1 shows a genome avalanche, i.e., scaling-divergent behavior in a log-log-scale plot between expression and the temporal variance of expression (nrmsf). Figure 2 depicts the phenomena in Figure 1 along a time arrow, and clarifies early embryo development with a shift toward erasure of the previous organization pattern relative to the zygote state: sandpile-type criticality (critical behavior) of the zygote state survives at the early 2-cell state and disappears after the late 2-cell state to reach a stochastic pattern in the 4-cell state (linear pattern revealed in randomly shuffled overall expression: Figure S2 in [4]).
Importantly, genome avalanches (Figure 1) reveal that the regions of scaling and divergence in terms of nrmsf are opposite between embryo development and cell differentiation at a single-cell level. Since nrmsf is an order parameter [4,5,6], this reveals opposite orders of self-organization; similar scaling-divergent order for cell differentiation is also observed at a cell-population level in cancer cells [4,6]. Furthermore, since chromosomes exhibit fractal organization [14,15], this power law behavior may reveal a quantitative relation between the aggregation state of chromatin through nrmsf and the average expression of an ensemble of genes, which is opposite in embryo development and cell differentiation, and the existence of coherent waves of condensation/de-condensation in chromatin in cell development, which is transmitted from a region of low temporal expression (low nrmsf region) in reprogramming of the embryo genome, to high temporal expression (high nrmsf) in terminal somatic cell differentiation.
On the other hand, the erasure of sandpile-type criticality (Figure 2) indicates that (i) the memory of early embryogenesis in the zygote is lost after the late 2-cell state: a significant change in the genome-state, i.e., the occurrence of reprogramming; and (ii) the SOC control landscape, showing valley (SOC control) - ridge (non SOC control) - valley (SOC control), exhibits a near-critical transition state at the middle - late 2-cell states through a stochastic pattern. A complete erasure of the zygote state’s criticality occurs after the late 2-cell state, such that a critical transition state should exist right after the late 2-cell state.
In this report, we investigate the self-organizing dynamics of whole RNA expression in mouse embryo development [16] to reveal how genome reprogramming occurs by passing through a critical transition state. This is elucidated by a dynamic expression flux analysis (quantitative evaluation of perturbation based on self-organization through SOC).
The results regarding the flux dynamics suggest that the critical gene ensemble of the critical point plays an essential role in reprogramming. Our results suggest that the SOC control mechanism of genome dynamics is rather universal among several distinct biological processes [4]. Our findings may provide a universal classification scheme for phenomena with far-from-equilibrium phase transitions, which has been missing in past studies [17].
2. Results
2.1. Dynamic Interaction of Critical States
2.1.1. Sloppiness of Mouse RNA Expression Dynamics: Coherent-Stochastic Behaviors in Critical States
As has been demonstrated in cell differentiation [4,5,6], mouse embryo overall RNA expression is self-organized into distinct response domains (critical states). This can be seen as a transitional change in the expression profiles of groups of genes according to nrmsf (Figure 3A), which generates three different gene expression states: “super-critical”, “near critical” and “sub-critical”.
Figure 3 demonstrates that distinct coherent-stochastic behaviors emerged in critical states based on (i) the law of large numbers in each critical state (convergence to its center of mass; Figure 3B); (ii) different degrees of stochasticity (Figure 3B); (iii) distinct coherent dynamics (Figure 3C) and (iv) non-convergence of mixed states to a dominant CM (i.e., sub-critical state; Figure 3D).
This emergent coherent behavior shows how a single cell can overcome the problem of local stochastic fluctuations in single genes (microscopic rules) by gene-expression regulation, which further affirms the statistical significance of self-organization through SOC control of overall expression: genome avalanche and sandpile-type criticality (Figure 1A and Figure 2). This collective control in early embryo development points, notably, to the fact that bewildering epigenomic reprogramming molecular processes are regulated by a few hidden control parameters through SOC in terms of collective behaviors even at a single-cell level (see [4] for examples of SOC control at the cell-population level).
Regarding a critical point (CP) in single-cell Th17 cell differentiation and mouse early embryo development, the results suggest that a single critical point (CP) in terms of nrmsf may exist in the range of ln<nrmsf> from −5.5 to −6.0 for both processes: the onset of the divergence from scaling occurs at around ln<nrmsf> ~ − 6.0 for Th17 cell differentiation (Figure 1B and Figure 4B), whereas linear regressions in scaling regions for mouse early embryo exhibit intersection at around ln<nrmsf> = −5.5~−6.0 (Figure 4C; see also a critical point as in Figure 2 and Figure 3A).
2.1.2. Expression Flux Dynamics Representing a Change in Genetic Activity
Here, we elucidate a statistical mechanism to explain how a single mouse embryo cell achieves genome reprogramming by passing through a transition state (Figure 2).
Figure 3B reveals that the coherent-stochastic behavior in a critical state corresponds to the scalar dynamics of its CM, X(sj), where X(sj) represents the numerical value of a specific critical state (i.e., super-, near- or sub-critical state) at the jth cell state, sj. Thus, the change in the one-dimensional effective force acting on the CM determines the dynamics of X(sj). Figure 5A confirms this point, in that the trend of the dynamics of the CM of a critical state follows its effective force (net self-flux dynamics: see the definition below). We now consider that the respective average values of the effective force can serve as baselines, and how perturbation from these baselines occurs dynamically.
The expression flux between critical states is interpreted as a non-equilibrium system and evaluated in terms of a dynamic network of effective forces, where interaction flux is driven by effective forces between different critical states and can be described by a second-order time difference. From a mathematical point of view, the oscillatory phenomenon interpreted using a second-order time difference equation with a single variable is equivalent to inhibitor-activator dynamics given by a couple of first-order time difference equations with two variables.
The genome is embedded in the intra-nuclear environment, where the expression flux represents the exchange of genetic energy or activity—the effective force produces work, and thus causes a change in the internal energy of critical states. This model shows a statistical thermodynamic picture of self-organized overall expression under environmental dynamic perturbations; the regulation of RNA expression is managed through the mutual interaction between critical states and the external connection with the cell nucleus milieu. The environment here is intended in the broad sense of the baseline gene expression activity adapted to the microenvironment; in thermodynamic terms, the environment is equivalent to a “thermal bath”.
The effective force can be interpreted as a combination of incoming flux from the past to the present and outgoing flux from the present to the future cell state [4]:
where ΔP is the change in momentum with a unit mass (i.e., impulse: FΔs = ΔP) and the development of the embryo cell-state is considered as the time-development with an equal time interval (a unit): Δsj = sj − sj−1= 1 and Δs = sj+1 − sj−1 = 2; sj corresponds to a specific cell state (such as zygote); the CM of a critical state is with the natural log of the ith expression , at the jth cell state, s = sj (N = number of RNAs; Methods); the average of net self-flux over the number of critical states, <f(X)> = <INflux> − <OUTflux>.
The effective force, f(X(sj)), is called the net self-flux of a critical state at the jth cell state sj. The net self-flux, IN flux − OUT flux, has a positive sign for incoming force (net IN self-flux) and a negative sign for outgoing force (net OUT self-flux). Thus, the CM from its average over all cell states represents up- (down-) regulated expression for the corresponding net IN (OUT) flux.
The interaction flux of a critical state, X with respect to another critical state or the environment (milieu) Y (Figure 5B) can be defined as:
where, again, the first and second terms represent IN flux and OUT flux, respectively, and the net value, IN flux − OUT flux, represents incoming (IN) interaction flux from Y for a positive sign and outgoing (OUT) interaction flux to Y for a negative sign. where X: E represents the environment.
Due to the law of force, the net self-flux of a critical state is the sum of the interaction fluxes with other critical states and the environment:
where is an interaction flux of X with with X, and M is the number of internal interactions (M = 2), i.e., for a given critical state, there are two internal interactions with other critical states. Equation (3) tells us that the sign of the difference between the net self-flux and the overall contribution from internal critical states, reveals incoming flux (positive) from the environment to a critical state or outgoing flux (negative) from a critical state to the environment.
Regarding average flux, an average flux balance exists in terms of the net average fluxes coming in and going out at each critical state (near-zero) through the environment: average expression fluxes: and (Equations (1) and (2)) for the mouse RNA-Seq data (Methods). Note: The balance does not hold at each time point/cell state.
This model of expression flux dynamics shows environmental dynamic perturbations in the self-organization of overall expression; the regulation of RNA expression is managed through the mutual interaction between critical states through the cell nucleus.
Under non-equilibrium thermodynamically-open conditions, due to the break-down of the detailed balance, cyclic state-flux among different states emerges as a general property [18]. This is evident in Figures 6 and 7.
Figure 6 that shows how two cyclic fluxes (between the Super-Sub critical states, and the Super-Near critical states respectively) emerge, while Figure 5B reveals the broken detailed balance of mutual fluxes between critical states at each time point (see the broken detailed balance more clearly in Figure 7), these cyclic fluxes are substantially perturbed right before passing the critical transition state (near-transition state between the middle-late 2 cell states; see more in Section 2.2). Therefore, it becomes possible to evaluate the temporal change in the thermodynamically-open genetic system, where the expression flux represents the exchange of genetic energy or activity.
2.1.3. Sub-Critical State as a Generator of Perturbation in Genome-Wide Self-Organization
Average net IN and OUT flux flows show how the internal critical states and the external cell nucleus milieu mutually interact (Figure 6). Two cyclic expression flux flows form among critical states: between super- and near-critical states, and a dominant cyclic expression flux between super- and sub-critical states in the genomic system.
These cyclic fluxes are considered in light of self-regulatory gene expression by means of a complex epigenetic machinery (methylation processes, long non-coding RNAs, small non-coding RNAs such as miRNAs, etc.): the super-critical state (high variance RNAs) acts as a sink internally to receive genetic information and send it back to the other critical states through the cell environment. On the other hand, the sub-critical state (low-variance RNAs) acts as an internal source of information and sustains (like a generator in an electrical circuit) the interaction with cyclic fluxes.
This implies that the collective behavior of an ensemble of low-variance RNA expression (sub-critical state) plays an essential role in reprogramming in single cells (see a more dynamical discussion below). This dominant cyclic flow also shows that the dynamics of the sub-critical and super-critical states are anti-phase with respect to each other (Figure 3C) to form strong coupling between them [6]. This suggests that the two cyclic fluxes act as feedback flow for the change in criticality to generate coherent oscillatory dynamics of critical states. This dynamic model also provides a mechanism for long-term global RNA oscillation underlying autonomous SOC control generated by the sub-critical state [4,6,19].
The formation of a dominant cyclic flux between a source and a sink provides a genome-engine metaphor for SOC control mechanisms to describe how expression flux is transmitted among critical states: the sub-critical state as a “large piston” for short moves and the super-critical state as a “small piston” for large moves with an “ignition switch” (near-critical state with a critical point) are connected through a dominant cyclic state flux as a “camshaft”, resulting in the anti-phase dynamics of two piston movements (refer to Discussion in [4]). This suggests that the genome engine, may be a universal mechanism in gene-expression regulation of mammalian cells.
2.1.4. Change in Criticality: Global Impact on the Whole Genome-Expression System
Here, we further clarify the SOC control mechanism of the reprogramming of single-cell embryo development through the breakdown of an initial state’s criticality.
Reprogramming occurs right after the late 2-cell states: the zygote-state SOC control of overall gene expression (i.e., initial-state global gene-expression regulation mechanism) is destroyed through erasure of the zygote-state criticality. Figure 5D shows that the mutual interactions of Sub-Near and Sub-Super determine the net self-flux of the sub- and super-critical states, respectively, representing the effective driving forces acting on their CMs and thus, determine their coherent oscillatory dynamics (Figure 3C). This between-states interaction serves as the underlying mechanism of self-regulatory gene expression through the orchestrated cooperation of myriads of epigenetic modifications, transcriptional factors and non-coding RNA regulations to determine the critical-state coherent oscillatory behavior. The essential role played by interactions explains how the temporal change in criticality at the near-critical state, i.e., in expression of the critical gene ensemble of the CP, directly perturbs the sub-critical state (the generator of flux dynamics: Figure 6) through their mutual interaction, and perturbation of this generator can spread over the entire system (refer also to Figure 13A for cell differentiation in [4]).
2.2. SOC Control Mechanism of Genome Reprogramming through a Critical Transition State
The erasure of initial-state criticality (e.g., in the zygote state) suggests that genome reprogramming begins right after the late 2-cell state. As noted, the initial state can be the early 2-cell state instead of the zygote state; this independent choice of the initial state further supports the timing of the genome-state change [4].
Interaction flux dynamics (Figure 5B and Figure 7) represents the erasure as a thermodynamical event that passes through a critical transition state, which shows how the genome system can pass through the critical transition state - dynamic perturbation in the average flux in terms of the enhancement-suppression of two cyclic flows around the reprogramming event (Figure 7):
- (i)
- Before reprogramming: In the middle 2-cell state, interaction flux (Super—Near) suppresses cyclic flux, where the near-critical state acts as a major suppressor. All critical states receive the net IN flux, which indicates that inside the nucleus, the mouse genome system is activated through the cell milieu (environment).
- (ii)
- Right before reprogramming: A substantial change in the net interaction flux at critical states occurs beginning in the middle 2-cell state and into the late 2-cell state. These changes induce a major change in the two cyclic fluxes: a change from suppression to the enhancement of cyclic flux (Super—Near), and strongest enhancement in the dominant cyclic flux (Super—Sub). This leads to the reverse change in the net interaction fluxes at the near-critical state (IN to OUT and vice versa) to enhance the cyclic flux (Super—Near) from the major suppressor at the early 2-cell state. Thus, these reverse cyclic enhancements make the genome system pass through the critical transition state. This interaction model reveals that
- (a)
- A major biological event in genome reprogramming through a stochastic pattern is guided by the sub-critical state at the late 2-cell state, and
- (b)
- There is a detailed open thermodynamic mechanism regarding the erasure of criticality of the zygote state in the late 2-cell state.
- (c)
- The asymmetry becomes most significant for the IN-and-OUT fluxes between the super- and sub-critical states at the late 2-cell state, i.e., the greatest time-reversal symmetry breaking is caused.
In this respect, it is worth noting that, with no time-reversal symmetry breaking, interaction fluxes between the super- and sub-critical states should be balanced (equal), corresponding to the fundamental framework of a detailed balance in equilibrium statistical physics, while detailed balance should be violated in a thermodynamically open system [18]. - (iii)
- After reprogramming: In the 4-cell state, while the enhancement of cyclic flux (Super—Sub) becomes weak, the perturbation of average flux activity almost disappears due to passage through the transition state.
Therefore, two major global perturbations, which involve the activation-inhibition of multiple critical states, occur between the middle and late 2-cell states, and between the late 2-cell and 4-cell states during genome reprogramming (Figure 3C). This global perturbation event is clearly seen in the net kinetic energy flux [4] in a critical state (Figure 5C):
where the kinetic energy of the CM for the critical state with unit mass at s = sj is defined as 1/2 2 with average velocity: .
The above processes (i)–(iii) regarding reprogramming can be described in terms of how the genome system can pass through the transition state on the SOC control landscape (Figure 2): the perturbation of self-organization shows a temporal change in the degree of SOC control: a high (low) degree of SOC control points to a weak-local (strong-global) perturbation of the average flux flow. The process that climbs the hill of the SOC control landscape encompasses the following steps (Figure 7): (1) Release from SOC control in the middle 2-cell state due to activation of the near-critical state; (2) Passage through the transition state - the lowest degree of SOC control (i.e., non-SOC control) due to the strongest global perturbation at the late 2-cell state stemmed from activation of the sub-critical state, which changes from SOC control to non-control; (3) Return to SOC control in the 4-cell state.
2.3. Discussion and Conclusions
Thermodynamics allows for incredibly precise predictions thanks to the “generality of its premises” (Einstein’s words [20]). In the present study, this allowed us to grasp the essentials by skipping the (largely unknown) detailed biological mechanisms and focusing on the phenomenology of the global changes in genome expression. The erasure of epigenetic marks (refer to the Discussion in [4]) is consistent with a thermodynamics perspective in addition to its actual mechanism.
The time-development of sandpile criticality reveals the existence of a transition state which in turn suggests that programming of mouse embryo occurs through the transition state. As proof of this concept, it has been demonstrated that EGF-stimulated MCF-7 cells do not erase sandpile criticality (see Figure 5A in [4]), i.e., there is no genome-state change (consistent with the experiment in which cell differentiation does not occur [21]). This shows that the event of single-cell programming is related to overcoming of the transition state [22,23], which is a typical event in a thermodynamic reaction mechanism. Moreover, the timing of the reprogramming does not depend on the selection of an initial cell state [4]. The result helps us to obtain a quantitative appreciation of the still largely qualitative notion of the epigenetic landscape.
Intriguingly, our statistical thermodynamics approach reveals that the collective behavior of an ensemble of stochastic low-variance RNA expression (sub-critical state), which shows only marginal changes in expression and consequently is considered to be devoid of any interest, guides the genome to pass through the transition state (erasure of initial-state sandpile-type criticality) to reprogram the mouse embryo. The sub-critical state gene ensembles act as a driving force to transmit their potentiality, or energy of coherent transcription fluctuations, to high-variance genes (genome-engine mechanism [4]). We also observed this generator role of the sub-critical state in cell differentiation [4] (MCF-7 human cancer cells and HL-60 human promyelocytic leukemia cells). Thus, a genome-engine mechanism may provide a universal SOC control mechanism in the genome system.
A sandpile-type critical point (CP) exists around the edge between the near- and super-critical states in the mouse genome. The erasure of sandpile-type criticality through embryo development induces a dynamic change in interaction flux dynamics between the near- and sub-critical states, which determines the activation-inhibition dynamics of the sub-critical state. The sub-critical state generates autonomous SOC control of overall expression, and thus the critical dynamics (temporal change in criticality) affect the entire genome-expression system. This suggests that a critical gene ensemble of sandpile-type criticality (i.e., critical point) should exist to affect the entire genome expression. Furthermore, our result suggests that there may exist a fixed CP in terms of temporal expression variance (nrmsf) among different biological processes. Therefore, elucidation of the molecular mechanism that guides the genome system through a transition state is expected to reveal molecular clues as to how a single cell can succeed or fail at reprogramming, such as in a single iPS cell.
Further studies will be needed to identify a material basis for the observed phenomena by revealing the molecular mechanism of the criticality of gene ensemble, which may lead to a comprehensive understanding of single-cell reprogramming.
3. Methods
3.1. Biological Data Sets
We analyzed the following mammalian RNA-Seq data:
(i) Early embryonic development in human and mouse developmental stages in Reads Per Kilobase Mapped (RPKM) values; GEO ID: GSE36552 (human: N = 20,286 RNAs) and GEO ID: GSE45719 (mouse: N = 22,957 RNAs), which have seven and 10 embryonic developmental stages (experimental details in [16,24], respectively):
Human: oocyte (m = 3), zygote (m = 3), 2-cell (m = 6), 4-cell (m = 12), 8-cell (m = 20), morula (m = 16) and blastocyst (m = 30),
Mouse: zygote (m = 4), early 2-cell (m = 8), middle 2-cell (m = 12), late 2-cell (m = 10), 4-cell (m = 14), 8-cell (m = 28), morula (m = 50), early blastocyst (m = 43), middle blastocyst (m = 60) and late blastocyst (m = 30), where m is the total number of single cells.
(ii) T helper 17 cell differentiation from mouse naive CD4+ T cells in RPKM values, where Th17 cells are cultured with anti-IL4, anti-IFNγ, IL-6 and TGF-β, and Th0 cultures provide control cells that receive TCR activation in the absence of exogenous polarizing cytokines (IL-6 + TGF-β) (details in [25]); GEO ID: GSE40918 (mouse: N = 22281 RNAs), which has 9 time points: t0 = 0, t1 = 1, 3, 6, 9, 12, 16, 24, tT = 8 = 48 h for Th17, and 6 time points: t0 = 0, t1 = 1, 3, 6, 16, tT = 5 = 48 h for Th0.
RNAs with RPKM values of 0 over all of the cell states were excluded. Random real numbers in the interval [0, a] generated from a uniform distribution were added to all expression values in the analysis of sandpile criticality (Figure 2; no addition of random numbers in the rest of the Figures). This procedure avoids the divergence of zero values in the logarithm. The robust sandpile-type criticality through the grouping of expression was checked by changing a positive constant, a (0 < a < 10), we set a = 0.01. Note: The addition of large random noise (a >> 10) destroys the sandpile CP.
3.2. Normalized Root Mean Square Fluctuation (nrmsf)
Nrmsf is defined by dividing rmsf (root mean square fluctuation) by the maximum of overall {rmsfi}:
where rmsfi is the rmsf value of the ith RNA expression, which is expressed as εi(sj) at a specific cell state sj (in mouse, S = 10: s1 = zygote, early 2-cell, middle 2-cell, late 2-cell, 4-cell, 8-cell, morula, early blastocyst, middle blastocyst and s10 = late blastocyst), and is its average expression over the number of cell states. Note: nrmsf is a time-independent variable and an order parameter for the self-organization of genome expression as demonstrated in our previous works [4,5,6].
3.3. Bimodality Coefficient
Sarle’s bimodality coefficient for a finite sample (b) [26] is given by:
where n is the number of items in the sample, g is the sample skewness and k is the sample excess kurtosis.
It is worth noting that gene expression in the single cell RNA-Seq data we used in the present paper has many zero values. This is not an artifact, but rather a consequence of the “toggle-switch” mechanism of gene regulation [27] and is essential for understanding regulation mechanisms. From a purely computational perspective, zeroes alter the “standard values” of the bimodality coefficient (b = 5/9~0.56 indicates a bimodal or multimodal transition from a unimodal profile), which implies that we must limit ourselves to considering the bimodality coefficient a step-like behavior as the signature of a transition (Figure 3A) without entering in the details of their actual values.
3.4. SOC Control Mechanism of Overall Expression
A self-organized criticality (SOC) transition in whole-genome expression plays an essential role in the change in the genome expression state - SOC control of overall expression at both the population and single-cell levels [4,5,6]. The basic findings of these studies can be summarized as follows:
- (i)
- SOC of overall expression does not correspond to a phase transition from one critical state to another. Instead, it represents the self-organization of the coexisting critical states through a critical transition, i.e., SOC consolidates critical states into a genome expression system (called “SOC control of overall expression”) according to temporal expression variance (nrmsf). Nrmsf acts as an order parameter in self-organization. In critical states, distinct coherent (collective) behaviors emerge in ensembles of stochastic expression (coherent-stochastic behavior), where the coherent dynamics of high-variance gene expression (super-critical state) is anti-phase to that of low-variance gene expression (sub-critical state).
- (ii)
- The characteristics of the self-organization through SOC become apparent only in the collective behaviors of groups with an average of more than around 50 genes (mean-field approach). The same value of 50 genes (or around this value) as the threshold for the onset of coherent ensemble behavior was previously recognized in a completely different context and by different analytical techniques [6,8,9]. This effect is clearly a statistical one, but not a “simple statistical one” in the sense that it is a proxy of the underlying gene regulation network (GRN).
- (iii)
- Self-organization occurs through distinctive critical behaviors: sandpile-type criticality and scaling-divergent behavior:
- (a)
- Sandpile-type critical behavior (criticality) based on the grouping of expression according to the fold-change in expression. The summit of the sandpile represents the critical point (CP); as the distance from the CP increases, two different regulatory behaviors diverge, which represent up-regulation and down-regulation, respectively. Furthermore, in the vicinity of the CP according to nrmsf, in terms of coherent expression, self-similar bifurcation of overall expression occurs to show a unimodal-bimodal transition (Figures 1 and 3A in [6]: MCF-7 cancer cells) and a step function like transition (Figure 3A in [4]: HL-60 cancer cells); these results indicate the existence of cell-type-specific transitions. Thus, since a critical behavior and a critical transition occur at the CP, we can characterize it as a sandpile-type transition.
- (b)
- Scaling-divergent behavior (genomic avalanche) based on the grouping of expression according to nrmsf: a nonlinear correlation trend between the ensemble averages of nrmsf and gene expression at each time point, which has both linear (scaling) and divergent domains in a log-log plot; the onset of divergence occurs at the CP (in cell-differentiation): order (scaling) and disorder (divergence) are balanced at the CP, which presents a genomic avalanche. The scaling-divergent behavior reflects the co-existence of distinct response domains (critical states) in overall expression. Distinct critical behaviors from different averaging behaviors occur (numerically) at around the same nrmsf.
The occurrence of a temporal change in criticality directly affects self-organization in the entire genomic system (Figure 13 in [4]). The genome-state change (cell-fate change in the genome) occurs in such a way that the initial-state SOC control of overall gene expression—the initial-state global gene-expression regulation mechanism is destroyed through the erasure of an initial-state criticality.
Supplementary Materials
The supplementary materials are accessed on www.mdpi.com/1099-4300/19/11/584/s1.
Acknowledgments
Masa Tsuchiya sincerely thanks the Institute for Advanced Biosciences, Keio University, Tsuruoka City, the Yamagata prefectural government, Japan, SEIKO Research Institute (SRI) for Education, Japan, and Fumiaki Kikuchi for allowing him to complete this research project at Keio University. The authors are thankful to Midori Hashimoto for preparing Figures, and Jekaterina Erenpreisa, Mesut Tez and Georgi Gladyshev for fruitful and critical discussions.
Author Contributions
Masa Tsuchiya, Alessandro Giuliani and Kenichi Yoshikawa conceived and designed the project; Masa Tsuchiya investigated the project; Masa Tsuchiya analyzed the data; Masa Tsuchiya and Alessandro Giuliani developed methods; Masa Tsuchiya, Alessandro Giuliani and Kenichi Yoshikawa wrote the paper; Kenichi Yoshikawa supervised the project; Masa Tsuchiya administrated the project.
Conflicts of Interest
The authors declare no conflict of interest.
References
- Reik, W.; Dean, W.; Walter, J. Epigenetic reprogramming in mammalian development. Science 2001, 10, 1089–1093. [Google Scholar] [CrossRef] [PubMed]
- Santos, F.; Dean, W. Epigenetic reprogramming during early development in mammals. Reproduction 2004, 127, 643–651. [Google Scholar] [CrossRef] [PubMed]
- Cantone, I.; Fisher, A.G. Epigenetic programming and reprogramming during development. Nat. Struct. Mol. Biol. 2013, 20, 282–289. [Google Scholar] [CrossRef] [PubMed]
- Tsuchiya, M.; Giuliani, A.; Hashimoto, M.; Erenpreisa, J.; Yoshikawa, K. Self-organizing global gene expression regulated through criticality: Mechanism of the cell-fate change. PLoS ONE 2016, 11, e0167912. [Google Scholar] [CrossRef] [PubMed]
- Tsuchiya, M.; Hashimoto, M.; Takenaka, Y.; Motoike, I.N.; Yoshikawa, K. Global genetic response in a cancer cell: Self-organized coherent expression dynamics. PLoS ONE 2014, 9, e97411. [Google Scholar] [CrossRef] [PubMed]
- Tsuchiya, M.; Giuliani, A.; Hashimoto, M.; Erenpreisa, J.; Yoshikawa, K. Emergent Self-Organized Criticality in gene expression dynamics: Temporal development of global phase transition revealed in a cancer cell line. PLoS ONE 2015, 11, e0128565. [Google Scholar] [CrossRef] [PubMed]
- Hollerbach, R.; Kim, E. Information Geometry of Non-Equilibrium Processes in a Bistable System with a Cubic Damping. Entropy 2017, 19, 268. [Google Scholar] [CrossRef]
- Censi, F.; Giuliani, A.; Bartolini, P.; Calcagnini, G. A multiscale graph theoretical approach to gene regulation networks: A case study in atrial fibrillation. IEEE Trans. Biomed. Eng. 2011, 58, 2943–2946. [Google Scholar] [CrossRef] [PubMed]
- Tsuchiya, M.; Selvarajoo, K.; Piras, V.; Tomita, M.; Giuliani, A. Local and global responses in complex gene regulation networks. Physica A 2009, 388, 1738–1746. [Google Scholar] [CrossRef]
- Scheffer, M.; Carpenter, S.R.; Lenton, T.M.; Bascompte, J.; Brock, W.; Dakos, V.; van de Koppe, J.; van de Leemput, I.A.; Levin, S.A.; van Nes, E.H.; et al. Anticipating critical transitions. Science 2012, 338, 344–348. [Google Scholar] [CrossRef] [PubMed] [Green Version]
- Anderson, P.W. More is different. Science 1972, 177, 393–396. [Google Scholar] [CrossRef] [PubMed]
- Laughlin, R.B.; Pines, D.; Schmalian, J.; Stojković, B.P.; Wolynes, P. The middle way. Proc. Natl. Acad. Sci. USA 2000, 97, 32–37. [Google Scholar] [CrossRef] [PubMed]
- Giuliani, A.; Tsuchiya, M.; Yoshikawa, K. Single-cell genome dynamics in early embryo development: A statistical thermodynamics approach. bioRxiv 2017. Available online: https://www.biorxiv.org/content/early/2017/04/13/123554 (accessed on 02 November 2017). [CrossRef]
- Mirny, L.A. The fractal globule as a model of chromatin architecture in the cell. Chromosome Res. 2011, 19, 37–51. [Google Scholar] [CrossRef] [PubMed] [Green Version]
- Lieberman-Aiden, E.; van Berkum, N.L.; Williams, L.; Imakaev, M.; Ragoczy, T.; Telling, A.; Amit, I.; Lajoie, B.R.; Sabo, P.J.; Dorschner, M.O.; et al. Comprehensive mapping of long-range interactions reveals folding principles of the human genome. Science 2009, 326, 289–293. [Google Scholar] [CrossRef] [PubMed]
- Deng, Q.; Ramsköld, D.; Reinius, B.; Sandberg, R. Single-cell RNA-seq reveals dynamic, random monoallelic gene expression in mammalian cells. Science 2014, 343, 193–196. [Google Scholar] [CrossRef] [PubMed]
- Marković, D.; Gros, C. Power laws and self-organized criticality in theory and nature. Phys. Rep. 2014, 536, 41–74. [Google Scholar] [CrossRef]
- Tomita, K.; Tomita, H. Irreversible Circulation of Fluctuation. Prog. Theor. Phys. 1974, 51, 1731–1749. [Google Scholar] [CrossRef]
- Tsuchiya, M.; Wong, S.T.; Yeo, Z.X.; Colosimo, A.; Palumbo, M.C.; Farina, L.; Crescenzi, M.; Mazzola, A.; Negri, R.; Bianchi, M.M.; et al. Gene expression waves: Cell cycle independent collective dynamics in cultured cells. FEBS J. 2007, 274, 2874–2886. [Google Scholar] [CrossRef] [PubMed]
- Einstein, A.; Schilpp, P.A. Autobiographical Notes; Open Court Publishing Company: Chicago, IL, USA, 1949. [Google Scholar]
- Nagashima, T.; Shimodaira, H.; Ide, K.; Nakakuki, T.; Tani, Y.; Takahashi, K.; Yumoto, N.; Hatakeyama, M. Quantitative transcriptional control of ErbB receptor signaling undergoes graded to biphasic response for cell differentiation. J. Biol. Chem. 2007, 282, 4045–4056. [Google Scholar] [CrossRef] [PubMed]
- Mojtahedi, M.; Skupin, A.; Zhou, J.; Castaño, I.G.; Leong-Quong, R.Y.Y.; Chang, H.; Trachana, K.; Giuliani, A.; Huang, S. Cell Fate Decision as High-Dimensional Critical State Transition. PLoS Biol. 2016, 14, e2000640. [Google Scholar] [CrossRef] [PubMed]
- Moris, N.; Pina, C.; Arias, A.M. Transition states and cell fate decisions in epigenetic landscapes. Nat. Rev. Genet. 2016, 17, 693–703. [Google Scholar] [CrossRef] [PubMed]
- Yan, L.; Yang, M.; Guo, H.; Yang, L.; Wu, J.; Li, R.; Liu, P.; Lian, Y.; Zheng, X.; Yan, J.; et al. Single-cell RNA-Seq profiling of human preimplantation embryos and embryonic stem cells. Nat. Struct. Mol. Biol. 2013, 20, 1131–1139. [Google Scholar] [CrossRef] [PubMed]
- Ciofani, M.; Madar, A.; Galan, C.; Sellars, M.; Mace, K.; Pauli, F.; Agarwal, A.; Huang, W.; Parkhurst, C.N.; Muratet, M.; et al. A validated regulatory network for Th17 cell specification. Cell 2012, 151, 289–303. [Google Scholar] [CrossRef] [PubMed]
- Knapp, T.R. Bimodality Revisited. J. Mod. Appl. Stat. Methods 2007, 6. [Google Scholar] [CrossRef]
- Kim, K.Y.; Wang, J. Potential energy landscape and robustness of a gene regulatory network: Toggle switch. PLoS Comp. Biol. 2007, 3, e60. [Google Scholar] [CrossRef] [PubMed]
Figure 1.
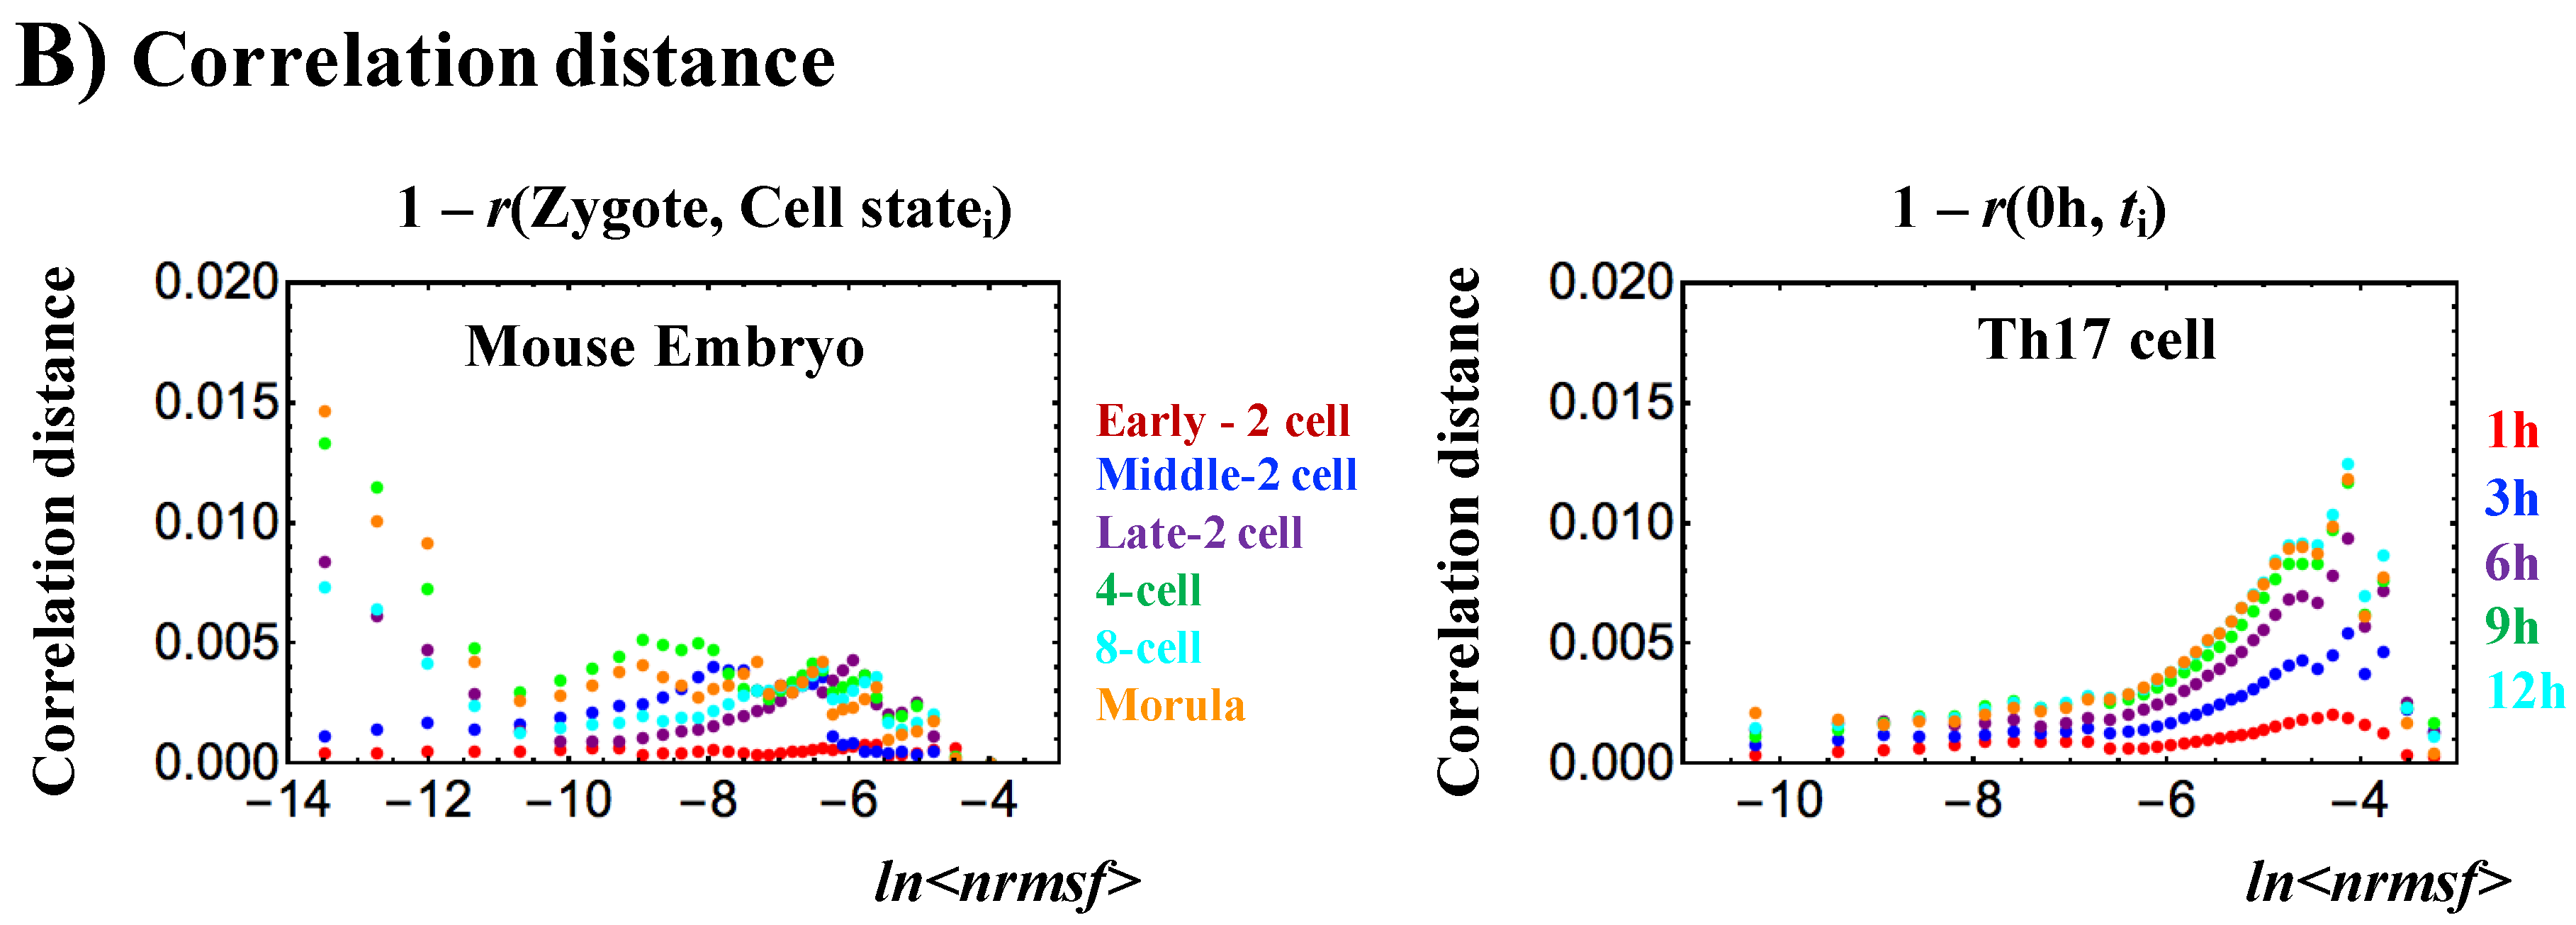
Opposite genome avalanche behaviors in early embryo development and immune cell differentiation: (A) Genome avalanches, scaling-divergent behaviors in overall expression, as important features of the SOC control of overall expression are evident in the log-log plot of average behaviors: (left panel: mouse (first row) and human (second) embryo development; right panel; Th17 (first) and Th0 (second) terminal cell differentiation). Log-log plots represent the natural logarithm of the group average (< >) of expression (x-axis) and nrmsf (y-axis) (n = 685 (mouse), 666 (human), 525 (Th17) and 504 RNAs (Th0) for each dot), where overall expression is sorted and grouped (25 groups) according to the degree of nrmsf (normalized root mean square fluctuation: see Methods). Two distinct biological processes (reprogramming in early embryo development versus immune cell differentiation) show opposite scaling-divergent behaviors. Scaling behavior occurs in the ensemble of high-variance RNA expression (high region of nrmsf: super-critical state; see Figure 3A) in early embryo development and divergent behavior occurs in the ensemble of low-variance RNA expression (low region of nrmsf: sub-critical state), whereas the T cell terminal cell fate (single cell) has opposite behaviors; (B) Correlation distances: The correlation distance is expressed as (1 − r), where r is the Pearson correlation coefficient between the gene-expression profiles in the zygote and other development states. (left panel: mouse embryo), and between t = 0 and other time points (tj) (right: Th17 cell). This distance corresponds to the relative change in the expression profile on the whole-genome scale and is computed separately for different critical states. The result supports the notion that there is a difference in scaling-divergent behaviors between embryo development and cell differentiation: in mouse embryo, correlation behaviors significantly change at low nrmsf, whereas in terminal Th17 cell, significant change occurs at high nrmsf.
Figure 1.
Opposite genome avalanche behaviors in early embryo development and immune cell differentiation: (A) Genome avalanches, scaling-divergent behaviors in overall expression, as important features of the SOC control of overall expression are evident in the log-log plot of average behaviors: (left panel: mouse (first row) and human (second) embryo development; right panel; Th17 (first) and Th0 (second) terminal cell differentiation). Log-log plots represent the natural logarithm of the group average (< >) of expression (x-axis) and nrmsf (y-axis) (n = 685 (mouse), 666 (human), 525 (Th17) and 504 RNAs (Th0) for each dot), where overall expression is sorted and grouped (25 groups) according to the degree of nrmsf (normalized root mean square fluctuation: see Methods). Two distinct biological processes (reprogramming in early embryo development versus immune cell differentiation) show opposite scaling-divergent behaviors. Scaling behavior occurs in the ensemble of high-variance RNA expression (high region of nrmsf: super-critical state; see Figure 3A) in early embryo development and divergent behavior occurs in the ensemble of low-variance RNA expression (low region of nrmsf: sub-critical state), whereas the T cell terminal cell fate (single cell) has opposite behaviors; (B) Correlation distances: The correlation distance is expressed as (1 − r), where r is the Pearson correlation coefficient between the gene-expression profiles in the zygote and other development states. (left panel: mouse embryo), and between t = 0 and other time points (tj) (right: Th17 cell). This distance corresponds to the relative change in the expression profile on the whole-genome scale and is computed separately for different critical states. The result supports the notion that there is a difference in scaling-divergent behaviors between embryo development and cell differentiation: in mouse embryo, correlation behaviors significantly change at low nrmsf, whereas in terminal Th17 cell, significant change occurs at high nrmsf.


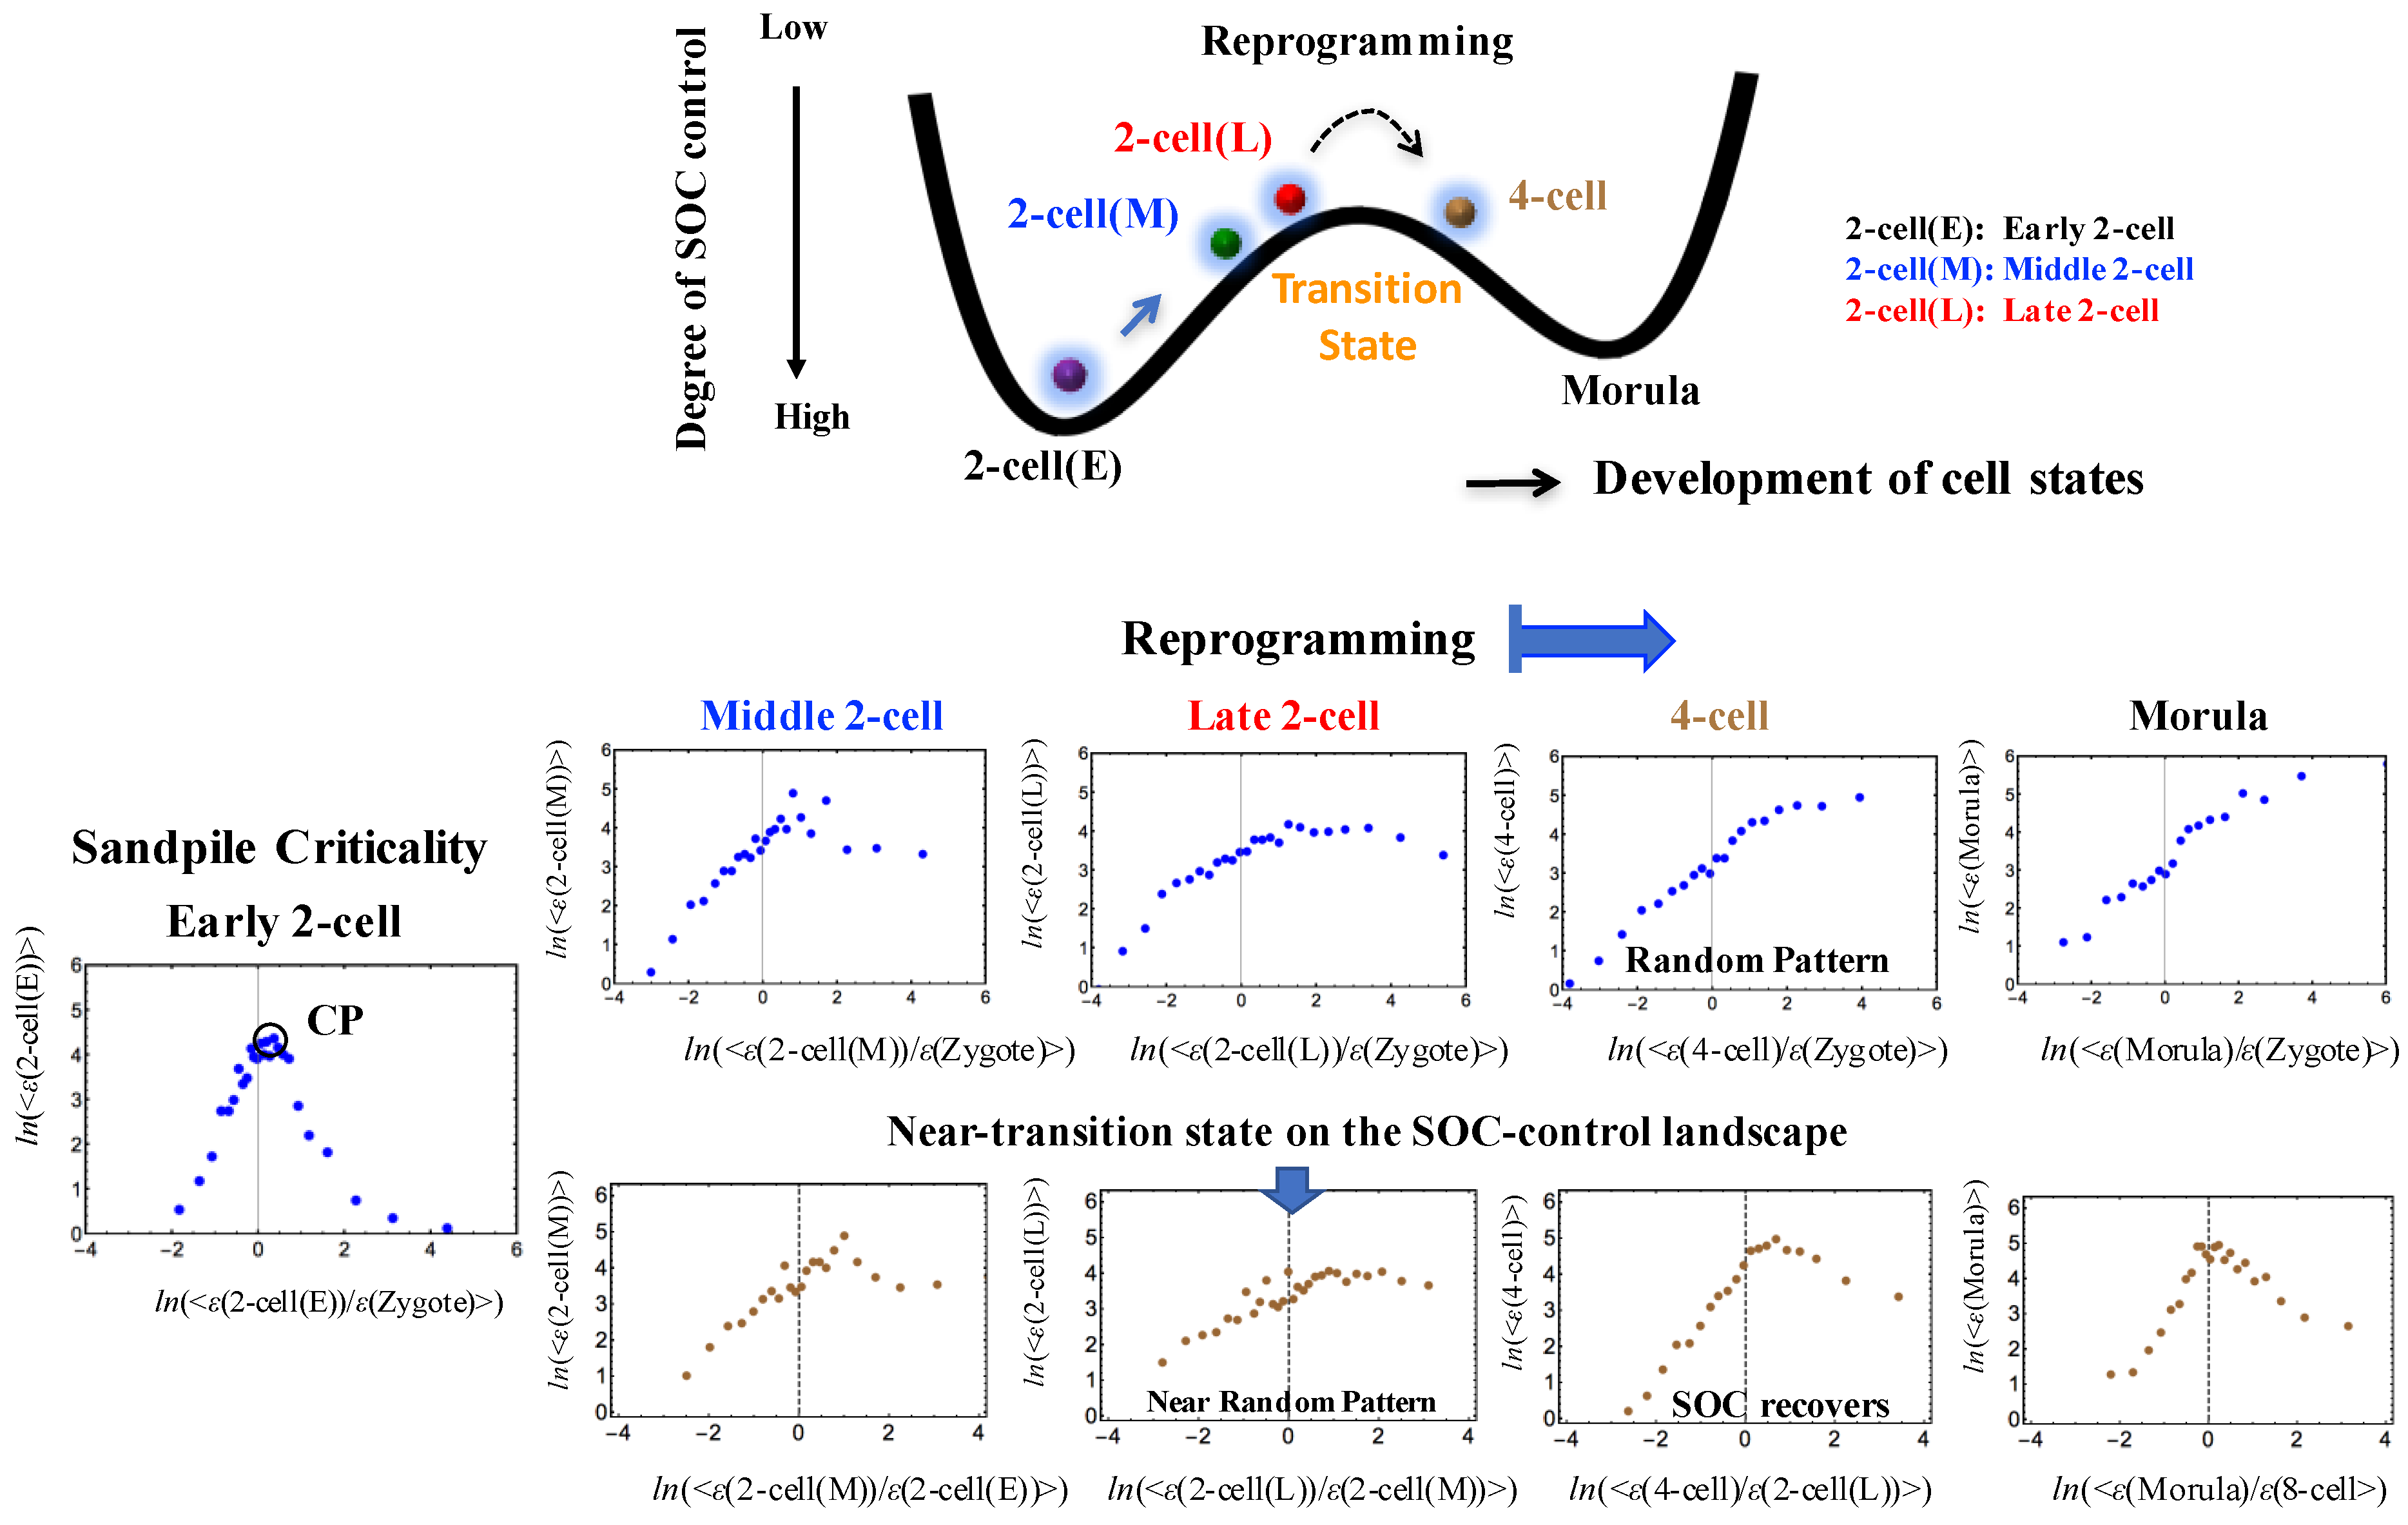
Figure 2.
Timing of genome-state change on the SOC-control landscape through a transition state in a single cell: The timing of the genome-state change was revealed in the erasure of sandpile-type criticality of the zygote state. The erasure of zygote criticality (second row) occurs after the late 2-cell state to reveal a stochastic expression pattern as a linear correlative behavior. The transition of SOC control through non-SOC control (stochastic pattern) shows an SOC-control landscape: a valley (SOC control: zygote - early 2-cell states) - ridge (non SOC control: middle - late 2-cell states) - valley (SOC control: 8-cell - morula states); a high degree of SOC control for a well-developed shape of the sandpile-type criticality, an intermediate degree of SOC control for a weakened (broken) sandpile, and a low degree for non-SOC control. At the middle - late 2-cell states (third row), sandpile-type criticality almost disappears and recovers thereafter; this indicates the existence of a transition state in the SOC control landscape (see the detailed mechanism in Figure 7). Sandpile-type critical behaviors, which exhibit diverging up- and down-regulation at a critical point (CP: ln<nrmsf> ~ − 5.5), emerge in overall expression sorted and grouped according to the fold-change in expression (see stochastic resonance in [6]). Each group (net 25 groups) contains n = 685 RNAs. The x- and y-axes show the natural logarithm of the fold-change in each group average of RNA expression between the si and sj states (ith and jth cell states; Methods) represented by ln(<ε(si)/ε(sj)>) and of RNA expression (ln(<ε(si)>)), respectively.

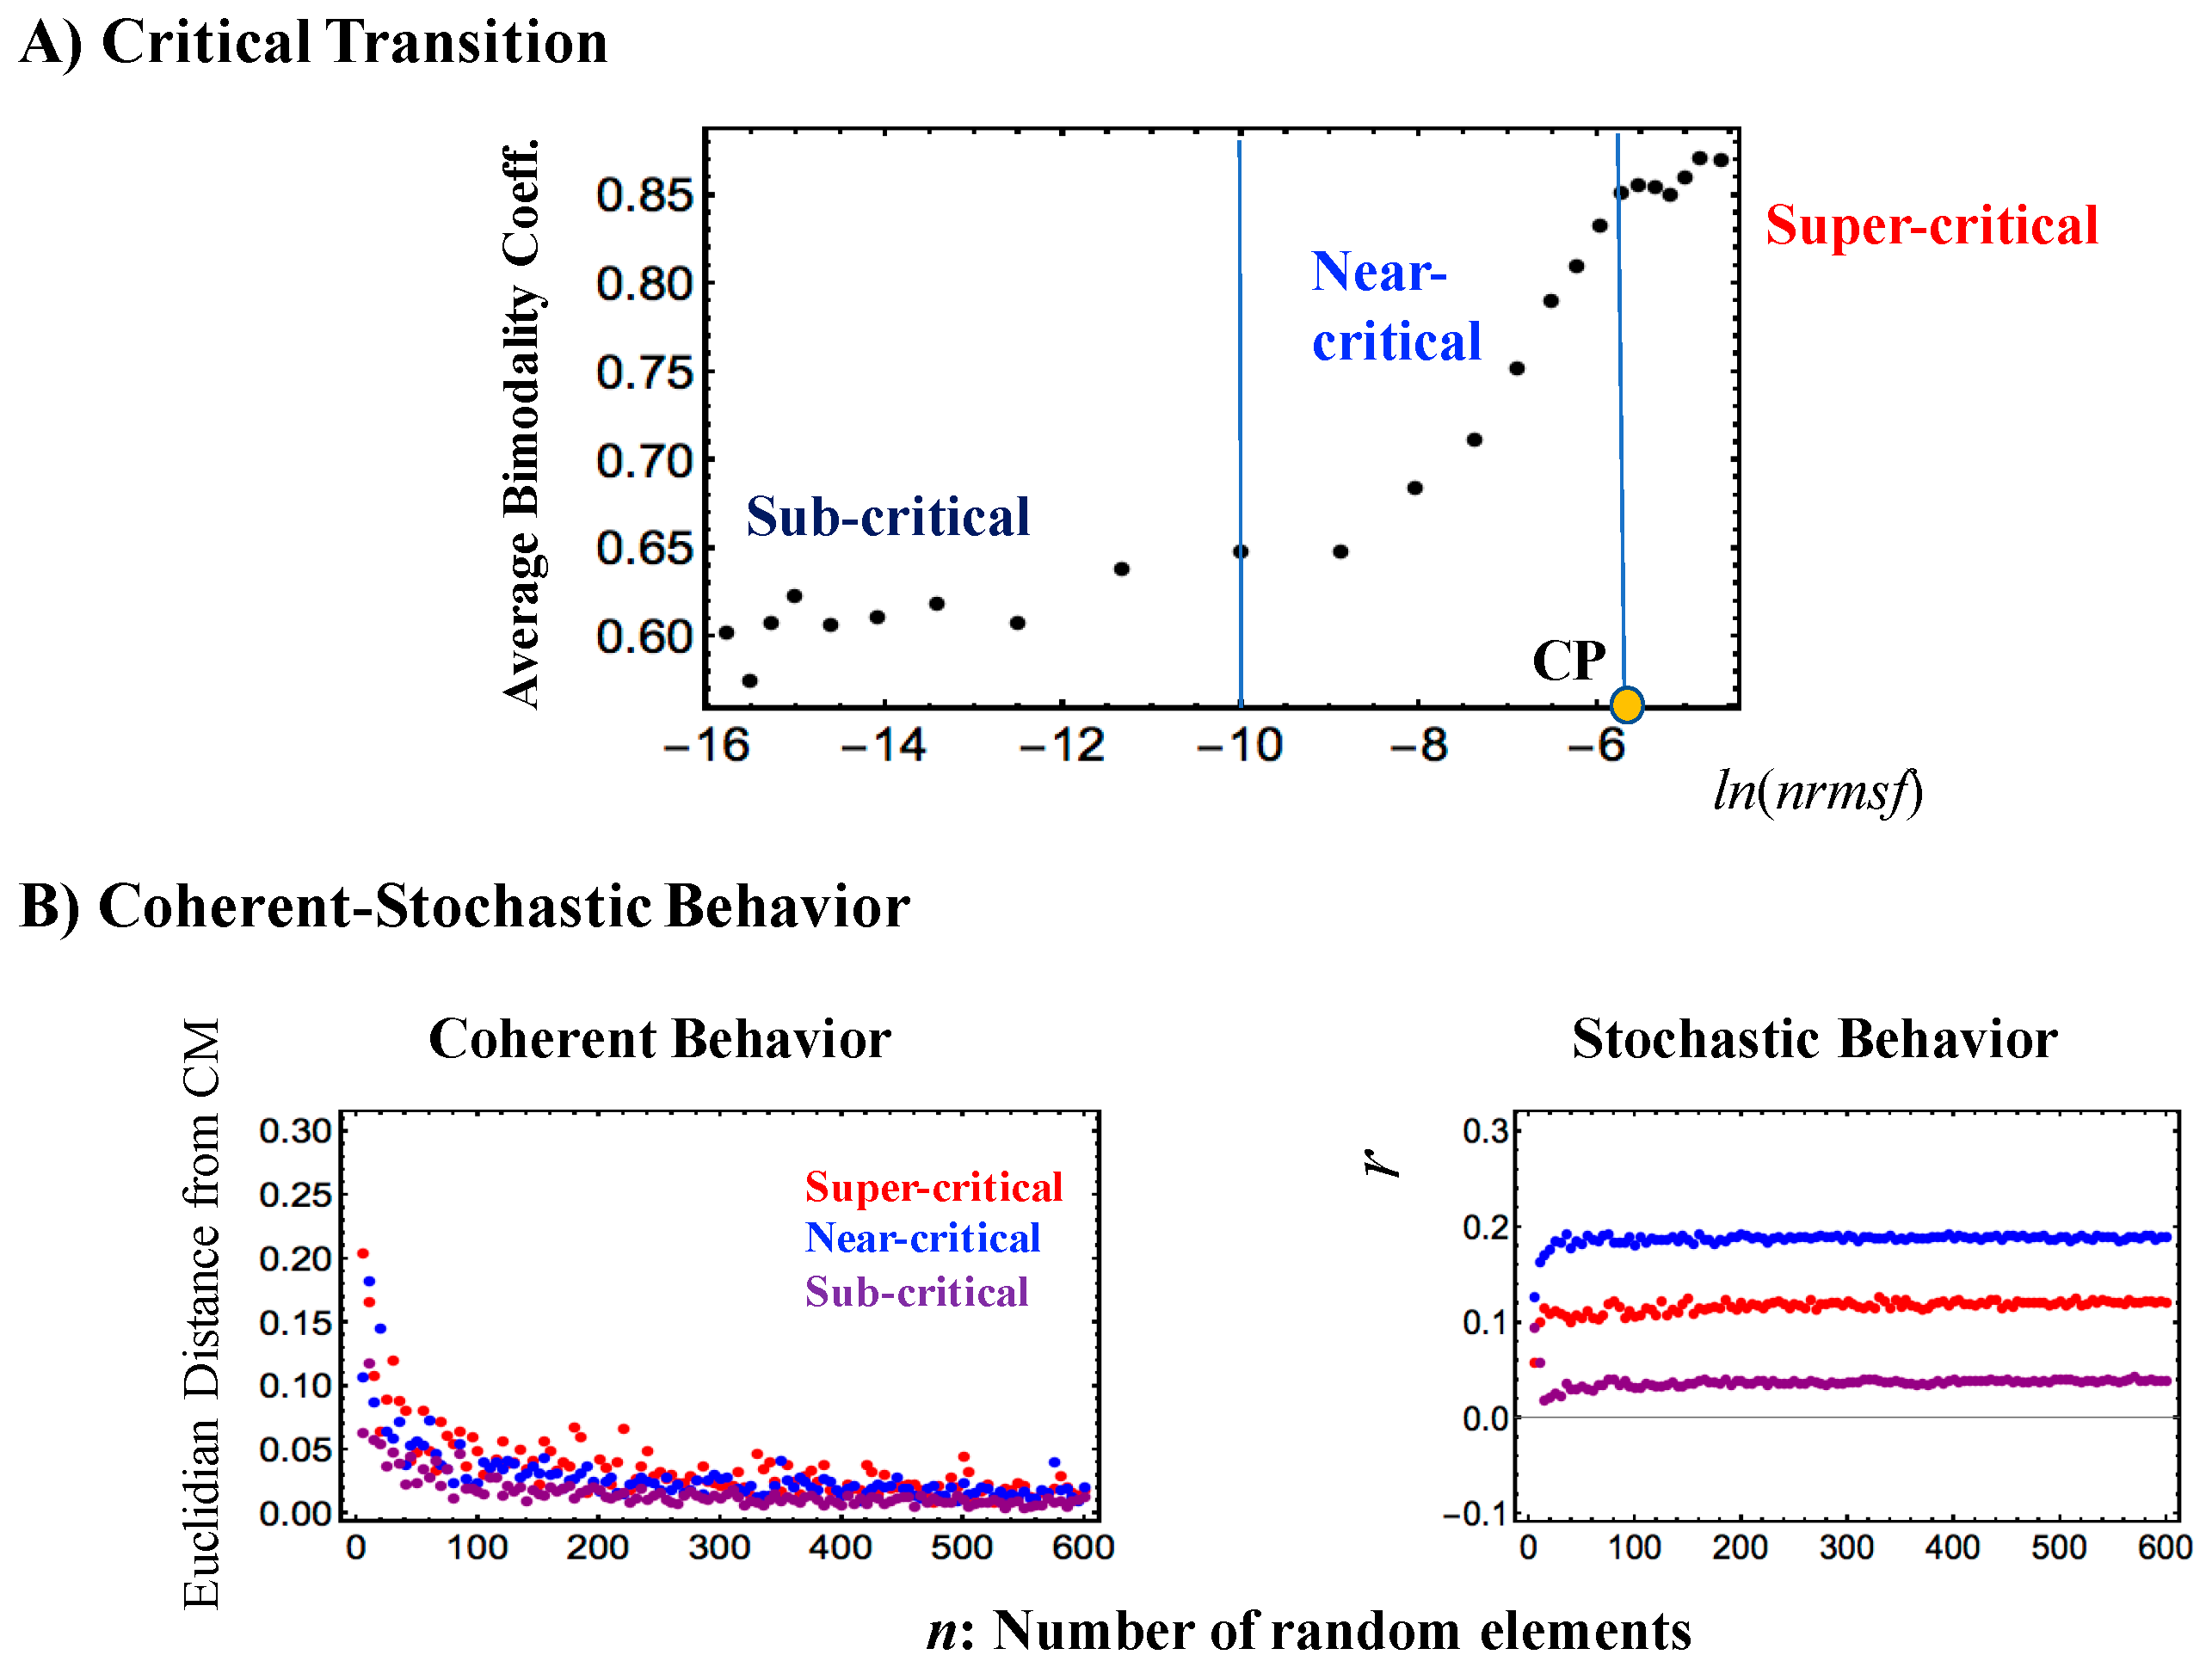
Figure 3.
Critical states and their coherent stochastic behaviors (mouse embryo): (A) Estimation of the bimodality coefficients (averaged over all cell states) according to nrmsf. Overall RNA expression is sorted and grouped according to the degree of nrmsf. The nrmsf grouping is made at a given sequence of discrete values of nrmsf (xi: integer and integer + 0.5 from −15 to −4) with a fixed range (xi − 0.5 < xi < xi + 0.5). The corresponding average of Sarle’s bimodality coefficient (Methods) over the number of cell states is evaluated. The result exhibits a transitional behavior to distinguish (averaged) critical states with respect to the value of ln<nrmsf>: sub-critical state (N = 4913 RNAs) < −8.8; −8.8 < near-critical state (N = 9180) < −5.4; −5.4 < super-critical state (N = 3408), where < > indicates the ensemble average of the nrmsf grouping. A critical point (CP: summit of sandpile criticality) exists around the edge between the near- and super-critical states, where the CP corresponds to a tipping point around ln<nrmsf> ~ −5.5 (see also Figure 2 and Figure 4); (B) Coherent stochastic behaviors are revealed: stochastic expression within a critical state (right panel) is confirmed by the low Pearson correlation of ensembles of RNA expression between samples randomly selected from a critical state (averaged over the number of cell states with 200 repeats). The degree of stochasticity further supports the existence of distinct critical states. In the left panel, the Euclidian distance (averaged over 200 repeats and the number of cell states) of the center of mass (CM) of samples randomly selected from each critical state converges to the CM of the whole critical state (y = 0), which shows that the CM of a critical state (see the definition of CM in Section 2.1.2) represents its coherent dynamics that emerge in the ensemble of stochastic expression (refer to Figure 6 in [6]); (C) Center of mass (CM) dynamics (baseline: time average value) reveals anti-phase between super- and sub-critical states and sequential global perturbations occur at the middle–late 2-cell states (activation → inhibition: sub-critical state vs. inhibition → activation: super-critical state) and at the late 2-cell–4-cell states (inhibition → activation: sub-critical state vs. activation → inhibition: super-critical state); (D) Stochastic expressions of the super-critical expression (randomly selected 200 RNAs for mouse embryo) are mixed into stochastic expression of the sub-critical state (4913 RNAs). The Euclidian distance of the CM of a randomly selected expression (n) from the mixed ensemble (brown dots) expressions (averaged over 200 repetitions) does not converge to the CM of the sub-critical state, due to the anti-phase coherent behavior of the super-critical state.

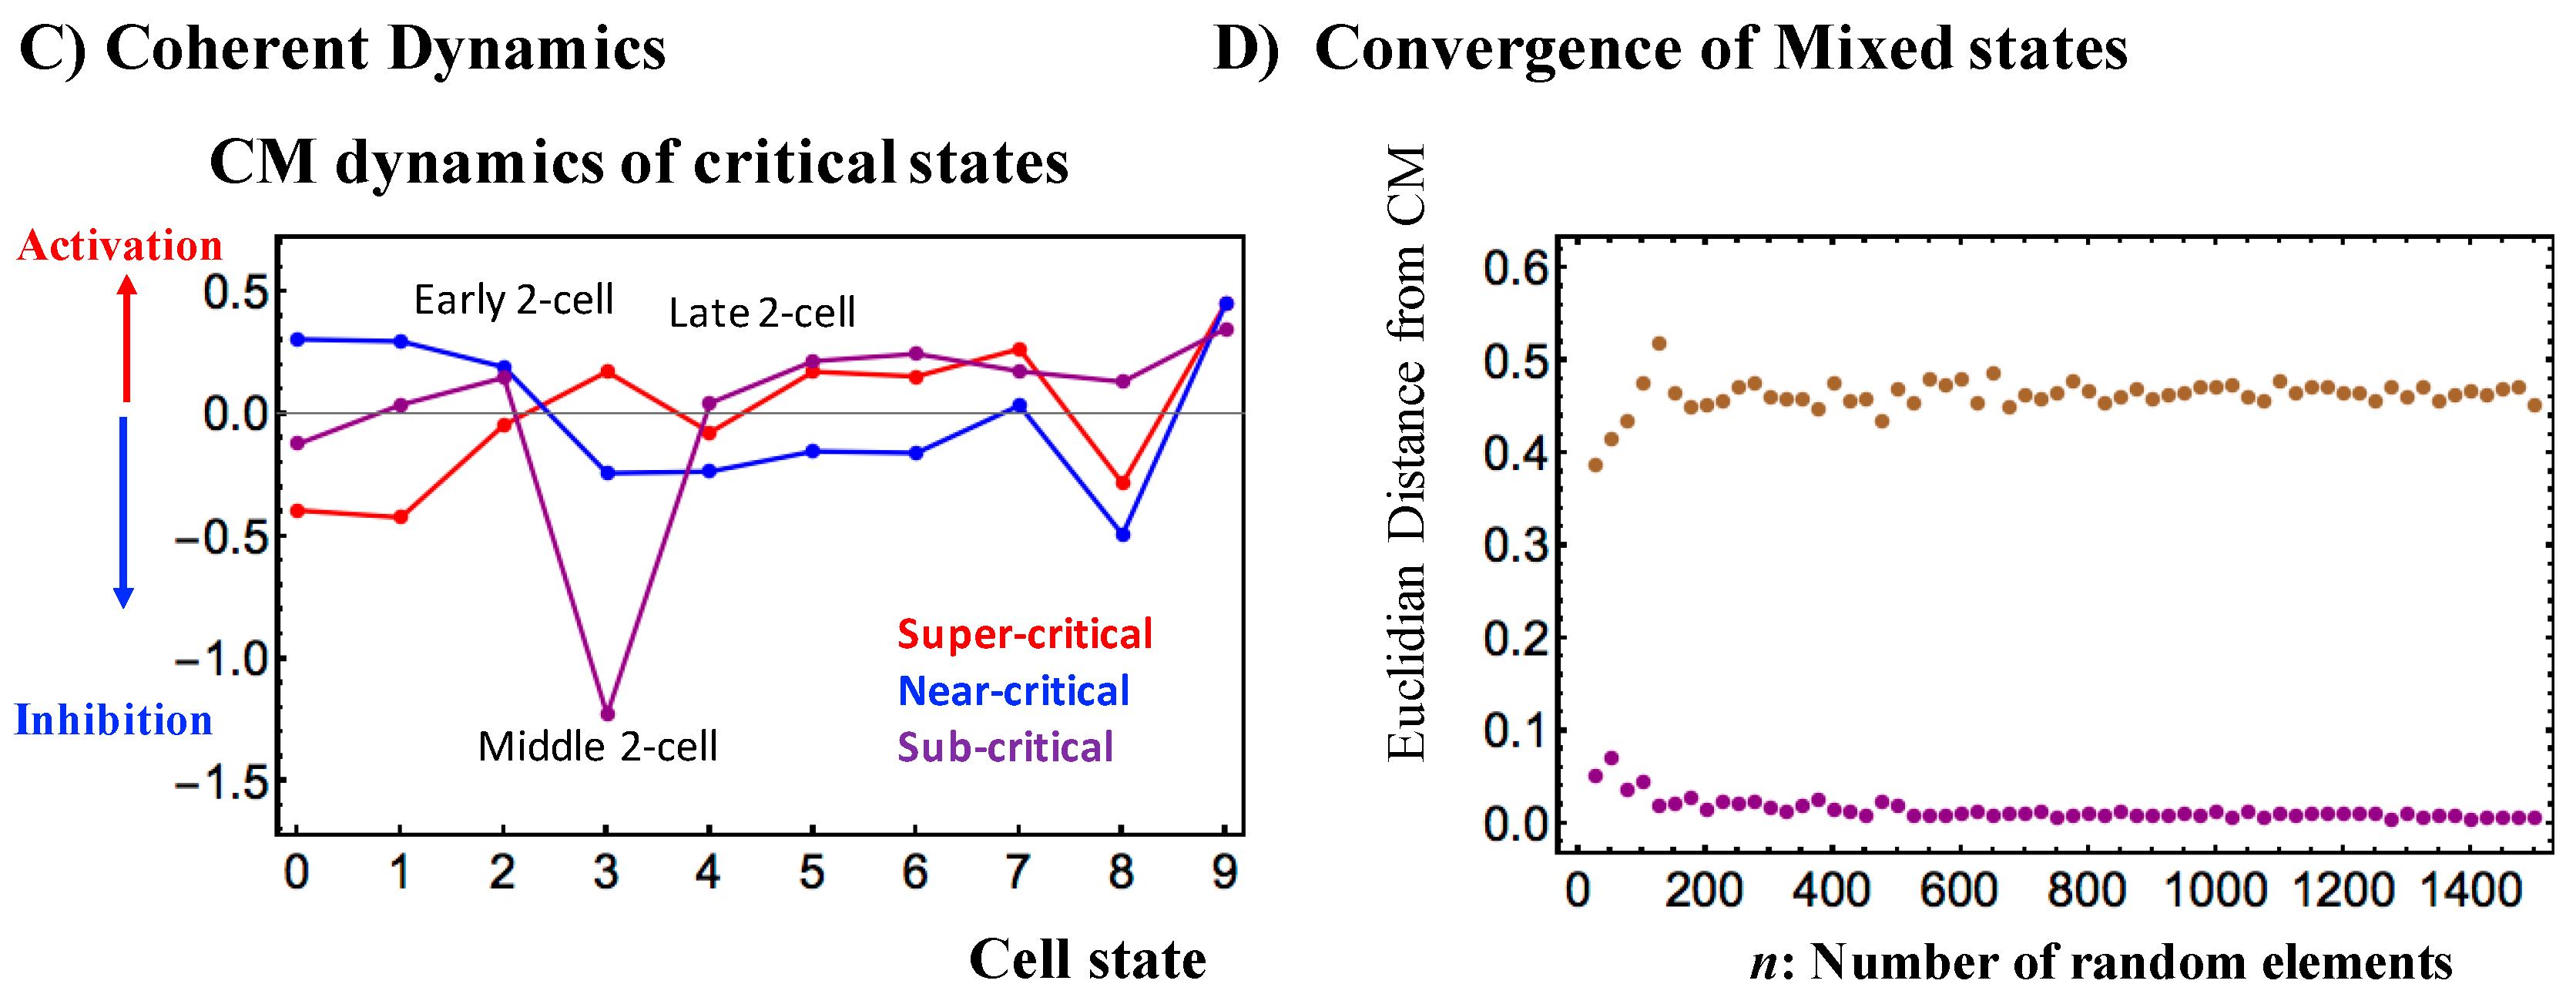
Figure 4.
Existence of a fixed critical point in early mouse embryo development: Linear regressions in scaling regions show (A) Linear Regression of ln<expression> vs. ln<nrmsf> (upper row): divergent behaviors occur at low level of temporal expression for a single mouse embryo cell, and (B) at a high level of temporal expression for a single Th17 cell, where divergence begins to occur at around ln<nrmsf> ~ − 6.0 (see also Figure 1B); (C) Intersection of linear regressions (lower row): Single mouse embryo cell expressions intersect at around ln<nrmsf> = −5.5~− 6.0. This may suggest the existence of near-fixed critical point (CP: Figure 2 and Figure 3A).
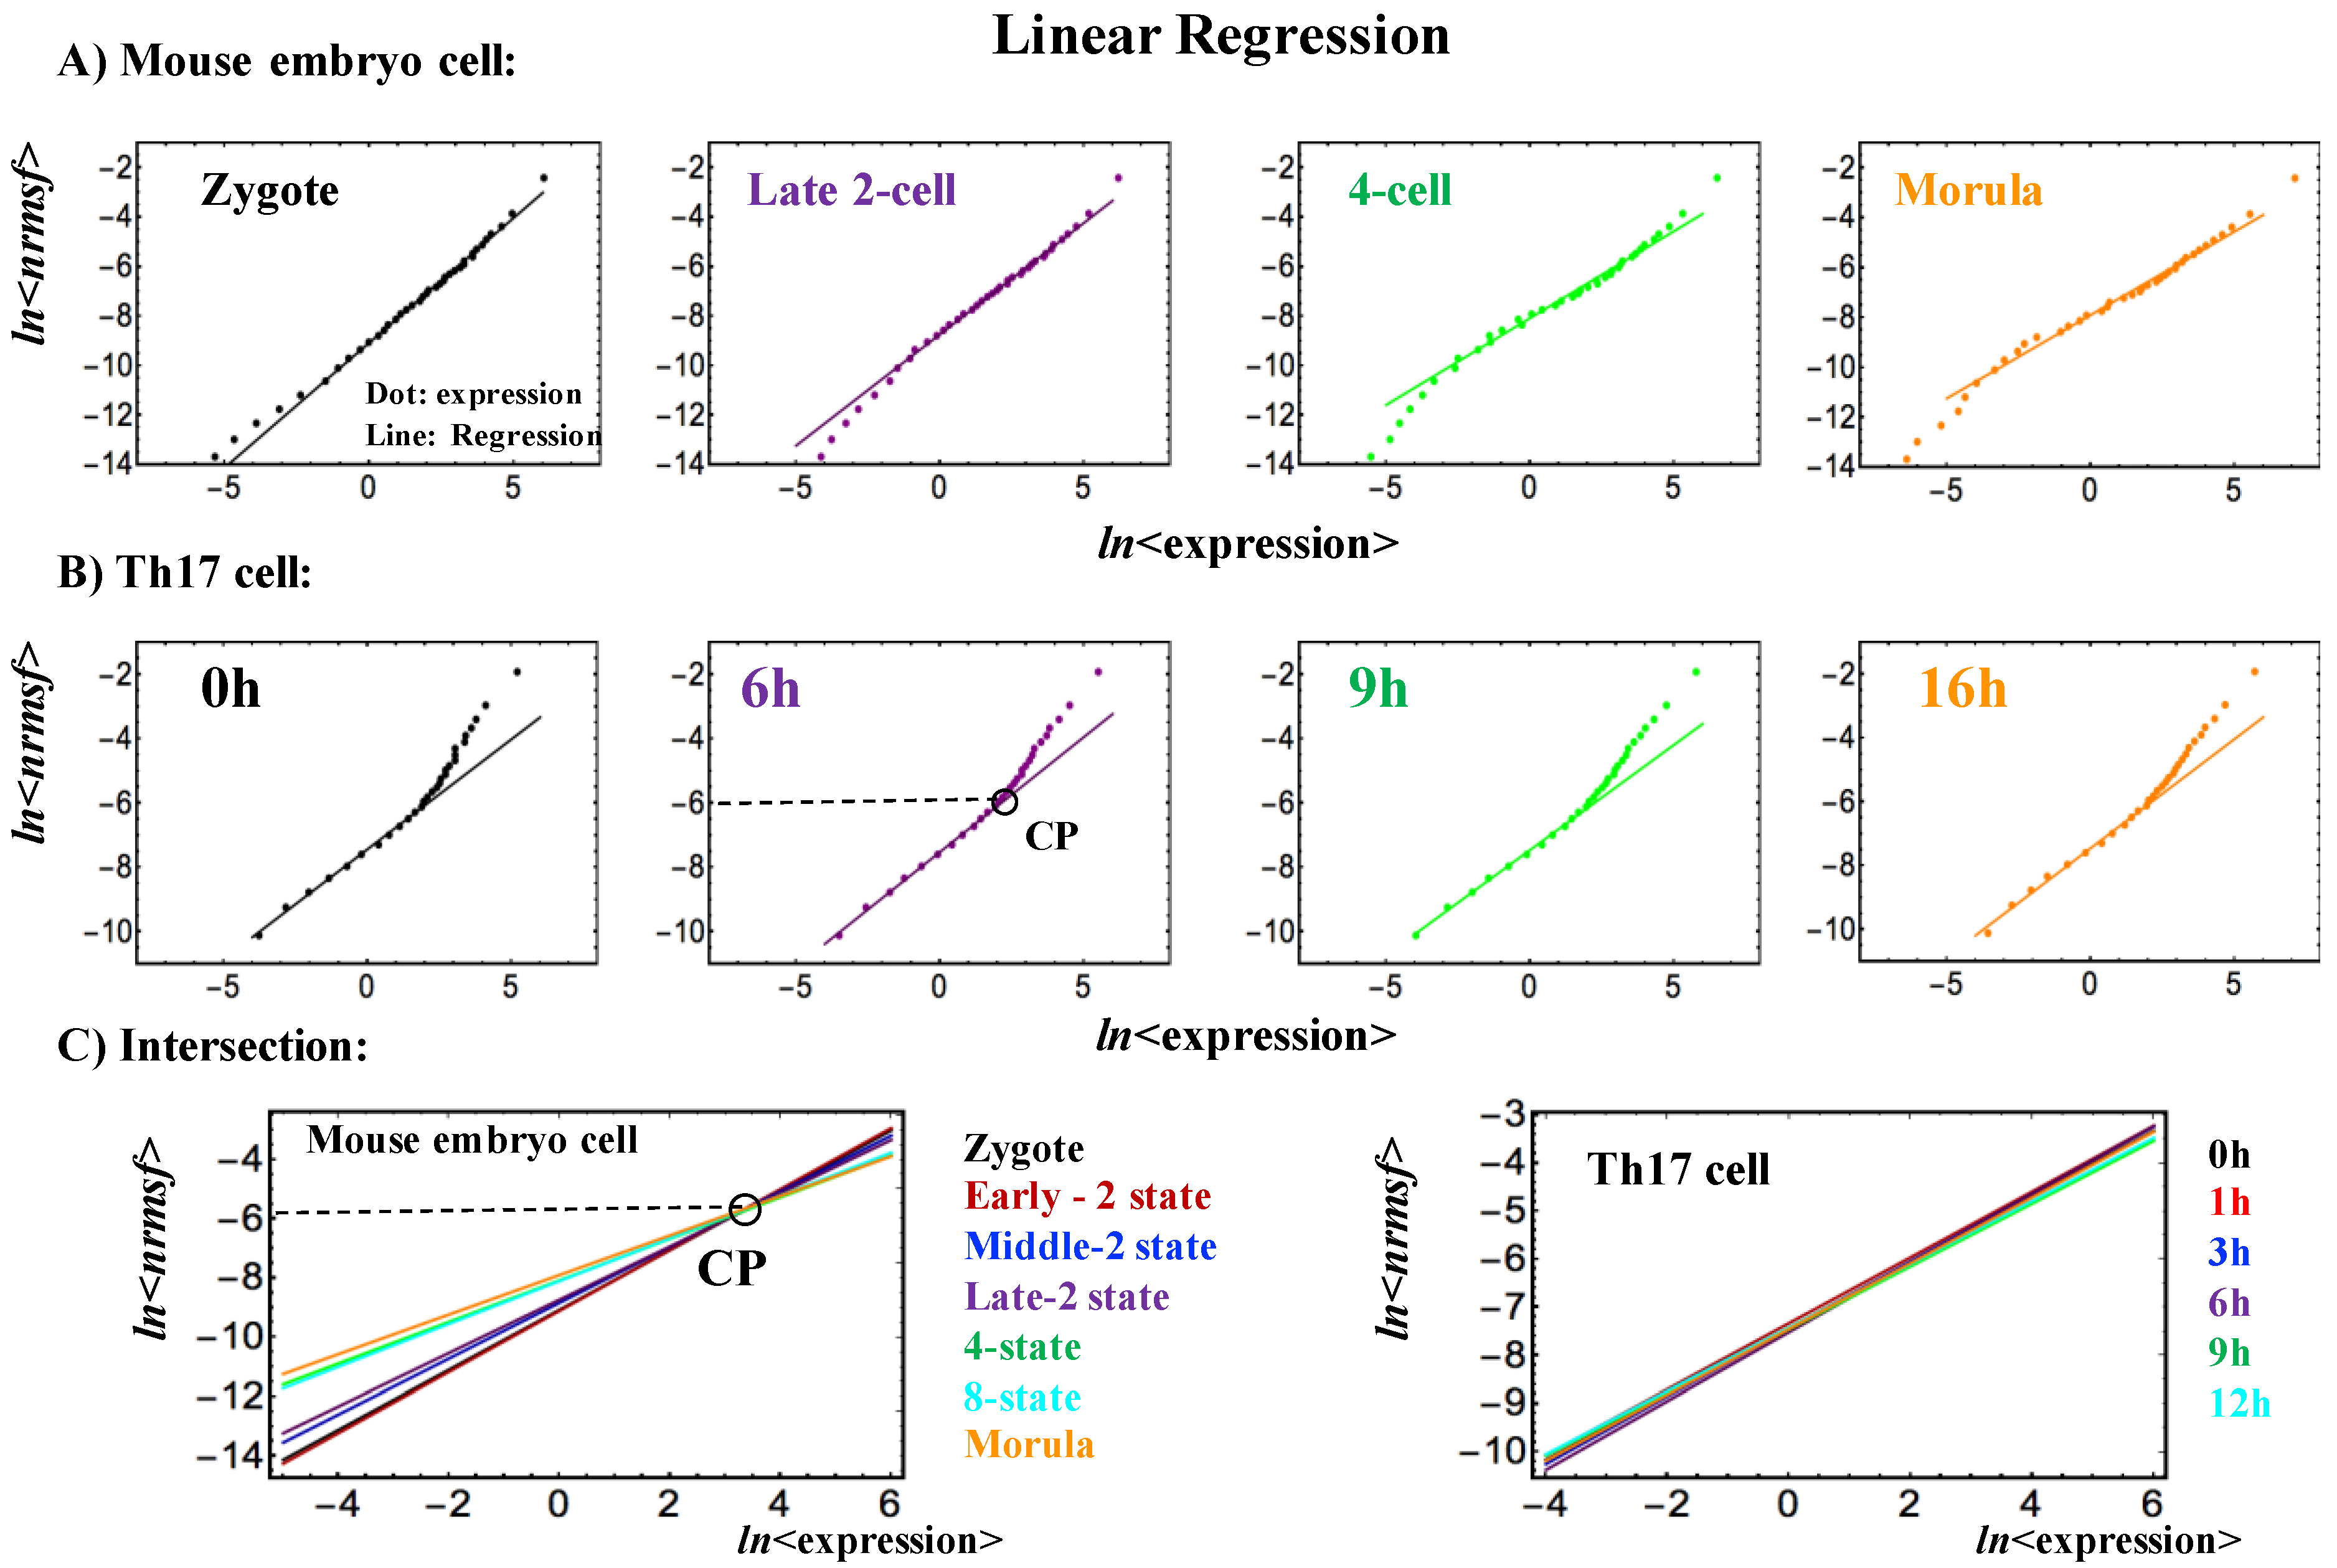
Figure 5.
Flux dynamics among interacting critical states (mouse embryo): (A) The net self-flux dynamics (net effective force acting on CM) follow the dynamics of the up- or down-regulated CM, where the sign of the net self-flux (i.e., IN and OUT) corresponds to activation (up-regulated flux) for positive responses and inactivation (down-regulated flux) for negative responses. The net self-fluxes of critical states (red: super-critical; blue: near-critical; purple: sub-critical) and the dynamics of the CM of critical states (black lines) are evaluated from their time averages. The x-axis represents the development of cell states and the y-axis represents net self-fluxes (black) and their CM dynamics (color); (B) The flux dynamics through crosstalk with the environment. Interaction flux dynamics i <= j (or i => j; color based on that of the jth critical state) represent the interaction flux from the jth critical state to the ith critical state or vice versa. The results show how global perturbations occur to guide genome reprogramming after the late 2-cell state (2nd point), based on the activity of the near-critical state and sub-critical state before and after reprogramming (see more clearly in Figure 7); (C) The change in the net kinetic energy flux (see Equation (4)) shows that sequential global perturbations from OUT to IN flux occur at the middle 2-cell–4-cell states in the sub-critical state, as in the coherent dynamics of critical states (Figure 3C); (D) The interaction dynamics reveal that the expression dynamics of the sub-critical state (the generator of perturbation) are determined by the net interaction flux between the near- and sub-critical states, and the dynamics of the super-critical state are determined by its interaction flux from the near-critical state (super- to near-critical interaction). This image shows how the critical dynamics (temporal change in criticality exists at the boundary of the near- and sub-critical states) affect the entire genome-expression system, since the sub-critical state generates autonomous SOC control of overall expression (see more in Section 2.1.4).
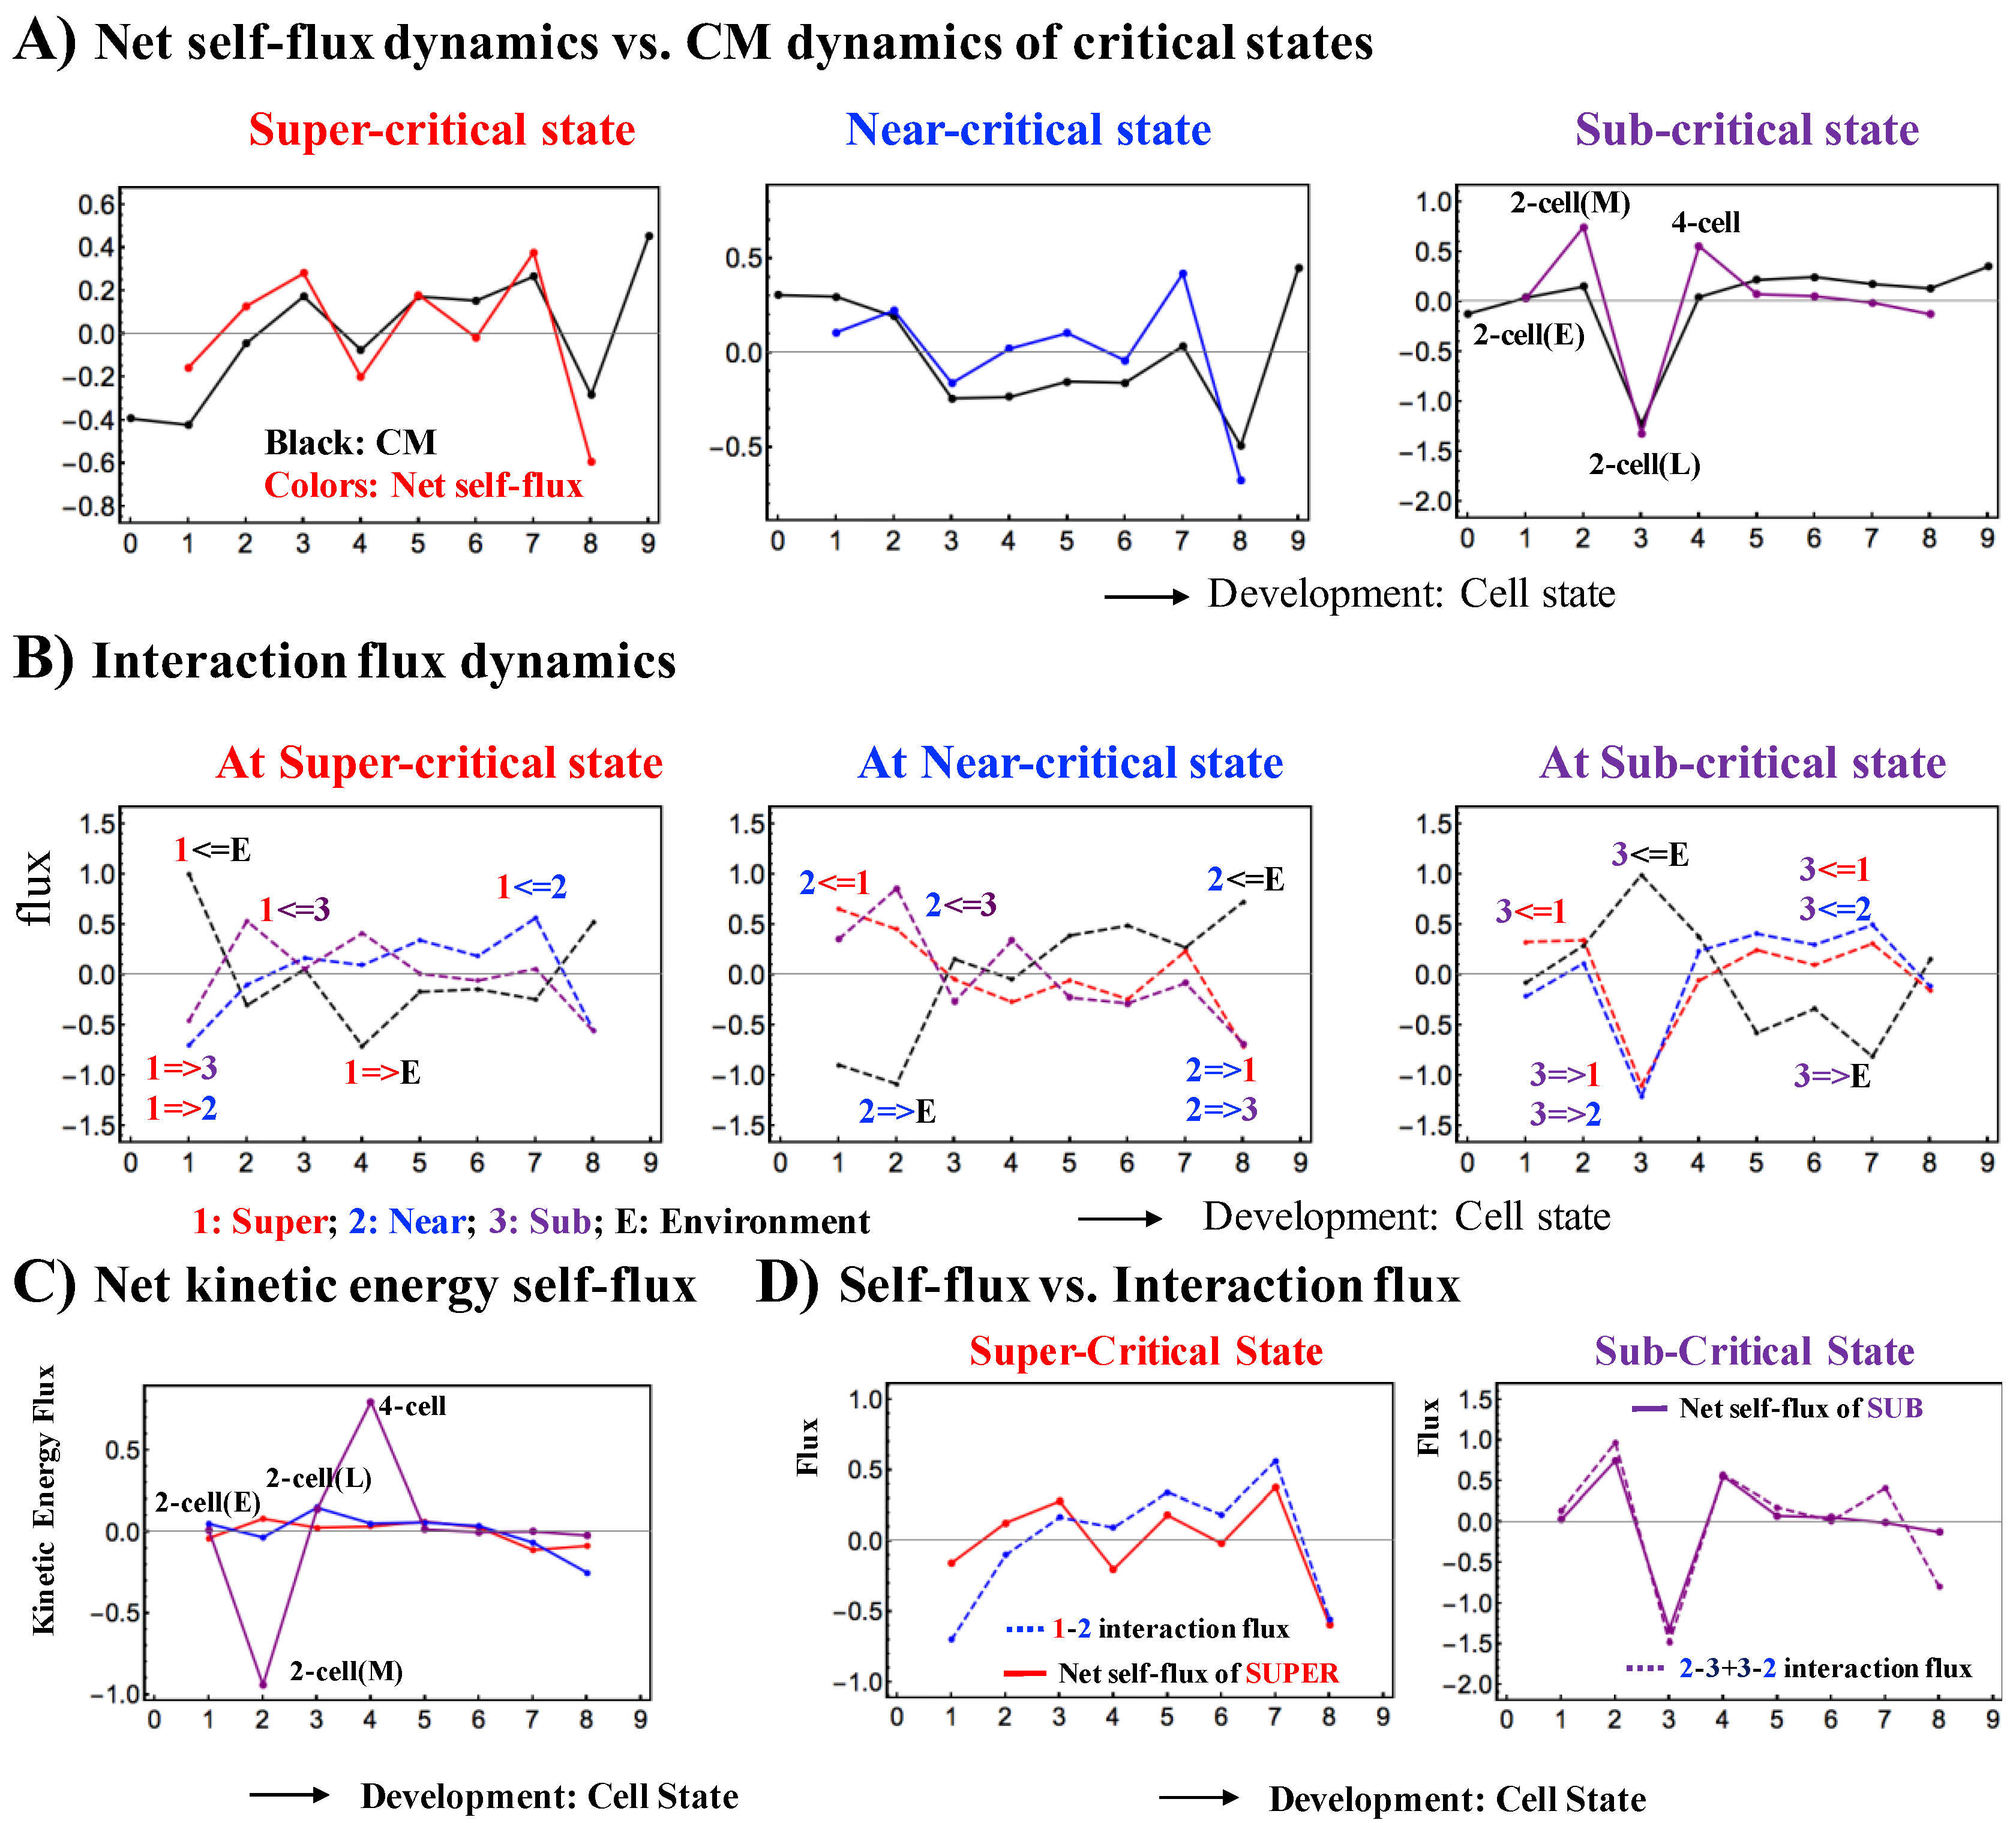
Figure 6.
Scheme of SOC-control through the average expression flux in mouse embryo development: The average expression flux network in the mouse embryo genome system reveals that a sub-critical state acts as an internal “source”, where IN flux from the environment (shaded blue) is distributed to other critical states. In contrast, a super-critical state acts as an internal “sink” that receives IN fluxes from other critical states, and the same amount of expression flux is sent to the environment, due to the average flux balance (an example is shown at the sub-critical state). Two cyclic fluxes (Near-Super and Sub-Super) through the environment are seen. Sub-Super cyclic flux forms a dominant flux flow, which generates strong coupling between the super- and sub-critical states accompanied by their anti-phase expression dynamics [6], makes its change in oscillatory feedback, and thus sustains autonomous SOC control of overall gene expression. This formation of a dominant cyclic flux with a source and sink provides a universal genome-engine metaphor of SOC control mechanisms, as in terminal cell fates (refer to the Discussion in [4]). Numerals represent average net flux values, where the average net interaction flux of the super-critical state to the environment (black arrow) is decomposed into two parts for the flux-balance at other critical states.
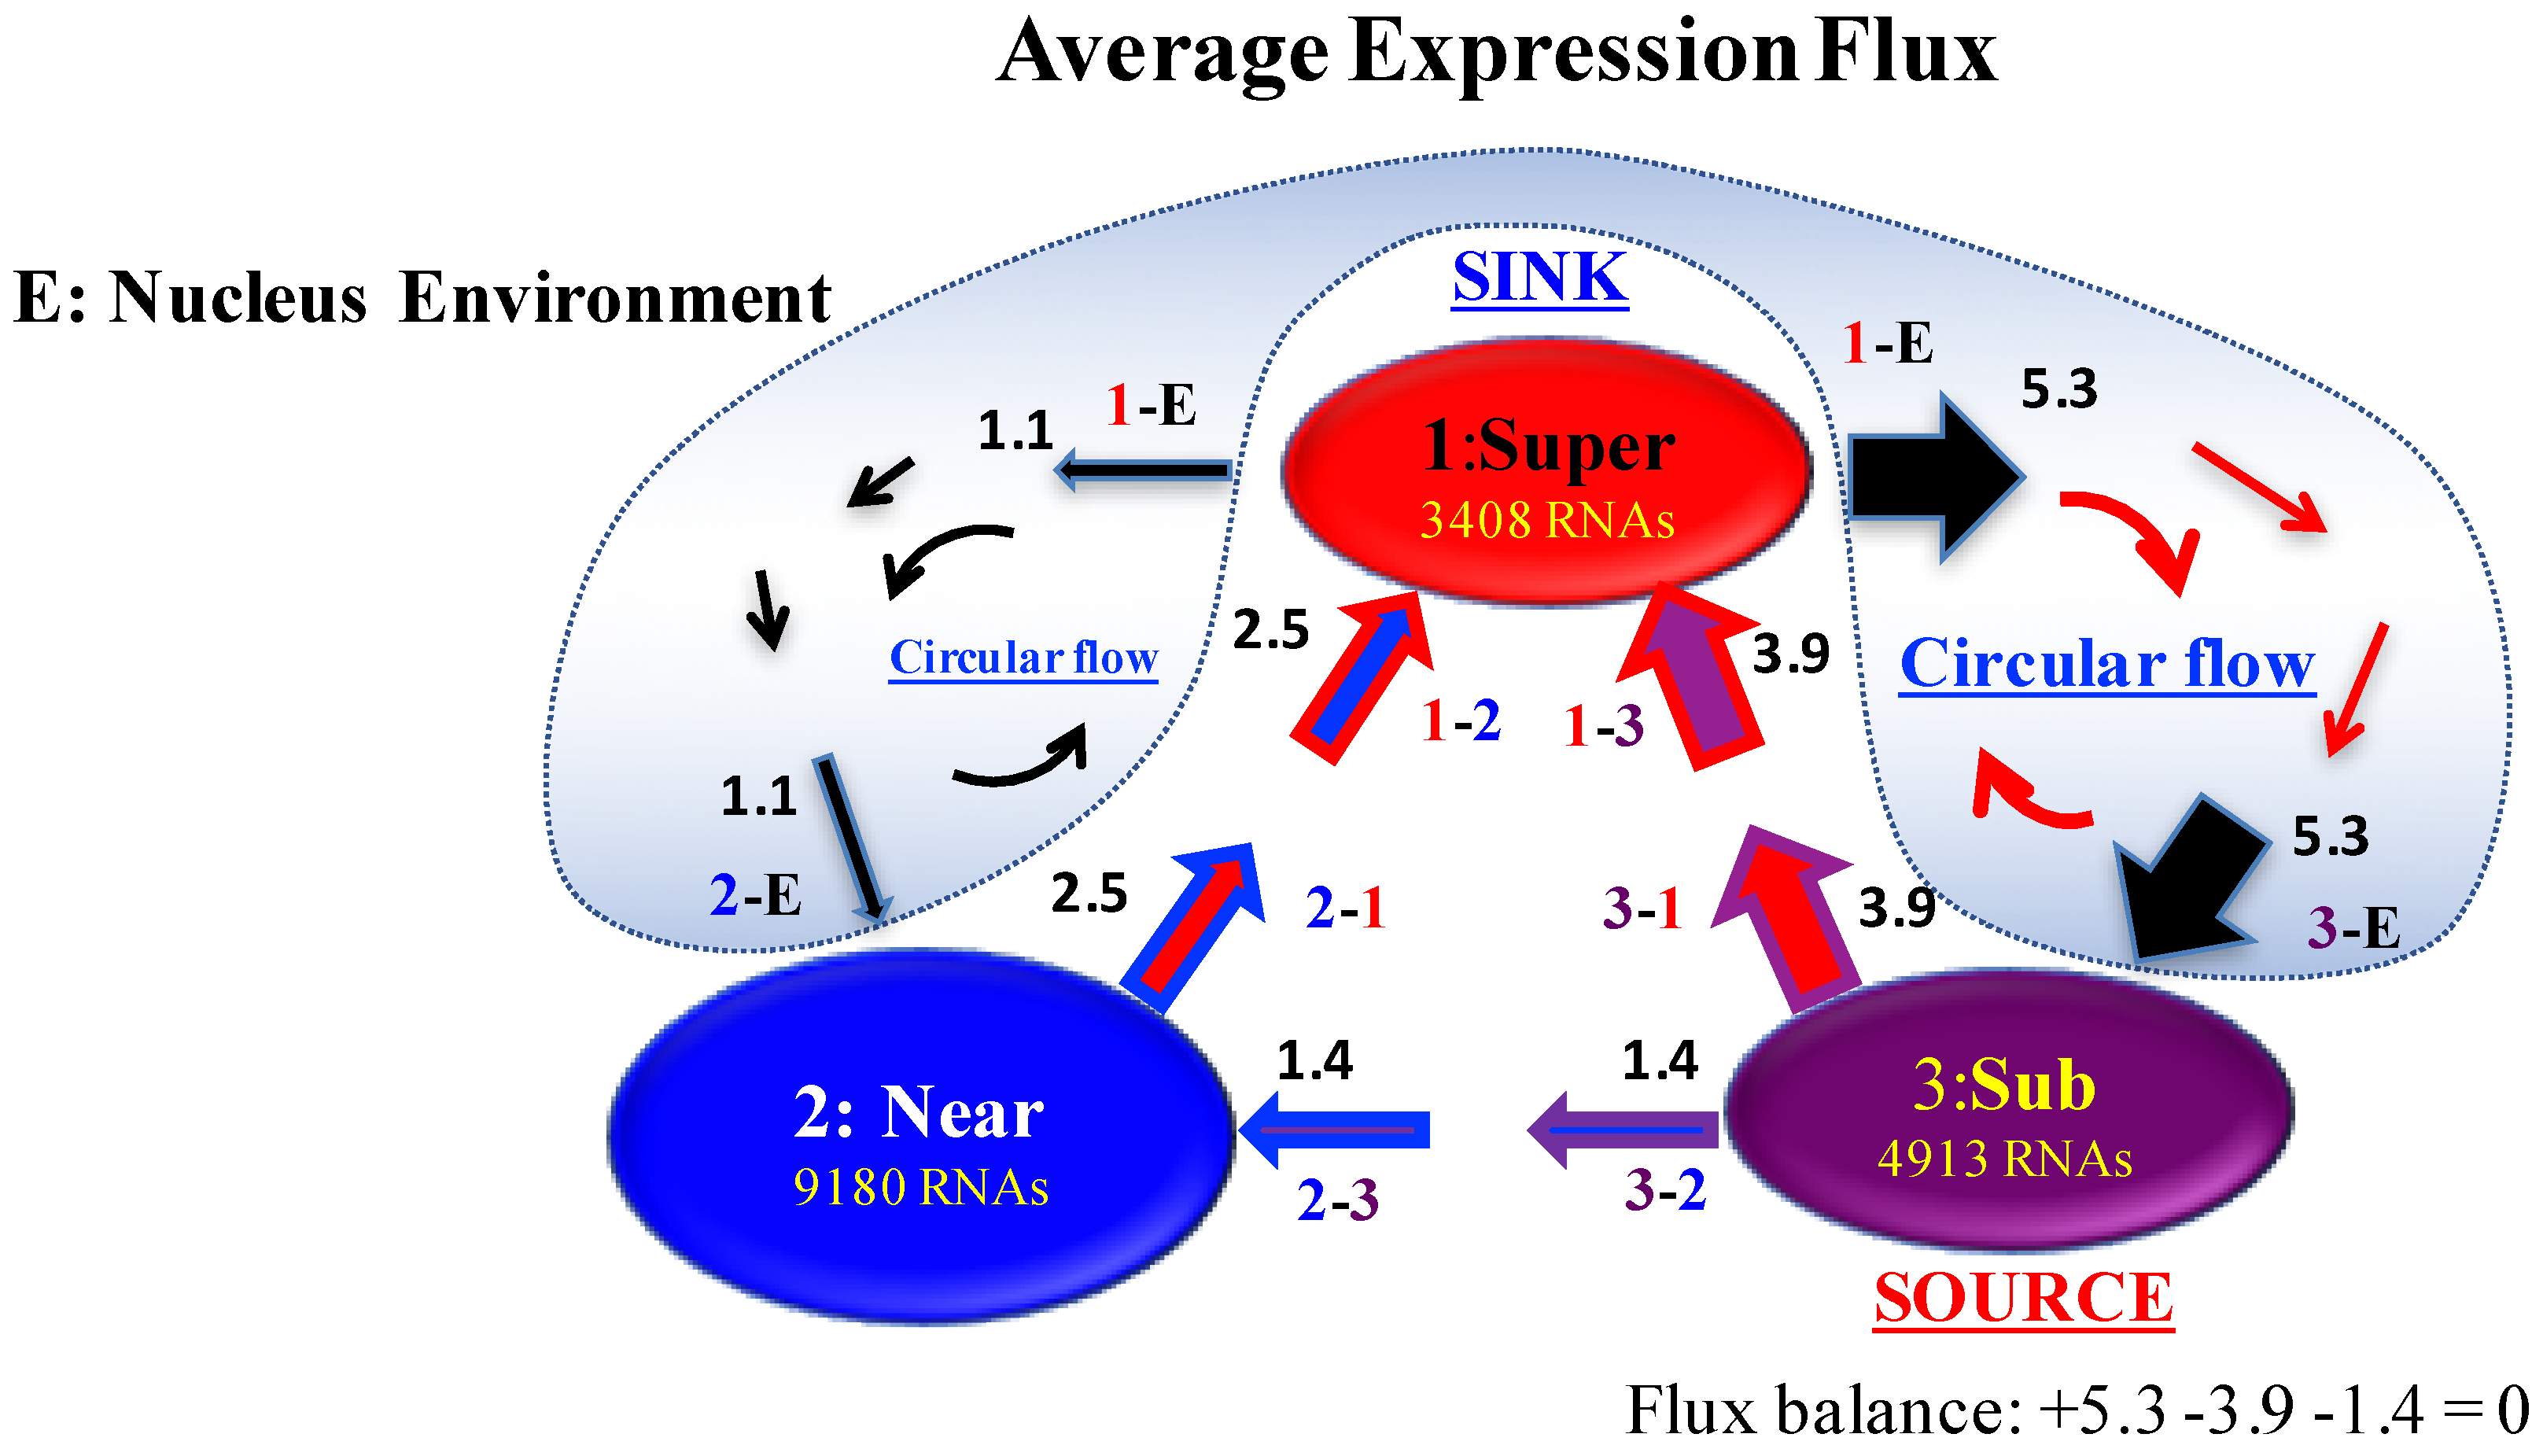
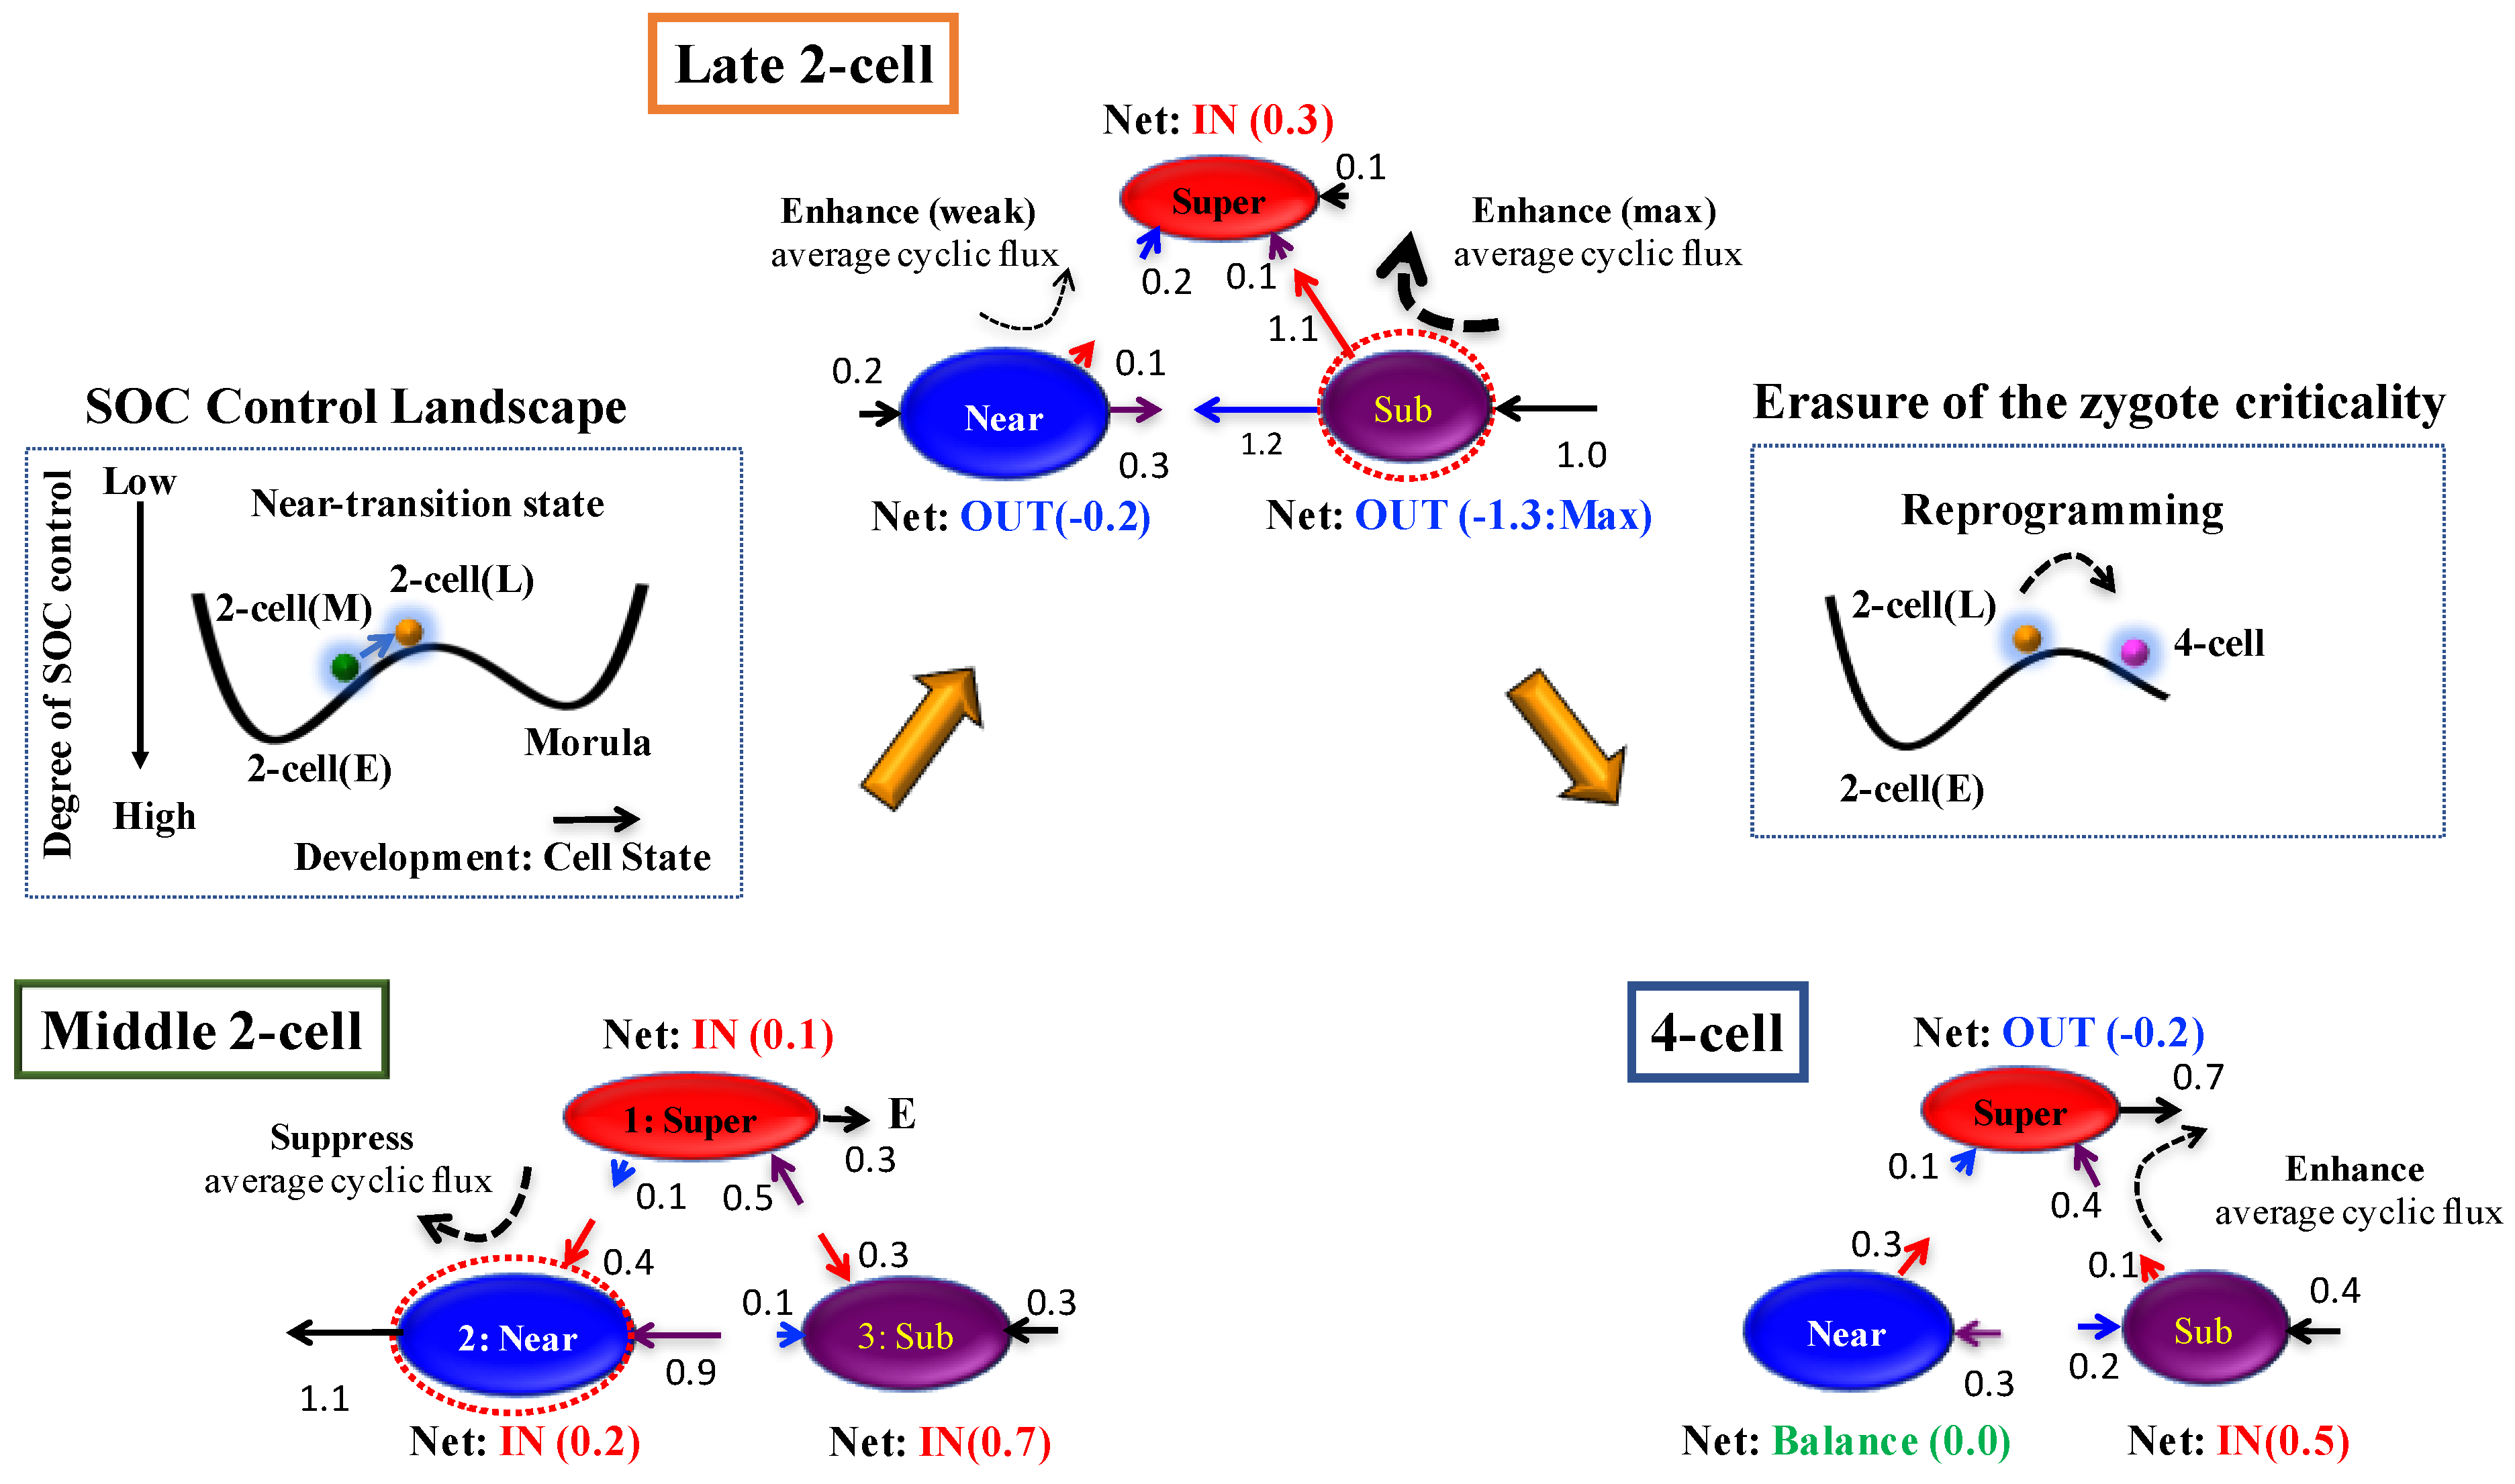
Figure 7.
Time-development of SOC control of genome reprogramming revealed through expression flux dynamics: Reprogramming occurs right after the late 2-cell (2-cell(L)) state through the transition state of the SOC control landscape (Figure 2); sequential global perturbations occur around the transition (Figure 3C). Interaction flux dynamics (Figure 5B) reveal a SOC control mechanism of genome reprogramming: (i) At the middle 2-cell state (2-cell(M)), interaction flux between Super and Near suppresses cyclic flux. All critical states receive the net IN flux, which indicates that, inside the nucleus, the mouse genome system is activated through the cell milieu (environment), which makes the cell state move up from a valley on the SOC control landscape, as shown in the inset; (ii) At the late 2-cell state, a substantial change in the net interaction flux at critical states occurs from the middle 2-cell state to induce a major change in two cyclic fluxes: a change from suppression to the enhancement of cyclic flux (Super—Near), and the strongest enhancement of cyclic flux (Super—Sub). This leads to a reverse change in the net interaction fluxes at the near-critical state (IN to OUT and vice versa) to enhance the cyclic flux (Super—Near) from major suppression in the middle 2-cell state. This activation of the sub-critical state (the maximum net OUT flux sent to other critical states) enables the system to pass through the transition state (erasure of zygote criticality after the late 2-cell state: Figure 2) to reprogram the mouse embryo genomic state as described in the inset; and (iii) In the 4-cell state, while the enhancement of cyclic flux between super- and sub-critical states becomes weak, the perturbation of average flux activity almost disappears. While the near-critical state becomes balanced, the sub-critical state receives the net expression flux and the super-critical state sends the net flux. (i)–(iii) show the occurrence of sequential global perturbations to pass through the transition state to achieve single-cell reprogramming. Numerals represent net interaction flux values.

© 2017 by the authors. Licensee MDPI, Basel, Switzerland. This article is an open access article distributed under the terms and conditions of the Creative Commons Attribution (CC BY) license (http://creativecommons.org/licenses/by/4.0/).
Share and Cite
MDPI and ACS Style
Tsuchiya, M.; Giuliani, A.; Yoshikawa, K. Single-Cell Reprogramming in Mouse Embryo Development through a Critical Transition State. Entropy 2017, 19, 584. https://doi.org/10.3390/e19110584
AMA Style
Tsuchiya M, Giuliani A, Yoshikawa K. Single-Cell Reprogramming in Mouse Embryo Development through a Critical Transition State. Entropy. 2017; 19(11):584. https://doi.org/10.3390/e19110584
Chicago/Turabian StyleTsuchiya, Masa, Alessandro Giuliani, and Kenichi Yoshikawa. 2017. "Single-Cell Reprogramming in Mouse Embryo Development through a Critical Transition State" Entropy 19, no. 11: 584. https://doi.org/10.3390/e19110584
Note that from the first issue of 2016, this journal uses article numbers instead of page numbers. See further details here.