A Refined Composite Multivariate Multiscale Fuzzy Entropy and Laplacian Score-Based Fault Diagnosis Method for Rolling Bearings


School of Mechanical Engineering, Anhui University of Technology, Maanshan 243032, China
*
Author to whom correspondence should be addressed.
Entropy 2017, 19(11), 585; https://doi.org/10.3390/e19110585
Submission received: 15 September 2017
/
Revised: 25 October 2017
/
Accepted: 27 October 2017
/
Published: 2 November 2017
(This article belongs to the Section Complexity)
Abstract
:The vibration signals of rolling bearings are often nonlinear and non-stationary. Multiscale entropy (MSE) has been widely applied to measure the complexity of nonlinear mechanical vibration signals, however, at present only the single channel vibration signals are used for fault diagnosis by many scholars. In this paper multiscale entropy in multivariate framework, i.e., multivariate multiscale entropy (MMSE) is introduced to machinery fault diagnosis to improve the efficiency of fault identification as much as possible through using multi-channel vibration information. MMSE evaluates the multivariate complexity of synchronous multi-channel data and is an effective method for measuring complexity and mutual nonlinear dynamic relationship, but its statistical stability is poor. Refined composite multivariate multiscale fuzzy entropy (RCMMFE) was developed to overcome the problems existing in MMSE and was compared with MSE, multiscale fuzzy entropy, MMSE and multivariate multiscale fuzzy entropy by analyzing simulation data. Finally, a new fault diagnosis method for rolling bearing was proposed based on RCMMFE for fault feature extraction, Laplacian score and particle swarm optimization support vector machine (PSO-SVM) for automatic fault mode identification. The proposed method was compared with the existing methods by analyzing experimental data analysis and the results indicate its effectiveness and superiority.
1. Introduction
At present most mechanical fault diagnosis methods are constructed based on the vibration signals collected from single channel or direction, while the vibration information signals of other channels or directions are often ignored. For example, in the gearbox fault diagnosis, generally only the vibration signals in the vertical body direction of gearboxes are measured and used by many scholars. Due to the complexity of the transmission paths of gearbox vibrations, signals collected by sensors in many directions all contain important fault information. Although information from single direction or channel vibration signals can effectively identifying the fault location, integrating the fault information of multi-channel vibration signals would undoubtedly provide more information related with faults and allow much more accurate fault diagnoses. With the development of multiple sensor measurement technology, the dynamic relationship evaluation between or within one or more sensor synchronous multi-channel data has increasingly become an effective data analysis method and has begun to receive more attention from many researchers [1].
Rolling bearing vibration signals are often nonlinear and non-stationary when the rolling bearing works with faults [2,3,4,5]. Many nonlinear dynamics methods including approximate entropy (AppEn) [6,7], sample entropy (SampEn) [8,9] and MSE [10,11,12] have been widely applied to mechanical fault diagnosis due to their ability to effectively extract the fault feature information hidden in the vibration signals that cannot be well extracted by linear analysis methods. However, in MSE (SampEn) the step function used for measuring similarity will cause the mutation of similarity measurements for shorter time series. Aimed at resolving this problem, multiscale fuzzy entropy (MFE) was proposed [13,14] by using fuzzy entropy [15,16] replacing sample entropy in MSE and the research indicates that MFE can get much better stability and consistency than MSE.
Based on traditional univariate complex measurement methodology (MSE and MFE) and multidimensional embedding reconstruction theory, multivariate sample entropy (MSampEn) was put forward by Ahmed et al. [17] and later extended to the multiscale process, i.e., MMSE to measure the complexity of each sequence in multi-channel data with taking into account their mutual predictability. MMSE evaluates dynamic relationship of multi-channel time series from the perspective of complexity, mutual correlation prediction and long-range correlation and exhibits the nonlinear internal coupling characteristic of multi-channel time series. MMSE has been used in complex physiologic time series and center of pressure signals analysis [18,19]. However, the sample entropy used in MMSE, as described above, often has mutations when the time series is not long enough. Then the multivariate multiscale fuzzy entropy (MMFE) is proposed by using fuzzy entropy to replace sample entropy. However, MMFE still has some problems. For example, with the increasing of scale factor, the obtained multivariate fuzzy entropies (MvFE) will have some fluctuations at the larger scale factor. Recently, the refined composite multivariate generalized multiscale fuzzy entropy (RCMvGMFE) was proposed by Azami and Escudero [20] to improve the performance of MMFE in complexity analysis of multi-channel signals.
In this paper the RCMMFE was introduced to enhance MMFE for analyzing mechanical fault vibration signals and extract the complexity information from vibration signals of faulty rolling bearings. Generally, fault features consisting of multi-scale RCMMFEs often display high dimensionality and not all of them are really related with fault information, and some are even redundant for fault diagnosis. It is therefore necessary to implement feature dimension reduction for improving the fault mode identification rate. The Laplacian score (LS) method estimates the importance of features according to their locality preserving power and is an effective supervised and unsupervised feature selection method and it can get much more better feature reduction effect than the often used principal component analysis, linear discriminant analysis, locally linear embedding and Laplacian eigenmaps methods [21,22]. In this paper, LS is employed to select the most important features from the initial fault features to reflect the fault information. After that the PSO-SVM is used to fault mode classification [23,24]. A new fault diagnosis method for rolling bearings was proposed based on RCMMFE, LS and PSO-SVM and applied to the experiment data of rolling bearing by comparing with MSE-, MFE-, MMSE- and MMFE-based fault diagnosis methods. The analysis results show that RCMMFE can get much better stability and higher fault recognition rate than the above existing methods.
The rest of this paper is organized as follows: the theories of multivariate fuzzy entropy and multivariate multiscale fuzzy entropy methods are introduced in Section 2. Refined composite multivariate multiscale fuzzy entropy is described in details in Section 3. The proposed fault diagnosis method for rolling bearings and its application analysis to experiment data are given in Section 4. Finally, conclusions are given in the final section.
2. Multivariate Multiscale Fuzzy Entropy
2.1. Multivariate Fuzzy Entropy
It is necessary to generate the multivariate embedding vector according to the Takens embedding theorem for calculating MvFE. The detailed steps of MvFE is described as follows [20,25].
- (1)
- For a p variate time series , the multivariate composite delay vectors can be obtained by the multidimensional time delay embedding reconstruction as:Let (), where is the embedding dimension vector, is the time delay and () the embedding dimension. .
- (2)
- The distance between and is defined as:
- (3)
- The similarity degree of and is defined by using the fuzzy function as , where is the fuzzy membership function.
- (4)
- We define:
- (5)
- We extend the dimensionality of multivariate delay vector from m to (m + 1) and since the multivariate time series contains p time series, it can be performed in p different ways. Thus, totally, p × (N − n) reconstruction vectors can be obtained. Similarly, we can define:In fact, represents the probability that any two multivariate composite delay vectors are similar in the dimension m, whereas stands for the probability that any two multivariate composite delay vectors will be similar in the dimension (m + 1).
- (6)
- The MvFE is defined by:When N is a finite number, MvFE can be computed by:MvFE in fact is an extension of fuzzy entropy to multivariate framework and it mainly is used to the complexity and mutual correlation prediction of multi-channel data. However, MvFE is only in the single scale of original data, which often is not accurate in the complexity measurement. Then the MMFE is developed.
2.2. Multivariate Multiscale Fuzzy Entropy
- (1)
- For a given normalized p variate multi-channel time series (), the p variate coarse graining data can be obtained by:where = 1, 2, …, is the scale factor.
- (2)
- Compute the MvFE of each coarse graining data and deem the MvFE as a function of scale factor.
MMFE actually is an evaluation of the relative complexity of normalized multi-channel time series. Its geometric interpretation is as follows: (1) if the entropies of a multivariate time series X in most scales are larger than that of Y, we generally think that the dynamic behavior of X is more complex than Y; (2) if the entropy of X is decreasing with the increasing of scale factor, it means that the mainly useful information contained in X only distribute in the smallest scale. The typical examples are the random white noise or predictable signals. MMFE considers not only the mode self-similarity of each time series in multi-channel data, but also interaction prediction between multiple channel sequence. Therefore, MMFE in fact evaluates dynamic relationship of multi-channel data from the perspective of complexity, mutual prediction and long-range correlation.
3. Refined Composite Multivariate Multiscale Fuzzy Entropy
3.1. RCMMFE Algorithm
The key of refined composite multivariate multiscale entropy is generating multivariate coarse-grained time series.
- (1)
- For a given normalized p variate multi-channel time series , (), different multivariate coarse graining time series can be obtained by Equation (7) for each scale factor .
- (2)
- Compute the average of all and the average of all values of under q = 1, 2, …, , respectively.
- (3)
- The RCMMFE is estimated by the following expression:
It should be mentioned that since multi-channel signals often have different amplitude ranges, the distances calculated on embedded vectors will be biased toward the largest amplitude range variate. So each data channel is normalized to the unit standard deviation so that the total variation becomes equal to the number of channels or variables.
Next, we discuss the parameter selection of RCMMFE. The parameters mainly contains multi-time delay , embedding dimension and r that controls the width of fuzzy membership function. There is no proven criterion for choosing the time delay for RCMMFE. Based on the univariate embedding theorem and MMSE, generally, we set () that will have small influence on the result of RCMMFE. In references [20,25], it is recommended to set (). The embedding dimension vector is usually set (). The similarity tolerance r is set 0.15 multiplying standard deviation (SD) of original time series.
3.2. Comparison Analysis of Synthetic Signals
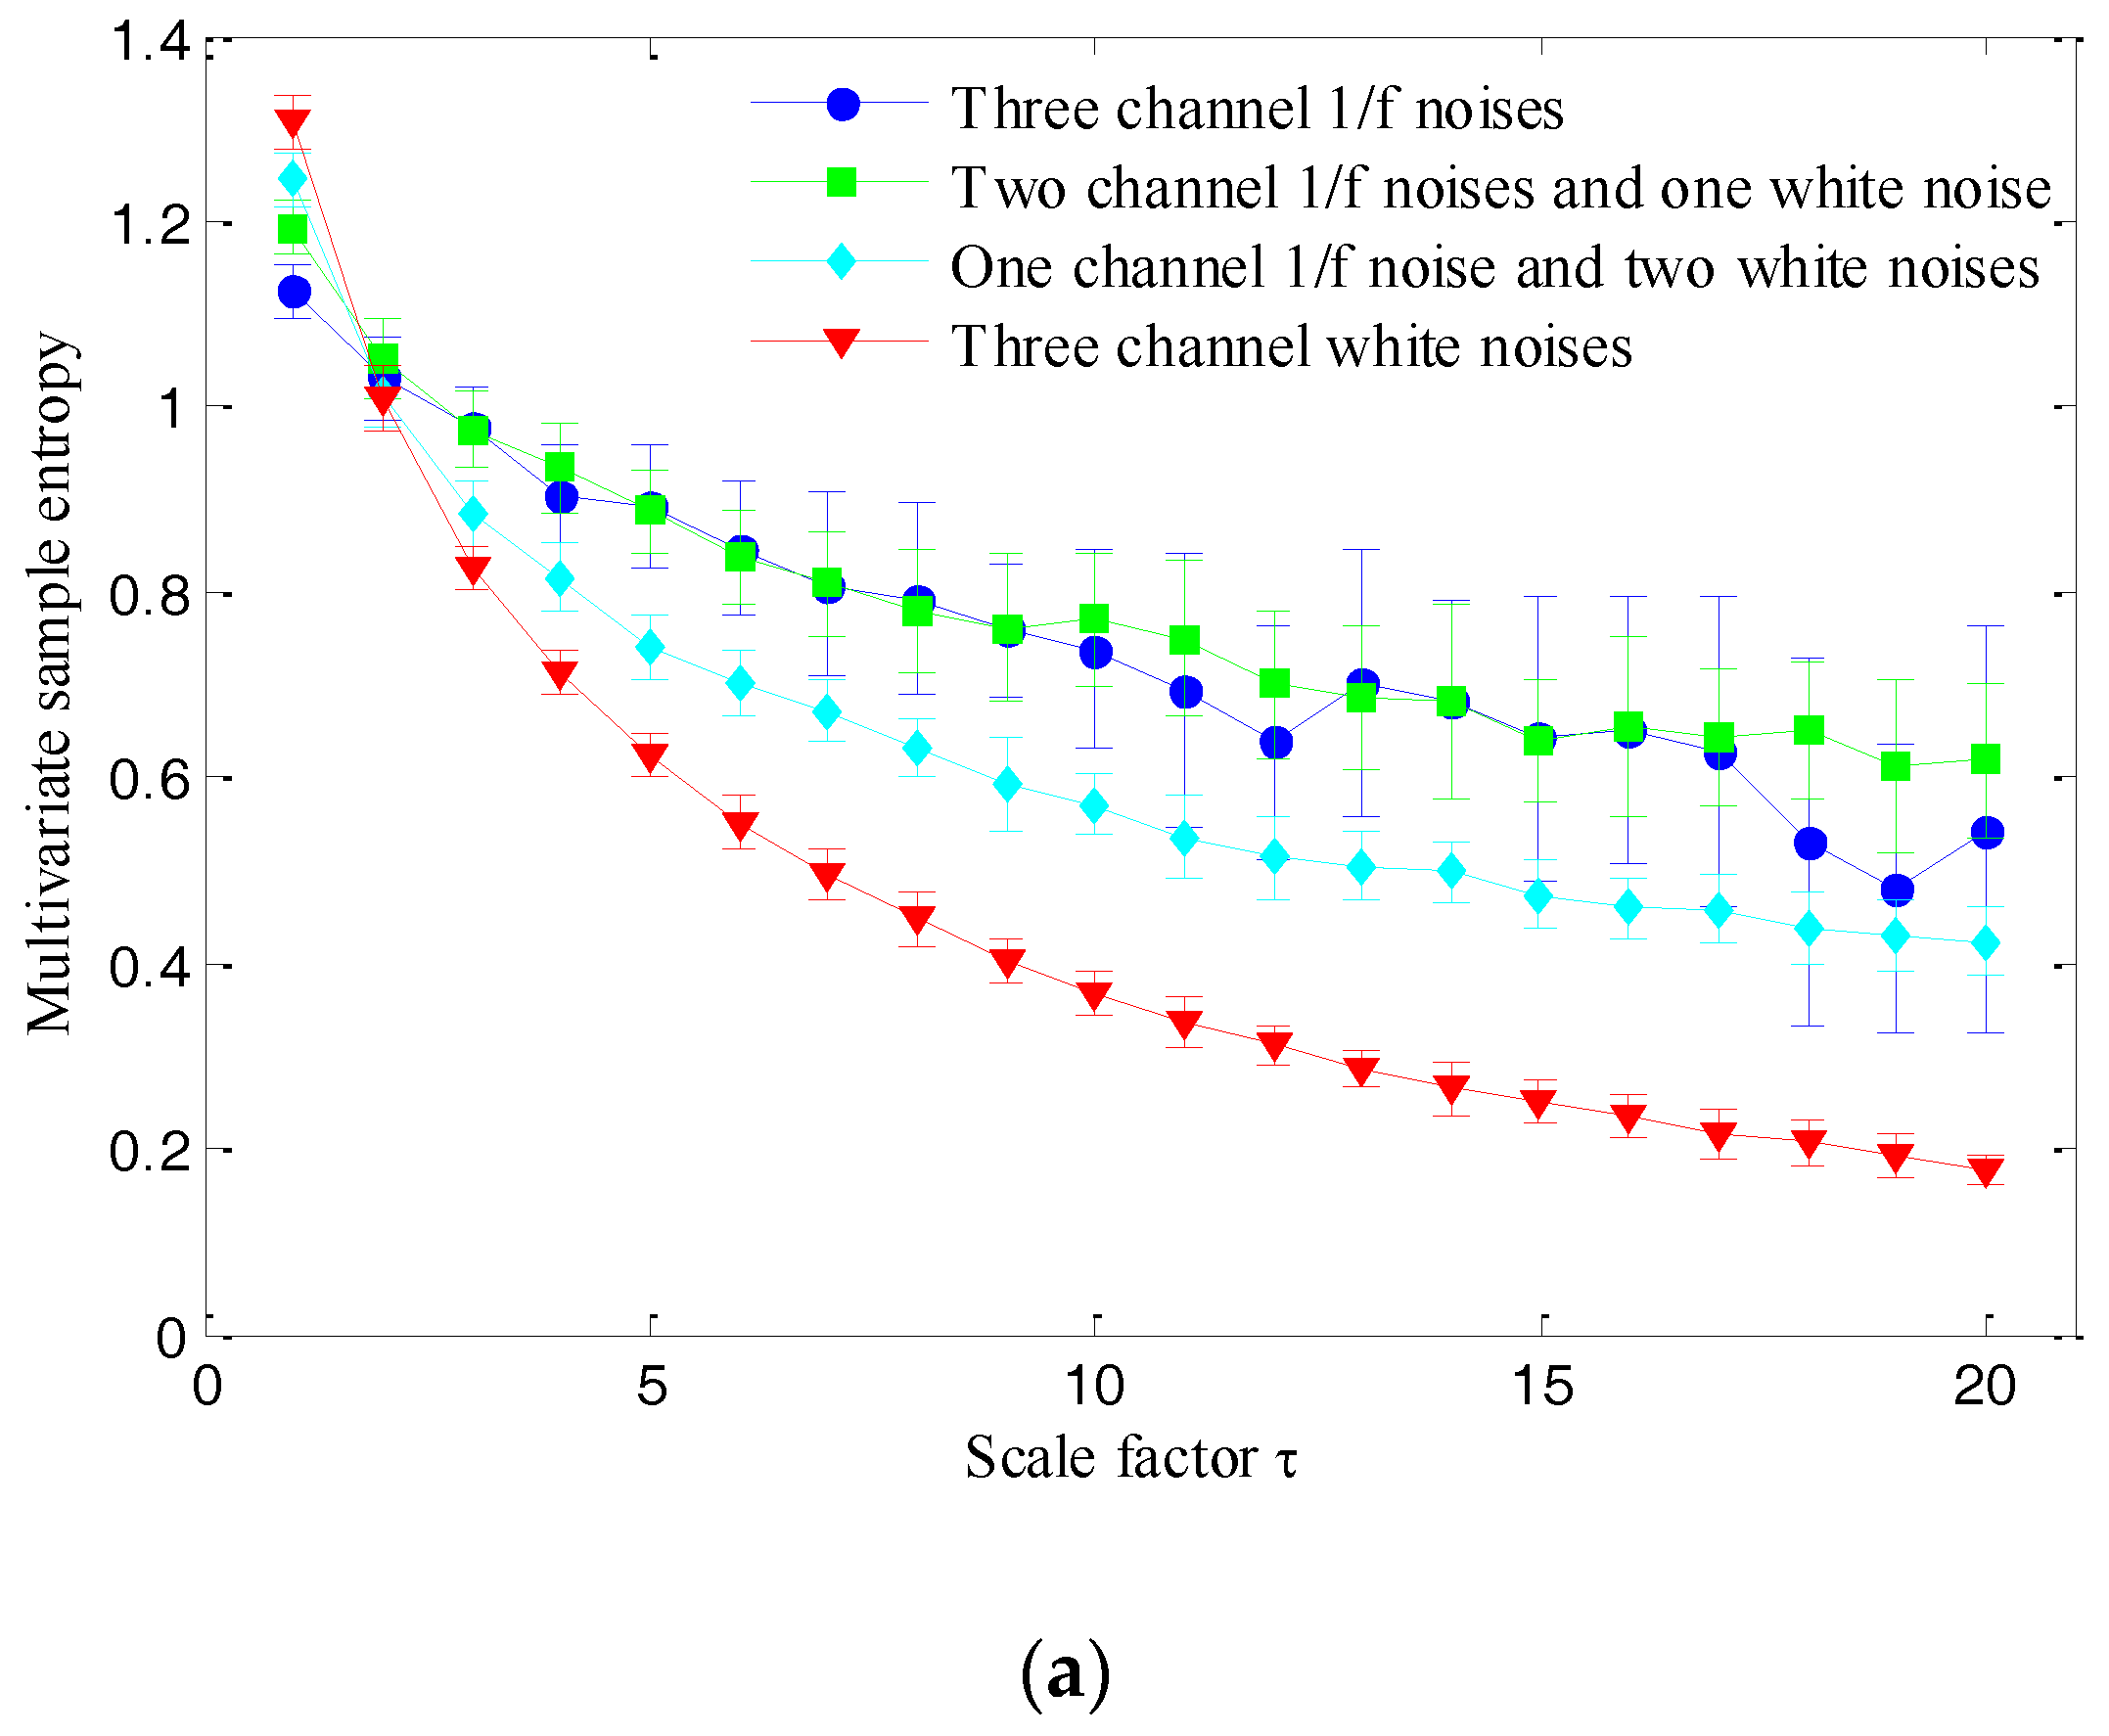
White Gaussian noise and 1/f noise are two most important signals to evaluate the multiscale entropy-based methods for univariate and multivariate time series. The most important reason is that the complexity of 1/f noise is higher than white Gaussian noise while the irregularity of the former is lower than the latter one, which results in that though the entropy of original data of 1/f noise in the first scale is smaller than that of white Gaussian noise, but in most scale factors the entropies of the former are larger than that of the latter one. Generally, with the increasing scale factor, the entropies of white Gaussian noise decrease monotonously, while that of 1/f noise tends to a constant and is greater than that of white noise in the larger scale factors, which is consistent with the fact accept by many scholars that the 1/f noise is more complex than white Gaussian noise in structure. Therefore, for multi-channel data there also should be a result that the more the channel containing 1/f noise, the more complex the multivariate complexity of the data. The simulation results of multivariate entropies-based methods should support this conclusion [1,25]. We take the white Gaussian noise (WGN) and 1/f noise signals for examples.
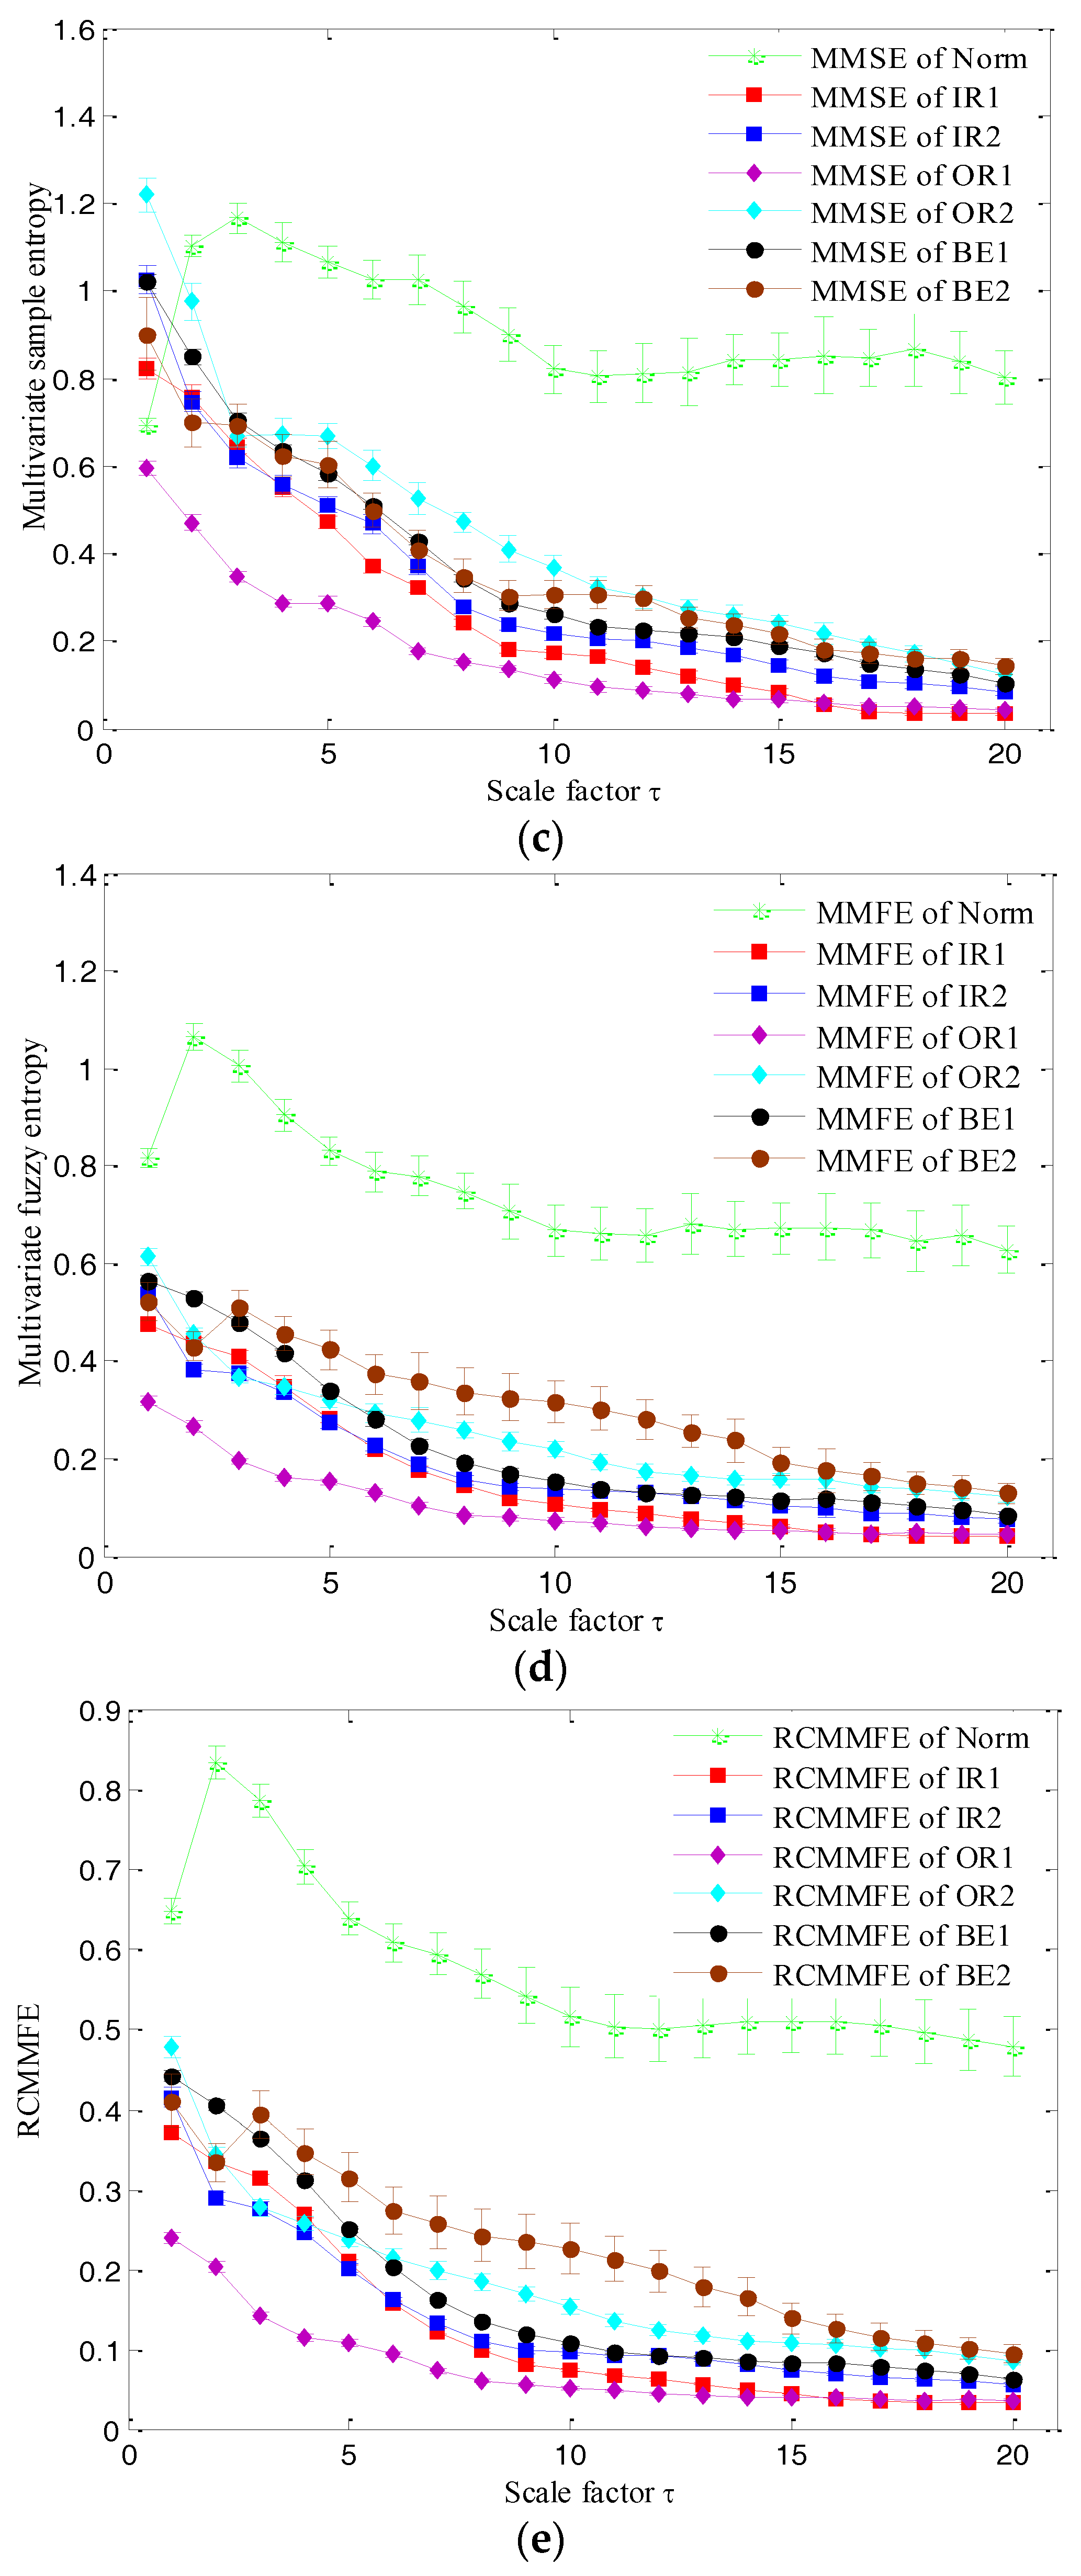
In the following example three channel data (i.e., p = 3) consisting of WGN and 1/f noise are used to verify the above simulation results for comparison purposes. The synthetic signals consisting of white noise and 1/f noises are divided into four groups, i.e., (a) three channel 1/f noises; (b) two channel 1/f noises and one channel WGN; (c) one channel 1/f noise and two channel WGNs; (d) three channel WGNs with data length 4096 in each channel. According to multiscale entropy theory, their entropy relationships in most scales of four synthetic signals should be (a) > (b) > (c) > (d). The results obtained for MMSE, MMFE and RCMMFE using 20 different samples of each groups are respectively shown in Figure 1a–c. From these figures it can be found that the MMSE, MMFE and RCMMFE relationships in most scale factors are: (a) > (b) > (c) > (d), which is consistent with the above theoretical results. This indicates that MMSE, MMFE and RCMMFE are able to effectively reflect multivariate complexity of multi-channel data. Most of all, from Figure 1a–c it can be seen that MMSE and MMFE methods cannot well distinguish: (a) three channel 1/f noises and (b) two channel 1/f noises and one WGN. They have a certain fluctuation and part of them overlap in the larger scale factors. Therefore, compared with MMSE and MMFE, with the increasing of scale factor RCMMFE gets the most obvious distinguishing effect for the four kinds of synthetic signals. In the following section RCMMFE is applied to extract the complexity information from vibration signal of rolling bearing.
4. RCMMFE, LS and PSO-SVM Based Fault Diagnosis for Rolling Bearing
4.1. Laplacian Score for Feature Selection
Generally, the obtained high dimension RCMMFE values are not all really related with fault information and parts of the entropies are redundant. It is necessary to reduce the fault feature dimensionality to improve the efficiency of fault diagnosis. Laplacian Score (LS) is a both supervised and unsupervised feature selection method, which is mainly founded on Laplacian eigenmaps and locality preserving projection and estimate the features according their locality preserving power. By using LS the fault features are resorted according to their Laplacian score from low to high, which corresponds to their importance, namely, those features with the lowest scores as the most ones. In this paper, LS is employed to select the most important features from the initial fault features to reflect the fault information. After that SVM suitable for dealing with classification problems of small samples is employed for fault mode classification. Besides, the particle swarm optimization algorithm is used to optimize the parameters of SVM, i.e., the PSO-SVM method is used to automatically identify fault category and severity.
The extracted MFE features in 20 scales, theoretically, are able to identify the fault type. However, a feature vector with high dimension will be time-consuming and even information inefficient for fault diagnosis. Therefore, it is necessary to select the most interrelated feature with fault information from the 20 features, which will avoid the dimension disaster and improve the performance of classification and the efficiency of rolling bearing automatically fault diagnosis.
Laplacian Score mainly is inspired by Laplacian eigenmaps and locality preserving projection and its key thought is to estimate the features according their locality preserving power and a detailed description of LS can be found in [17,18]. Laplacian score algorithm chooses those features with the lowest scores. Since, LS has not been widely used in rolling bearing fault diagnosis for fault feature selection, in this paper it is employed to select the features with most close relationship with fault information from the initial features.
4.2. The Proposed Method
The proposed fault diagnosis method for rolling bearing is described as follows:
- (1)
- RCMMFE is employed to extract the complexity information related with fault from vibration signals of rolling bearing for construction of initial fault features. The initial fault features are divided into training and testing data sets.
- (2)
- LS is utilized to sort the initial feature values of training data sets to construct sensitive fault features.
- (3)
- The sensitive fault features of training data are used to train the PSO-SVM based multi-classifier.
- (4)
- The sensitive fault features of testing data can be obtained by using the feature order get by LS in step (2).
- (5)
- The sensitive fault features of testing data sets are input to the trained PSO-SVM multi-classifier and the outputs are used to diagnose fault location and severity.
The flowchart of the proposed method is given in Figure 2.
Next, the experiment data of rolling bearing offered by Case Western Reserve University Bearing data center are used to verify the effectiveness of proposed method. As shown in Figure 3 above, the test stand consists of a motor, a torque transducer/encoder (center), a dynamometer, and control electronics. Single point faults were introduced into SKF bearings using electro-discharge machining with local fault diameters of 0.1778 mm and 0.3556 mm and fault depths of 0.2794 mm. Vibration data were collected using accelerometers attached to the housing with magnetic bases. Accelerometers were placed at the 12 o’clock position at both the drive end and fan end of the motor housing. Digital data was collected with sample frequency 12,000 Hz. Experiments were conducted for both fan and drive end bearings with outer raceway faults located at 6 o’clock (orthogonal to the load zone). In this paper, the data we used include seven classes, i.e., normal bearing (noted as Norm), faults located in inner raceway (IR), outer raceway (OR) and ball element (BE) with fault diameters of 0.1778 mm and 0.3556 mm (label as IR1 IR2, OR1, OR2, BE1 and BE2, respectively). The states of rolling bearing are divided into seven classes and the label description is shown in first and second columns of Table 1. Generally, only the single channel data of rolling bearing in drive end or fan end were used to verify their fault diagnosis methods by many scholars. However, the method that synthesizes all three channel data collected from different location and accelerometers, i.e., the drive end (DE), fan end (FE) and base accelerometers for the same fault category may get much more fault information and higher fault identifying rate than that of the single channel data based fault diagnosis methods.
In the following the proposed method and related ones are employed to the above experiment data analysis of rolling bearing. Firstly, MSE-, MFE-, MMSE-, MMFE- and RCMMFE-based methods for fault extraction are used to extract the complexity information related with faults from vibration signals of rolling bearings for comparison purpose. For each class 30 samples with data length 2048 are selected, i.e., in total 210 samples belonging to seven classes are used in the experimental analysis. Besides, for the single channel based MSE and MFE methods, only the DE channel data are used for comparison. The entropy results of the above five methods are given in Figure 4a–e, respectively. From Figure 4 it can be found that the MSE and MFE curves of vibration signals of rolling bearings in a single channel are mixed together at most scales, while the MMSE, MMFE and RCMMFE curves of rolling bearings of different classes are obviously divided at most scales.
In order to fulfill the fault diagnosis of rolling bearing automatically, 10 samples of each class are randomly selected as training samples while the remaining 20 ones are taken as testing samples. Correspondly, the initial training data set can be obtained with dimension 70 × 20, the initial testing data set with dimension 140 × 20 as well. We firstly study the proposed method on the experiment data. The RCMMFEs of vibration signals of rolling bearing of the seven classes with totally 210 samples are computed. Ten samples of each class are randomly selected as training samples and the remaining 20 are as testing ones. Correspondingly, the initial training data set with dimension 70 × 20 can be obtained as well as the initial testing data set with dimension 140 × 20.
Secondly, the LS for feature selection is used to the training samples to sort the 20 entropy values according to their importance, where the cosine value of two vectors is used to evaluate the ‘closeness’ between them and assign weights for each edge in the graph and k nearest neighbors (KNN) method is used to construct the graph with parameter k = 5. Then the first five ones are selected to construct sensitive fault training data set with dimension 70 × 5. Correspondingly, the features of initial testing data set also can be reordered according to the order of sensitive fault training data set with obtaining sensitive testing ones with dimension 140 × 5.
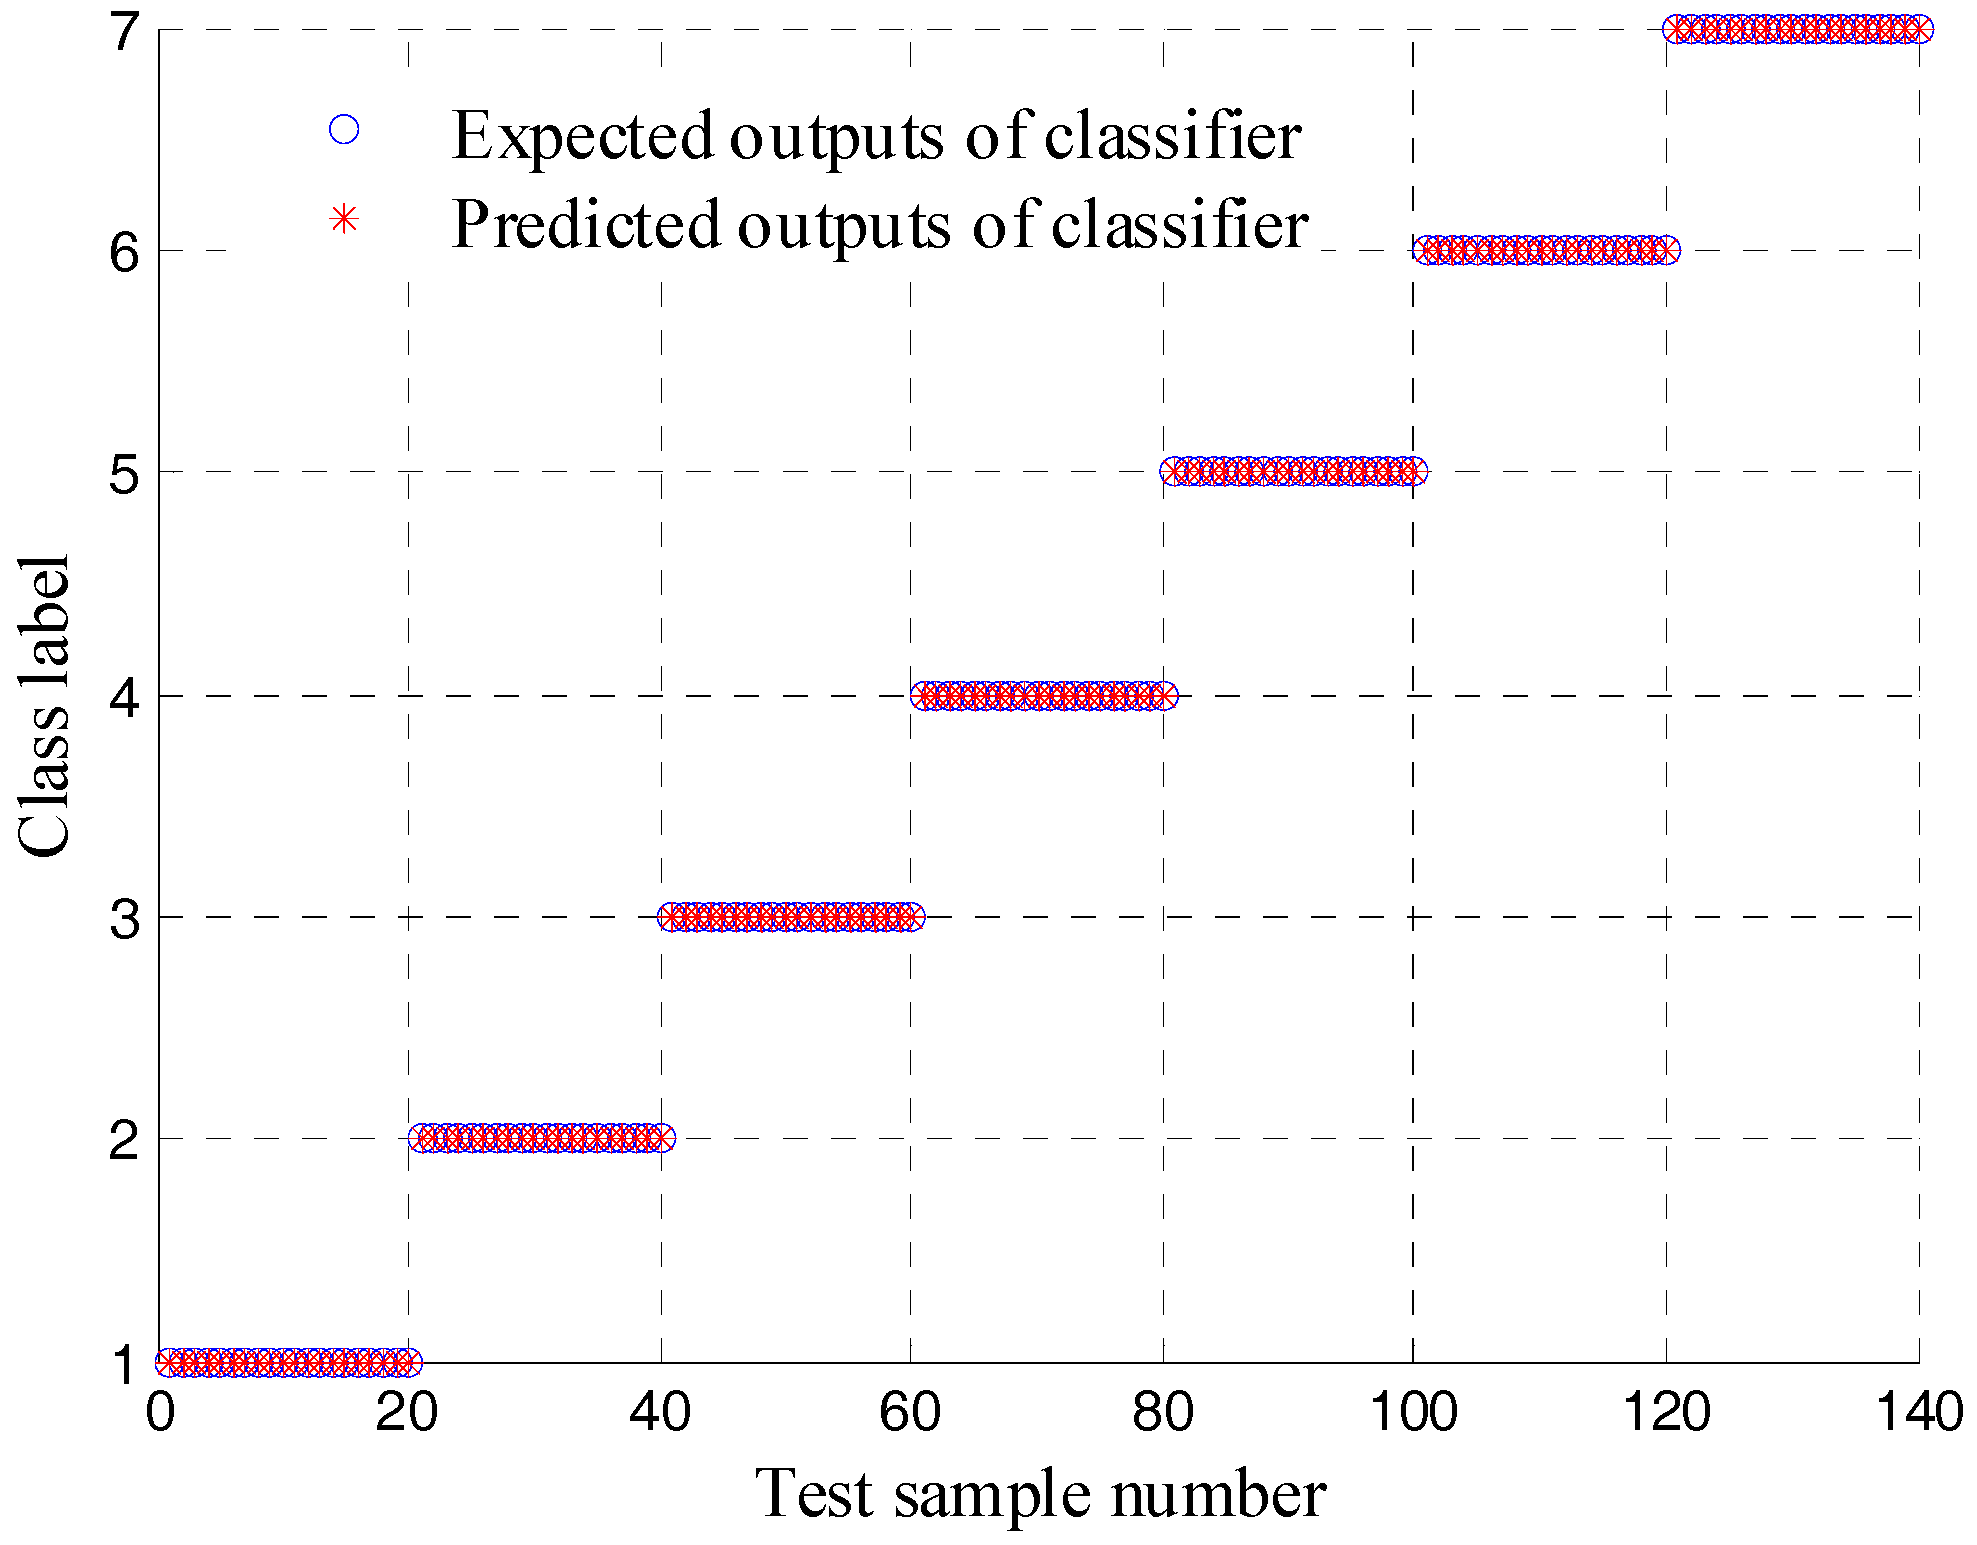
Next, the sensitive training data sets are used to train the PSO-SVM based multi-classifier (for seven classes). After that the sensitive testing data sets are used to test the trained multi-classifier and the outputs of proposed methods are given in Figure 5, from which it can be found that all testing samples are correctly classified and the corresponding fault identifying rate of the proposed method is 100%. This indicates the effectiveness of the proposed method.
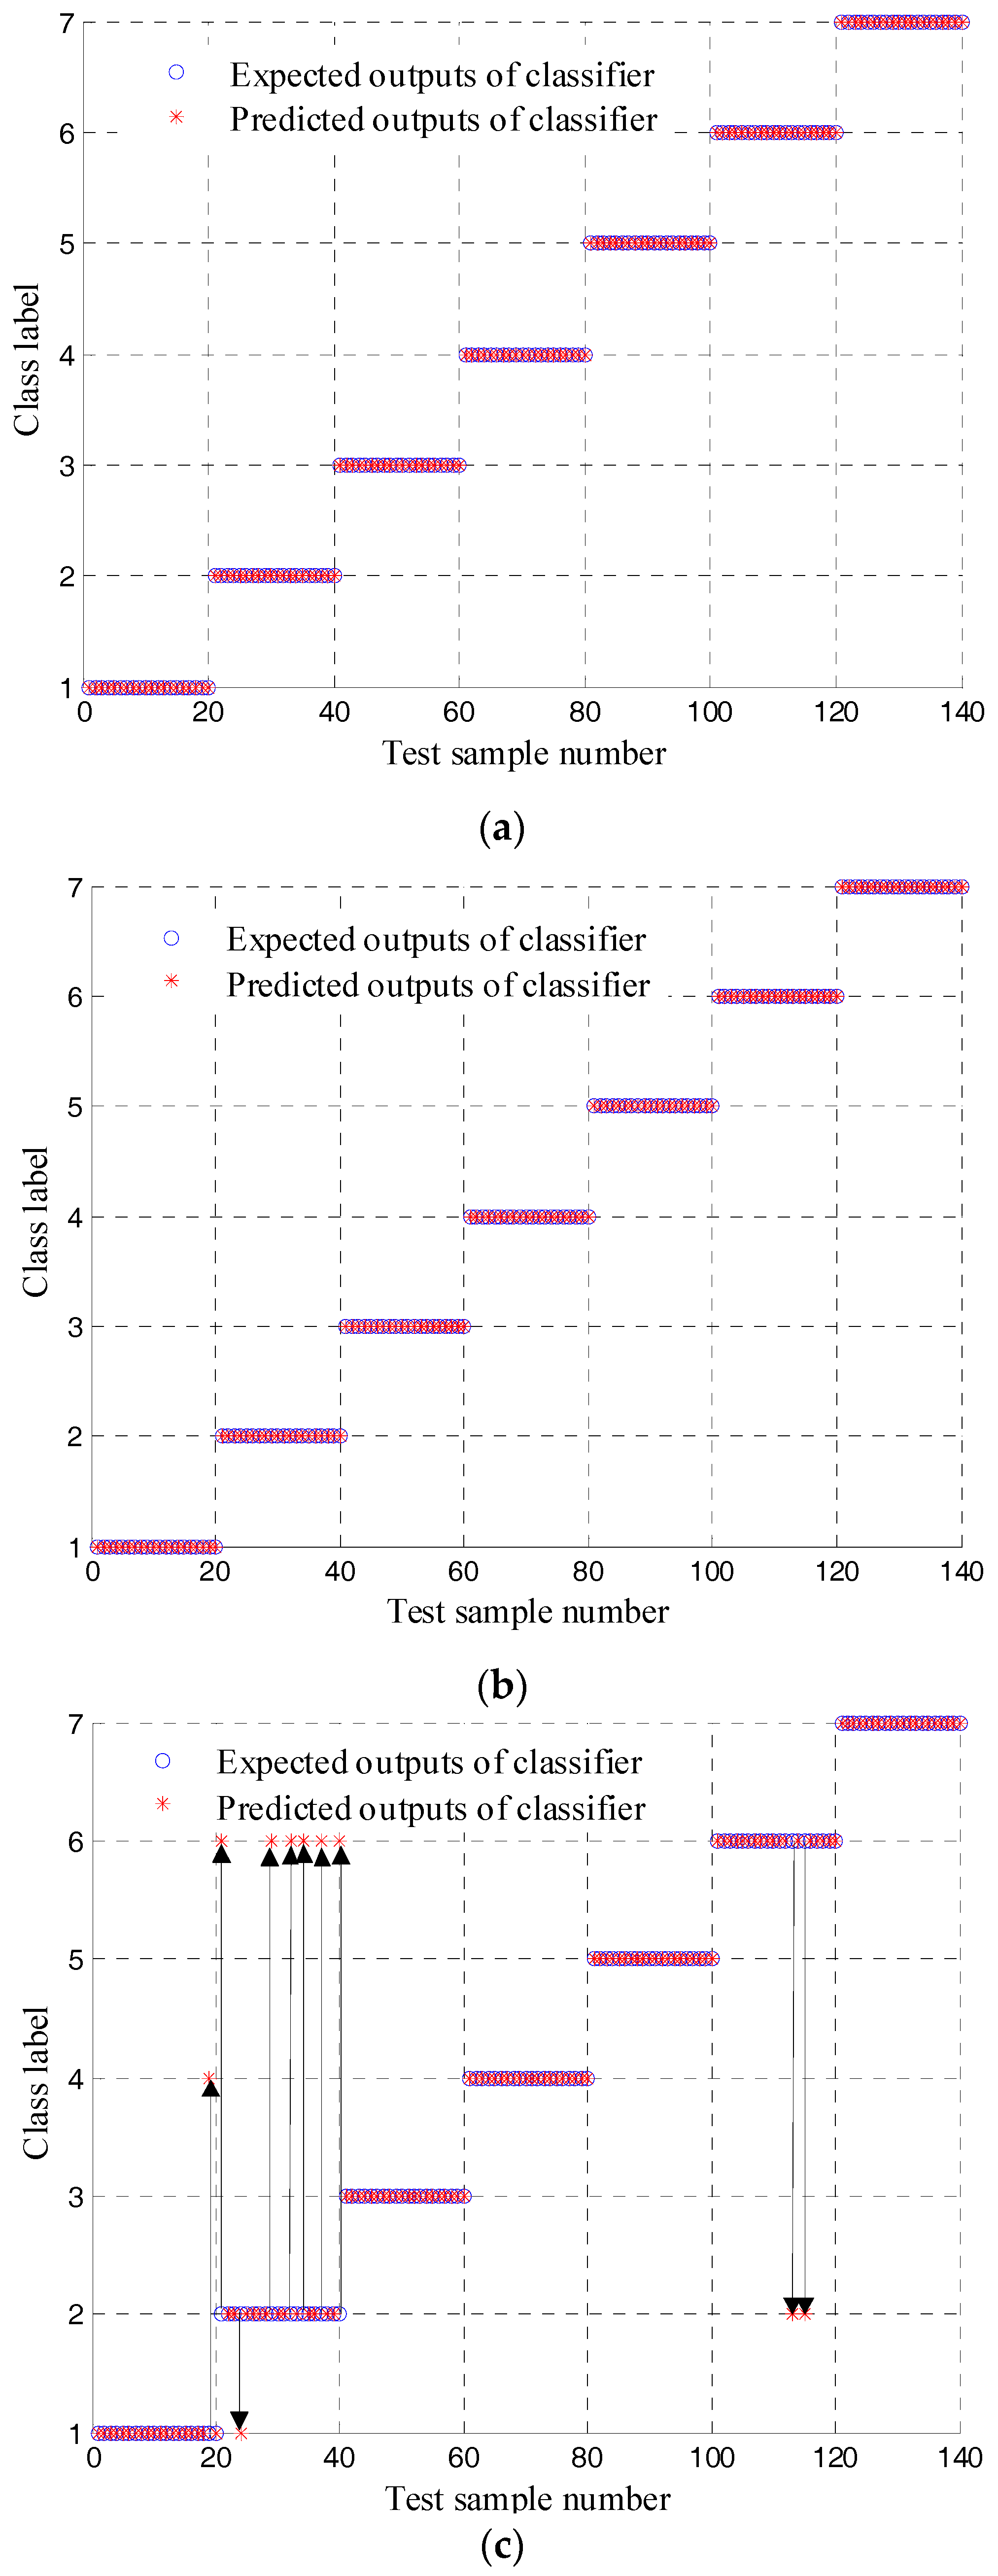
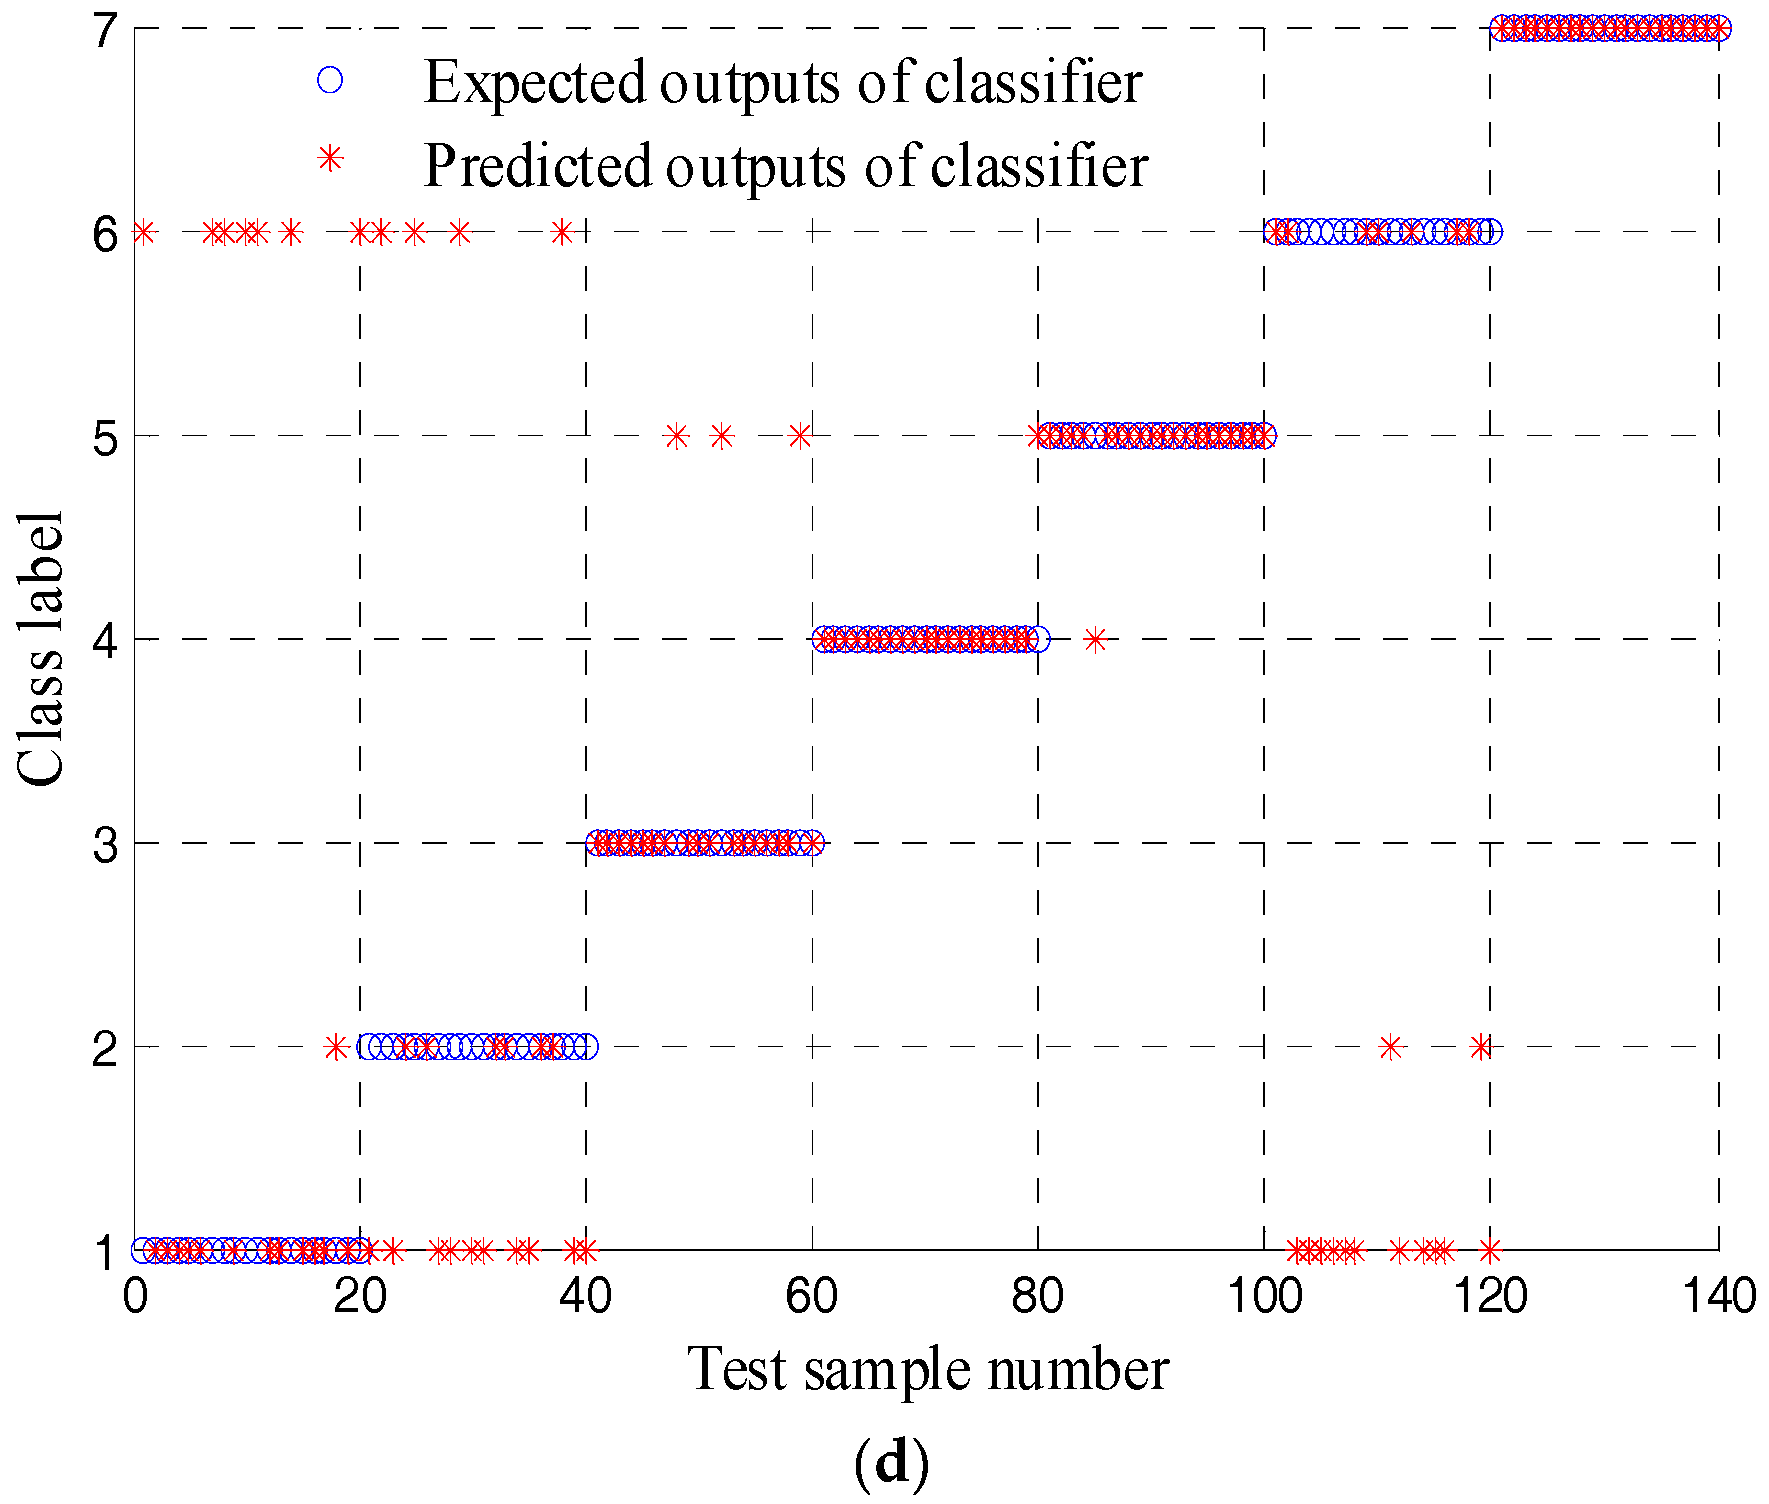
For comparison purposes, MSE, MMSE, MFE and MMFE are used to replace RCMMFE in the proposed method to extract the fault information from vibration signals of rolling bearings. Similar to the above proposed method, LS is used for fault feature selection and PSO-SVM used for fault mode classification when the construction of training and testing data set are the same as the proposed fault diagnosis method. The outputs of testing samples by using these four methods are shown in Figure 6a–d, respectively, and the corresponding identifying rates are shown in Table 2. From Figure 6 and Table 2 it can be found that all the testing samples are correctly classified by the MFE-, MMFE- and RCMMFE-based fault diagnosis methods with 100% identification rates, while there 40 and 10 testing samples are respectively classified by the MSE- and MMSE-based methods. To sum up, the above analysis result shows that the proposed methods can get an accurate identifying rate when analyzing the classification problem including fault category and severity of rolling bearing. Most of all, it can be found the fuzzy entropy-based nonlinear dynamic methods—MFE, MMFE and RCMMFE—get much higher fault identifying rates than that of sample entropy-based MSE and MMSE methods.
In the above case, the proposed and its related methods are applied to distinguish the fault category and severity of rolling bearings. However, in some case, we only want to know the fault locations without considering the fault severity. Under this consideration, the above seven classes can be redivided into four class problems described in Table 3, when IR1 and IR2, OR1 and OR2, BE1 and BE2 are amalgamated into single IR, OR and BE. Next, 70 samples (20 of each fault classes and 10 of Norm) are randomly selected as training samples that used for input of LS to select the most important features and then the first five ones are used to construct sensitive fault training data sets. Also the selected feature orders are used to reorder the feature orders of testing data sets. Finally, the sensitive fault features of training data are used to train the PSO-SVM based multi-classifier (for four classes) and those of testing data are used to test the four class multi-classifier. Correspondingly, the outputs of all testing data obtained by the four methods are given in Table 4, respectively, from which it can be concluded that all testing samples are correctly classified by the MFE and RCMMFE combining LS and PSO-SVM-based fault diagnosis methods and the fault identifation rate is 100%, while there are respectively one, six and one testing samples misclassified by the MSE-, MMSE- and MMFE-based fault diagnosis methods with corresponding identification rates of 99.29%, 95.71% and 99.29%. This indicates that the fault diagnosis effects of fuzzy entropy based methods—MFE, MMFE and RCMMFE—have better distinguishing capability than the sample entropy-based ones, both in dealing with four or seven classes problems of rolling bearings. Also, the MMFE- and RCMMFE-based fault diagnosis methods using three channel data have higher fault identification rates and stronger robustness than the single channel data-based methods.
Finally, to verify the indispensability of LS for feature selection, all obtained 20 fuzzy entropy values are taken as the fault features and input to the PSO-SVM-based multi-classifier for training and testing. The features are respectively divided into seven and four classification problems and the corresponding identifying rates of the MSE, MFE, MMSE, MMFE and RCMMFE methods for these two classification problems are shown in Table 5. From Table 2, Table 4 and Table 5 it can be found that the identification rates of most methods without using LS feature selection are lower than those of methods using LS for both seven and four classification. Also it can be seen that all the methods get higher identification rates for four class problems than that for seven class, which means that it is more difficult to distinguish the fault severity by comparing with fault class. Lastly, the comparison result indicate that the MFE-, MMFE- and RCMMFE-based methods can reflect the fault information better and get higher identifying rates than the MSE- and MMSE-based ones no matter whether using LS is used for feature selection.
5. Conclusions
In this paper, a nonlinear dynamics parameter termed multivariate refined composite multivariate multiscale fuzzy entropy (RCMMFE) was introduced to measure the complexity, mutual predictability and long-term correlation of multivariate time series. RCMMFE was compared with MMSE and MMFE by analyzing multi-channel synthetic signals and the results show the superiority of RCMMFE. Based on that, RCMMFE was applied to the fault diagnosis of rolling bearings by combining LS for feature selection and PSO-SVM for intelligent fault classification. The proposed fault diagnosis method was also applied to the multi-channel experiment data analysis by comparing it with MMSE- and MMFE-based multi-channel signal analysis methods, as well as MSE- and MFE-based single channel data analysis ones. The results show that the proposed fault diagnosis method based on RCMMFE gets the highest fault identification rate among the mentioned methods. In conclusion, though multivariate multiscale entropy-based complexity theories have developed fast with applications in EMG, brain and physiological complexity analysis, they haven’t been applied widely in mechanical fault diagnosis and there are still some problems that need to be discussed, such as parameter presettings and the influence and number selection of features. We will study these factors in our future work.
Acknowledgments
This work was supported by the National Natural Science Foundation of China (No. 51505002), National Key Technologies Research and Development Program of China (No. 2017YFC0805103) and the Key Program of Natural Science Research of Higher Education in Anhui Province of China (No. KJ2015A080) and Anhui Provincial Natural Science Foundation of China (No. 1708085QE107).
Author Contributions
Deyu Tu and Tao Liu conceived and designed the experiments; Haiyang Pan and Xiaolei Hu performed the experiments; Qingyun Liu and Jinde Zheng analyzed the data; Jinde Zheng contributed reagents/materials/analysis tools; Jinde Zheng wrote the paper.
Conflicts of Interest
The authors declare no conflict of interest.
Nomenclature
| AppEn | approximate entropy |
| SampEn | sample entropy |
| MSE | multiscale sample entropy |
| MFE | multiscale fuzzy entropy |
| MvFE | multivariate fuzzy entropy |
| MSampEn | multivariate sample entropy |
| LS | Laplacian score |
| MMFE | multivariate multiscale fuzzy entropy |
| DE | drive end |
| FE | fan end |
| OR | outer race fault |
| BE | ball element fault |
| IR | inner race fault |
| Norm | normal rolling bearing |
| WGN | white Gaussian noise |
| PSO-SVM | particle swarm optimization support vector machine |
| r | Similar tolerance |
| Distance function | |
| similarity degree function | |
| fuzzy membership function | |
| the probability that any two multivariate composite delay vectors are similar in embedding dimension m | |
| time delay | |
| N | length of data |
| p | number of channel |
| p channel time series | |
| multivariate composite delay vector | |
| embedding dimension vector | |
| embedding dimension |
References
- Li, P.; Liu, C.-Y.; Li, L.-P.; Ji, L.-Z.; Yu, S.-Y.; Liu, C.-C. Multiscale multivariate fuzzy entropy analysis. Acta Phys. Sin. 2013, 6, 120512. [Google Scholar]
- Rahnejat, H.; Gohar, R. The Vibrations of Radial Ball Bearings. ARCHIVE Proc. Inst. Mech. Eng. Part C J. Mech. Eng. Sci. 1985, 199, 181–193. [Google Scholar] [CrossRef] [Green Version]
- Lynagh, N.; Rahnejat, H.; Ebrahimi, M.; Aini, R. Bearing induced vibration in precision high speed routing spindles. Int. J. Mach. Tools Manuf. 2000, 40, 561–577. [Google Scholar] [CrossRef]
- Vafaei, S.; Rahnejat, H.; Aini, R. Vibration monitoring of high speed spindles using spectral analysis techniques. Int. J. Mach. Tools Manuf. 2002, 42, 1223–1234. [Google Scholar] [CrossRef]
- Vafaei, S.; Rahnejat, H. Indicated repeatable runout with wavelet decomposition (IRR-WD) for effective determination of bearing-induced vibration. J. Sound Vib. 2003, 260, 67–82. [Google Scholar] [CrossRef]
- Pincus, S.M. Approximate entropy as a measure of system complexity. Proc. Natl. Acad. Sci. USA 1991, 88, 2297–2301. [Google Scholar] [CrossRef] [PubMed]
- Yan, R.Q.; Gao, R.X. Approximate entropy as a diagnostic tool for machine health monitoring. Mech. Syst. Signal Process. 2007, 21, 824–839. [Google Scholar] [CrossRef]
- Richman, J.S.; Lake, D.E.; Moorman, J.R. Sample Entropy. Method Enzymol. 2004, 384, 172–184. [Google Scholar]
- Han, M.; Pan, J. A fault diagnosis method combined with LMD, sample entropy and energy ratio for roller bearings. Measurement 2015, 76, 7–19. [Google Scholar] [CrossRef]
- Costa, M.; Goldberger, A.L.; Peng, C.K. Multiscale entropy analysis of complex physiologic time series. Phys. Rev. Lett. 2002, 89, 068102. [Google Scholar] [CrossRef] [PubMed]
- Zhang, L.; Xiong, G.; Liu, H.; Zou, H.; Guo, Z. Bearing fault diagnosis using multiscale entropy and adaptive neuro-fuzzy inference. Expert Syst. Appl. 2010, 37, 6077–6085. [Google Scholar] [CrossRef]
- Liu, H.; Han, M. A fault diagnosis method based on local mean decomposition and multi-scale entropy for roller bearings. Mech. Mach. Theory 2014, 75, 67–78. [Google Scholar] [CrossRef]
- Zheng, J.; Cheng, J.; Yang, Y.; Luo, S. A rolling bearing fault diagnosis method based on multi-scale fuzzy entropy and variable predictive model-based class discrimination. Mech. Mach. Theory 2014, 78, 187–200. [Google Scholar] [CrossRef]
- Li, Y.; Xu, M.; Wang, R.; Huang, W. A fault diagnosis scheme for rolling bearing based on local mean decomposition and improved multiscale fuzzy entropy. J. Sound Vib. 2016, 360, 277–299. [Google Scholar] [CrossRef]
- Chen, W.; Wang, Z.; Xie, H.; Yu, W. Characterization of surface EMG signal based on fuzzy entropy. IEEE Trans. Neural Syst. Rehabil. Eng. 2007, 15, 266–272. [Google Scholar] [CrossRef] [PubMed]
- Kong, D.R.; Xie, H.B. Use of modified sample entropy measurement to classify ventricular tachycardia and fibrillation. Measurement 2011, 44, 653–662. [Google Scholar] [CrossRef]
- Ahmed, M.U.; Mandic, D.P. Multivariate multiscale entropy: A tool for complexity analysis of multichannel data. Phys. Rev. E 2011, 84, 3067–3076. [Google Scholar] [CrossRef] [PubMed]
- Ahmed, M.U.; Mandic, D.P. Multivariate multiscale entropy analysis. IEEE Signal Process. Lett. 2012, 19, 91–94. [Google Scholar] [CrossRef]
- Ahmed, M.U.; Rehman, N.; Looney, D.; Rutkowski, T.M.; Mandic, D.P. Dynamical complexity of human responses: A multivariate data-adaptive framework. Bull. Pol. Acad. Sci. Tech. Sci. 2012, 60, 433–445. [Google Scholar] [CrossRef]
- Azami, H.; Escudero, J. Refined composite multivariate generalized multiscale fuzzy entropy: A tool for complexity analysis of multichannel signals. Phys. A 2016, 465, 261–276. [Google Scholar] [CrossRef]
- He, X.; Cai, D.; Niyogi, P. Laplacian score for feature selection. In Advances in Neural Information Processing Systems 18; Weiss, Y., Schölkopf, B., Platt, J., Eds.; MIT Press: Cambridge, MA, USA, 2005; pp. 507–514. [Google Scholar]
- Zheng, J.; Cheng, J.; Yang, Y. Multiscale permutation entropy based rolling bearing fault diagnosis. Shock Vib. 2014, 1, 154291. [Google Scholar] [CrossRef]
- Yuan, S.F.; Chu, F.L. Fault diagnostics based on particle swarm optimization and support vector machines. Mech. Syst. Signal Process. 2007, 21, 1787–1798. [Google Scholar] [CrossRef]
- Zhu, K.; Song, X.; Xue, D. A roller bearing fault diagnosis method based on hierarchical entropy and support vector machine with particle swarm optimization algorithm. Measurement 2014, 47, 669–675. [Google Scholar] [CrossRef]
- Ahmed, M.U.; Li, L.; Cao, J.; Mandic, D.P. Multivariate multiscale entropy for brain consciousness analysis. Conf. Proc. IEEE Eng. Med. Biol. Soc. 2011, 2011, 810–813. [Google Scholar] [PubMed]
Figure 1.
MMSE, MMFE and RCMMFE comparisons of synthetic signals: (a) MMSE; (b) MMFE and (c) RCMMFE.
Figure 1.
MMSE, MMFE and RCMMFE comparisons of synthetic signals: (a) MMSE; (b) MMFE and (c) RCMMFE.

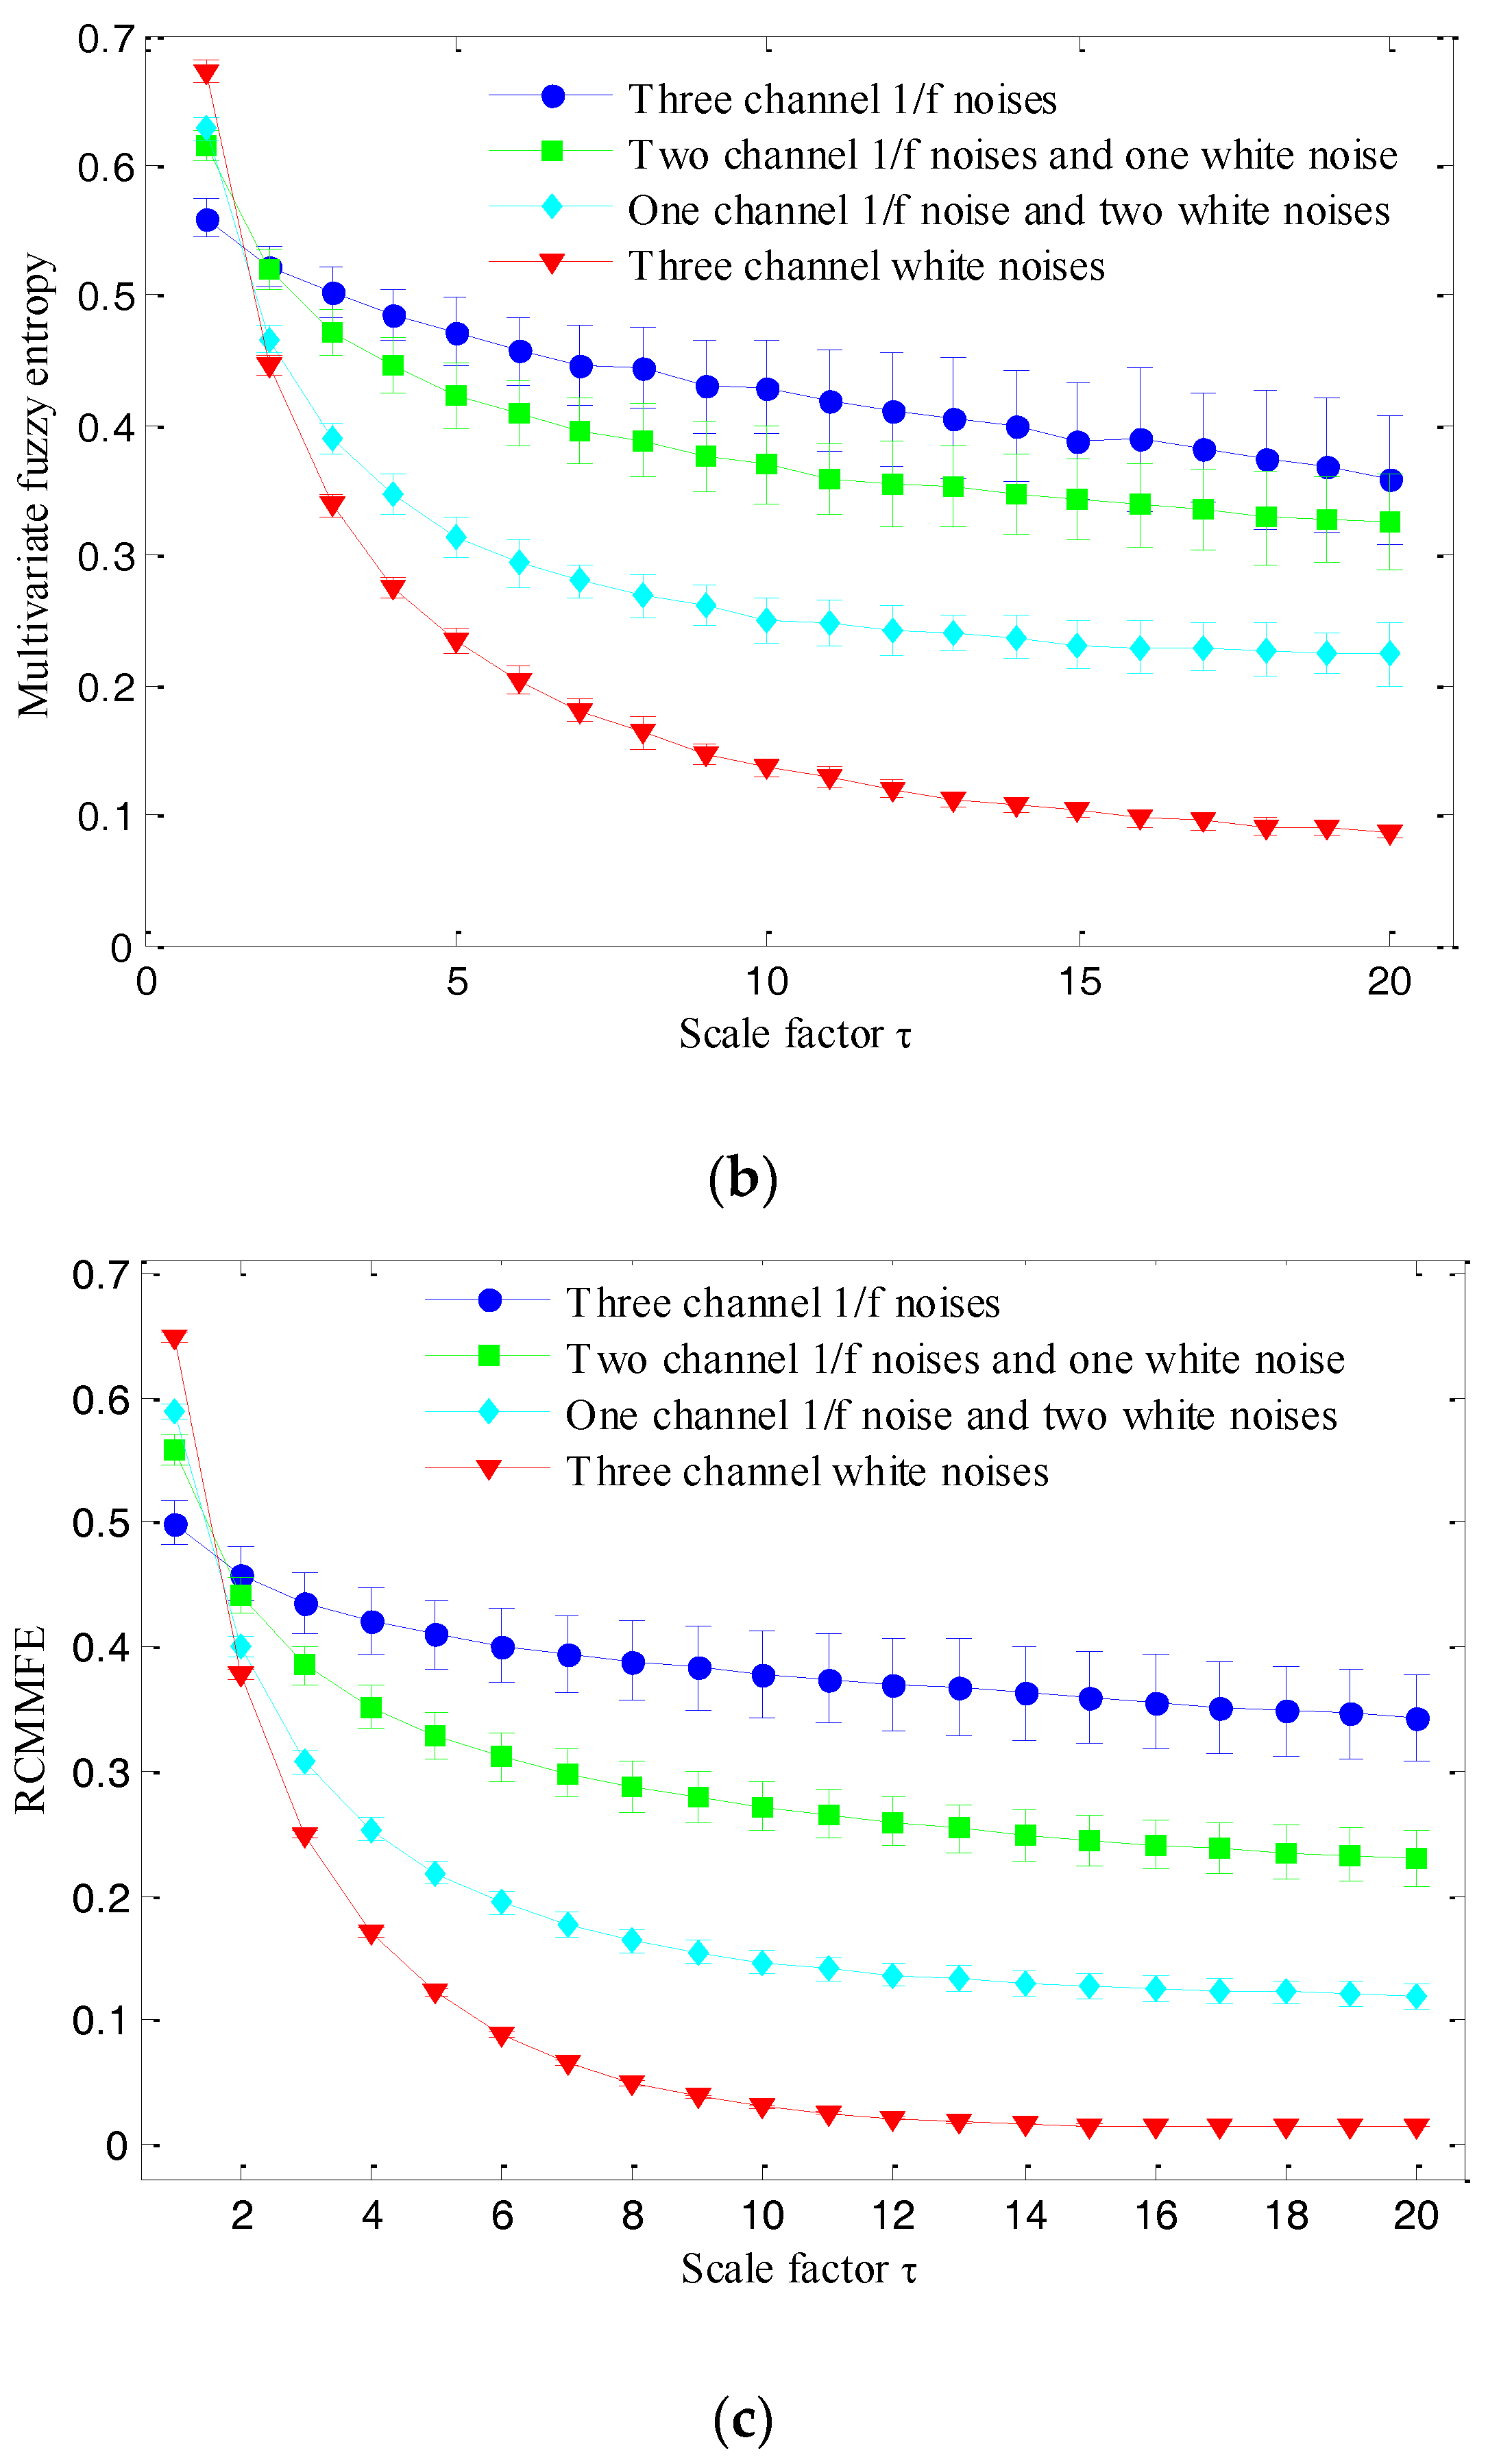
Figure 2.
Flowchart of the proposed method.
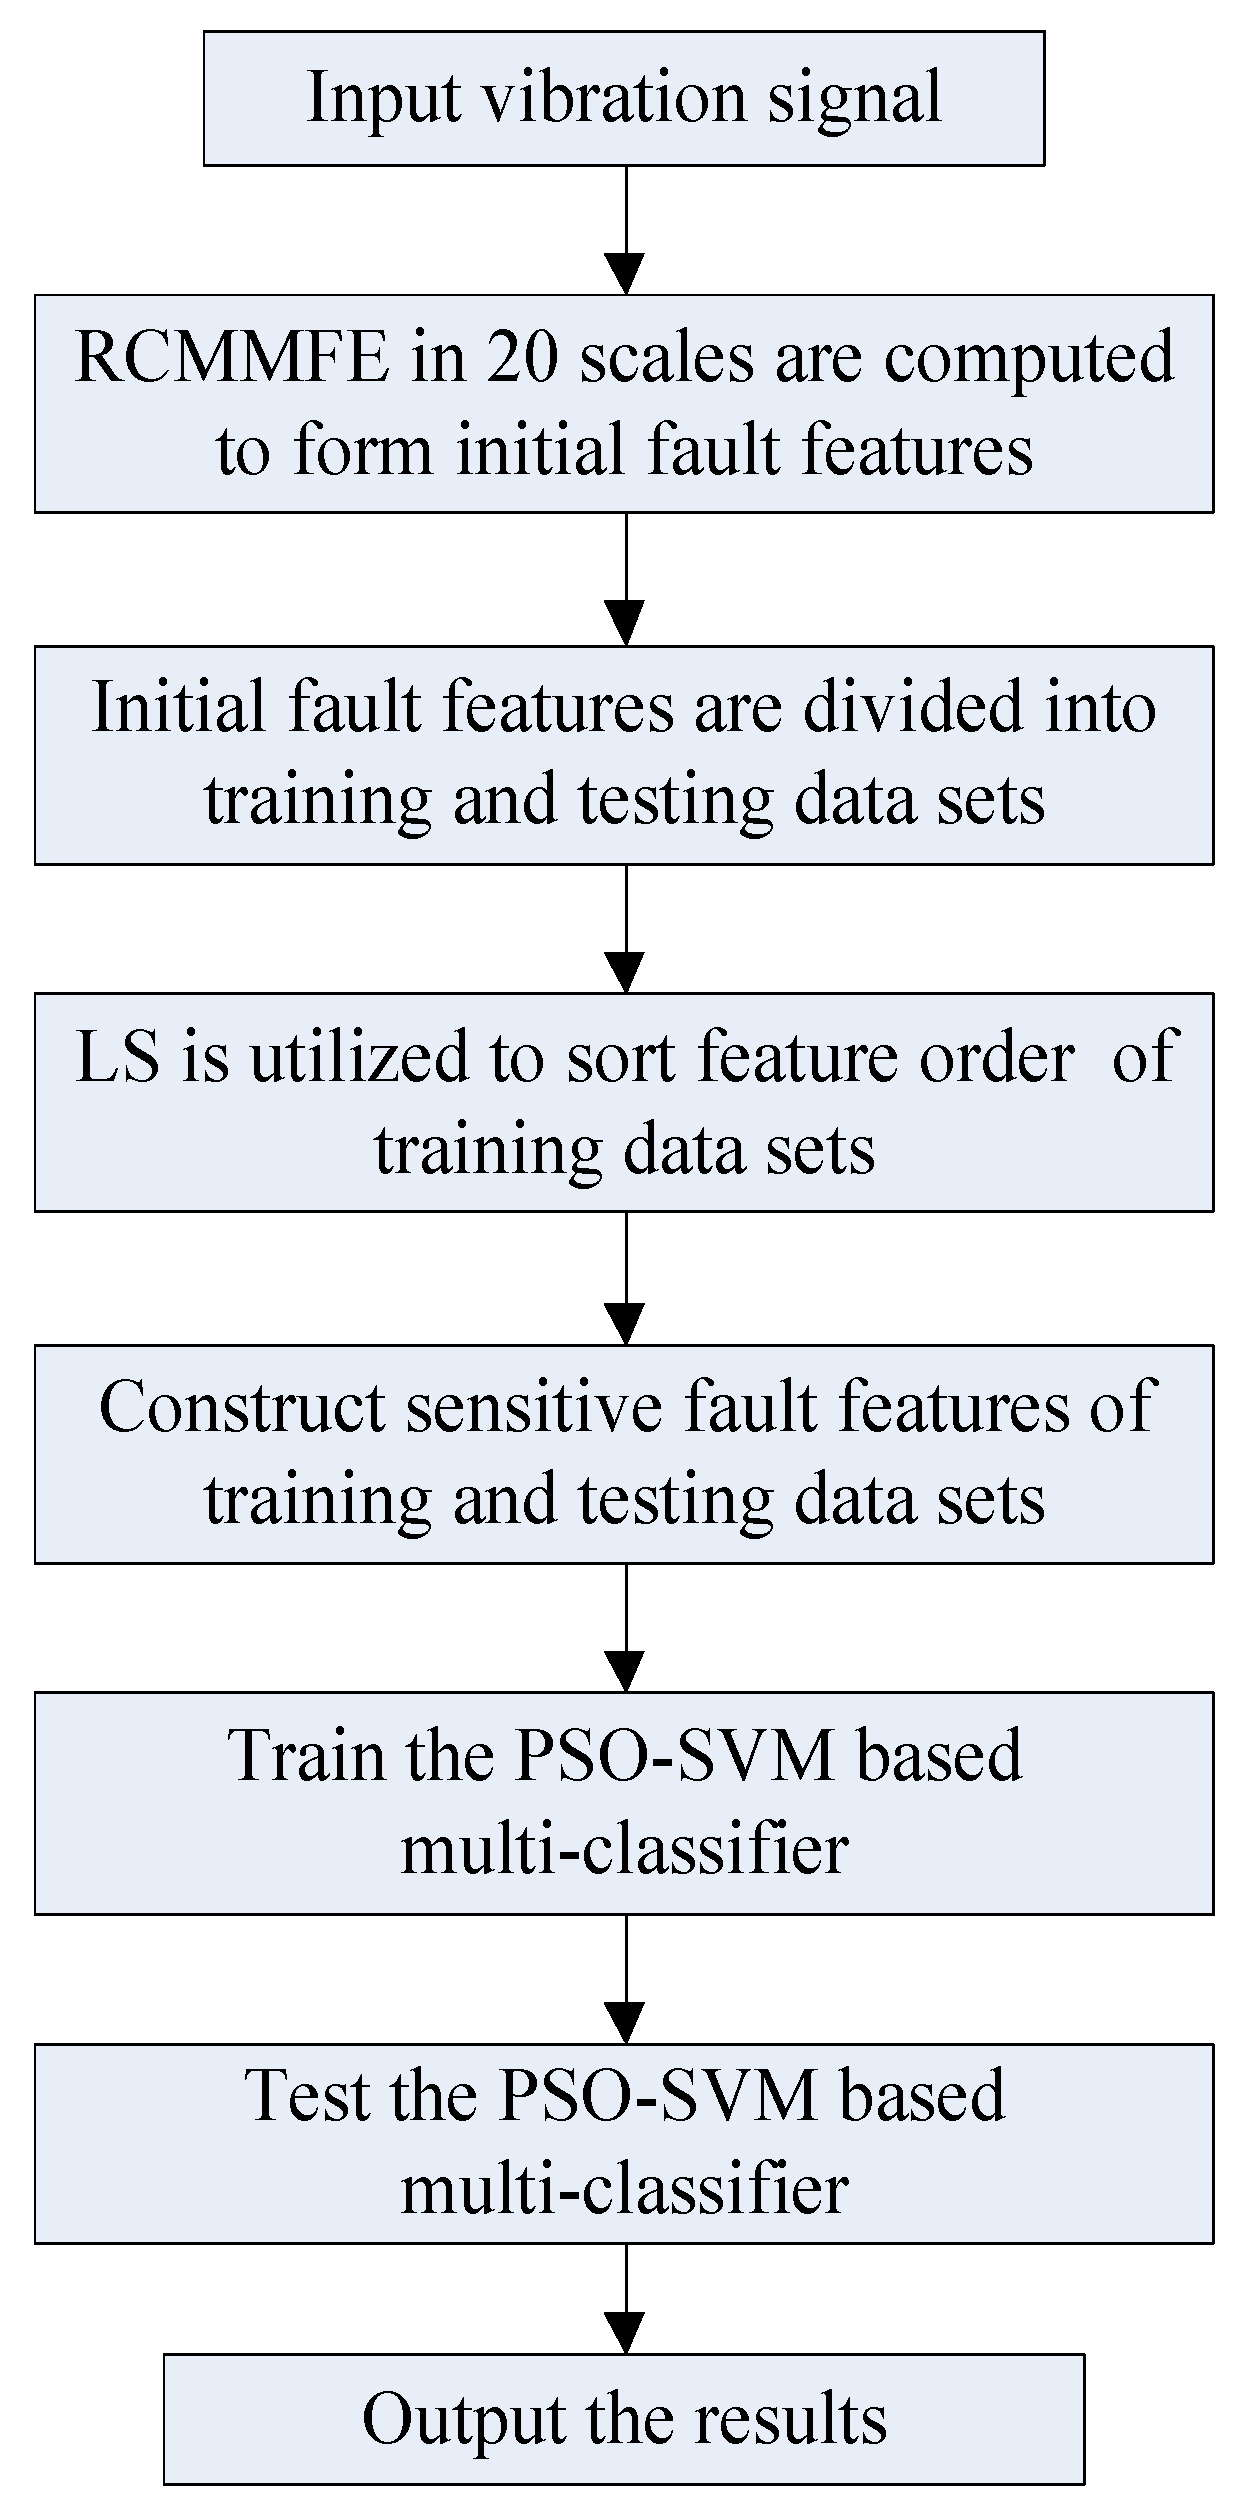
Figure 3.
The test-bed and its diagram: (a) test-bed; (b) test-bed diagram.
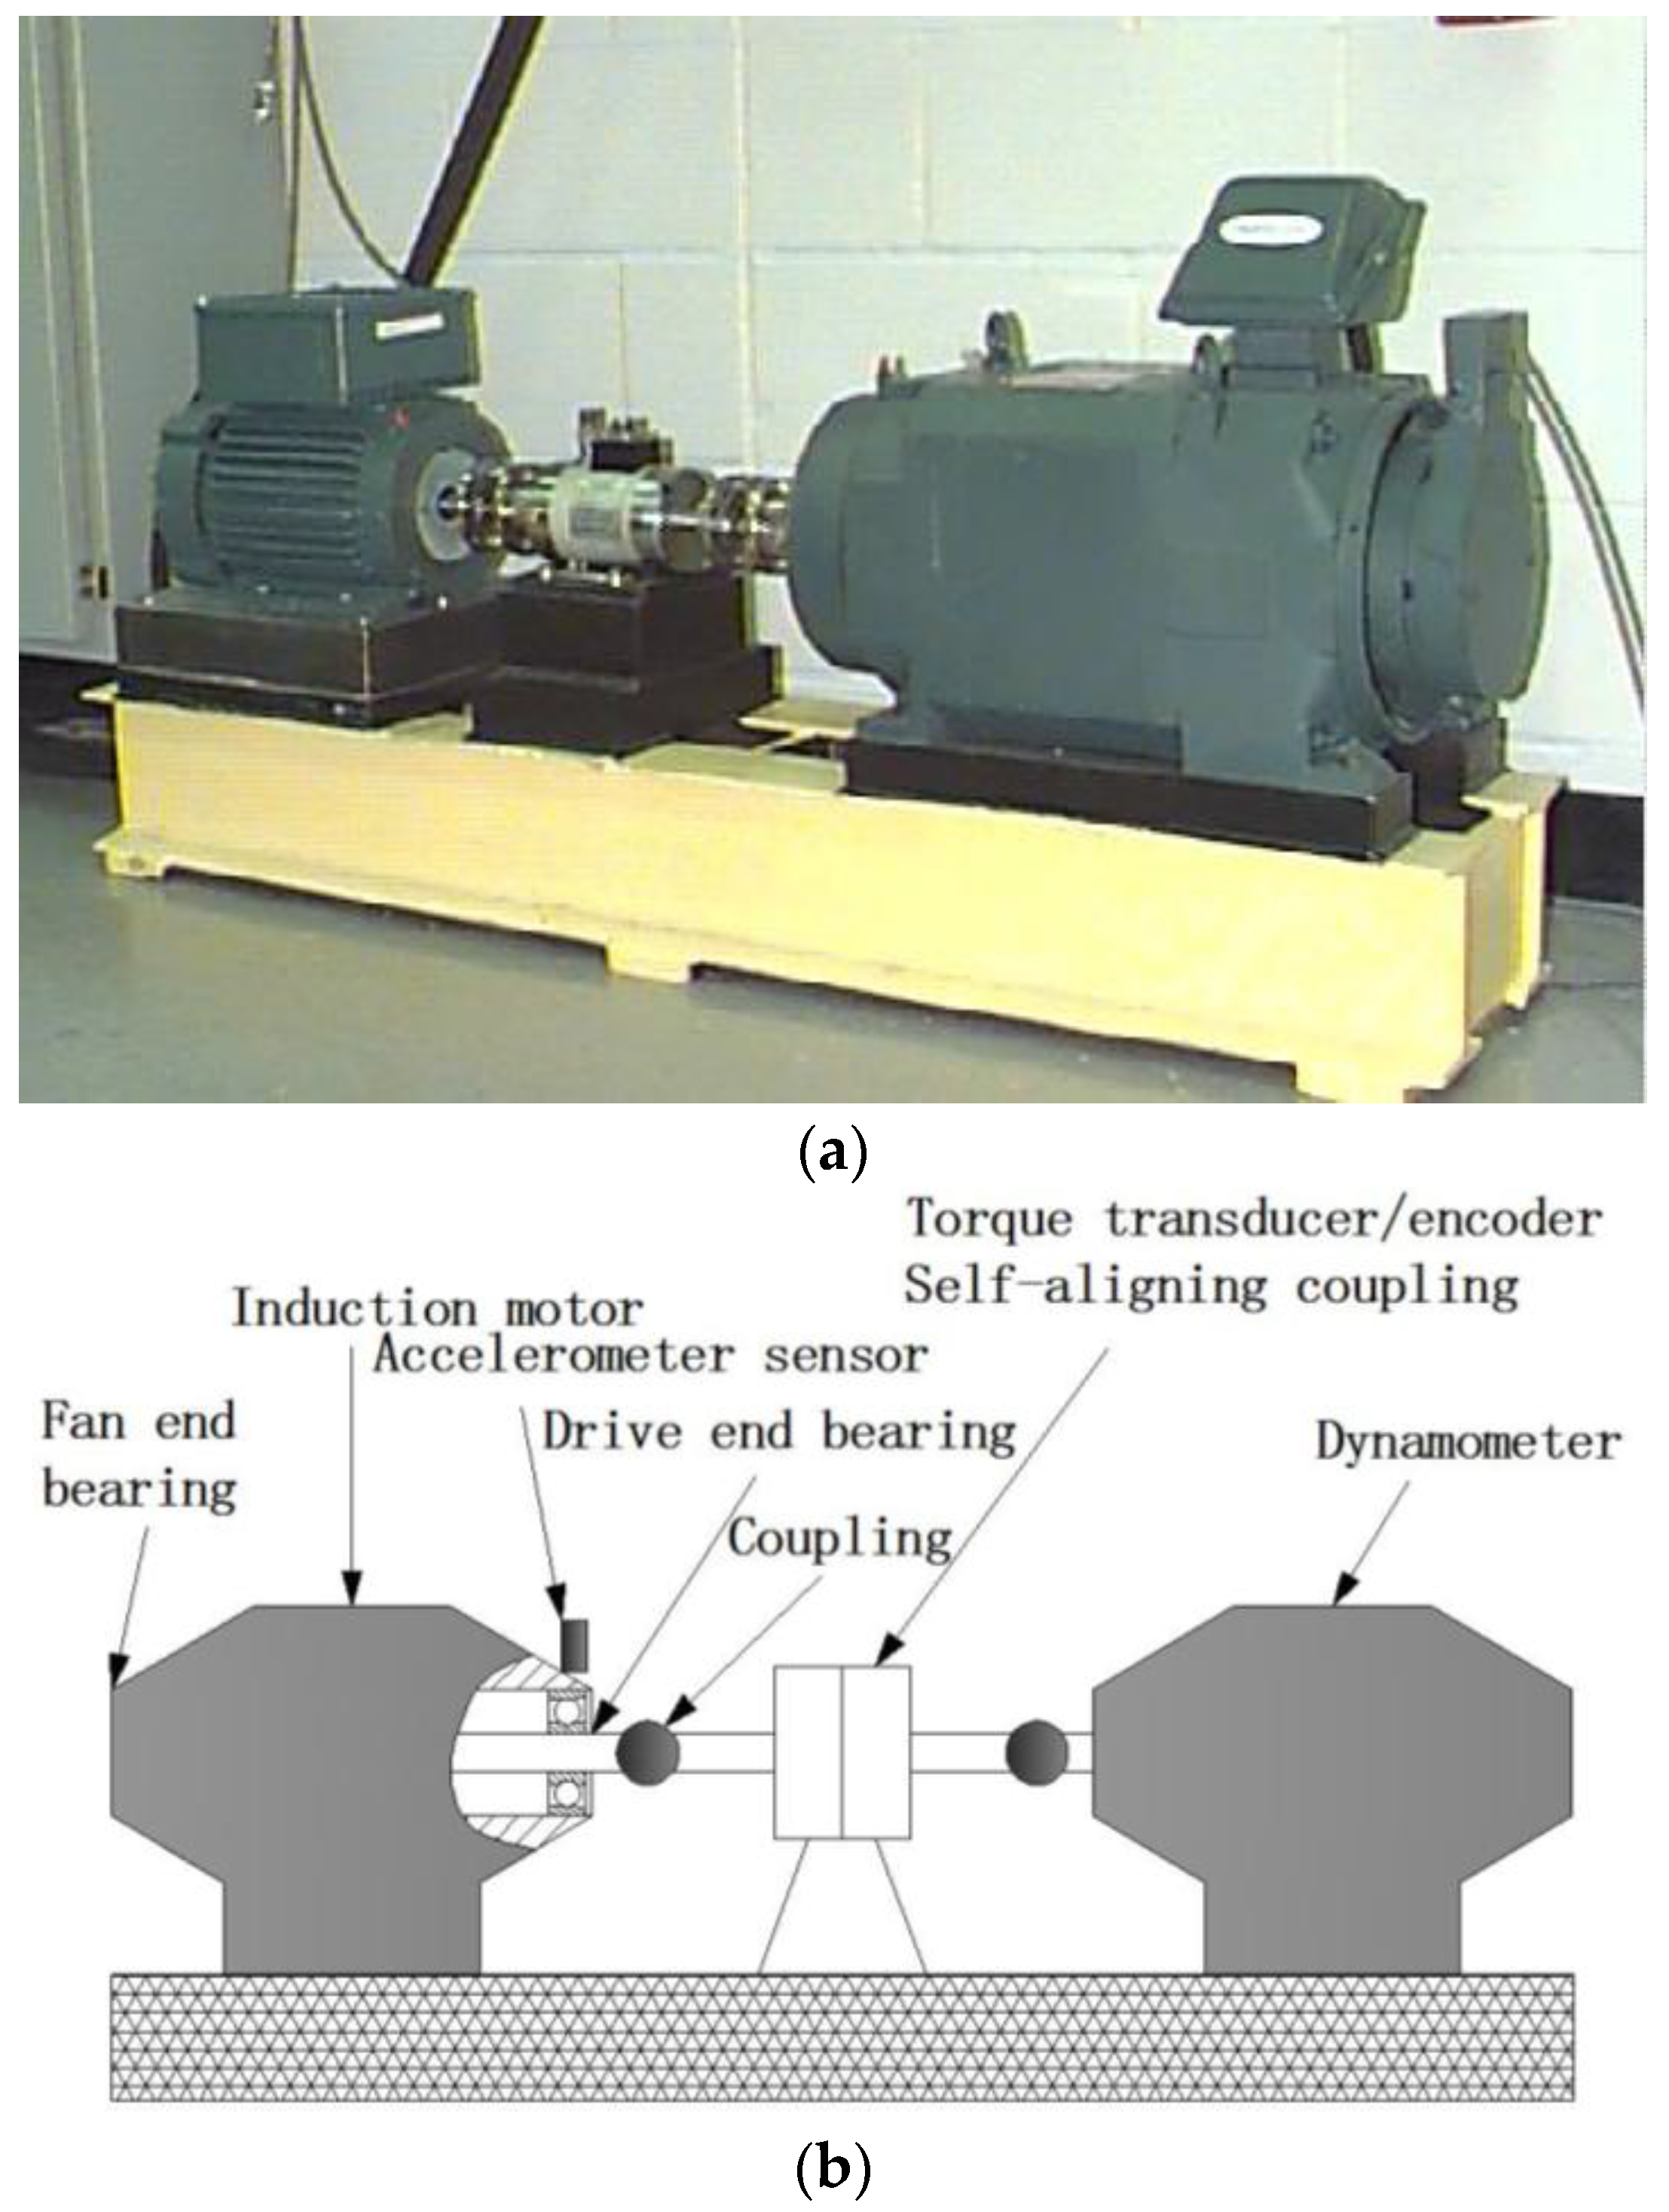
Figure 4.
The entropy results of rolling bearing data analyzed by the five methods. (a) MSE; (b) MFE; (c) MMSE; (d) MMFE; (e) RCMMFE.
Figure 4.
The entropy results of rolling bearing data analyzed by the five methods. (a) MSE; (b) MFE; (c) MMSE; (d) MMFE; (e) RCMMFE.
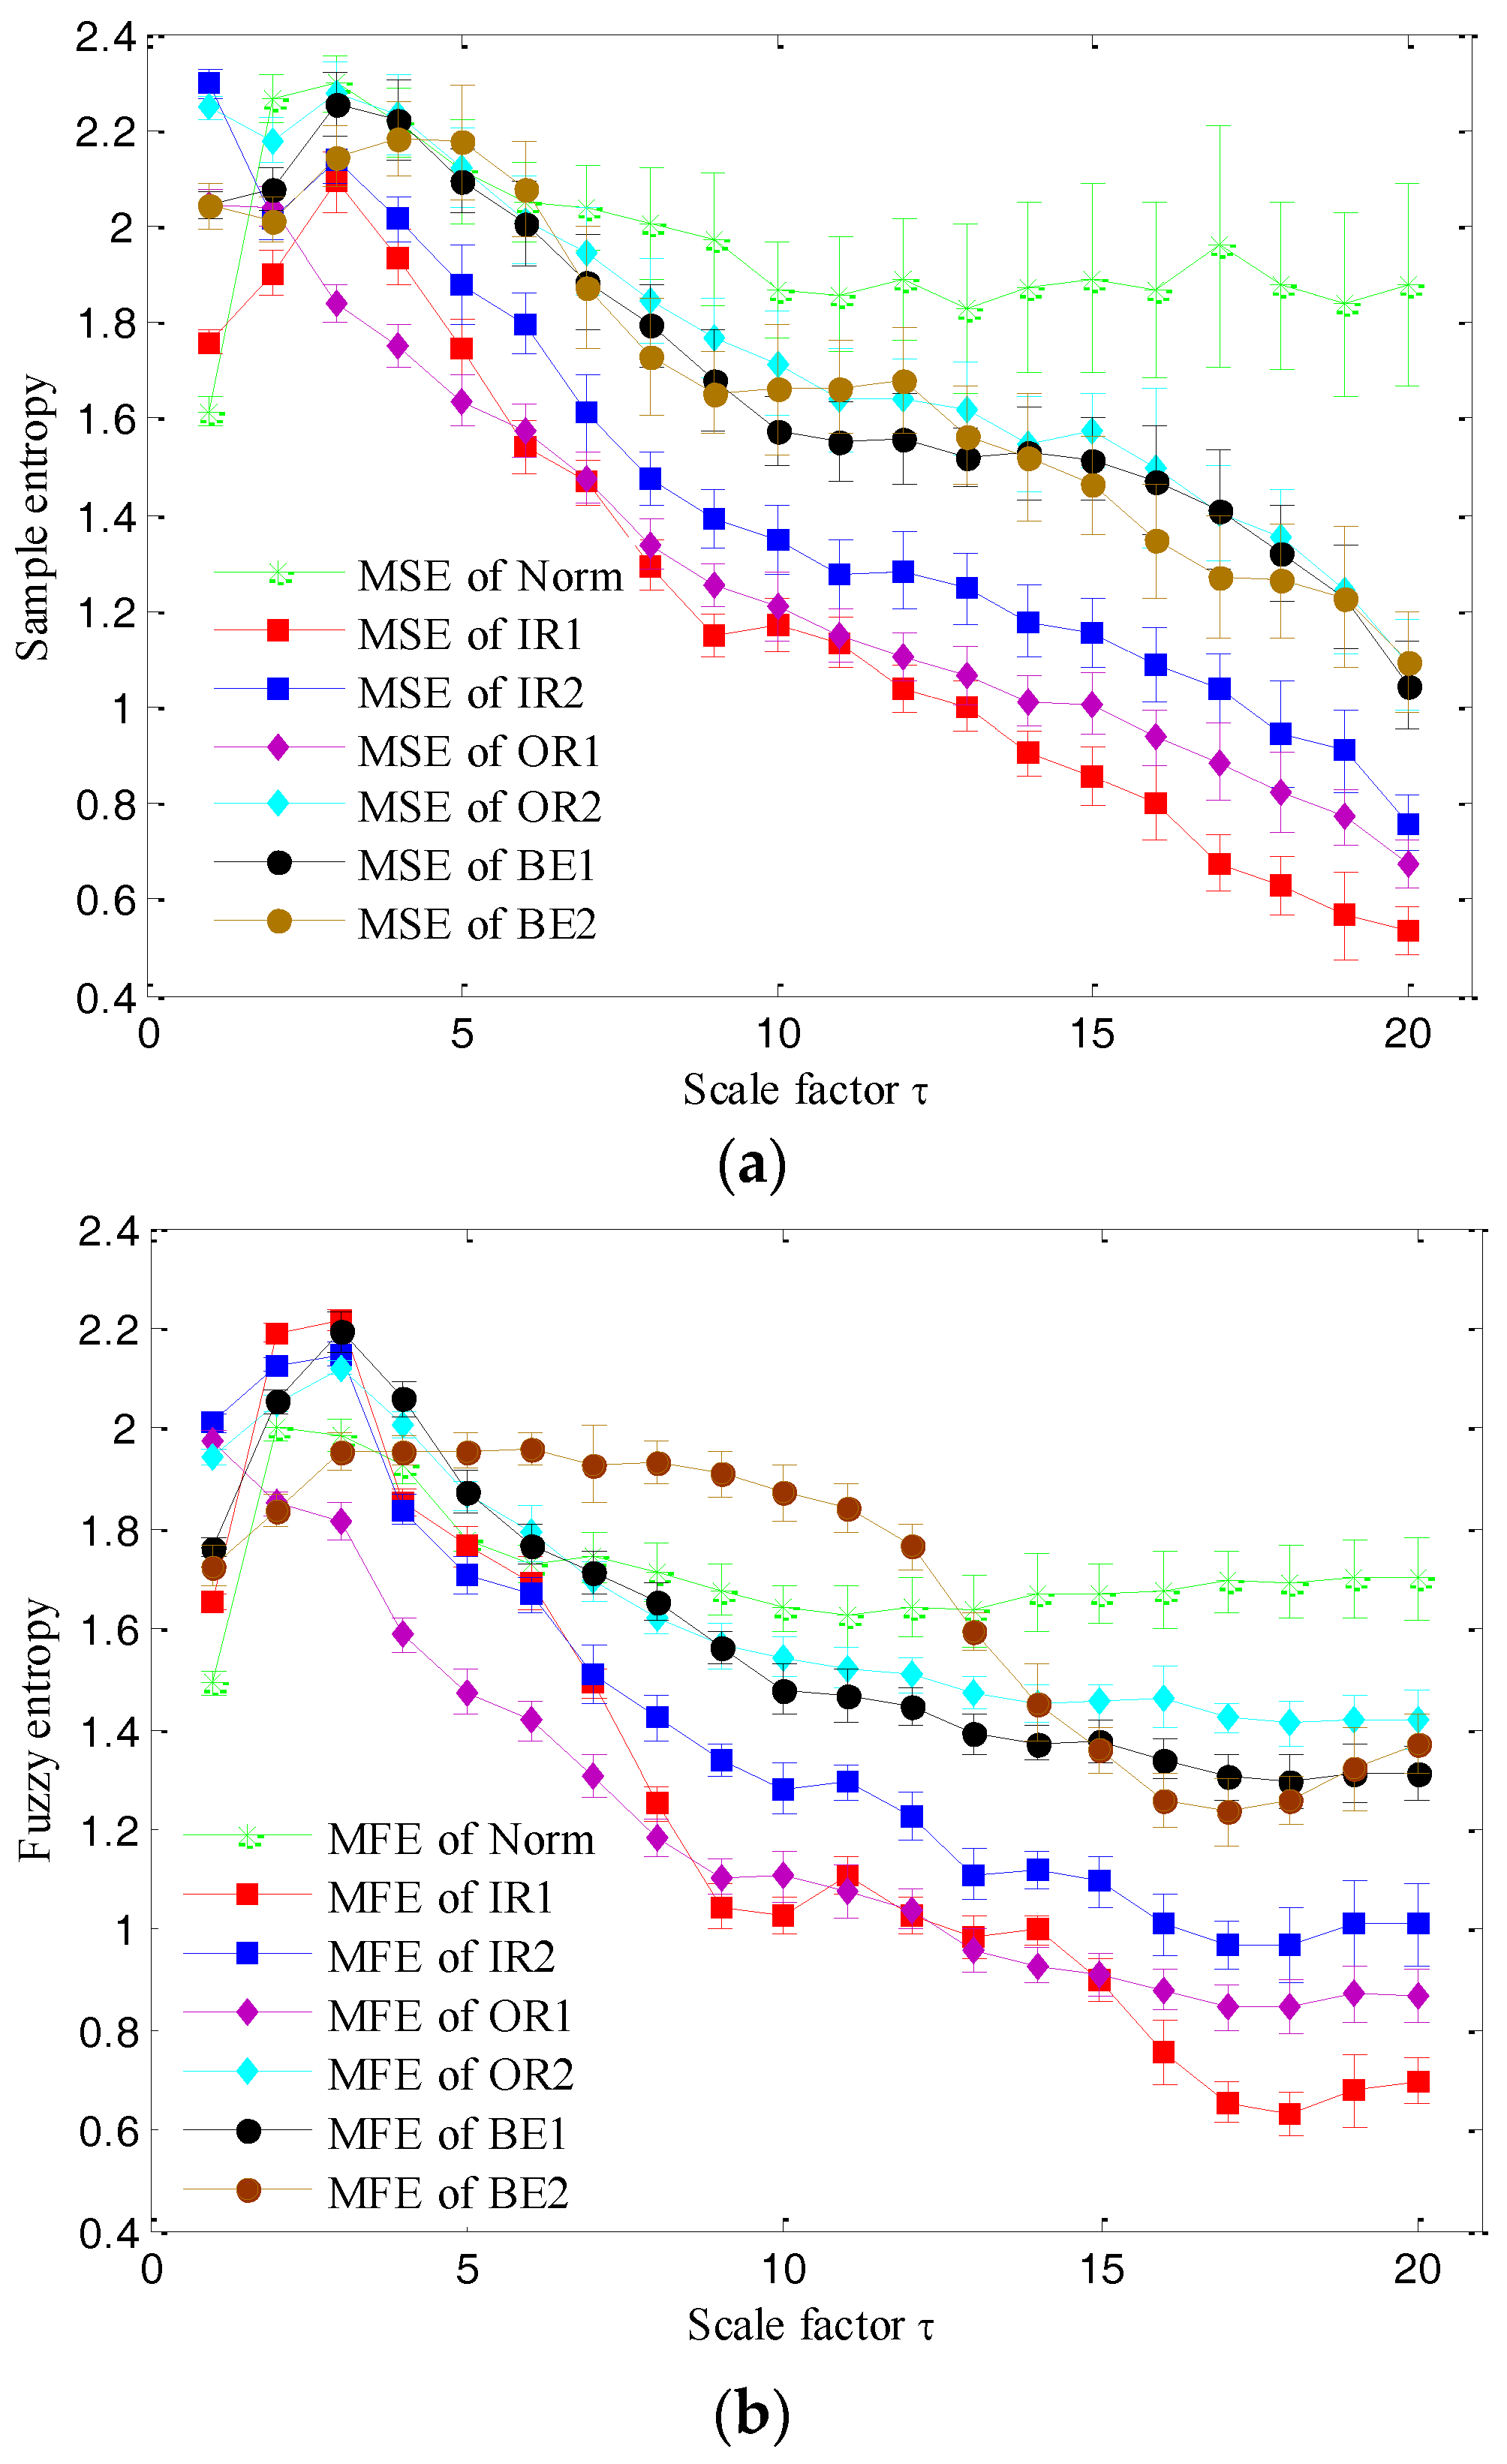

Figure 5.
Outputs of the proposed method.

Figure 6.
Outputs of MSE, MFE, MMSE and MMFE based fault diagnosis methods: (a) Output of MMFE based methods; (b) Output of MFE based methods; (c) Output of MMSE based methods; (d) Output of MSE based methods.
Figure 6.
Outputs of MSE, MFE, MMSE and MMFE based fault diagnosis methods: (a) Output of MMFE based methods; (b) Output of MFE based methods; (c) Output of MMSE based methods; (d) Output of MSE based methods.


Table 1.
Label description of experiment data of rolling bearing.
| Class Label | State | Fault Size | Training Data | Test Data |
|---|---|---|---|---|
| 1 | BE1 | 0.1778 mm | 10 | 20 |
| 2 | BE2 | 0.3556 mm | 10 | 20 |
| 3 | IR1 | 0.1778 mm | 10 | 20 |
| 4 | IR2 | 0.3556 mm | 10 | 20 |
| 5 | OR1 | 0.1778 mm | 10 | 20 |
| 6 | OR2 | 0.3556 mm | 10 | 20 |
| 7 | Norm | 0 | 10 | 20 |
Table 2.
Rate of the methods.
| Methods | Misclassified Sample Number | Identifying Rate |
|---|---|---|
| MSE-LS-PSOSVM | 40 | 71.4286% |
| MFE-LS-PSOSVM | 0 | 100% |
| MMSE-LS-PSOSVM | 10 | 92.8571% |
| MMFE-LS-PSOSVM | 0 | 100% |
| RCMMFE-LS-PSOSVM | 0 | 100% |
Table 3.
Label description of experiment data of rolling bearing when for four classes.
| Class Label | State | Training Data | Test Data |
|---|---|---|---|
| 1 | BE(BE1, BE2) | 20 | 40 |
| 2 | IR(IR1, BE2) | 20 | 40 |
| 3 | OR(OR1,BE2) | 20 | 40 |
| 4 | Norm | 10 | 20 |
Table 4.
The identification rates of the five methods for four classifications when using LS.
| Methods | No. of Misclassified Sample | Identifying Rate |
|---|---|---|
| MSE-LS-PSOSVM | 1 | 99.29% |
| MFE-LS-PSOSVM | 0 | 100% |
| MMSE-LS-PSOSVM | 6 | 95.71% |
| MMFE-LS-PSOSVM | 1 | 99.29% |
| RCMMFE-LS-PSOSVM | 0 | 100% |
Table 5.
Identifying rate comparisons of different methods without using LS for seven and four classes.
Table 5.
Identifying rate comparisons of different methods without using LS for seven and four classes.
| Methods | Identifying Rate (7 Classes) | Identifying Rate (4 Classes) |
|---|---|---|
| MSE-PSOSVM | 95% | 98.57% |
| MFE-PSOSVM | 98.57% | 99.29% |
| MMSE-PSOSVM | 95.71% | 97.86% |
| MMFE-PSOSVM | 97.14% | 100% |
| RCMMFE-PSOSVM | 99.29% | 100% |
© 2017 by the authors. Licensee MDPI, Basel, Switzerland. This article is an open access article distributed under the terms and conditions of the Creative Commons Attribution (CC BY) license (http://creativecommons.org/licenses/by/4.0/).
Share and Cite
MDPI and ACS Style
Zheng, J.; Tu, D.; Pan, H.; Hu, X.; Liu, T.; Liu, Q. A Refined Composite Multivariate Multiscale Fuzzy Entropy and Laplacian Score-Based Fault Diagnosis Method for Rolling Bearings. Entropy 2017, 19, 585. https://doi.org/10.3390/e19110585
AMA Style
Zheng J, Tu D, Pan H, Hu X, Liu T, Liu Q. A Refined Composite Multivariate Multiscale Fuzzy Entropy and Laplacian Score-Based Fault Diagnosis Method for Rolling Bearings. Entropy. 2017; 19(11):585. https://doi.org/10.3390/e19110585
Chicago/Turabian StyleZheng, Jinde, Deyu Tu, Haiyang Pan, Xiaolei Hu, Tao Liu, and Qingyun Liu. 2017. "A Refined Composite Multivariate Multiscale Fuzzy Entropy and Laplacian Score-Based Fault Diagnosis Method for Rolling Bearings" Entropy 19, no. 11: 585. https://doi.org/10.3390/e19110585
Note that from the first issue of 2016, this journal uses article numbers instead of page numbers. See further details here.