Fault Diagnosis of Rolling Bearings Based on EWT and KDEC


School of Electrical Engineering, Zhengzhou University, Zhengzhou 450001, Henan, China
*
Author to whom correspondence should be addressed.
Entropy 2017, 19(12), 633; https://doi.org/10.3390/e19120633
Submission received: 7 September 2017
/
Revised: 6 November 2017
/
Accepted: 20 November 2017
/
Published: 5 December 2017
(This article belongs to the Section Information Theory, Probability and Statistics)
Abstract
:This study proposes a novel fault diagnosis method that is based on empirical wavelet transform (EWT) and kernel density estimation classifier (KDEC), which can well diagnose fault type of the rolling element bearings. With the proposed fault diagnosis method, the vibration signal of rolling element bearing was firstly decomposed into a series of F modes by EWT, and the root mean square, kurtosis, and skewness of the F modes were computed and combined into the feature vector. According to the characteristics of kernel density estimation, a classifier based on kernel density estimation and mutual information was proposed. Then, the feature vectors were input into the KDEC for training and testing. The experimental results indicated that the proposed method can effectively identify three different operative conditions of rolling element bearings, and the accuracy rates was higher than support vector machine (SVM) classifier and back-propagation (BP) neural network classifier.

1. Introduction
Rolling-element bearing is one of the most widely used mechanical components in different kinds of rotating machines. Phenomena, such as wear, fatigue, corrosion, and overloading may locally damage the rolling bearings. A minor fault may influence the stability and safety of the whole system and even lead to its failure [1,2]. Therefore, state detection and fault diagnosis for rolling bearings are of practical significance. When faults occur in the rolling element bearing, impulse-type vibration behavior appears [3]. There are many sources of vibration of bearings [4,5], some are inherent, such as the variable compliance effect, which cannot be guarded against but can be minimized with proper preloading and interference fitting; some are simply period repetitions, such as cage frequency. Others are due to unbalances in assembly and yet others are due to the waviness of rolling surfaces (no surface is perfectly smooth). Then, there are initiators of failure, which are noted subsequently through vibration monitoring [6], such as the presence of off-sized balls or pits, dents, or cracks on rolling surfaces. These cause particular frequency to output from bearings, such as “ball spin frequency” or multiple of cage frequency. To monitor these faults, more sophisticated vibration monitoring methods, such as the vibration signal processing method is used. Moreover, the actual contribution of each fault to bearing run-out can also be determined using signal processing methods [7]. The mechanical vibration signals consist of plentiful information that is related to the system dynamical characteristics [8]. The vibration signal processing technique is one of the primary tools for rolling element bearings fault diagnosis. The operation condition of the rolling bearing is obtained by analyzing vibration signal [7,8,9]; thus, different operative conditions of rolling bearings are monitored through the vibration signal analysis method.
Due to the working environment and mechanism of the rolling bearings, the vibration signal is non-stationary and nonlinear, and it is difficult to extract the fault feature [10,11]. Conventional time-frequency analysis only applies to narrow-band signal and has significant limitations in the case of non-stationary signal and broadband signal [12,13]. When compared with the traditional time-frequency analysis, wavelet transformation performs the non-stationary signal processing better, but wavelet basis function limits the wavelet decomposition [14,15]. The widely used empirical mode decomposition (EMD) is a self-adaptive signal processing method that accurately obtains characteristic signal; however, it involves a series of problems, such as enveloping and mode mixing [16,17]. In recent years, the Empirical Wavelet Transform (EWT) for processing of non-stationary signal has been proposed [18,19,20]. EWT uses the Fourier spectrum to achieve signal decomposition within the wavelet frame. The method has sufficient theoretical basis and the decomposition process resolves the mode mixing of EMD, extracts the natural mode of vibration of the signal, and obtains the component of natural mode of vibration [21,22].
As a critical part of fault diagnosis, the classifier plays an important role in feature vector processing [23]. Bayesian classifier has been widely used in various fields due to its high ant jamming capability and high efficiency. However, the classifier ignores the dependency relationship among attributes, and it decreases the classification accuracy by assuming the independence of an attribute with respect to other attributes [24,25]. In the field of nondestructive testing, the back propagation (BP) neural networks classifier is used in the acoustic emission test at the bottom of the tank. Riahi et al. [26] distinguished among the signals of different corrosion stages. Zhang Xiaoyuan et al. [8] classified different operating conditions of the bearing using an improved support vector machine (SVM) classifier and proposed a motor bearing fault detection method. However, the BP classifier has many drawbacks, such as a large number of parameter settings and slow convergence, which reduces its diagnosis accuracy. In the case of small samples, SVM classifier can achieve higher accuracy than BP classifier, but requires the pre-selection of basic kernel functions. This significantly restricts the SVM application [27,28,29]. Kernel density estimation classifier (KDEC) method is used for studying the distribution characteristics starting from the data; it is widely used in the engineering field due to its high efficiency, and it has no requirements for data distribution [30,31,32]. Hence, by the advantages of mutual information in measuring the similarities in random variables, based on kernel density estimation and mutual information a classifier is proposed. The feature vector of complex signal is processed and its density function is estimated. The density function is calculated using the feature vector, and the similarity is also computed by mutual information. Therefore, a classifier based on Kernel density estimation (KDE) and mutual information is proposed to identify different fault types.
To address the shortcomings in these fault diagnosis methods, this study proposes a novel fault diagnosis method based on EWT and KDEC. Regarding this novel method, the vibration signal is analyzed by EWT first; then, the accurate mode components are obtained. In addition, the root mean square (RMS), kurtosis, and skewness of the F component are calculated and are combined into the feature vector. The KDE and mutual information are combined to achieve the kernel density estimation classification. Finally, the feature vector is input to the KEDC for training and testing to complete the fault diagnosis of rolling bearings.
The rest of this paper is arranged as follows: Section 2 illustrates the EWT method and simulations. Section 3 presents the proposed classification using KDE and mutual information. Section 4 introduces the proposed fault diagnosis method of rolling bearing. In Section 5, the experimental results of the proposed fault-detection scheme are analyzed.
2. EWT Decomposition Method
2.1. EWT Principle
In 2013, Gilles et al. [19,20,21] proposed the empirical wavelet transform, a self-adaptive signal processing method. Namely, EWT can obtain a series of frequency modulation signals and amplitude modulation signals by self-adaptive segmentation of the signal frequency spectrum [26]. The mathematical expression of complex decomposed signal is:
where is decomposed component, and is frequency-modulated amplitude-modulated signal, is complex decomposed signal.
The empirical wavelet transform provides the wavelet filter bank by self-adaptive segmentation of the Fourier spectrum of the signal. In this method [26], it is firstly supposed that Fourier supports segmentation of N continuous parts in a segmentation interval , (, ), and the boundary is , then, . The center and width of the partitioned graph are and , respectively. The determined segmentation interval is , the empirical wavelet defines the band-pass filter on each section of . Based on this concept, Gilles reconstructed an empirical wavelet using the Meyer wavelet reconstruction method. For each n that is greater than 0, the empirical scaling function and the empirical wavelet function can be expressed as:
where is the empirical scaling function, and is the empirical wavelet function.
where is width, is related function, and is a parameter.
Assuming that the Fourier transform and the inverse Fourier transform are and , respectively, the components of the empirical wavelet are obtained by using the empirical wavelet basis function and the inner product of the signal. The expression is as follows:
In Equation (7), is high-frequency component of the empirical wavelet. Then, the low-frequency component can also be obtained from the inner product of the signal by the empirical scale function:
where is low-frequency component of the empirical wavelet. Finally, the reconstructed original signal is obtained from the sum of high-frequency and low-frequency components [26]:
where and are Fourier transformations of and , respectively. Thus, the mathematical expressions of the frequency-modulated amplitude-modulated signal are as follows:
The decomposed components are . Complex signals are decomposed into a series of components from high to low frequency by EWT, which are then processed to obtain the instantaneous frequency and the instantaneous amplitude.
2.2. Analysis of the Simulation Signal
An analysis of the simulation signal was performed to verify the algorithm. The mathematical expressions of simulation signal are as follows:
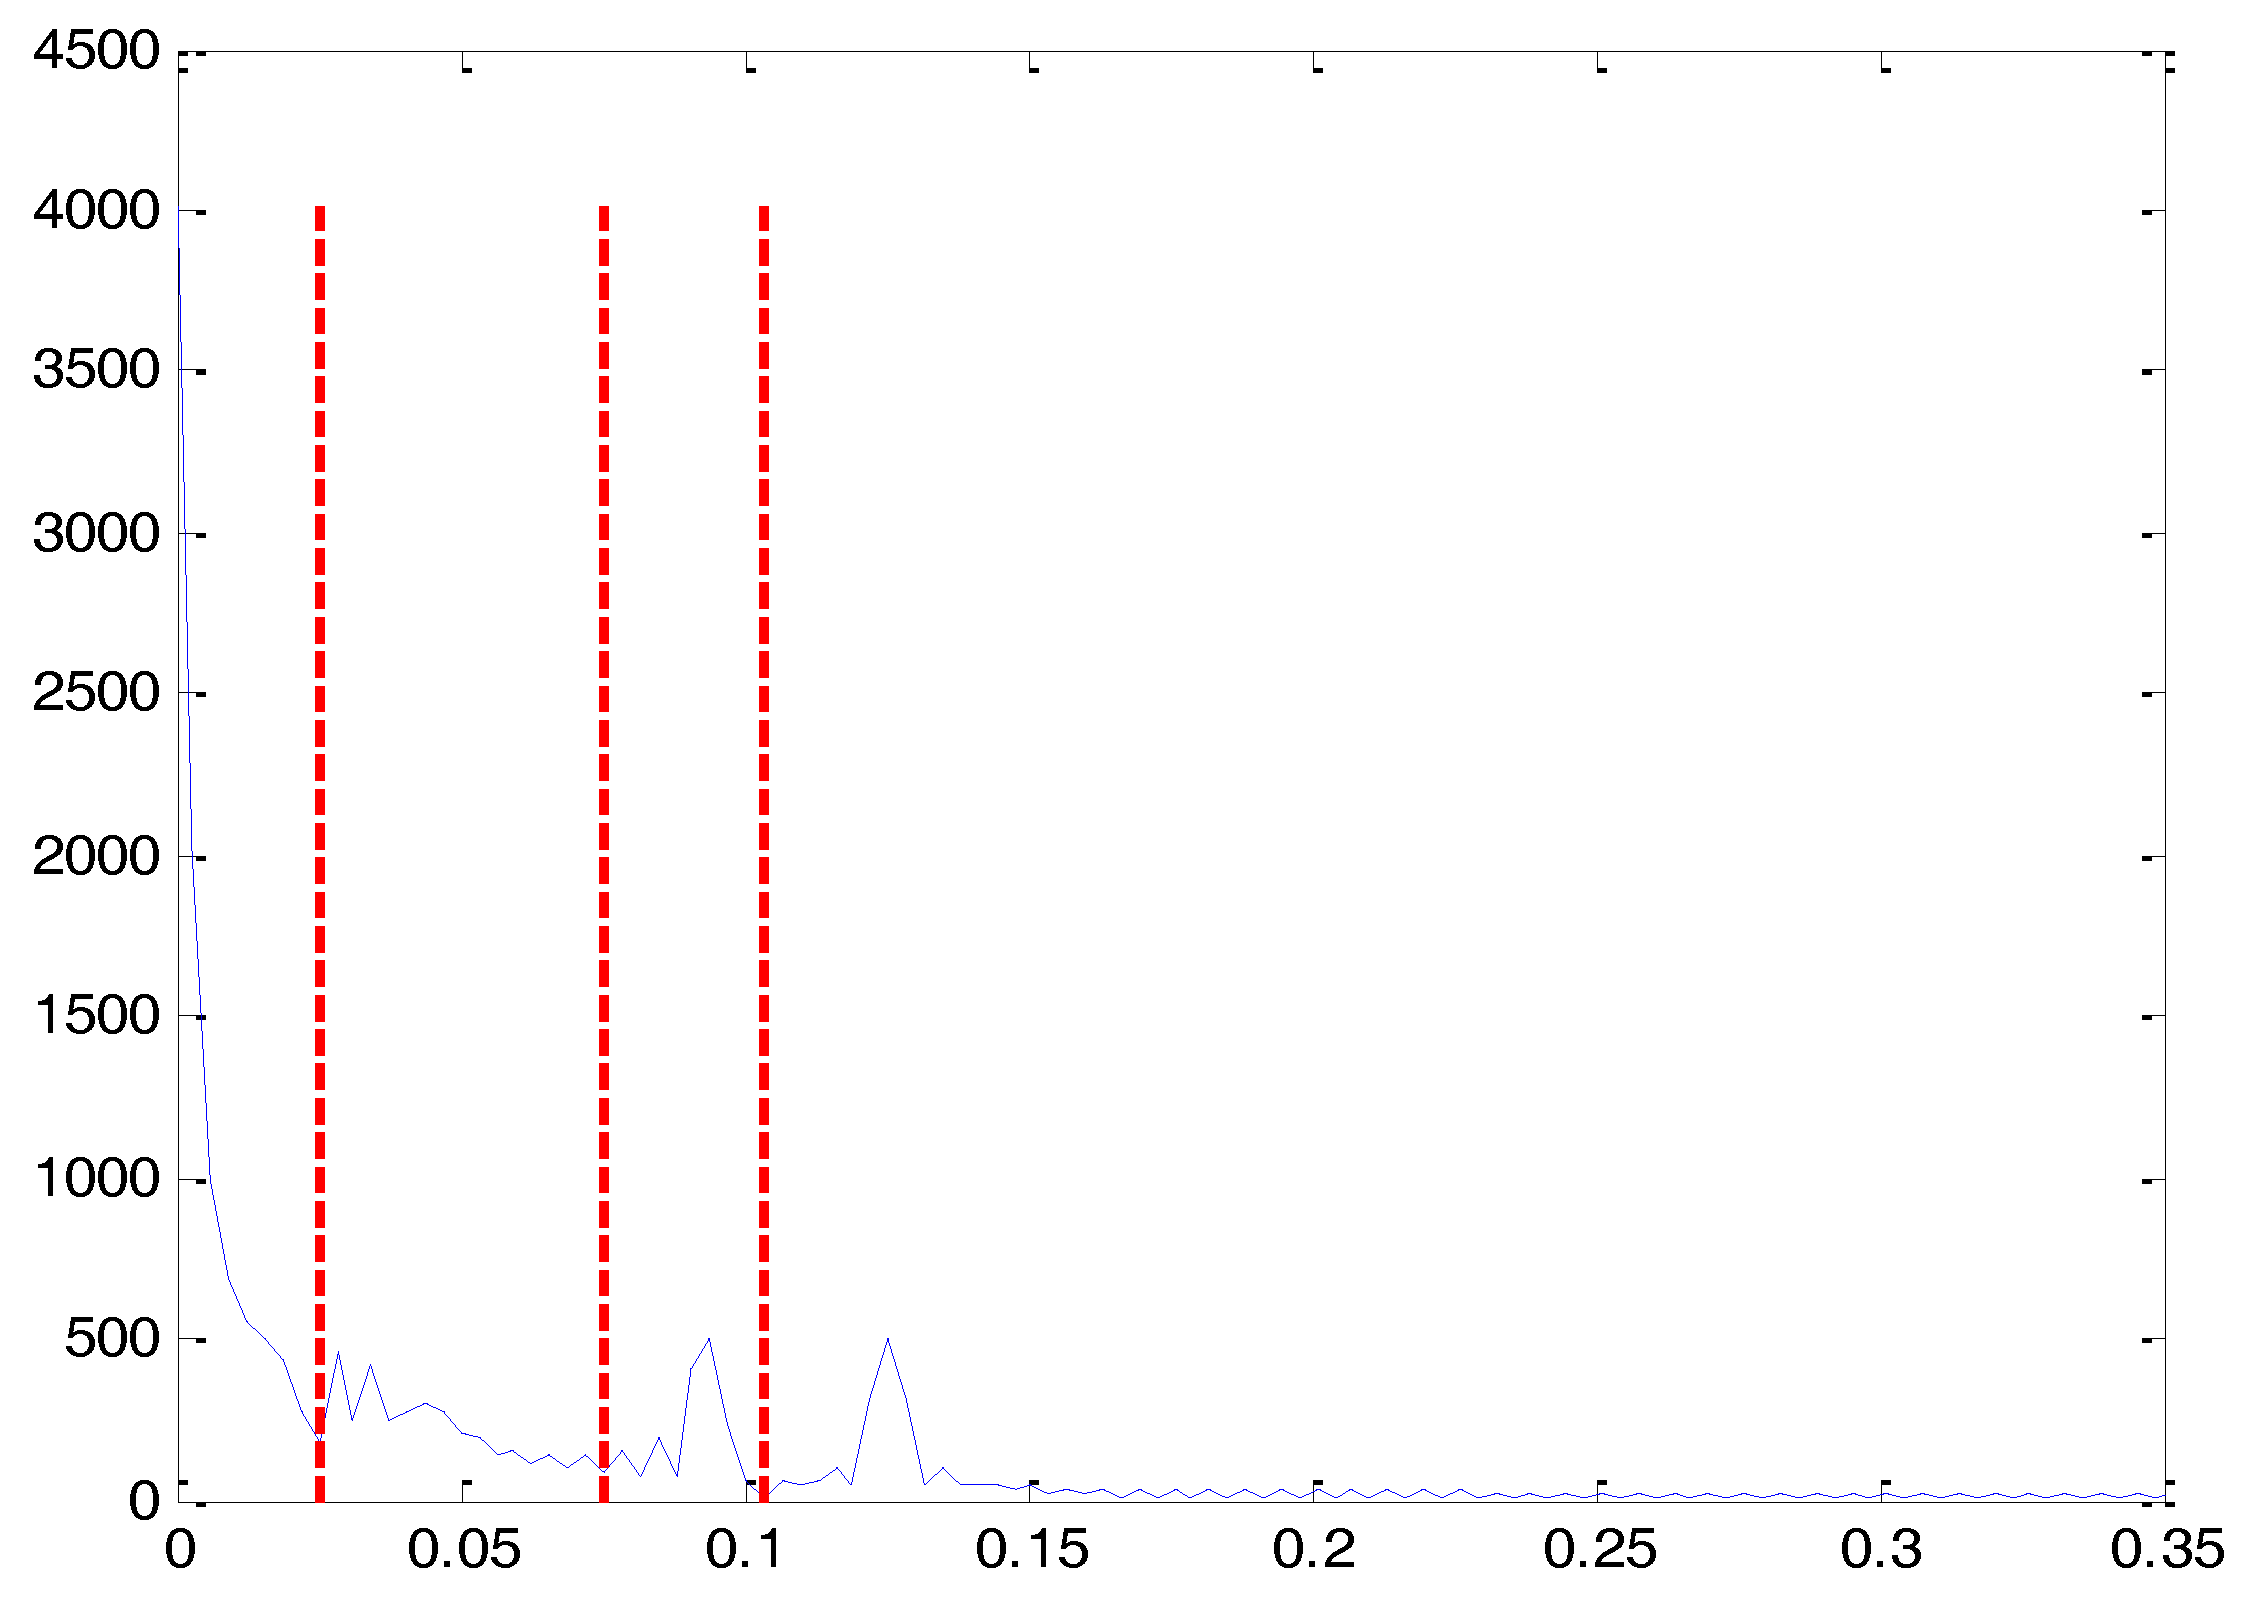
where are components at three different frequencies, is time and is the composite signal consisting of the first three signals (see Figure 1). The EMD method and EWT method were used to process the signal. The frequency spectrum of the simulation signal is presented Figure 2. In addition, the obtained decomposition results of the EWT and EMD are shown in Figure 3 and Figure 4, respectively.
When compared to the recursive “screening” mode of the EMD, EWT can non-recursively decompose multi-component signals into a number of components, thus controlling the decomposition convergence conditions reasonably. Hence, the EWT method can effectively eliminate the mode-mixing phenomenon. Figure 3 shows the simulated test signals. It can be seen that the EMD overestimates the number of modes and then separates some information that is originally part of the same component. Except for the high frequencies, it is difficult to interpret the EMD outputs as compared with the known “true” components constituting the test signals. Concerning the results given by the EWT, we can see that it is able to detect the presence of modes in the spectrum and provide different components that are close to the original ones. However, in the case we can note that the algorithm separates the two last modes that were originally parts of the same component. In fact, this is not completely surprising as those modes have significant individual energy and can be considered as independent modes [18]. Hence, EWT is more effective in decomposing signal and can separate components of different frequencies more accurately than EMD.
3. Classifier Based on the Kernel Density Estimation
In order to achieve more accurate identification, the classifiers are used to identify the operation conditions of rolling bearing. Due to the slow convergence and a large number of parameters set shortcomings, the diagnosis accuracy of BP classifier is low, and thus its practical application is limited [26]. As support vector machines need to determine the kernel function, the large-scale classification training time will be longer [27]. Therefore, it is necessary to develop the new classifiers to identify the fault characteristics and to determine the fault type of rolling bearing.
3.1. Kernel Density Estimation and Mutual Information
The kernel density estimation (KDE) solves the unknown density function of the random variable for a given set of sample points and receives wide attention from scholars because no conditions are required to be set for the data distribution [30]. A particular internal relationship exists between kernel densities of different types of signal. Besides, such a relationship is substantially different in various types of signal, and mutual information can be used to measure it. The values and degrees of correlation between the signal kernel densities are different [33]. Therefore, by combining the advantages of KDE and mutual information, this paper proposes a classifier that is based on kernel density estimation. In terms of data , the kernel density estimation is defined as:
where is probability distribution, is kernel function, and h is bandwidth. The Gaussian kernel function acts as the kernel function for kernel density estimation. Bandwidth h is 0.15 times that the predicted confidence interval of variable x to prevent excessive deviation and variance.
According to Equation (13), the probability density functions of the two random variables X and Y are, of which the mutual information I(X,Y) can be expressed as:
where pX(x) and pY(y) are marginal probability function of the random variable X and Y, respectively, is the mutual information.
3.2. Basic Principle of Classifier
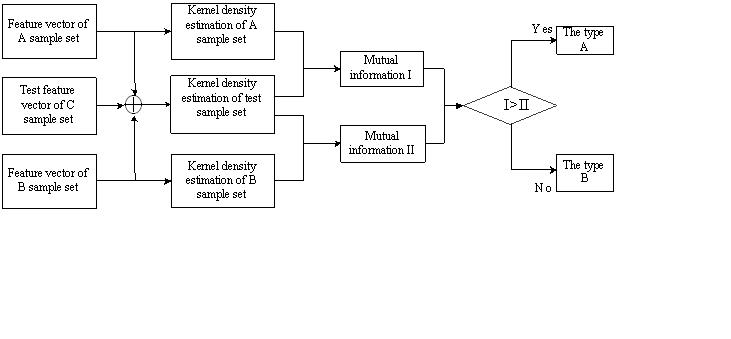
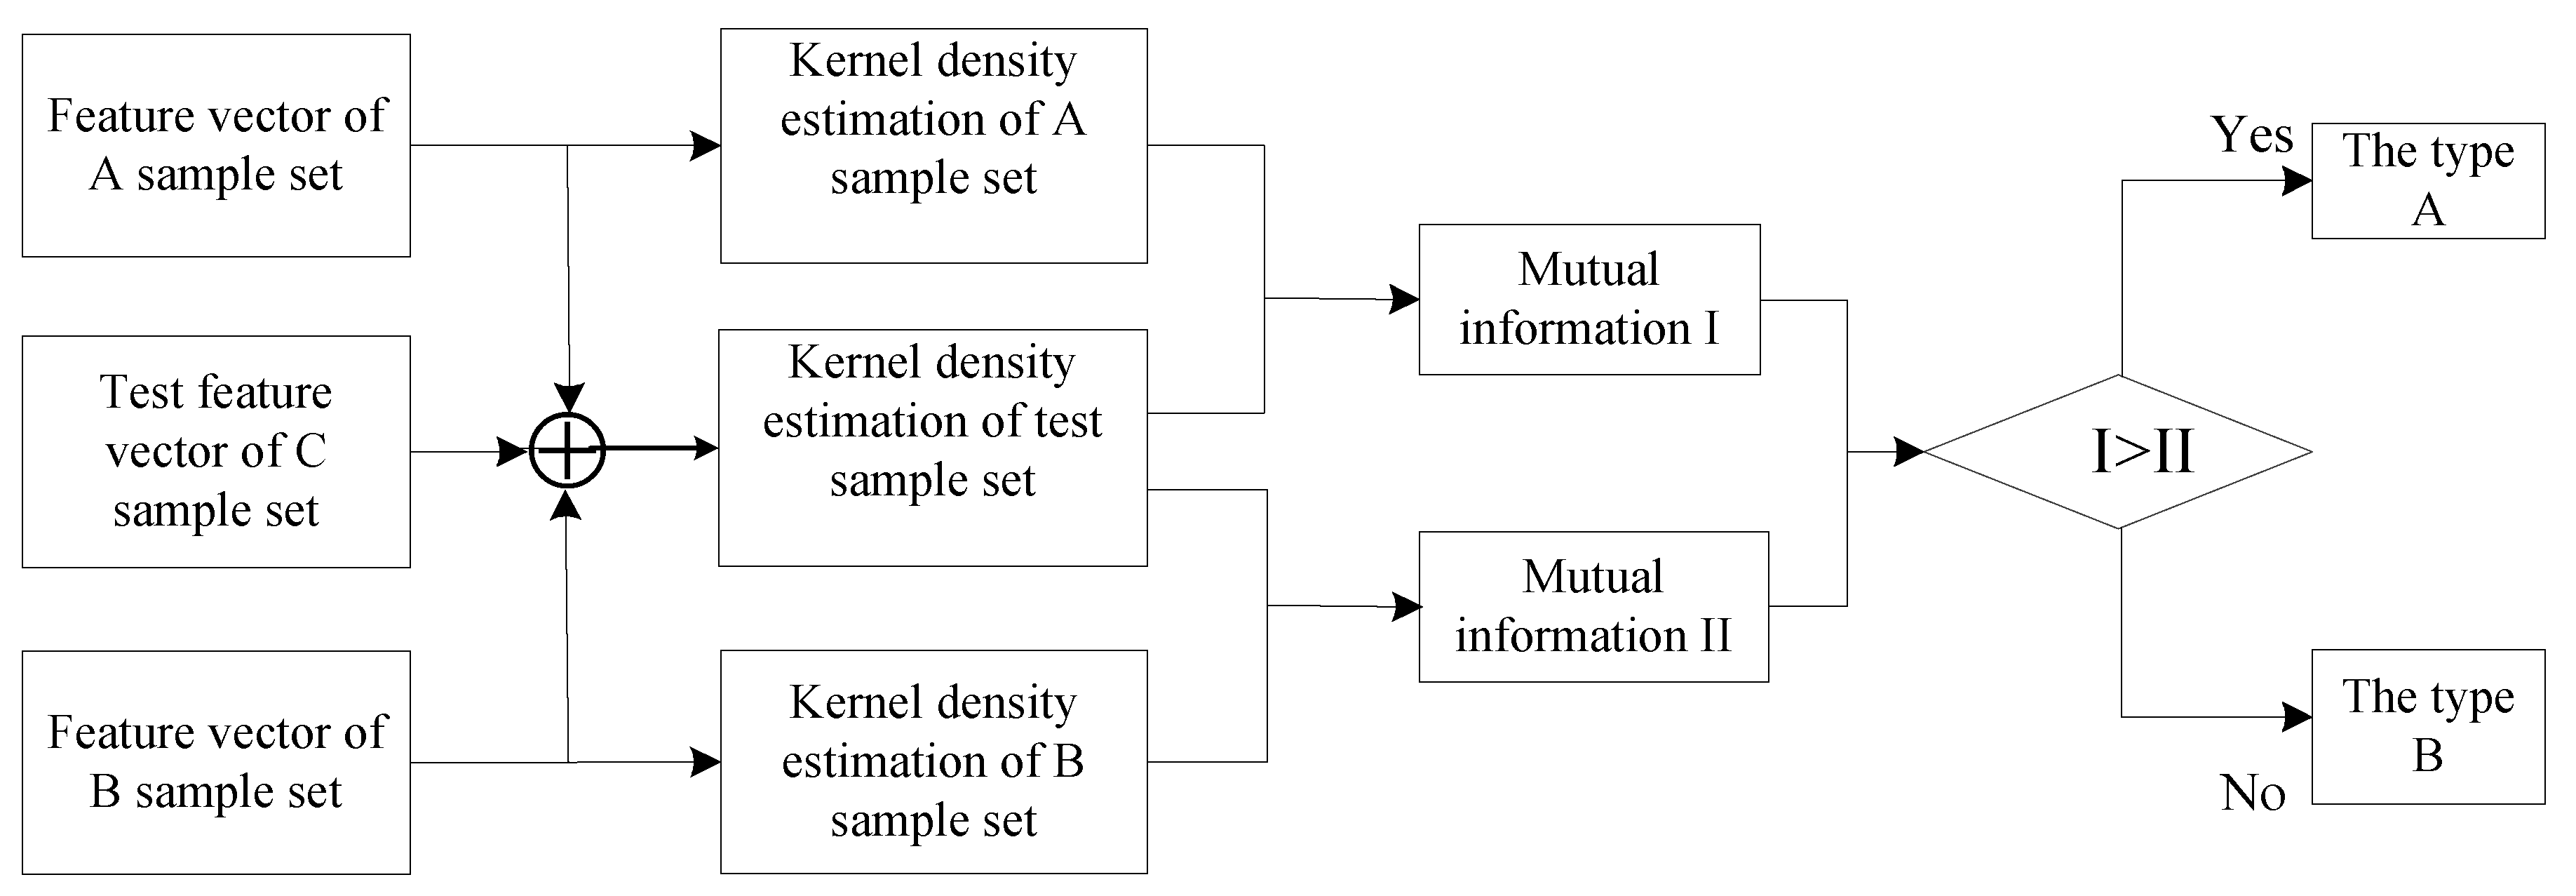
The classifier is a one-on-one classifier. The principle of the classifiers based on the kernel density estimation and mutual information is shown in Figure 5. Firstly, the rolling element bearings signal are decomposed using the EWT method and processed to obtain the feature vectors as the input parameters of the classifier. Afterwards, kernel density estimation (KDE) of the two sample sets are calculated, i.e., the KDE of class A sample set and class B sample set. The superposition method is used to fuse the feature vector of a single test signal C to the two types of feature vectors, A and B, and to compute the estimated values of kernel density. The mutual information is calculated using KDE of the sample sets. The mutual information of the kernel density estimation A and test kernel density estimation C are labeled as I. The mutual information of the kernel density estimation B and test kernel density estimation C are labeled as II. The values of I and II are compared; C is of Class A if the value of I is larger, otherwise, it is of Class B.
3.3. Fault Diagnosis Method of Rolling-Element Bearing
The root mean square (RMS), kurtosis, and skewness are common time domain statistical features that are capable of judging the state and development trend of mechanical faults. The vibration signal is subject to EWT decomposition. The RMS, kurtosis, and skewness of the F components are computed to constitute feature vectors and input into the classifier for training and testing and further identification of the operating condition of rolling bearings. The steps for identifying faults of the rolling bearings are as follows:
- (1)
- Decompose the vibration signal using EWT to obtain the F components; compute RMS, kurtosis (k), and skewness (Cw) of the first three F components to constitute the feature vector:where is the root mean square, and is kurtosis, is skewness.
- (2)
- Process multiple groups of vibration signal. Compute the feature vector according to the proposed method, and estimate the kernel density of the sample set.
- (3)
- Based on kernel density of the sample set, estimate the kernel density after the fusion of feature vector in an unknown state and the sample feature vector.
- (4)
- Compute the mutual information of fused kernel density estimation and the kernel density estimation for the sample set to identify the fault state of the rolling element bearings.
4. Experimental Results and Analysis
4.1. Experimental Apparatus and Instrumentations
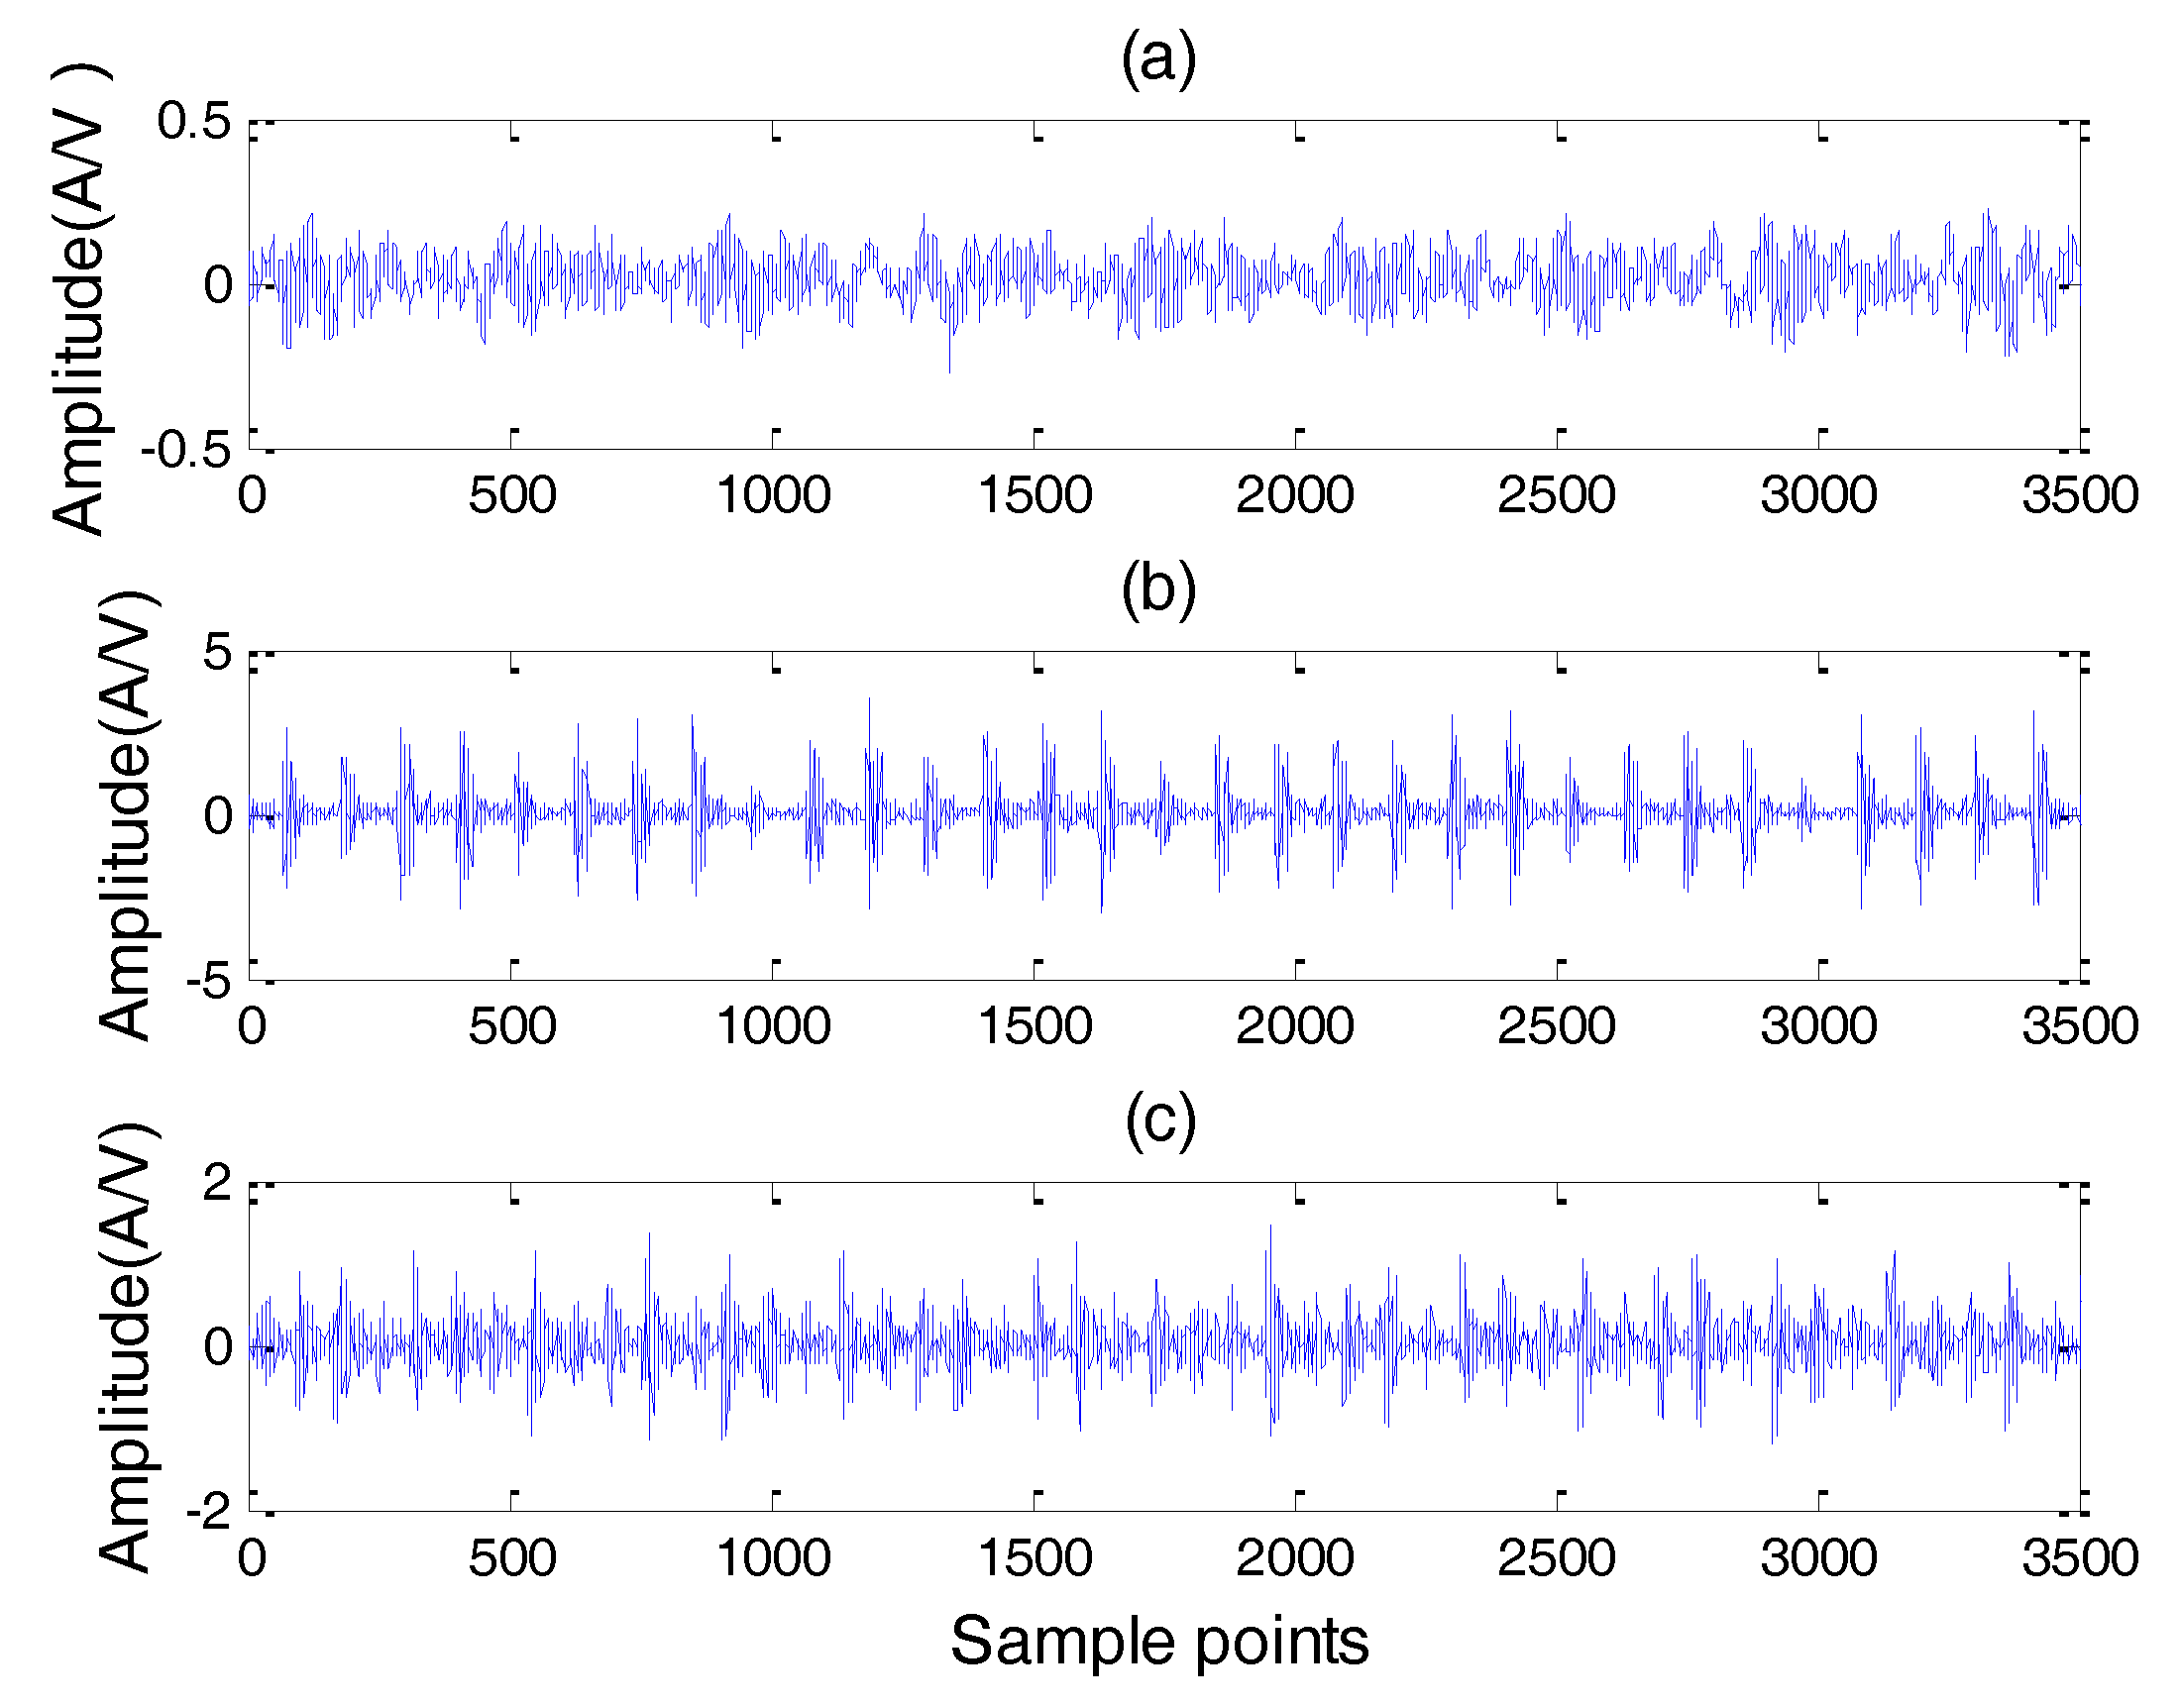
In the experiment, data about the rolling bearings from the electrical engineering test that was conducted by the Case Western Reserve University (Washington, DC, USA) were processed. In the experiment, the fault diameter is 0.007~0.028 (0.18–0.71 mm), and the electric drive method is used to form the bearing part and the fan bearing end (SKF deep groove ball bearings 6205-2RSJEM and 6203-2RSJEM) local damage. An accelerometer was installed on the upper enclosure of the output axial bearing of the motor. The rotating speed of the bearing was 1797 r/min, sampling frequency was 12 kHz, and length N of each data sample was of 3500 points. The collected normal signal, inner race fault signal, and outer race fault signal are shown in Figure 6.
4.2. Analysis of Experimental Data
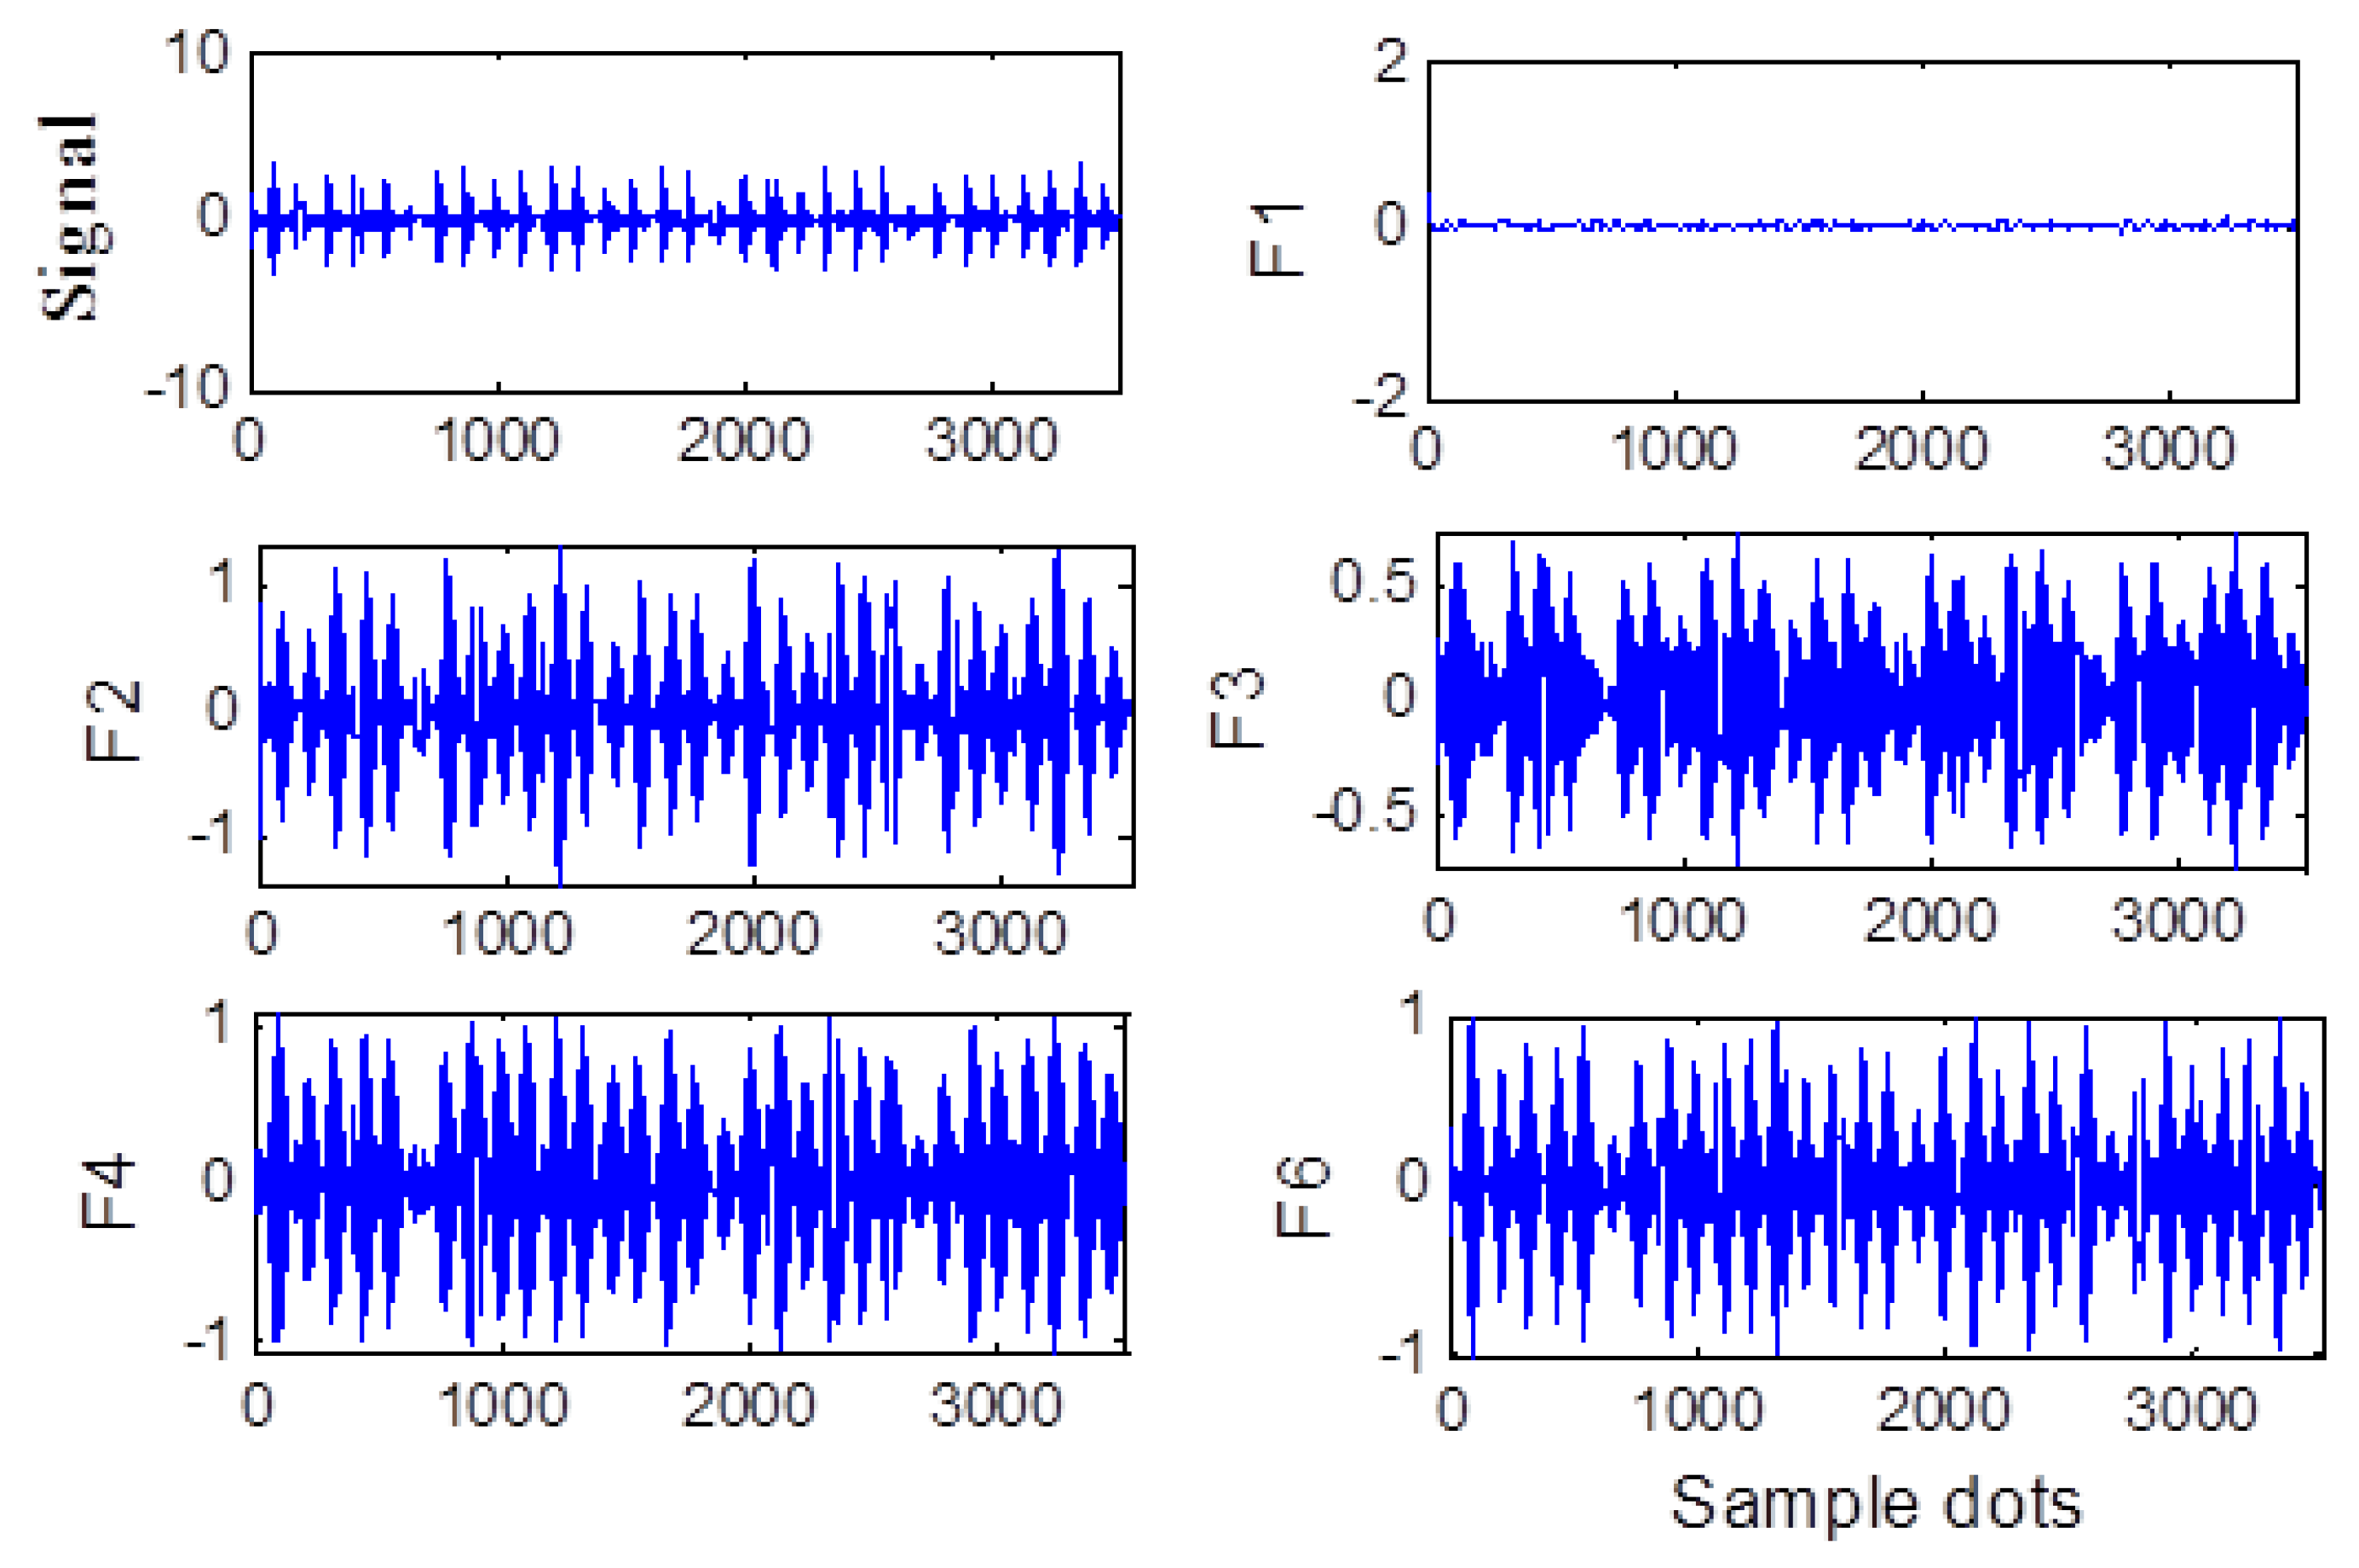
In the example of the outer race fault signal, the signal was decomposed using EWT technique (Figure 7) obtaining eight F components; Each component contains a frequencies, different F components reflect different feature components in the signal.
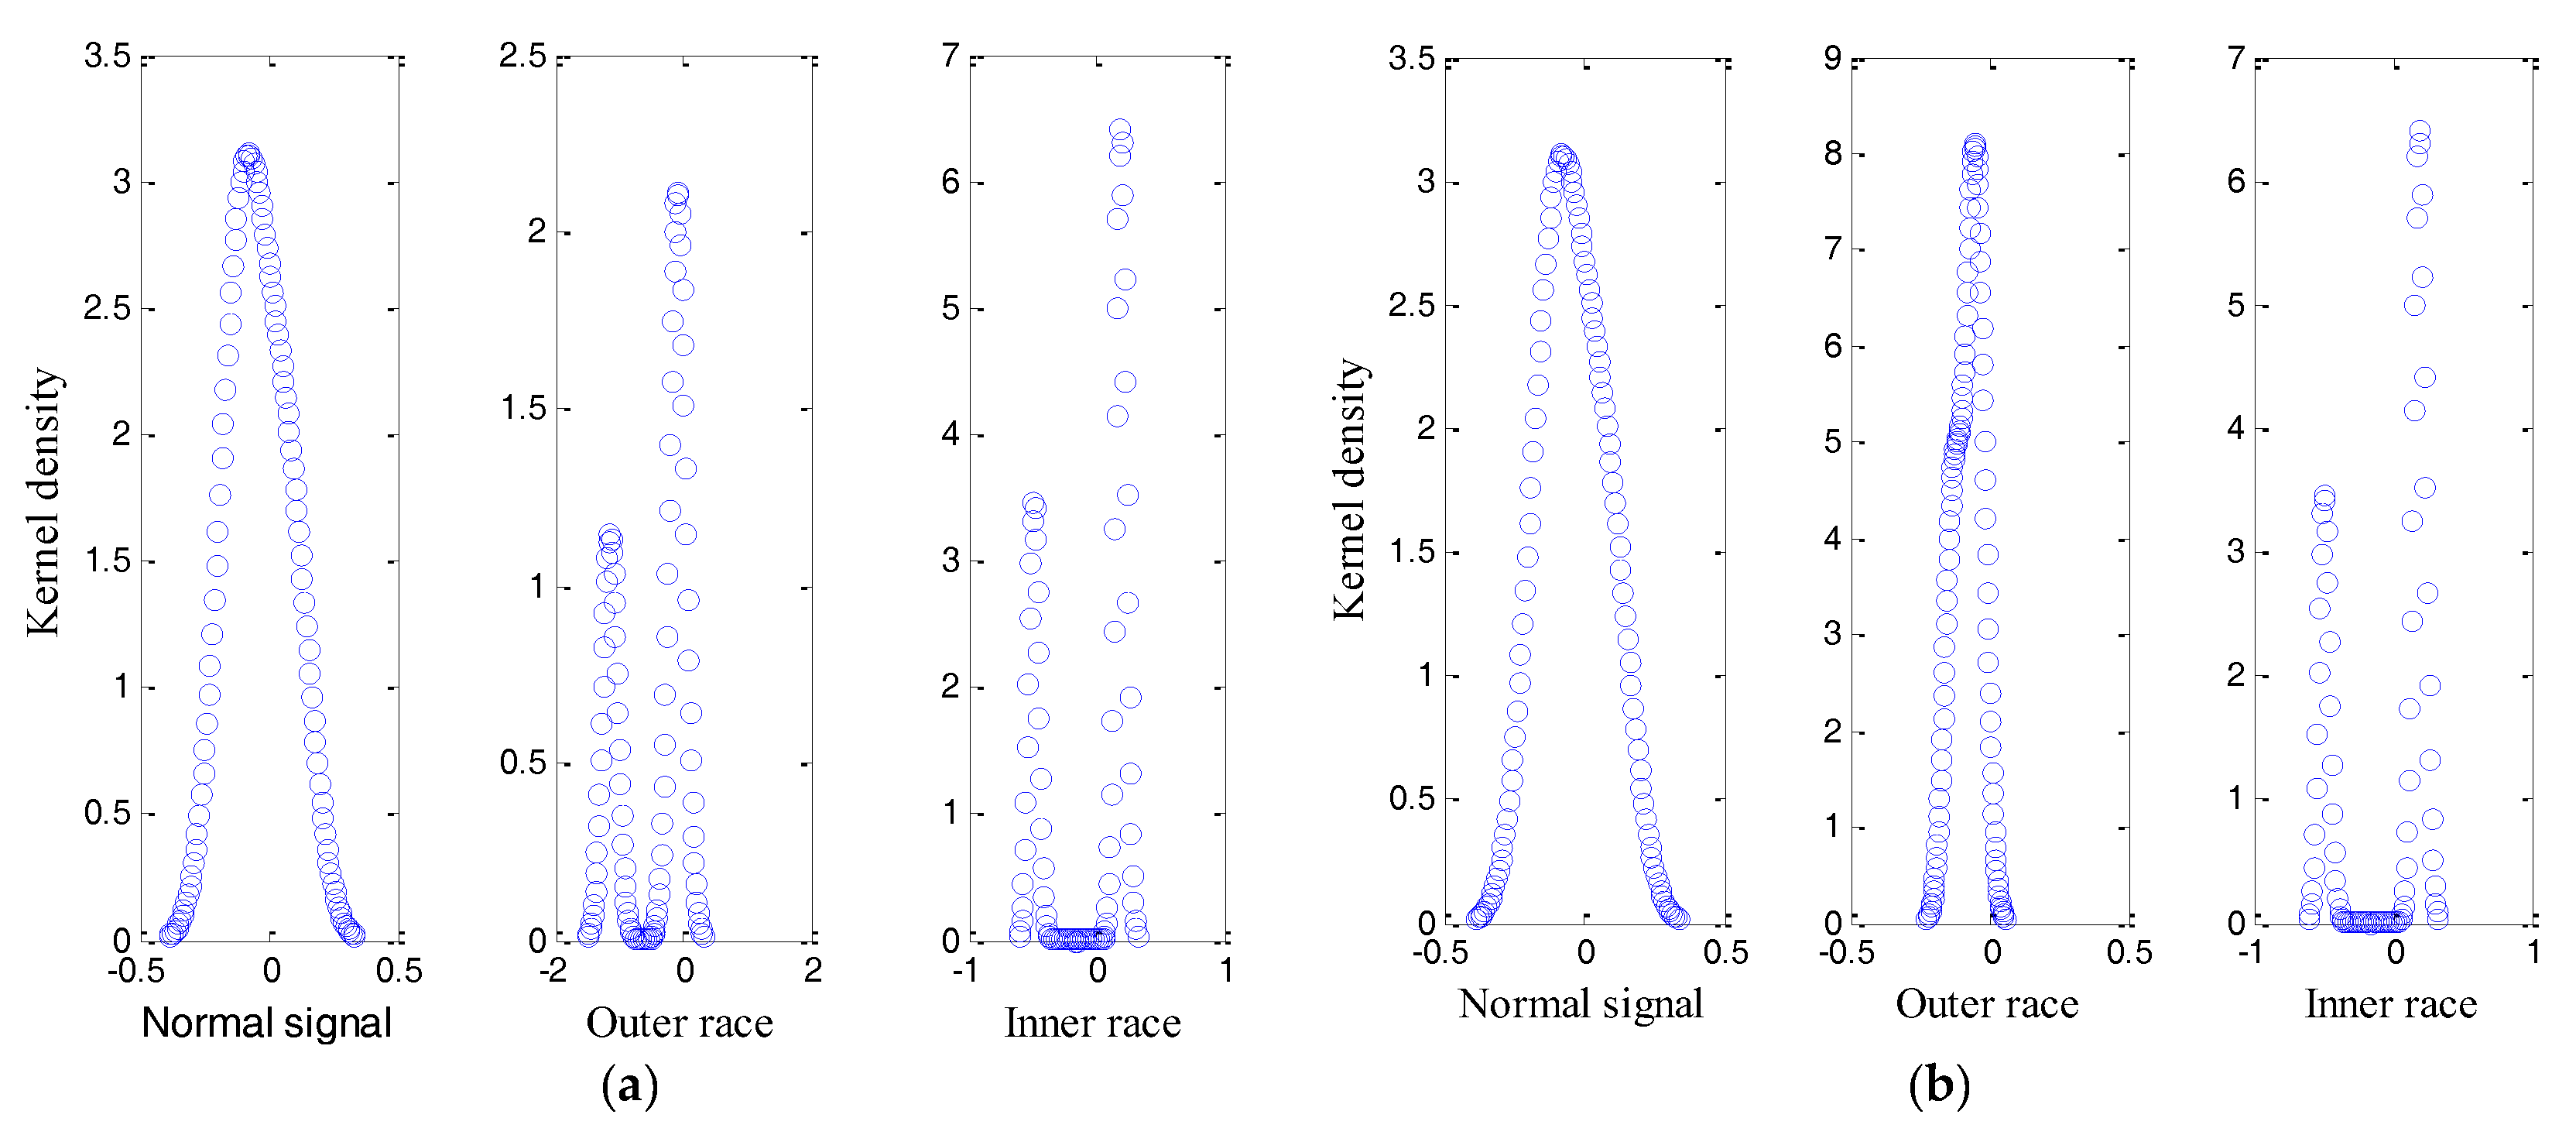
The root mean square, kurtosis, and skewness of the first three F components were computed to constitute a feature vector. Then, the feature vector was used to estimate the probability density of the rolling bearing in different states. For comparison, EWT and EMD were used, respectively (see Figure 8).
Based on the comparison between Figure 8a,b, it was impossible to obtain an accurate F component because of the mode mixing effect generated in the EMD technique. Thus, no significant differences exist in the probability densities of rolling bearing in the various states estimated with EMD method. On the contrary, EWT decomposition avoids the mode mixing and significant differences appear in the probability densities.
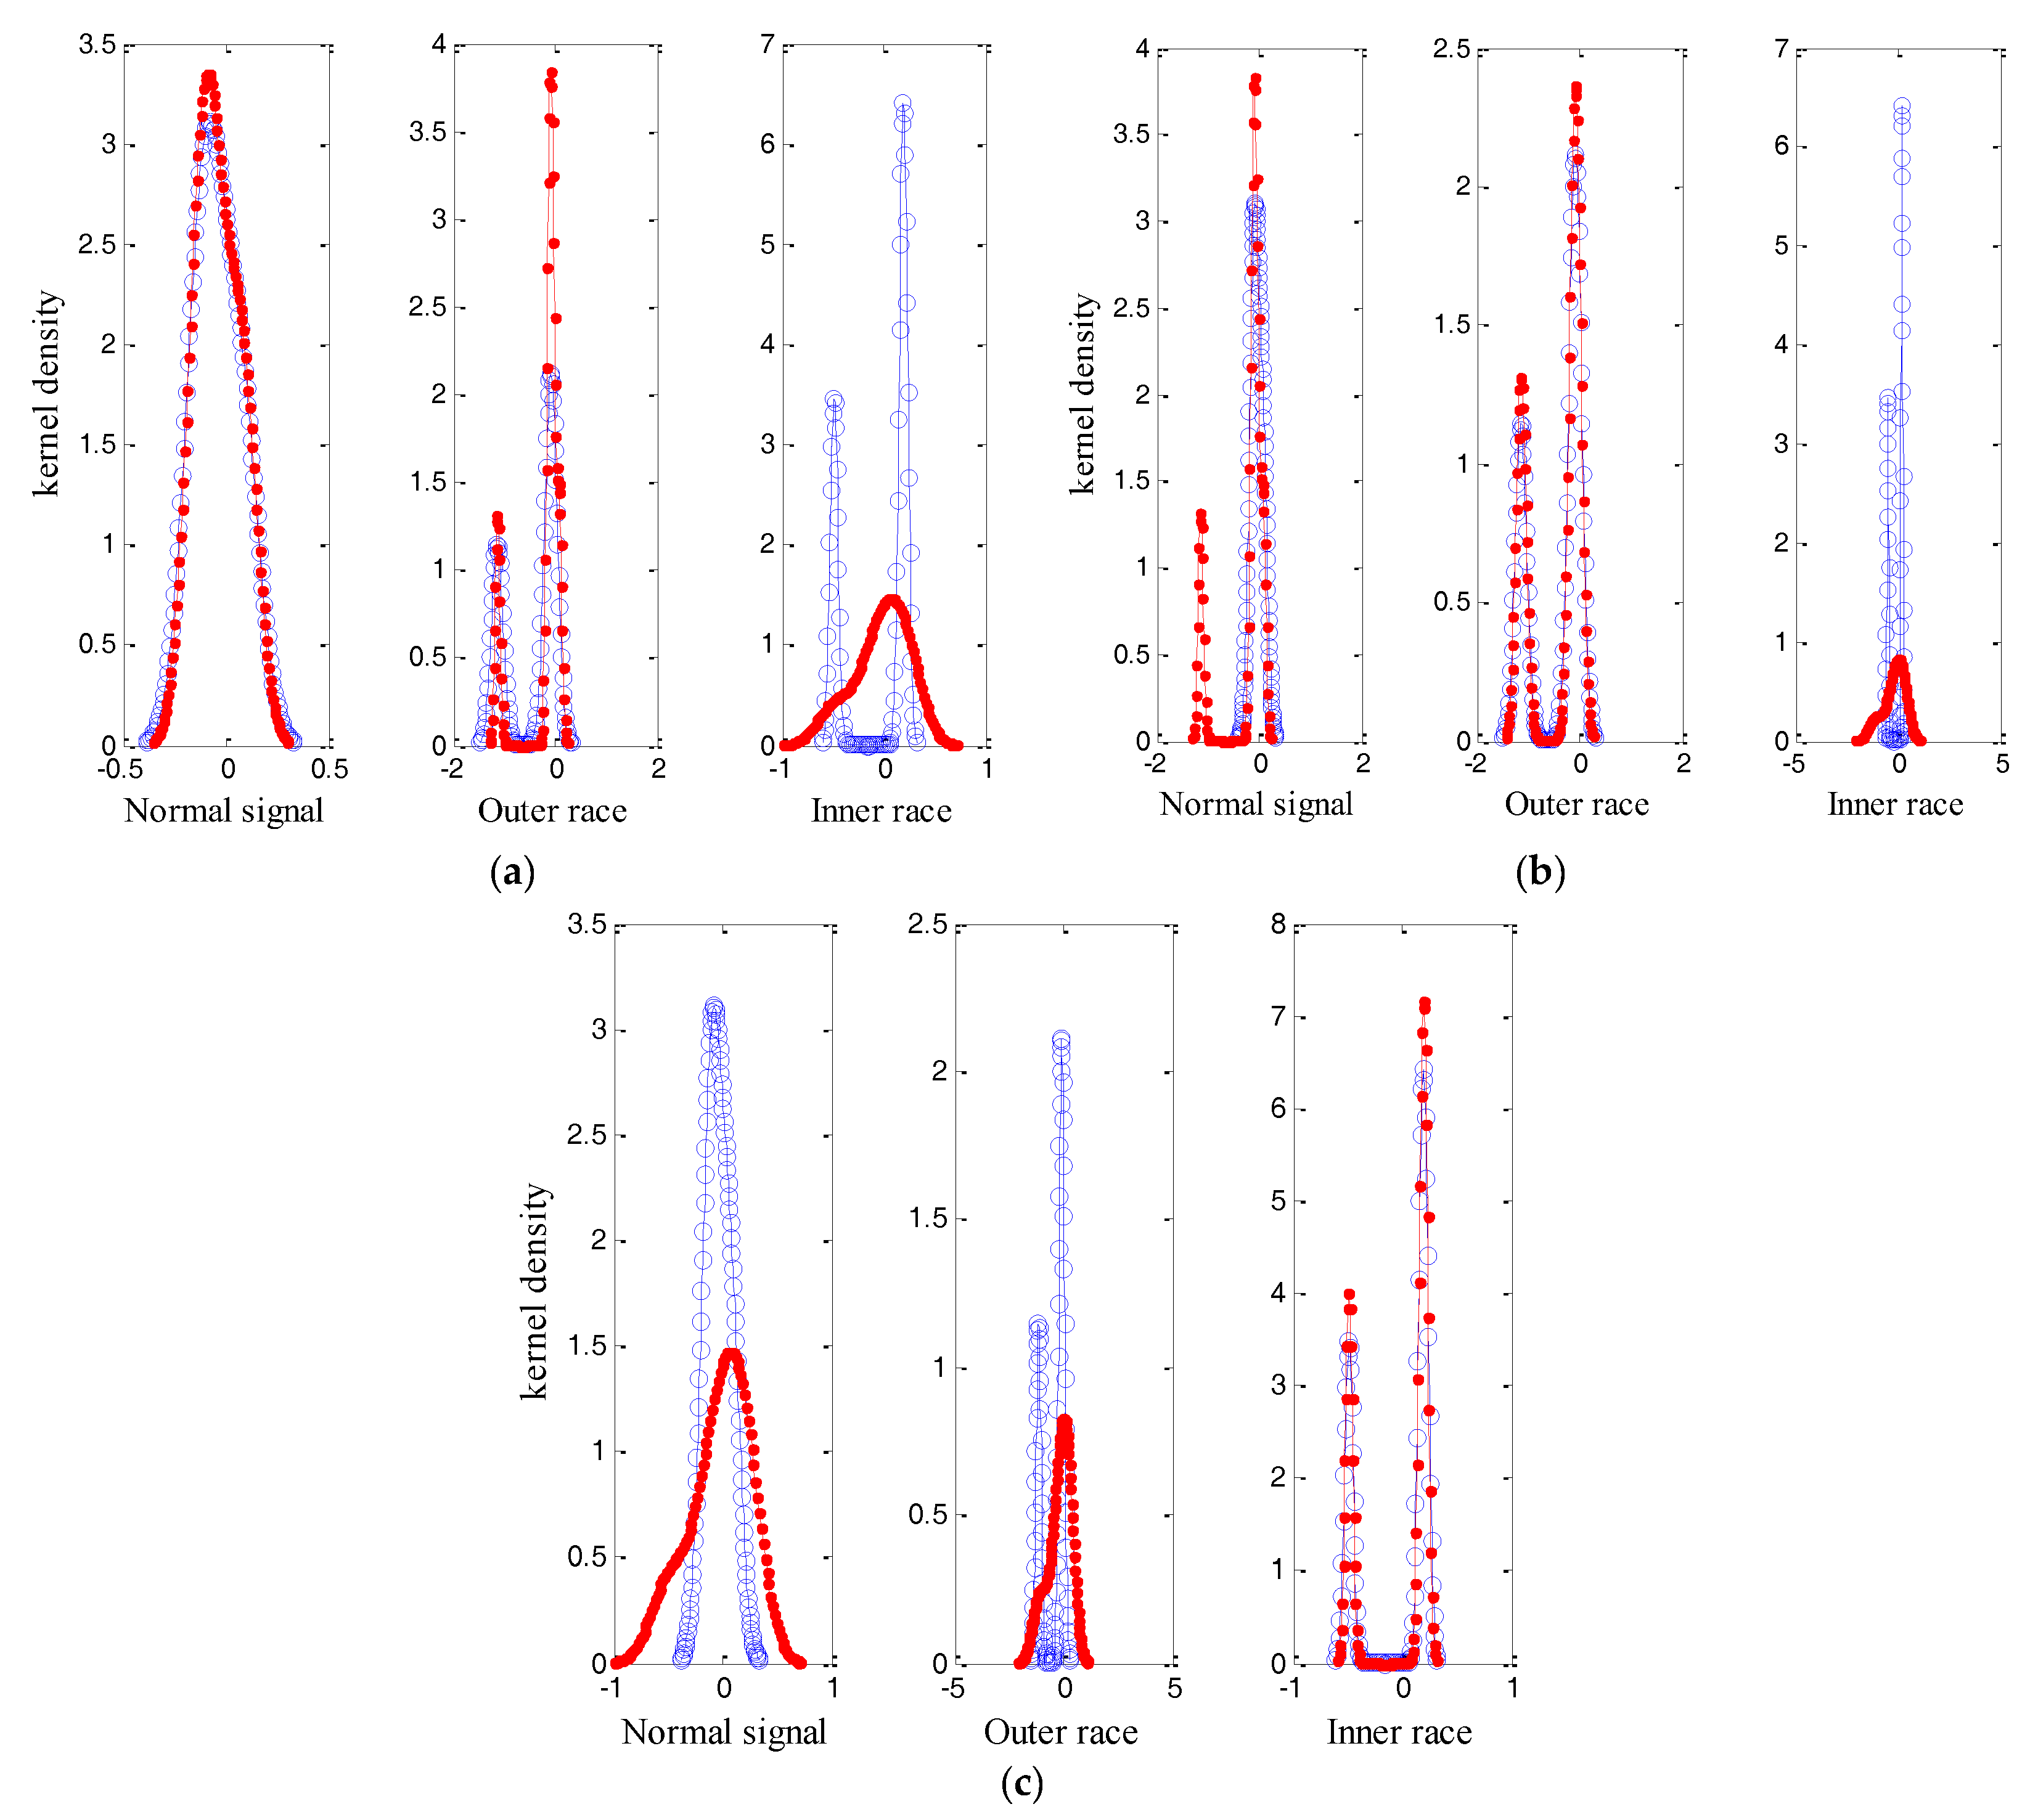
For the rolling bearing in different states, 30 sets of data were collected as the sample set. According to the principle of KDEC, 10 sets of data were collected as the test set. The rotating speed of the bearing was 1797 r/min, sampling frequency was 12 kHz, and the length N of each data sample was of 3500 points. Figure 9 shows one of 10 sets of data in test set. The tested signal was first decomposed into several F components by EWT; then, the root mean square (RMS), kurtosis, and skewness of the F component were calculated and combined into the feature vector. The feature vector was used to test the probability density of the rolling bearing in different states. The estimated probability density after the addition of test set is shown in Figure 10.
From Figure 10, the probability densities before and after adding the test set coincide well when the added test set and the sample set are in the same state. The estimated probability densities poorly coincide when the sets are not in the same state, that is to say, the differences between the test set and the sample set were substantial. The mutual information of the estimated probability density following the addition of test set was computed, and the results are summarized in Table 1.
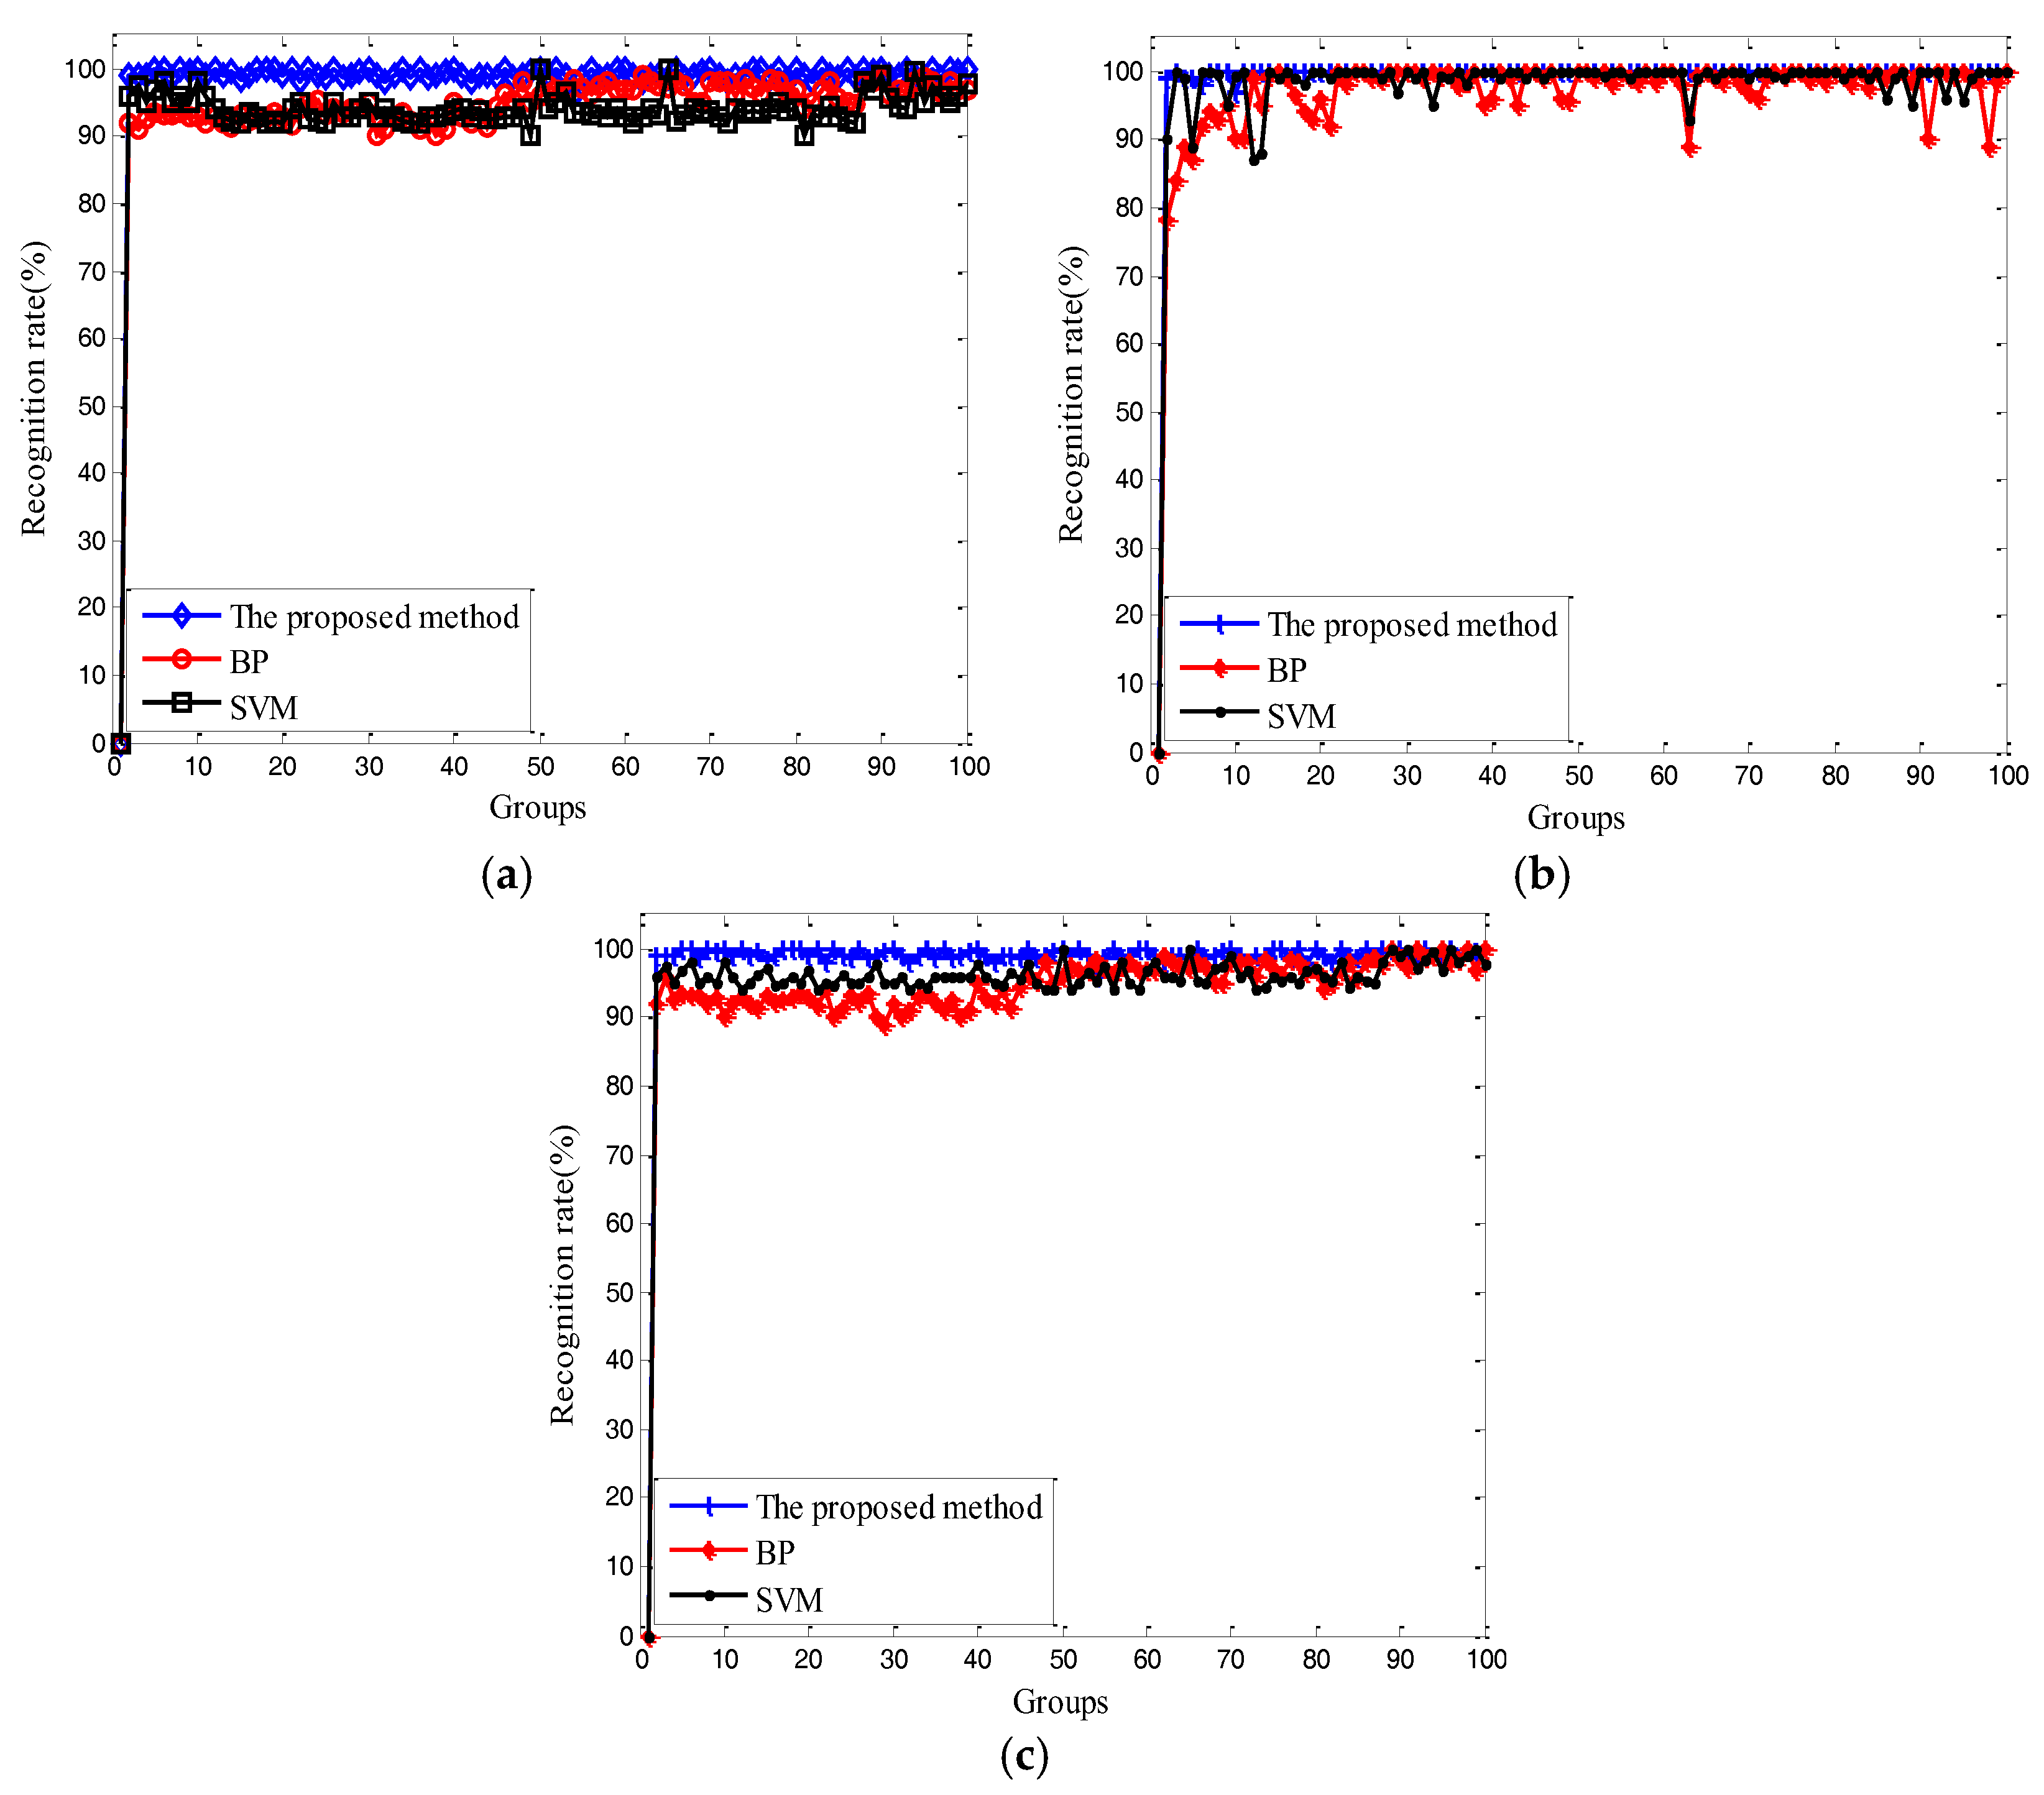
Test data and sample set coincide well and are correlated with the largest mutual information when comparing the same bearing’s state. Therefore, the test data categories could be effectively distinguished via the largest mutual information. The proposed classifier, SVM classifier, and the BP neural network classifier were used to train and test the experimental data on normal state, inner race fault state, and the outer race fault state. The test results of the rolling bearing in the three different states under different classifiers are shown in Figure 11.
From Figure 11, due to its no need of parameter setting and the small computational load, the proposed classifier in this paper can effectively identify different operative conditions of the rolling bearing and exhibits a higher identification rate than SVM and BP. Twenty five sets of data selected from different condition data were selected to process in experiment, and 20 sets of data were selected for input into the classification as training data, and the other five sets were used as test data. The results of different fault diagnosis methods are shown in Table 2.
As can be seen in Table 2, the EMD method is used to decompose the vibration signal due to the fact that mode mixing occurs in the EMD decomposition process. The natural mode of vibration cannot be isolated during the decomposition process. Therefore, the EMD-KDEC method cannot effectively extract the fault feature and identify different operative condition. The EWT-KDEC method can effectively decompose the fault signals to obtain the components of natural mode of vibration. Hence, the accuracy is higher than the EMD-KDEC method.
4.3. Discussion
Since the EWT can unconditionally decompose the multi-component signal into multiple components, it is reasonable to control the decomposition convergence condition. Therefore, the EWT method can effectively eliminate the pattern mixing phenomenon. Simulation and experimental results show that the proposed methods can be used to diagnose the fault of rolling bearing, and achieve a higher recognition rate than EMD method.
5. Conclusions
As rolling bearings are key parts of various types of mechanical equipment, it of practical significance to monitor and diagnose the states of rolling bearings. This paper proposes a method for diagnosing the faults of rolling bearings based on empirical wavelet transform and kernel density estimation classifier. For the complex vibration signal, the EMD method is subjected to mode mixing during the decomposition process, leading to the failure of obtaining the inherent mode component. In contrast, EWT can be used to decompose the signal, overcome the mode mixing, and obtain the natural mode components. When considering the disadvantages of the traditional classifiers, such as the low identification rate and long training duration, this paper proposes a novel classifier that is based on kernel density estimation for identifying faults. The result indicates that the proposed classifier can effectively identify different operative modes of rolling bearing with higher identification rates than SVM and BP. Despite the advantages in diagnosing faults in the rolling bearing, the proposed method is subjected to certain limitations. The penalty parameters and number of components in the EWT decomposition process need to be prioritized; hence, future researches on how to adaptively set the parameters of the EWT method are needed.
Acknowledgments
This work was supported by the key project of China Spark Program (2015GA750005) and Key Science and Technology Program of Henan Province, China (152102210130).
Author Contributions
M.G. and X.R. conceived and designed the experiments; M.G. performed the experiments and analyzed the data; J.W. provided guidance and recommendations for this research. M.G. contributed to the contents and writing of this manuscript.
Conflicts of Interest
The authors declare no conflict of interest.
References
- Vidal, Y.; Tutivén, C.; Rodellar, J.; Acho, L. Fault diagnosis and fault-tolerant control of wind turbines via a discrete time controller with a disturbance compensator. Energies 2015, 8, 4300–4316. [Google Scholar] [CrossRef] [Green Version]
- Rafiee, J.; Rafiee, M.A.; Tse, P.W. Application of mother wavelet functions for automatic gear and bearing fault diagnosis. Expert Syst. Appl. 2010, 37, 4568–4579. [Google Scholar] [CrossRef]
- Lei, Y.G.; Zuo, M.J. Fault diagnosis of rotating machinery using an improved HHT based on EEMD and sensitive IMFs. Meas. Sci. Technol. 2009, 20, 1–12. [Google Scholar] [CrossRef]
- Wardle, F.P. Vibration forces produced by waviness of the rolling surfaces of thrust loaded ball bearings Part 1: Theory. J. Mech. Eng. Sci. 1988, 202, 305–312. [Google Scholar] [CrossRef]
- Lynagh, N.; Rahnejat, H.; Ebrahimi, M.; Aini, R. Bearing induced vibration in precision high speed routing spindles. Int. J. Mach. Tools Manuf. 2000, 40, 561–577. [Google Scholar] [CrossRef]
- Vafaei, S.; Rahnejat, H.; Aini, R. Vibration monitoring of high speed spindles using spectral analysis techniques. Int. J. Mach. Tools Manuf. 2002, 42, 1223–1234. [Google Scholar] [CrossRef]
- Vafaei, S.; Rahnejat, H. Indicated repeatable runout with wavelet decomposition (IRR-WD) for effective determination of bearing-induced vibration. J. Sound Vib. 2003, 260, 67–82. [Google Scholar] [CrossRef]
- Zhang, X.; Liang, Y.; Zhou, J.; Zang, Y. A novel bearing fault diagnosis model integrated permutation entropy, ensemble empirical mode decomposition and optimized SVM. Measurement 2015, 69, 164–179. [Google Scholar] [CrossRef]
- Lei, Y.; Jia, F.; Lin, J.; Xing, S.; Ding, S.X. An Intelligent Fault Diagnosis Method Using Unsupervised Feature Learning Towards Mechanical Big Data. IEEE Trans. Ind. Electron. 2016, 63, 3137–3147. [Google Scholar] [CrossRef]
- Xiao, Y.; Ding, E.; Chen, C.; Liu, X.; Li, L. A Novel Characteristic Frequency Bands Extraction Method for Automatic Bearing Fault Diagnosis Based on Hilbert Huang Transform. Sensors 2015, 15, 27869–27893. [Google Scholar]
- Nonetheless, S.V. Gearbox Fault Diagnosis Using Complementary Ensemble Empirical Mode Decomposition and Permutation Entropy. Shock Vib. 2016, 2016, 1–8. [Google Scholar]
- Chen, S.W.; Chen, Y.H. Hardware design and implementation of a wavelet de-noising procedure for medical signal processing. Sensors 2015, 15, 26396–26414. [Google Scholar] [CrossRef] [PubMed]
- Zhong, J.H.; Wong, P.K.; Yang, Z.X. Simultaneous-Fault Diagnosis of Gearboxes Using Probabilistic Committee Machine. Sensors 2016, 16, 185. [Google Scholar] [CrossRef] [PubMed]
- Xiao, Q.; Li, J.; Bai, Z.; Sun, J.; Zhou, N.; Zeng, Z. A Small Leak Detection Method Based on VMD Adaptive De-Noising and Ambiguity Correlation Classification Intended for Natural Gas Pipelines. Sensors 2016, 16, 2116. [Google Scholar] [CrossRef] [PubMed]
- Wang, T.; Zhang, M.; Yu, Q.; Zhang, H. Comparing the applications of EMD and EEMD on time-frequency analysis of seismic signal. J. Appl. Geophys. 2012, 83, 29–34. [Google Scholar] [CrossRef]
- Wang, W.; Chau, K.; Xu, D.; Chen, X.-Y. Improving forecasting accuracy of annual runoff time series using ARIMA based on EEMD decomposition. Water Resour. Manag. 2015, 29, 2655–2675. [Google Scholar] [CrossRef]
- Sun, J.; Xiao, Q.; Wen, J.; Wang, F. Natural gas pipeline small leakage feature extraction and recognition based on LMD envelope spectrum entropy and SVM. Measurement 2014, 55, 434–443. [Google Scholar] [CrossRef]
- Gilles, J. Empirical wavelet transforms. IEEE Trans. Signal Process. 2013, 61, 3999–4010. [Google Scholar] [CrossRef]
- Dragomiretskiy, K.; Zosso, D. Variational mode decomposition. IEEE Trans. Signal Process. 2014, 62, 531–544. [Google Scholar] [CrossRef]
- Yin, A.; Ren, H. A propagating mode extraction algorithm for microwave waveguide using variational mode decomposition. Meas. Sci. Technol. 2015, 26, 095009. [Google Scholar] [CrossRef]
- Yan, J.; Hong, H.; Zhao, H.; Li, Y.; Gu, C.; Zhu, X. Through-Wall Multiple Targets Vital Signs Tracking Basedon VMD algorithm. Sensors 2016, 16, 1293. [Google Scholar] [CrossRef] [PubMed]
- Wang, Y.; Markert, R.; Xiang, J.; Zheng, W. Research on variational mode decomposition and its applicationin detecting rub-impact fault of the rotor system. Mech. Syst. Signal Process. 2015, 60, 243–251. [Google Scholar] [CrossRef]
- Jovan, G.; Dragoljub, G.; Aleksandar, B.; Savic-Gajic, I.; Georgieva, O.; Di Gennaro, S. Online Condition Monitoring of Bearings to Support Total Productive Maintenance in the Packaging Materials Industry. Sensors 2016, 16, 316. [Google Scholar]
- Sharma, R.K.; Sugumaran, V.; Kumar, H.; Amarnath, M. A comparative study of naive Bayes classifier and Bayes net classifier for fault diagnosis of roller bearing using sound signal. Int. J. Decis. Support Syst. 2015, 1, 115. [Google Scholar] [CrossRef]
- Wang, Q.; Garrity, G.M.; Tiedje, J.M.; Cole, J.R. Naive Bayesian classifier for rapid assignment of rRNA sequences into the new bacterial taxonomy. Appl. Environ. Microbial. 2007, 73, 5261–5267. [Google Scholar] [CrossRef] [PubMed]
- Jiang, X.; Wu, L.; Ge, M. A Novel Faults Diagnosis Method for Rolling Element Bearings Based on EWT and Ambiguity Correlation Classifiers. Entropy 2017, 19, 231. [Google Scholar] [CrossRef]
- Lu, J.; Huang, J.; Lu, F. Sensor Fault Diagnosis for Aero Engine Based on Online Sequential Extreme Learning Machine with Memory Principle. Energies 2017, 10, 39. [Google Scholar] [CrossRef]
- Yang, B.S.; Han, T.; An, J.L. ART-KOHONEN neural network for fault diagnosis of rotating machinery. Mech. Syst. Signal Process. 2004, 18, 645–657. [Google Scholar] [CrossRef]
- Xiao, Y.; Kang, N.; Hong, Y.; Zhang, G. Misalignment Fault Diagnosis of DFWT Based on IEMD Energy Entropy and PSO-SVM. Entropy 2017, 19, 6. [Google Scholar] [CrossRef]
- Zhang, F.; Liu, Y.; Chen, C.; Li, Y.-F.; Huang, H.-Z. Fault diagnosis of rotating machinery based on kernel density estimation and Kullback-Leibler divergence. J. Mech. Sci. Technol. 2014, 11, 4441–4454. [Google Scholar] [CrossRef]
- Chen, Y.; Wu, C.; Liu, H. EMD self-adaptive selecting relevant modes algorithm for FBG spectrum signal. Opt. Fiber Technol. 2017, 36, 63–67. [Google Scholar] [CrossRef]
- Rezazadeh, A.S.; Koofigar, H.R.; Hosseinnia, S. Adaptive fault detection and isolation for a class of robot manipulators with time-varying perturbation. J. Mech. Sci. Technol. 2015, 29, 4901–4911. [Google Scholar] [CrossRef]
- Maes, F.; Collignon, A.; Vandermeulen, D.; Marchal, G.; Suetens, P. Multi-Modality Image Registration Maximization of Mutual Information. IEEE Trans. Med. Imaging 1996, 16, 14–22. [Google Scholar]
Figure 1.
The simulated signal and its three components.
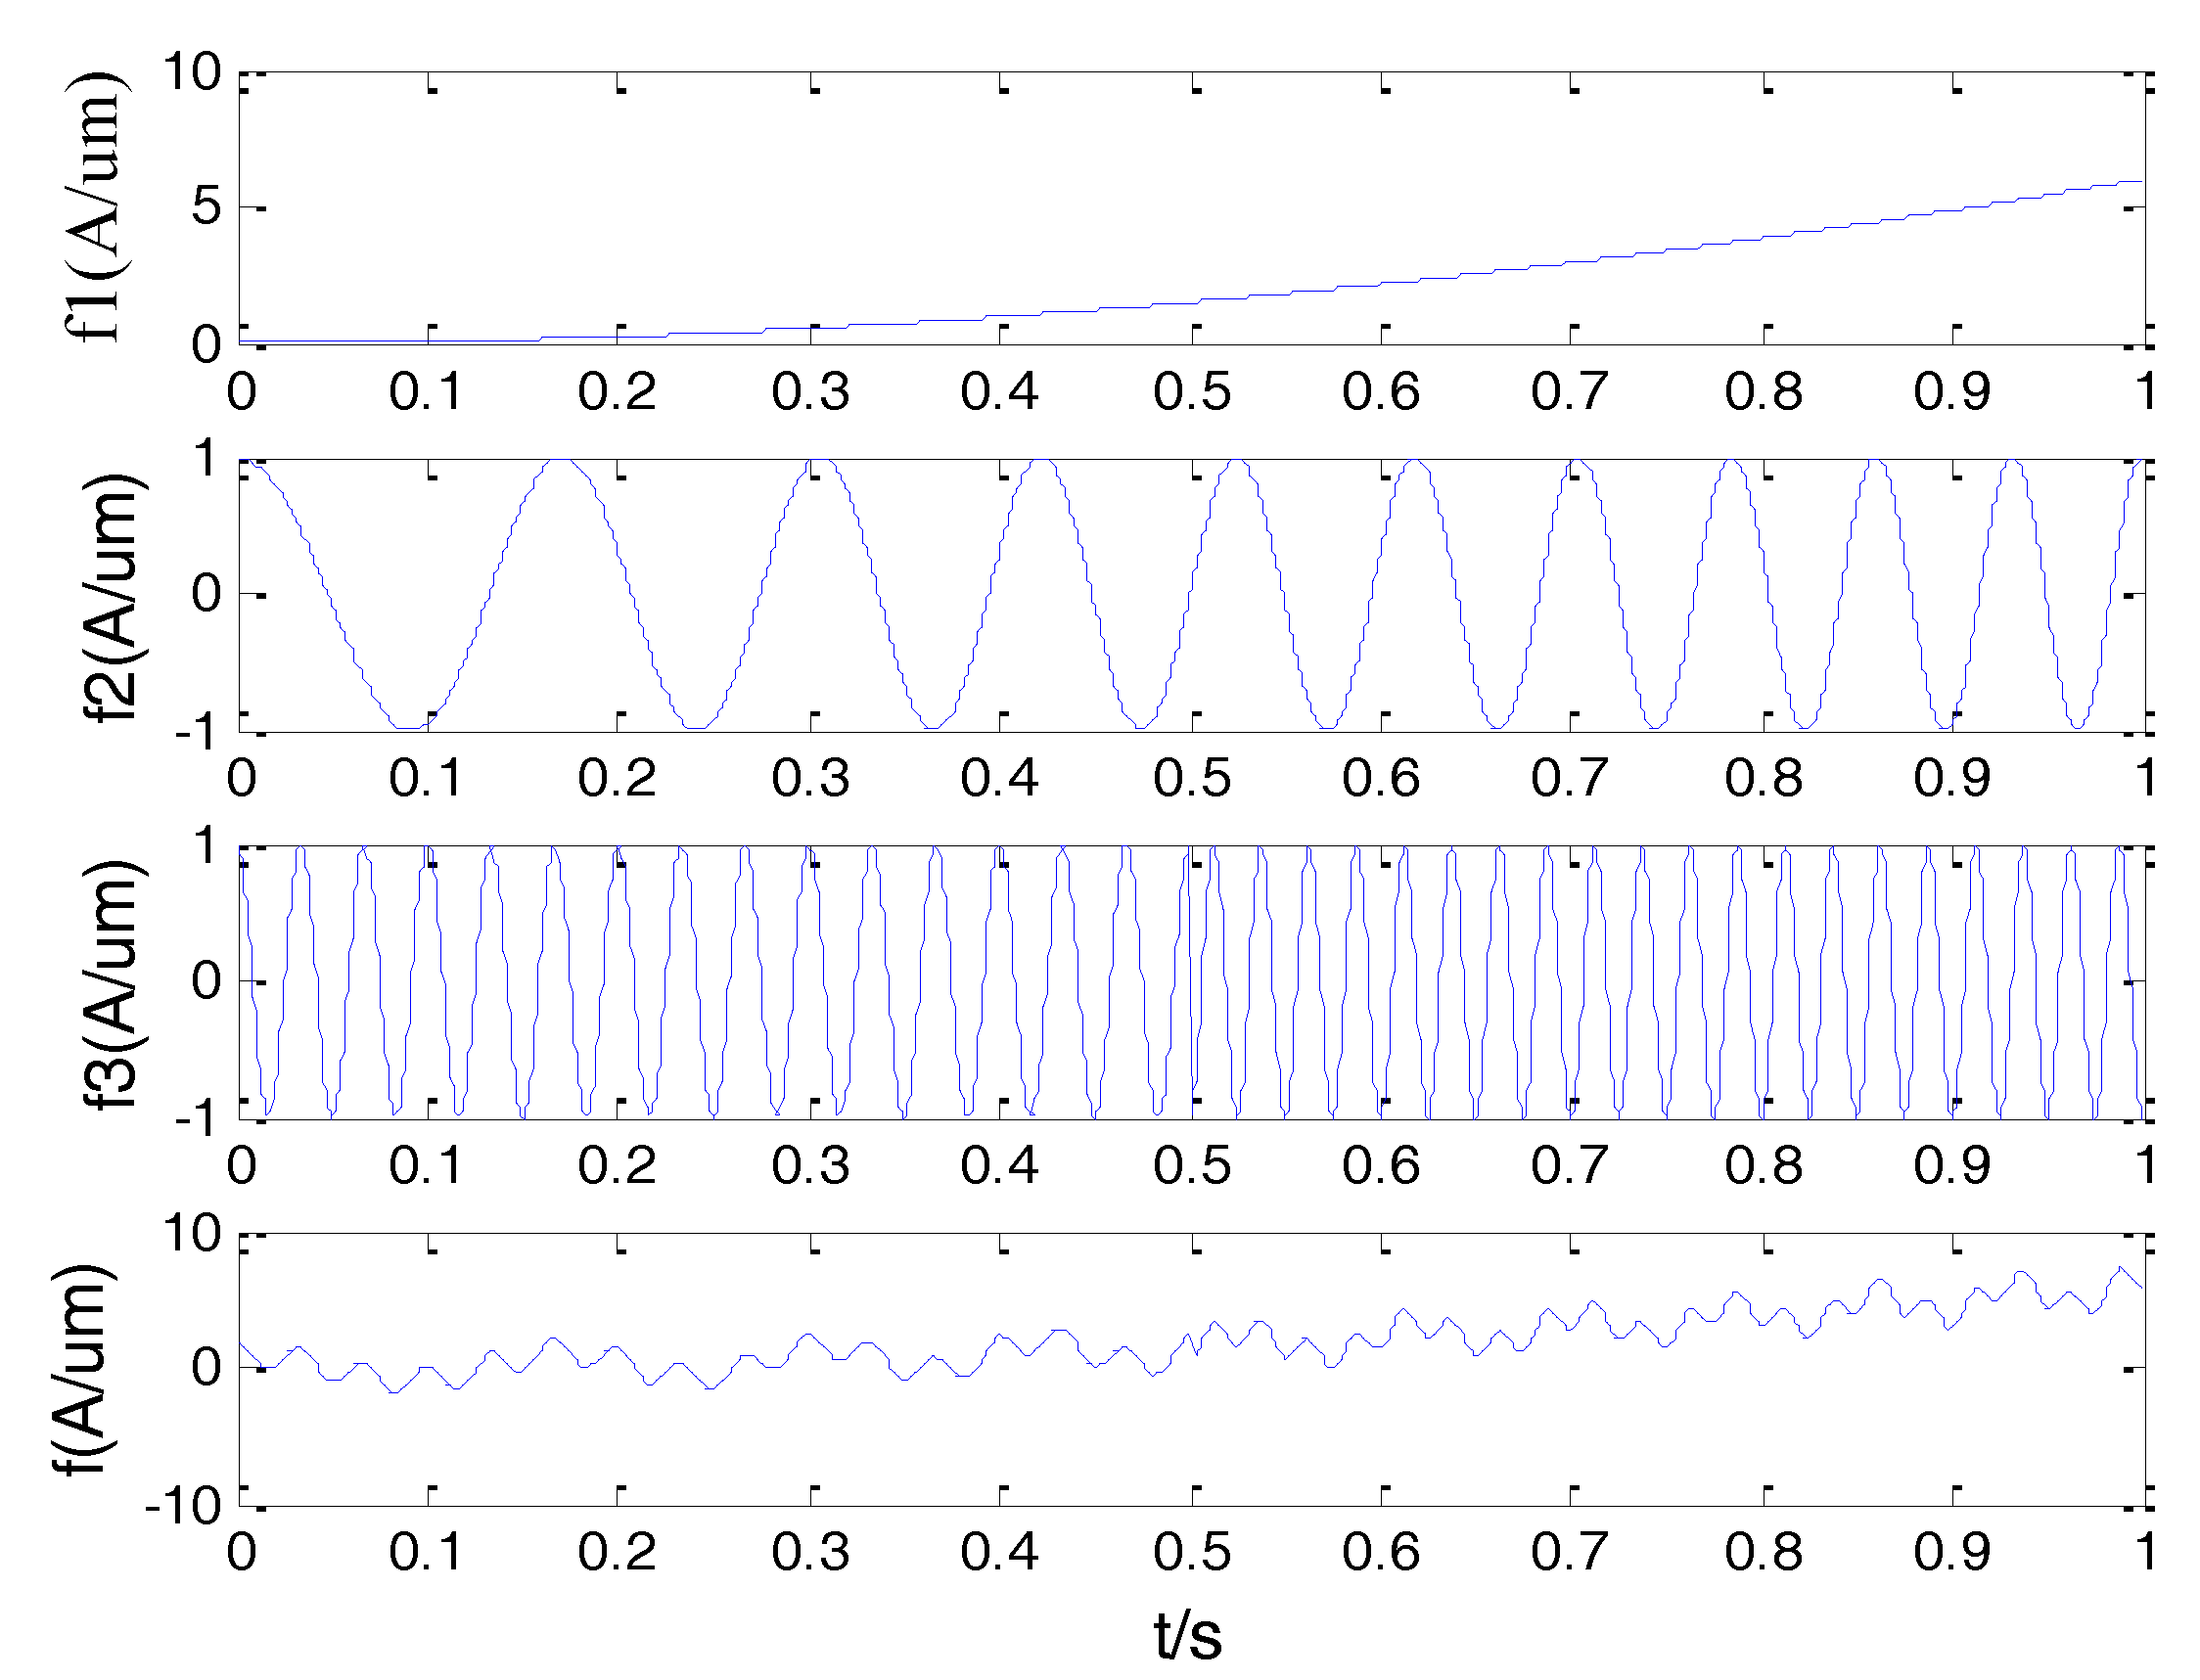
Figure 2.
Spectrum and support boundary of simulated signal.

Figure 3.
Empirical Wavelet Transform (EWT) result of simulated signal.
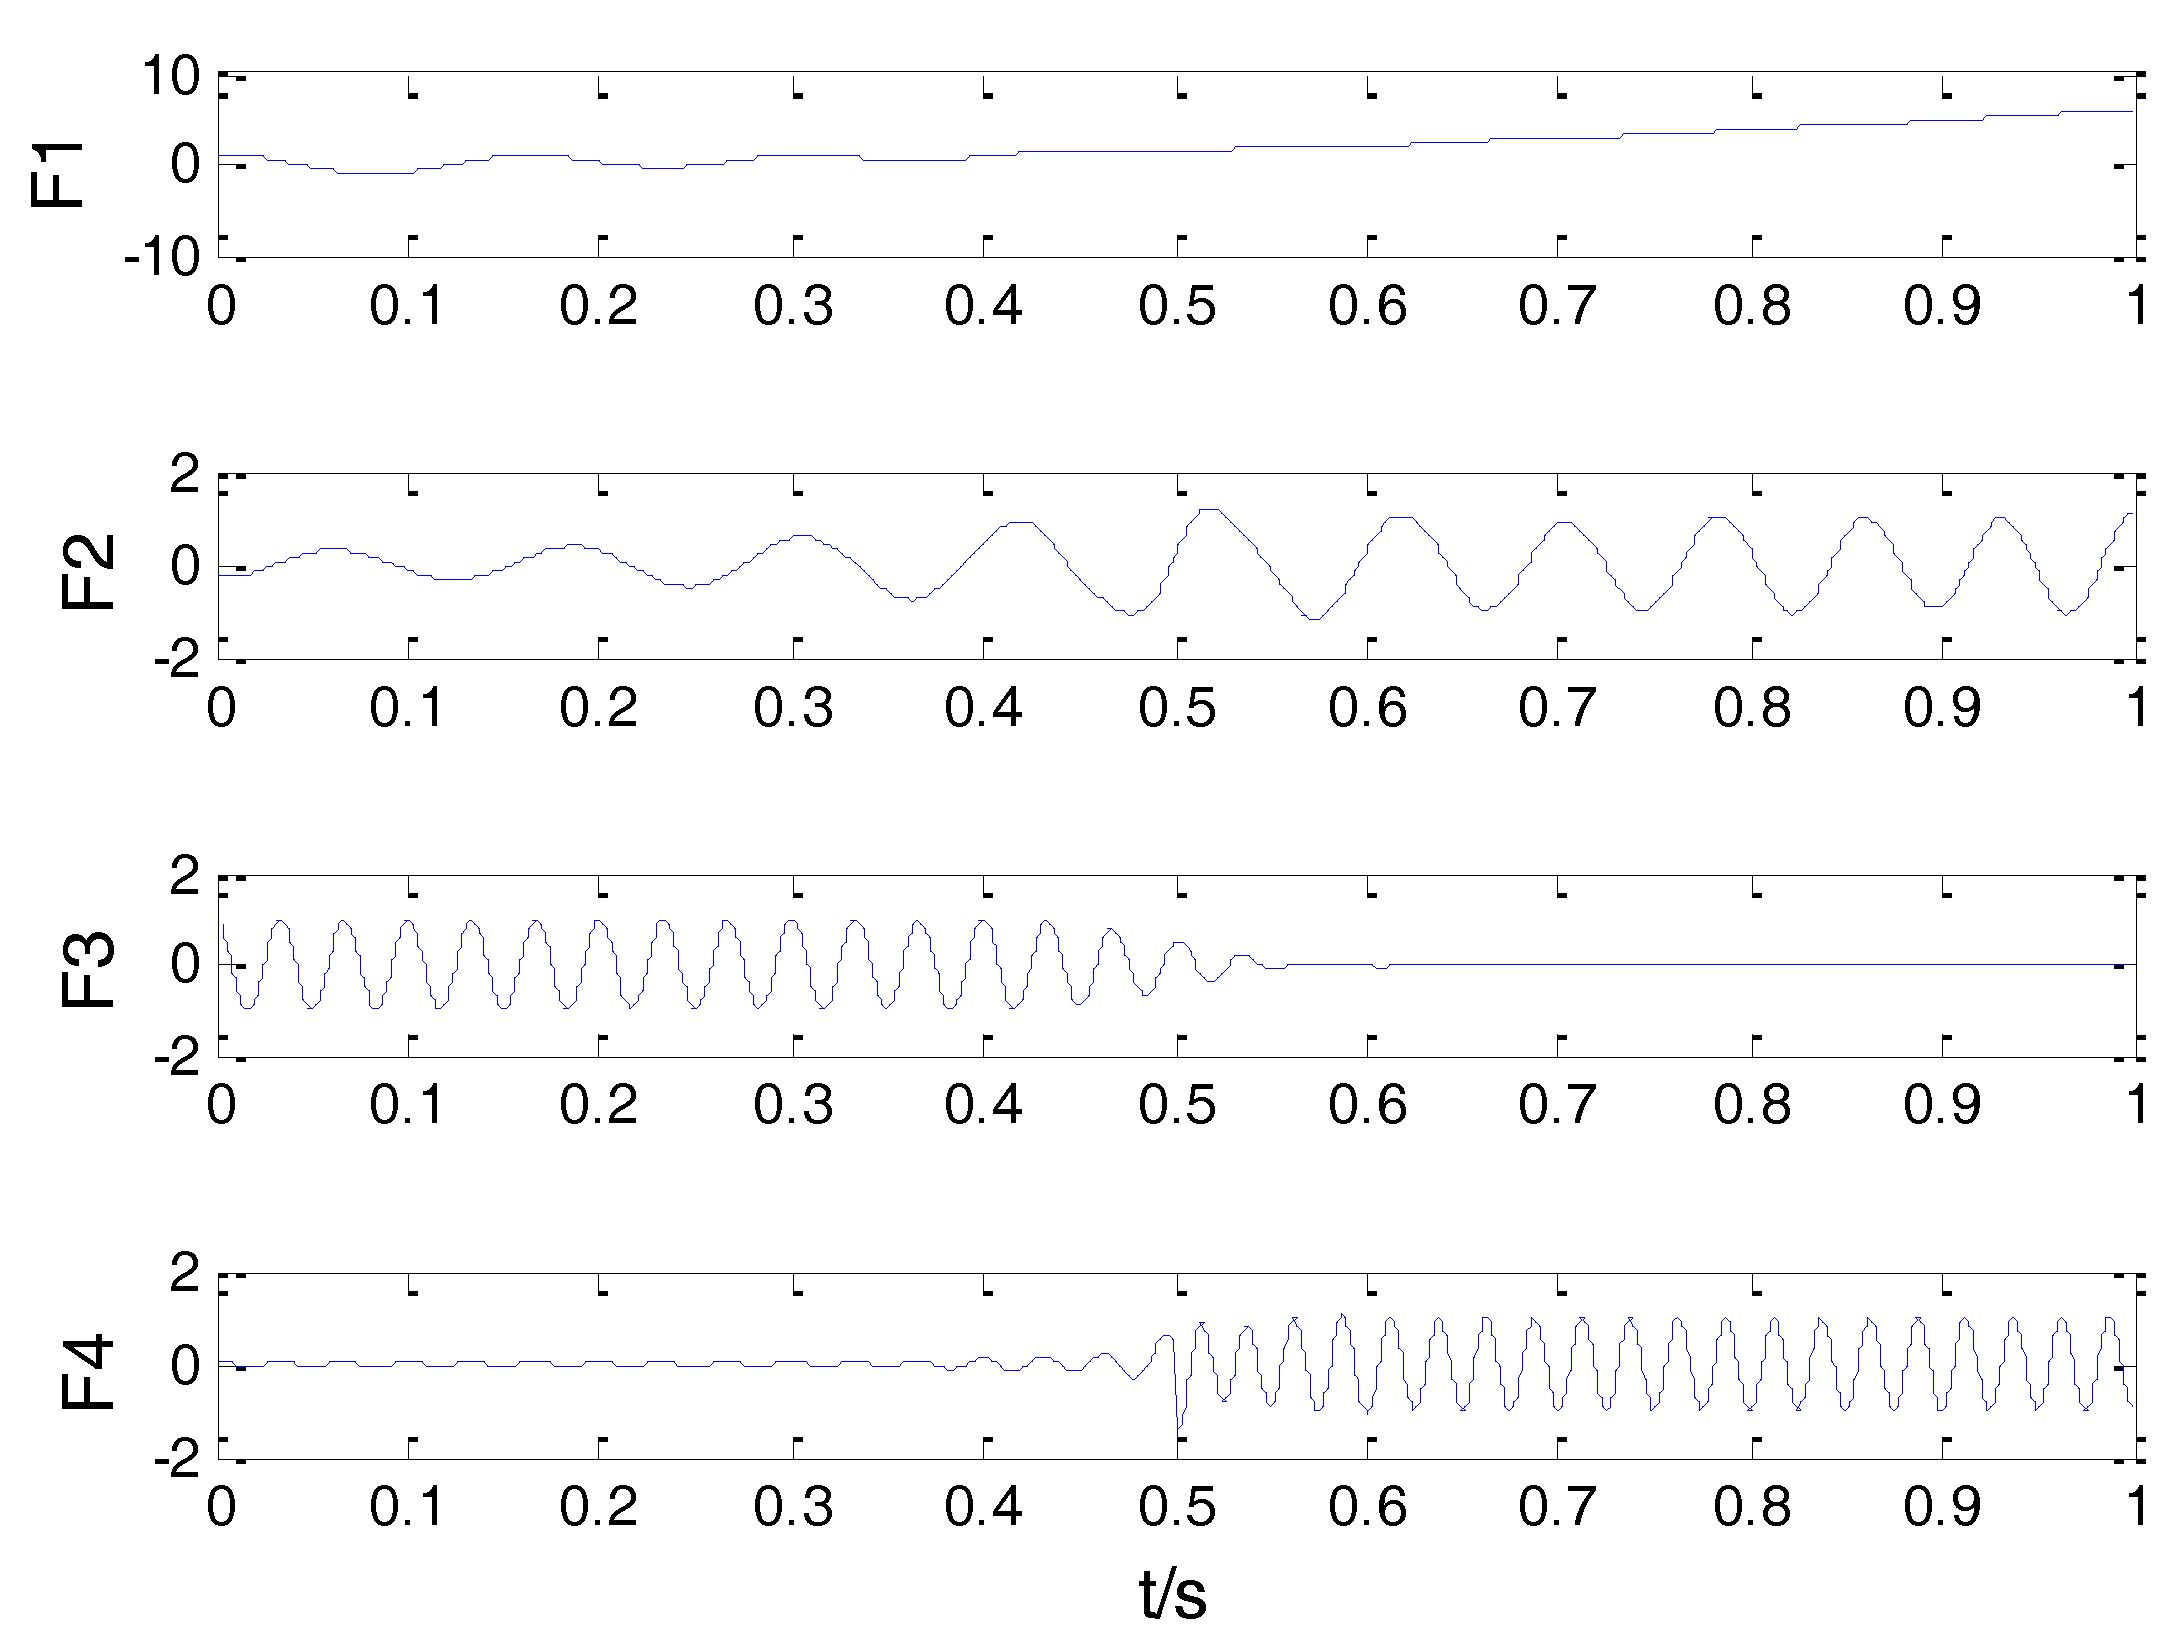
Figure 4.
Empirical mode decomposition (EMD) result of the simulated signal.
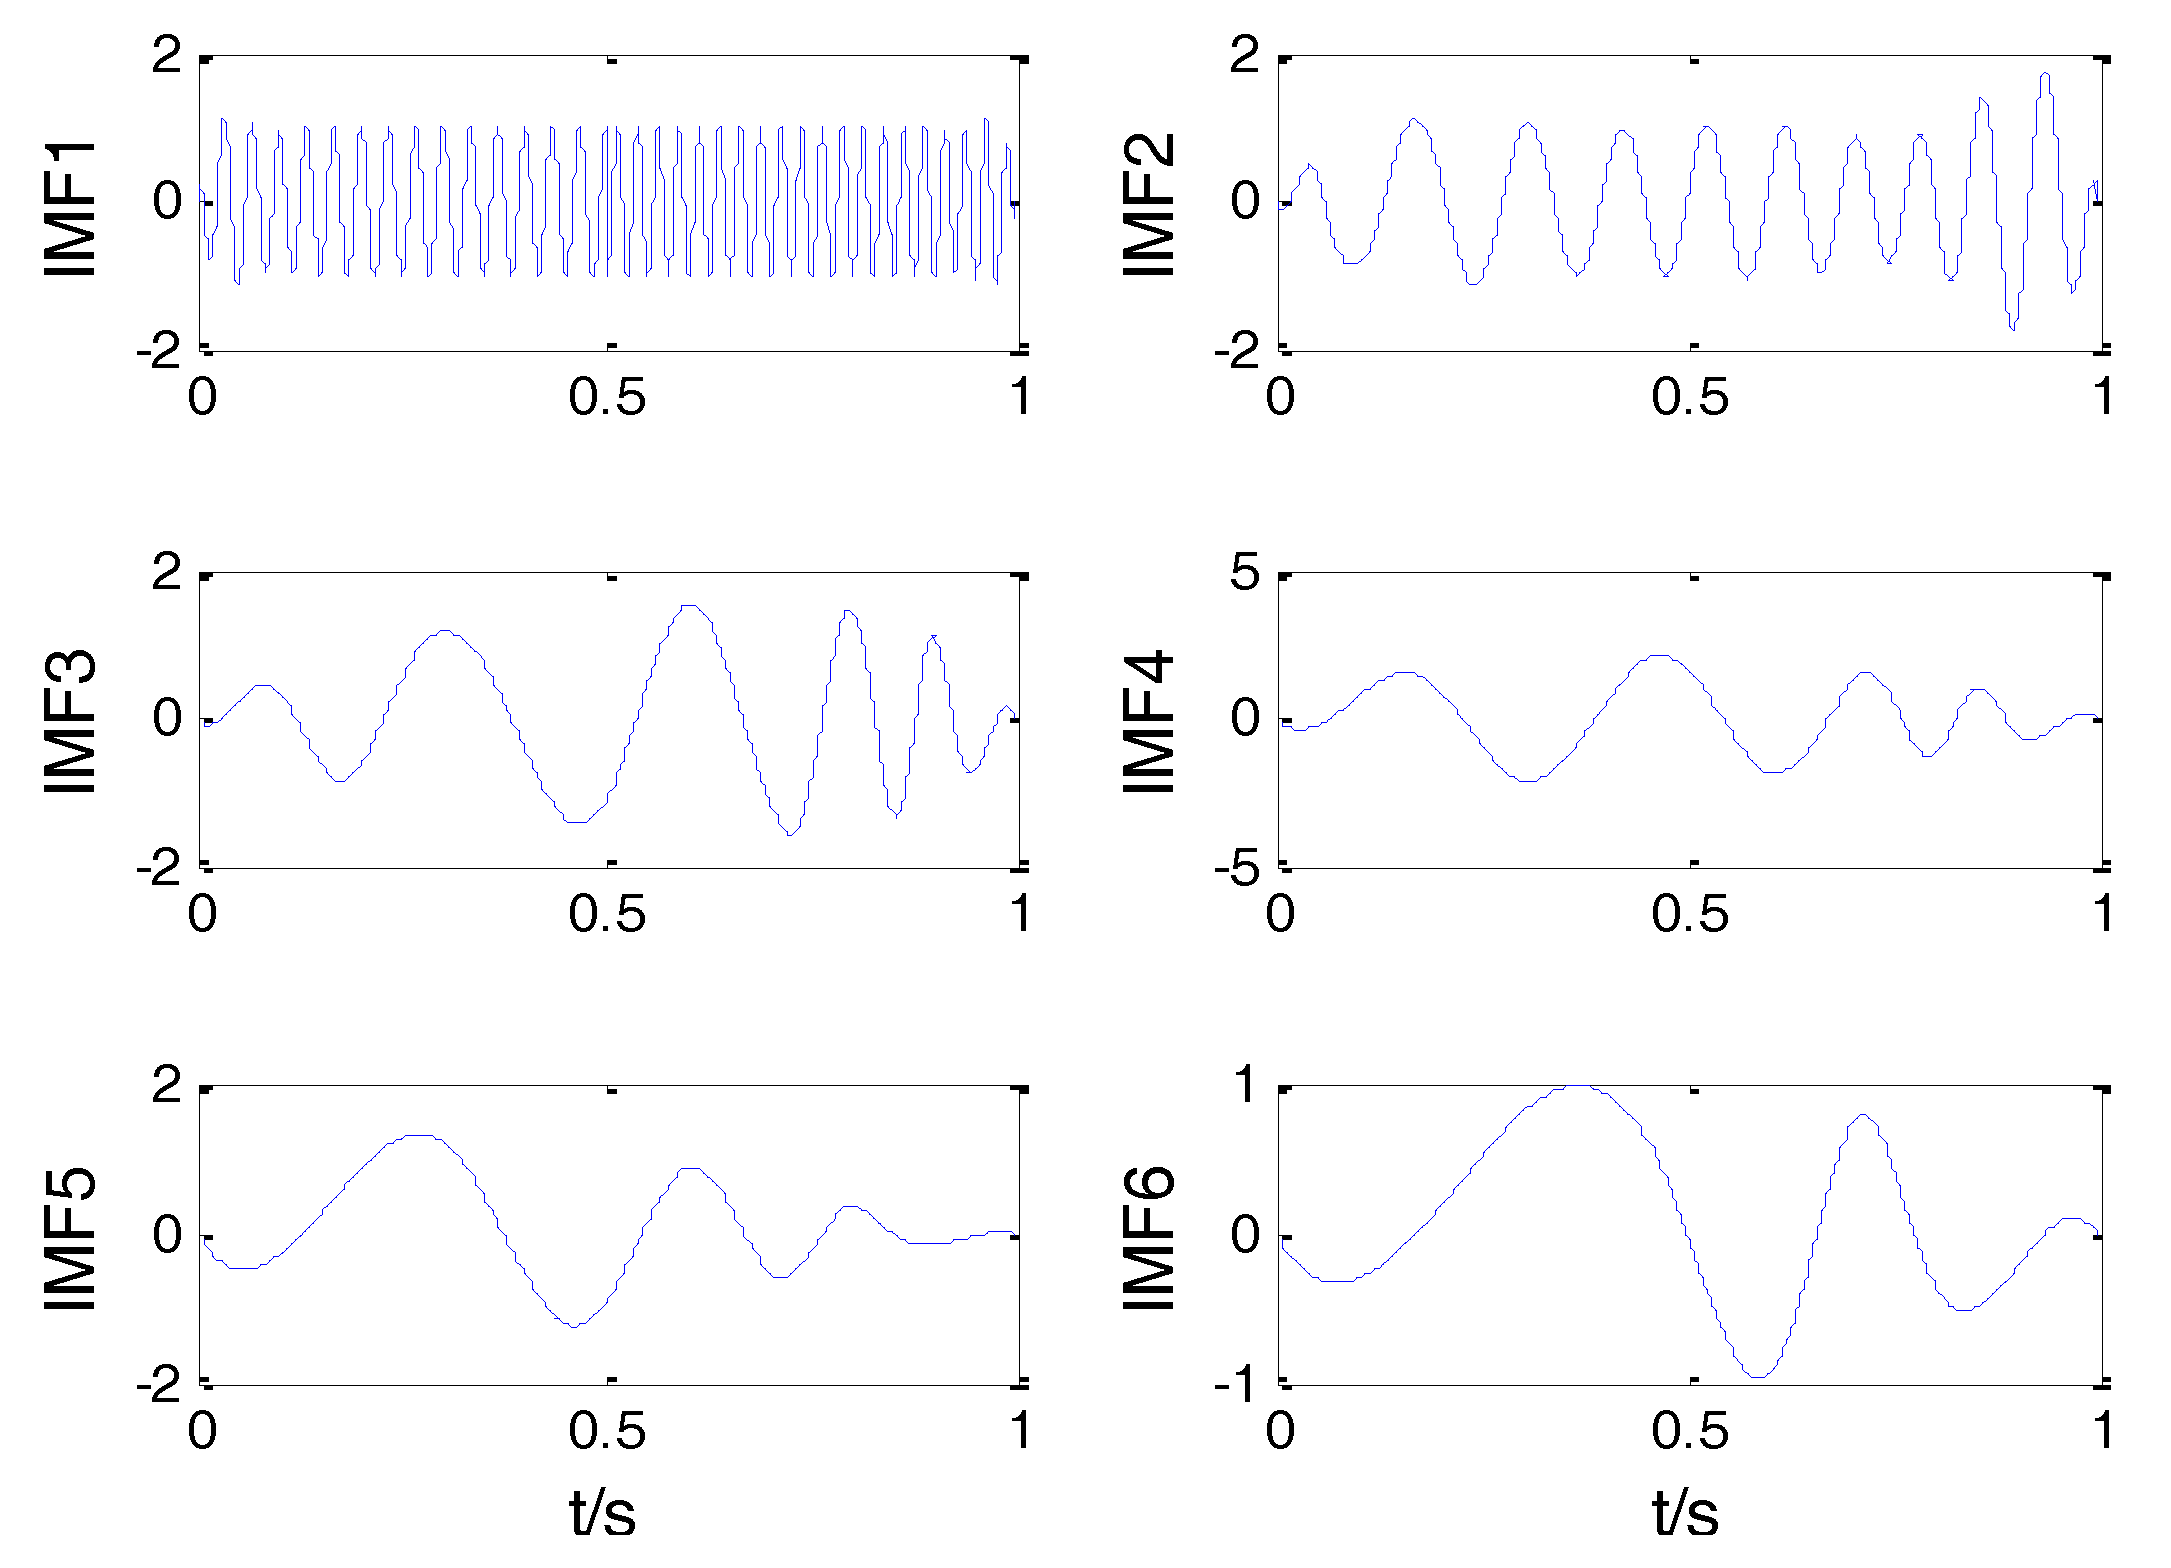
Figure 5.
Classification flowchart.

Figure 6.
The collected vibration signals: (a) normal signal; (b) outer race fault signal; and, (c) inner race fault signal.
Figure 6.
The collected vibration signals: (a) normal signal; (b) outer race fault signal; and, (c) inner race fault signal.
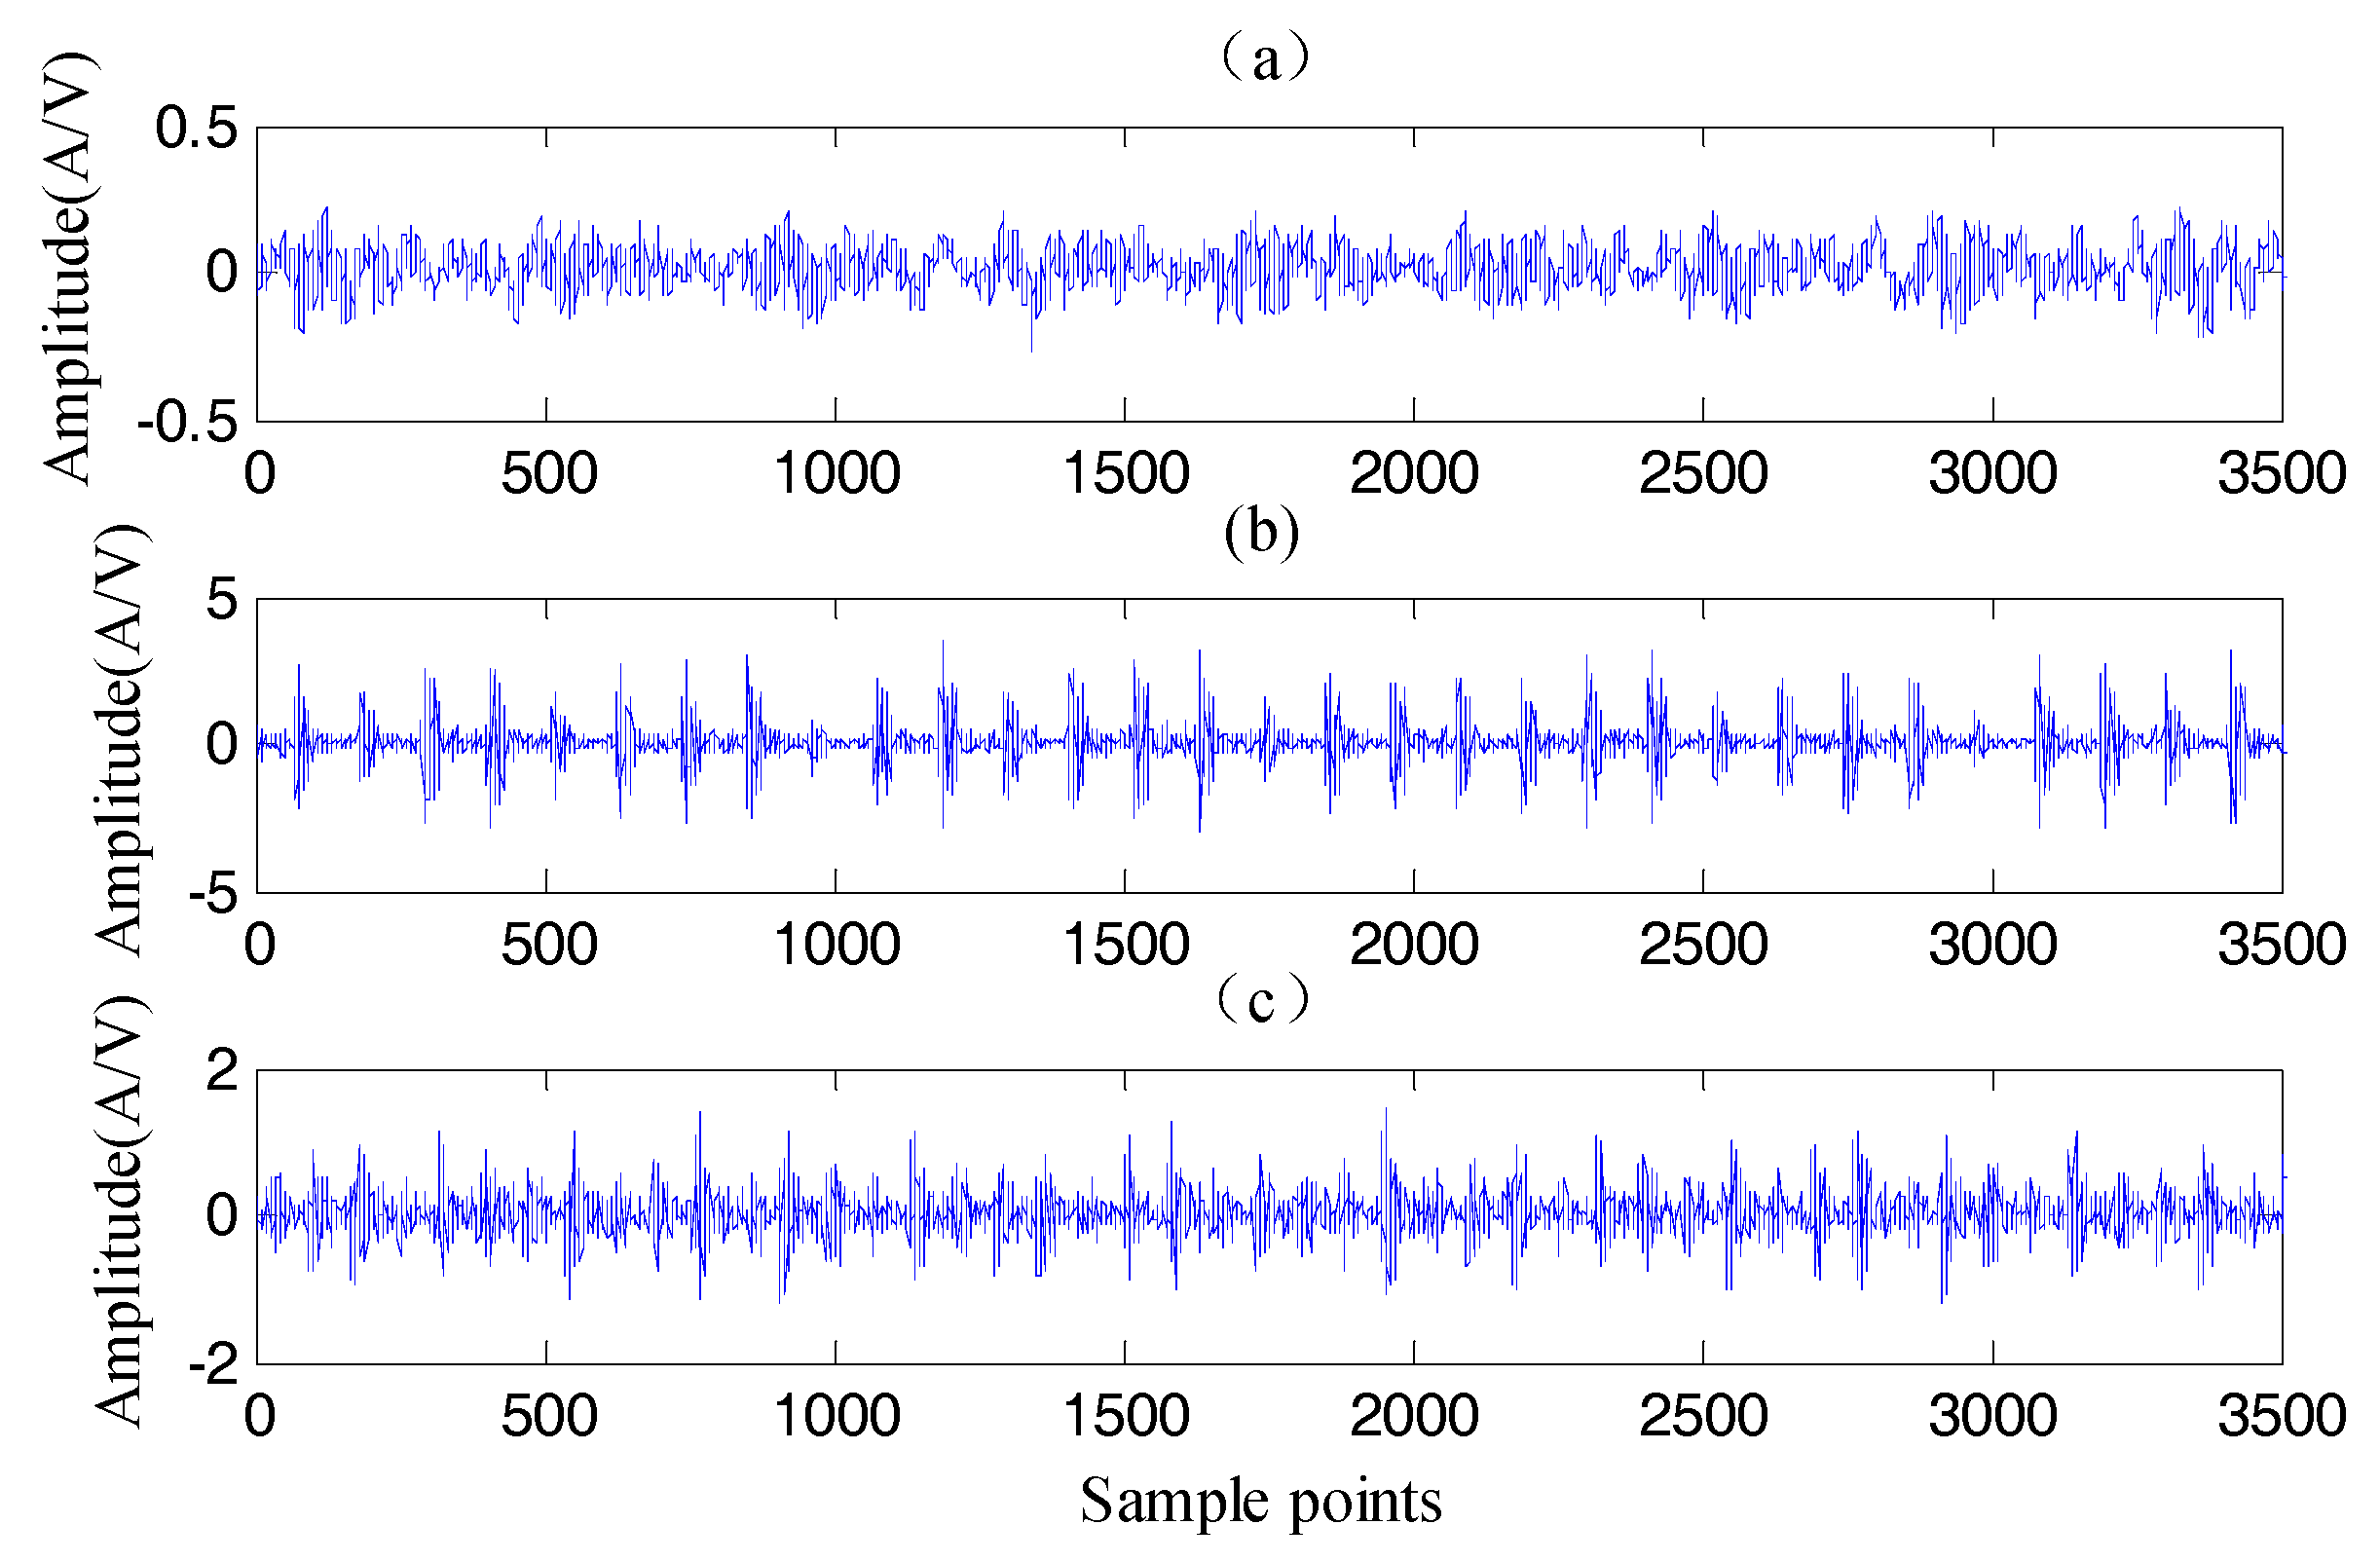
Figure 7.
EWT decomposition result of outer race fault signal.

Figure 8.
Kernel density estimation based on EMD and EWT: (a) EMD (b) EWT.

Figure 9.
The tested vibration signals: (a) normal signal; (b) outer race fault signal; and, (c) inner race fault signal.
Figure 9.
The tested vibration signals: (a) normal signal; (b) outer race fault signal; and, (c) inner race fault signal.

Figure 10.
The result of test sample: (a) Normal signal (b) Outer race (c) Inner race.

Figure 11.
Comparison of classification accuracy of the three methods: (a) Normal signal (b) Outer race (c) Inner race.
Figure 11.
Comparison of classification accuracy of the three methods: (a) Normal signal (b) Outer race (c) Inner race.


Table 1.
The mutual information of different condition.
| Different Condition | Mutual Information | ||
|---|---|---|---|
| Normal Signal | Inner Race | Outer Race | |
| Normal signal | 0.8917 | 0.1397 | 0.1581 |
| Inner ring fault | 0.2717 | 0.8742 | 0.2015 |
| Outer ring fault | 0.2092 | 0.2941 | 0.7930 |
Table 2.
The accuracy of different fault diagnosis methods.
| Different Diagnosis Methods | Training Data | Testing Data | Accuracy (100%) | ||
|---|---|---|---|---|---|
| Normal Signal | Outer Race | Inner Race | |||
| EWT-KDEC | 20 | 5 | 98 | 100 | 97 |
| EMD-KDEC | 20 | 5 | 86 | 85 | 84 |
© 2017 by the authors. Licensee MDPI, Basel, Switzerland. This article is an open access article distributed under the terms and conditions of the Creative Commons Attribution (CC BY) license (http://creativecommons.org/licenses/by/4.0/).
Share and Cite
MDPI and ACS Style
Ge, M.; Wang, J.; Ren, X. Fault Diagnosis of Rolling Bearings Based on EWT and KDEC. Entropy 2017, 19, 633. https://doi.org/10.3390/e19120633
AMA Style
Ge M, Wang J, Ren X. Fault Diagnosis of Rolling Bearings Based on EWT and KDEC. Entropy. 2017; 19(12):633. https://doi.org/10.3390/e19120633
Chicago/Turabian StyleGe, Mingtao, Jie Wang, and Xiangyang Ren. 2017. "Fault Diagnosis of Rolling Bearings Based on EWT and KDEC" Entropy 19, no. 12: 633. https://doi.org/10.3390/e19120633
Note that from the first issue of 2016, this journal uses article numbers instead of page numbers. See further details here.