On the Deposition Equilibrium of Carbon Nanotubes or Graphite in the Reforming Processes of Lower Hydrocarbon Fuels

Faculty of Chemical Technology and Engineering, Institute of Chemical Engineering and Environmental Protection Processes, West Pomeranian University of Technology, Aleja Piastów 42, 71-065 Szczecin, Poland
*
Author to whom correspondence should be addressed.
Entropy 2017, 19(12), 650; https://doi.org/10.3390/e19120650
Submission received: 9 October 2017
/
Revised: 25 November 2017
/
Accepted: 27 November 2017
/
Published: 30 November 2017
(This article belongs to the Special Issue Thermodynamics in Material Science)
Abstract
:The modeling of carbon deposition from C-H-O reformates has usually employed thermodynamic data for graphite, but has rarely employed such data for impure filamentous carbon. Therefore, electrochemical data for the literature on the chemical potential of two types of purified carbon nanotubes (CNTs) are included in the study. Parameter values determining the thermodynamic equilibrium of the deposition of either graphite or CNTs are computed for dry and wet reformates from natural gas and liquefied petroleum gas. The calculation results are presented as the atomic oxygen-to-carbon ratio (O/C) against temperature (200 to 100 °C) for various pressures (1 to 30 bar). Areas of O/C for either carbon deposition or deposition-free are computed, and indicate the critical O/C values below which the deposition can occur. Only three types of deposited carbon were found in the studied equilibrium conditions: Graphite, multi-walled CNTs, and single-walled CNTs in bundles. The temperature regions of the appearance of the thermodynamically stable forms of solid carbon are numerically determined as being independent of pressure and the analyzed reactants. The modeling indicates a significant increase in the critical O/C for the deposition of CNTs against that for graphite. The highest rise in the critical O/C, of up to 290% at 30 bar, was found for the wet reforming process.
1. Introduction
Renewed interest in the use of fuel cells as more efficient and less carbon-intensive energy solutions has caused the wet and dry reforming of lower hydrocarbons to gain attention. The Steam Reforming of hydrocarbons leads to maximum hydrogen generation. The process is significantly more efficient than other processes, such as Catalytic Partial Oxidation or Authothermal Reforming [1].
However, the water steam (wet) reforming process is highly endothermic and is usually carried out in a fixed bed catalytic reactor [2]. The process involves many intermediate reaction steps and several paths can lead to the desired product formation [3]. This makes the selection of an appropriate catalyst and its configuration difficult in order to provide high performance of the reactor with respect to the hydrogen production [4]. Conventional steam reformers deliver relatively high concentrations of hydrogen at a high fuel conversion rate [5]. The excess steam supports the completion of the reaction and inhibits coke and soot formation; however, additional heat has to be added to the system. A low steam-to-carbon ratio (S/C) equal to the oxygen-to-carbon ratio (O/C) is desired to improve the cycle’s energetic efficiency [6]. However, an important industrial problem of carbon deposition (coking) on the catalyst appears when the O/C molar ratio is too low. Most experimental studies of wet reforming have indicated that the O/C ratio should be higher than 2.5 to avoid carbon formation [2,6].
Several types of carbon formation from reformates, including encapsulating carbon, pyrolytic carbon, and carbon filaments, have been reported [7]. However, only the two latter types of deposited carbon lead to the deactivation of the catalyst. The type of carbon formed depends on the feedstock, temperature and O/C ratio. The structure of the filaments is graphene formed into tubes with a diameter close to the diameter of nickel catalyst particles. However, carbon nanotubes can also be formed without a metallic catalyst [8]. A few experimental studies of carbon deposition in wet and dry reforming processes of lower (C1 to C4) hydrocarbons have been carried out, including an analysis of various catalysts and operating parameters, such as pressure, temperature, and reaction kinetic parameters [3,9,10]. The authors of the three papers have demonstrated that different catalysts can exhibit different influences on carbon deposition.
In the dry reforming of methane using CO2, Schulz et al. [10] suggested that carbon deposition occurs via the Boudouard reaction on nickel, while, on platinum catalysts, the dissociation of methane contributes mainly to coke formation followed by an easier gasification of surface carbon. Chen et al. [11] presented the elementary reaction steps involved in filamentous carbon formation using a mechanism adopted from References [12,13]. Surface carbon was considered to be the precursor of carbon formation.
Liquified petroleum gas (LPG) is a mixture of mainly C3H8 and C4H10, and the steam reforming of LPG is also a highly endothermic reaction. Due to LPG decomposition, C2H6, C2H4, CH4, H2, CO, and the carbonaceous deposit C are produced. As in methane steam reforming, the main issue in LPG steam reforming is carbon deposition through the decomposition of ethylene and ethane at high temperatures, which leads to catalyst deactivation [14]. The Boudouard reaction, Equation (7), and the decomposition of lower hydrocarbons are the major pathways for carbon formation during LPG steam reforming. With an increase in the O/C ratio, the equilibrium of the water gas shift reaction, Equation (2), moves forward and produces more CO2 rather than CO. Therefore, a high steam feed helps to avoid carbon deposition via the Boudouard reaction, but a significant amount of carbon still forms due to the decomposition of hydrocarbons [15].
In order to improve and optimize operational conditions, a fundamental and detailed understanding of the wet and dry reforming of lower hydrocarbons in terms of carbon deposition at equilibrium is required. However, the use of solely graphite thermodynamic data in the equilibrium calculations leads to substantially smaller critical O/C values, as presented in the Results. Of special importance in the modeling process is the use of correct thermodynamic data for pure carbon nanotubes (CNTs) [16]. In addition, Wagg et al. [17] concluded that estimates of the Gibbs free energy in the literature, which are based on the growth threshold constants for filamentous carbon, are the upper bound of that energy for intermediate species.
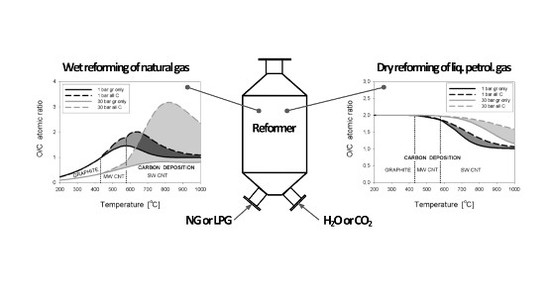
The main goal of this study is, therefore, to determine the composition of reformed natural gas (NG), as well as a reformed mixture of winter and summer liquefied petroleum gas, LPG, in the state of thermodynamic equilibrium. Thus, a minimization of the system’s total Gibbs energy algorithm is applied using commercial software. Both the dry and wet reforming processes are considered with respect to the carbon deposition phenomena. Special attention is paid to the influence of temperature and pressure on the boundaries between the carbon deposition and deposition-free zones. In the first place, the dependence of the critical O/C ratio on the temperature of all tested carbon forms is presented for four levels of the total pressure of the reacting NG and LPG wet reformates. Subsequently, deposition boundaries for the dry reformates for NG and LPG are demonstrated. Then, as in the wet reforming process, the critical O/C dependence for NG and LPG mixtures with CO2 on temperature is discussed. The deposition boundary temperatures of graphite and two types of carbon nanotubes are identified and explained here using modeling work. The main contribution of this study is the determination of the O/C ratios for varying temperature and pressure in the wet and dry reforming processes, which allow for the avoidance of the degradation of non-noble catalysts by filamentous or graphitic carbon deposits.
2. Materials and Methods
2.1. Basic Reactions
The transformations of saturated lower hydrocarbons, here methane, propane, and butane, in reactions with either water steam (wet reforming) or carbon dioxide (dry reforming) are intended to produce mainly hydrogen and carbon monoxide. The steam reforming of methane can be described [9] using the following reactions:
which can also be presented in the summary form (Equation (3)):
CH4 + H2O = CO + 3H2
CO + H2O = CO2 + H2
CH4 + 2H2O = CO2 + 4H2.
The desired reactions of wet and dry reforming can be presented in their general forms (Equations (4) and (5)) as:
with n = 1, 3, or 4 for methane, propane, or butane, respectively. Several other reactions can also take place, e.g., the water gas shift reaction, Equation (2), which is mildly exothermal, whereas the reforming reactions, Equations (8) and (9), are highly endothermal (see Table 1).
CnH2n+2 + n H2O(g) = n CO + (2n + 1) H2
CnH2n+2 + n CO2 = 2n CO + (n + 1) H2
The reforming reactions proceed in the gas phase and at the catalyst’s surface. One of the many reaction products is gaseous carbon, C(g), which participates in the following reversible reactions (Equations (6)–(9)).
CH4 = C(g) + 2H2
2CO = C(g) + CO2
CO + H2 = C(g) + H2O
2H2 + CO2 = C(g)+ 2H2O
Carbon can precipitate from the gas phase form, C(g), forming the solid phase form, C(s) (Equation (10)):
C(g) = C(s).
However, the energetic effect of the phase transformation depends on the carbon allotrope form, both in the gas (g) and solid (s) states.
2.2. Thermodynamic Relationships
The extent of an equilibrated “i” reaction is determined by the change in the standard chemical potential of the involved reactants, , i.e., in the standard partial molar Gibbs energy. The standard values of the chemical potential, , and molar enthalpy,, are computed from the relevant values of the substrates and products of the “i” reaction, based on the definitions in Equations (11) and (12).
The stoichiometric coefficients, , correspond to the reactant “j” participating in the “i” reaction. However, the chemical potential of a reactant “j” represents the sum of the standard potentials of all pure “e” element atoms, included in the reactant species, plus the chemical potential of formation, , of the considered species “j”:
The generally accepted convention in physical chemistry assumes that the standard chemical potential value, as the reference value for stable single atomic species at the reference temperature, Tr = 298 K. This is also valid for O2(g) and H2(g) in the gas phase, as well as for solid graphite, Cg(s). As a result, the standard chemical potential of formation of a pure species “j”, , can be identified by its standard chemical potential, . Similar remarks on the standard, formation, and reference values are also valid for the molar enthalpy of a species, . Values of the chemical potential of formation and the molar enthalpy of formation can be calculated from published data, e.g., from Yaw’s critical property data [18], usually as polynomial functions of temperature (T).
Calculations of the reaction enthalpies and chemical potentials for reactions of Equations (2), (4), and (5), based on Equations (11) and (12) and data of Reference [12], lead to the reference values shown in Table 1.
The deposition of an allotropic form of solid carbon, Ck(s), from its gas phase, Ci(g), is conditional on exceeding the equilibrium pressure, P*Ci(g)/Ck(s), using the partial pressure, , of gaseous carbon produced in reactions such as those of Equations (6)–(9). The equilibrium pressure of carbon vapor is very low [16], and therefore is easy to surpass. In the deposition case of graphite, Cg(s), the equilibrium pressure can be computed from Equation (14) using the chemical potentials of graphite and carbon vapors, Ci(g).
The numerator of Equation (14), , represents the standard chemical potential of formation of graphite from gaseous carbon molecules. The standard state pressure, P0, of any pure species is generally assumed to be 1 bar [19]. Since the chemical potential values of both carbon vapors and graphite are well-known, Equation (14) can be presented in the form of a correlation, as per the authors of Reference [20], which in SI units (P* in Pa, T in K) reads:
In the thermodynamic equilibrium (denoted by “*”) of many possible parallel reactions, the relevant partial pressure of carbon vapors results from two conditions: (i) a minimum of the total Gibbs energy, G, of the analyzed system that consists of a set of nj moles of species “j”:
and also from (ii) equal partial molar Gibbs energies, i.e., chemical potentials of the “j” species, in all phases; gas (g), liquid (l), and solid (s).
The chemical potential of a species, μj, is the sum of its standard value, μj0, and the contribution from the ratio of the species activities in a current state, aj, and in the standard state, aj0.
The aj activity depends on temperature (T), pressure, P, and the composition of the considered phase. With a stoichiometric equation for the “i” reaction involving chemically reacting species, Aj, the condition of Equation (16) leads for constant (P,T) to a set of Equations (19), one for each reaction.
The chemical potentials at equilibrium, , fulfil Equation (19) by adjusting the “j” species activity, aj, which is proportional to the species’ partial pressure, Pj, in the reacting gaseous mixture.
For species’ partial pressures that are greatly lower than the critical pressure, and for its temperature being much higher than the species’ critical temperature, its fugacity coefficient, , practically equals 1.0 [19], i.e., .
Various algorithms have been proposed for computing simultaneous phase and reaction equilibria by a constrained minimization of the system’s total Gibbs energy, Equation (16), e.g., by the authors of Reference [21]. Such algorithms to determine the composition of each phase at the thermodynamic equilibrium were adopted in commercial programs, such as Aspen Plus [22] or HSC [23]. In the present study, the latter code is used.
2.3. Modeling Procedure
Carbon deposition (coking) can occur in fuel reforming reactors and is detrimental to non-noble metal catalysts. Therefore, the reported computations are carried out to detect the deposition onset of given fuel-reactant compositions. The transition of a reformed mixture from no solid carbon presence to the first appearance of carbon deposition is called critical, and has usually been quantified by means of either the molecular, O2, or atomic, O, oxygen (or water steam, S) ratio to atomic carbon, C. In this study, the atomic oxygen-to-carbon ratio, O/C, is applied.
Natural gas (NG) is assumed to consist mainly of methane. Its composition is typically 95% methane, close to 3.5% higher hydrocarbons, and about 1.5% inert gases. The LPG fuel is treated in the calculations as an average of the winter and summer fuels of major European providers. Such averaging resulted in a mixture of a propane molar ratio of 0.5725 and a butane ratio of 0.4275. The temperature was varied from 200 °C to 1000 °C, and the pressure set from 1 bar to 30 bar in the present study. Such a pressure range was chosen in order to include the elevated pressure applied in the studies of References [10,24] for the dry reforming of methane. However, most of the published experimental and numerical studies were carried out at atmospheric pressure. The same ranges of temperature and pressure were used previously for the modeling of the catalytic partial oxidation of the two fuels [25].
The type and amount of deposited carbon allotrope depend on temperature and the reforming catalyst applied. However, only a few publications have focused on the deposition of filamentous carbon, with most of them having focused on graphite. On the other hand, the estimates of the chemical potential of filamentous carbon in the literature, which are based on the reactant partial pressures at the coking threshold, differ greatly [16]. Therefore, only experimental electrochemical data for the purified filamentous forms of solid carbon [26,27] are accepted in this present study. The chemical potentials were estimated from the measured electromotive force of high-temperature solid-state galvanic cells. It should be mentioned that the computational chemistry PM3 approach [28] was also successfully applied to predict thermodynamic potentials for single-walled carbon nanotubes of various chiral indexes; however, this was only for the single temperature of 298 K.
The most stable form of solid carbon, Ck(s), is the one with the smallest value of (also ), and in equilibrium conditions, the “k” form will appear in its solid phase provided the carbon vapor pressure exceeds the relevant equilibrium one, such as that in Equation (14) for graphite. Such criteria are also employed in the commercial HSC software [23] that was chosen to compute whether a solid carbon allotrope appears in the equilibrium state, and if so, which one. However, the HSC standard database only contains data for graphite, diamond, and amorphous carbon. The database was therefore supplemented with re-formatted literature data [26,27] for the standard chemical potential of multi-walled carbon nanotubes (MWCNT) and single-walled nanotubes in bundles (SWCNT). The format of the additional data was described in Reference [25].
The input data sets in the applied HSC software [23] consisted of a varied number of moles of the chosen reactants to result in 106 kmol of the total atom-moles of C, H, and O. In addition, conditions of the target equilibrium for temperature, pressure, and a list of likely species were included in the input data. That list for the gas phase contained the following species: carbon allotropes of C1 to C5, CO, CO2, H2, H2O, O2, and organic compounds with one to four carbon atoms in the molecules of: saturated and unsaturated hydrocarbons, alcohols, aldehydes, and ketones. In the analyzed ranges of temperature and pressure, no liquid phase was assumed to exist. Only the following five carbon solid allotropes—graphite, diamond, amorphous, MWCNT, and SWCNT in bundles—were allowed to possibly appear in the solid phase. However, in the present modeling, no indication of deposits of diamond or amorphous carbon were found for the analyzed systems.
The HSC software allows for the execution of a series of consecutive runs to compute equilibrium phase concentrations for stepwise increased temperature. Typically, 100 temperature steps of 1 °C per step were chosen within the range of 200 °C to 1000 °C. In addition to the composition of the gas phase, the amount and type of the solid carbon allotropes were also computed. The scheme was used to determine the threshold temperature for which a step change to 0 kmol in the solid carbon amount occurred, which was usually from more than 104 kmol or vice versa. That threshold (critical) temperature, for a given O/C ratio, was then taken as the mean of those two neighboring temperatures, differing always by 1 °C. Thus, the accuracy of the determination of the critical temperature can be assumed to be ±0.5 °C. The plotted line of the O/C ratio versus the critical temperature separates the carbon deposition region and the deposition-free region. These computations were always executed for a constant pressure, which was fixed at one of the four levels 1, 3, 10, or 30 bar.
3. Results
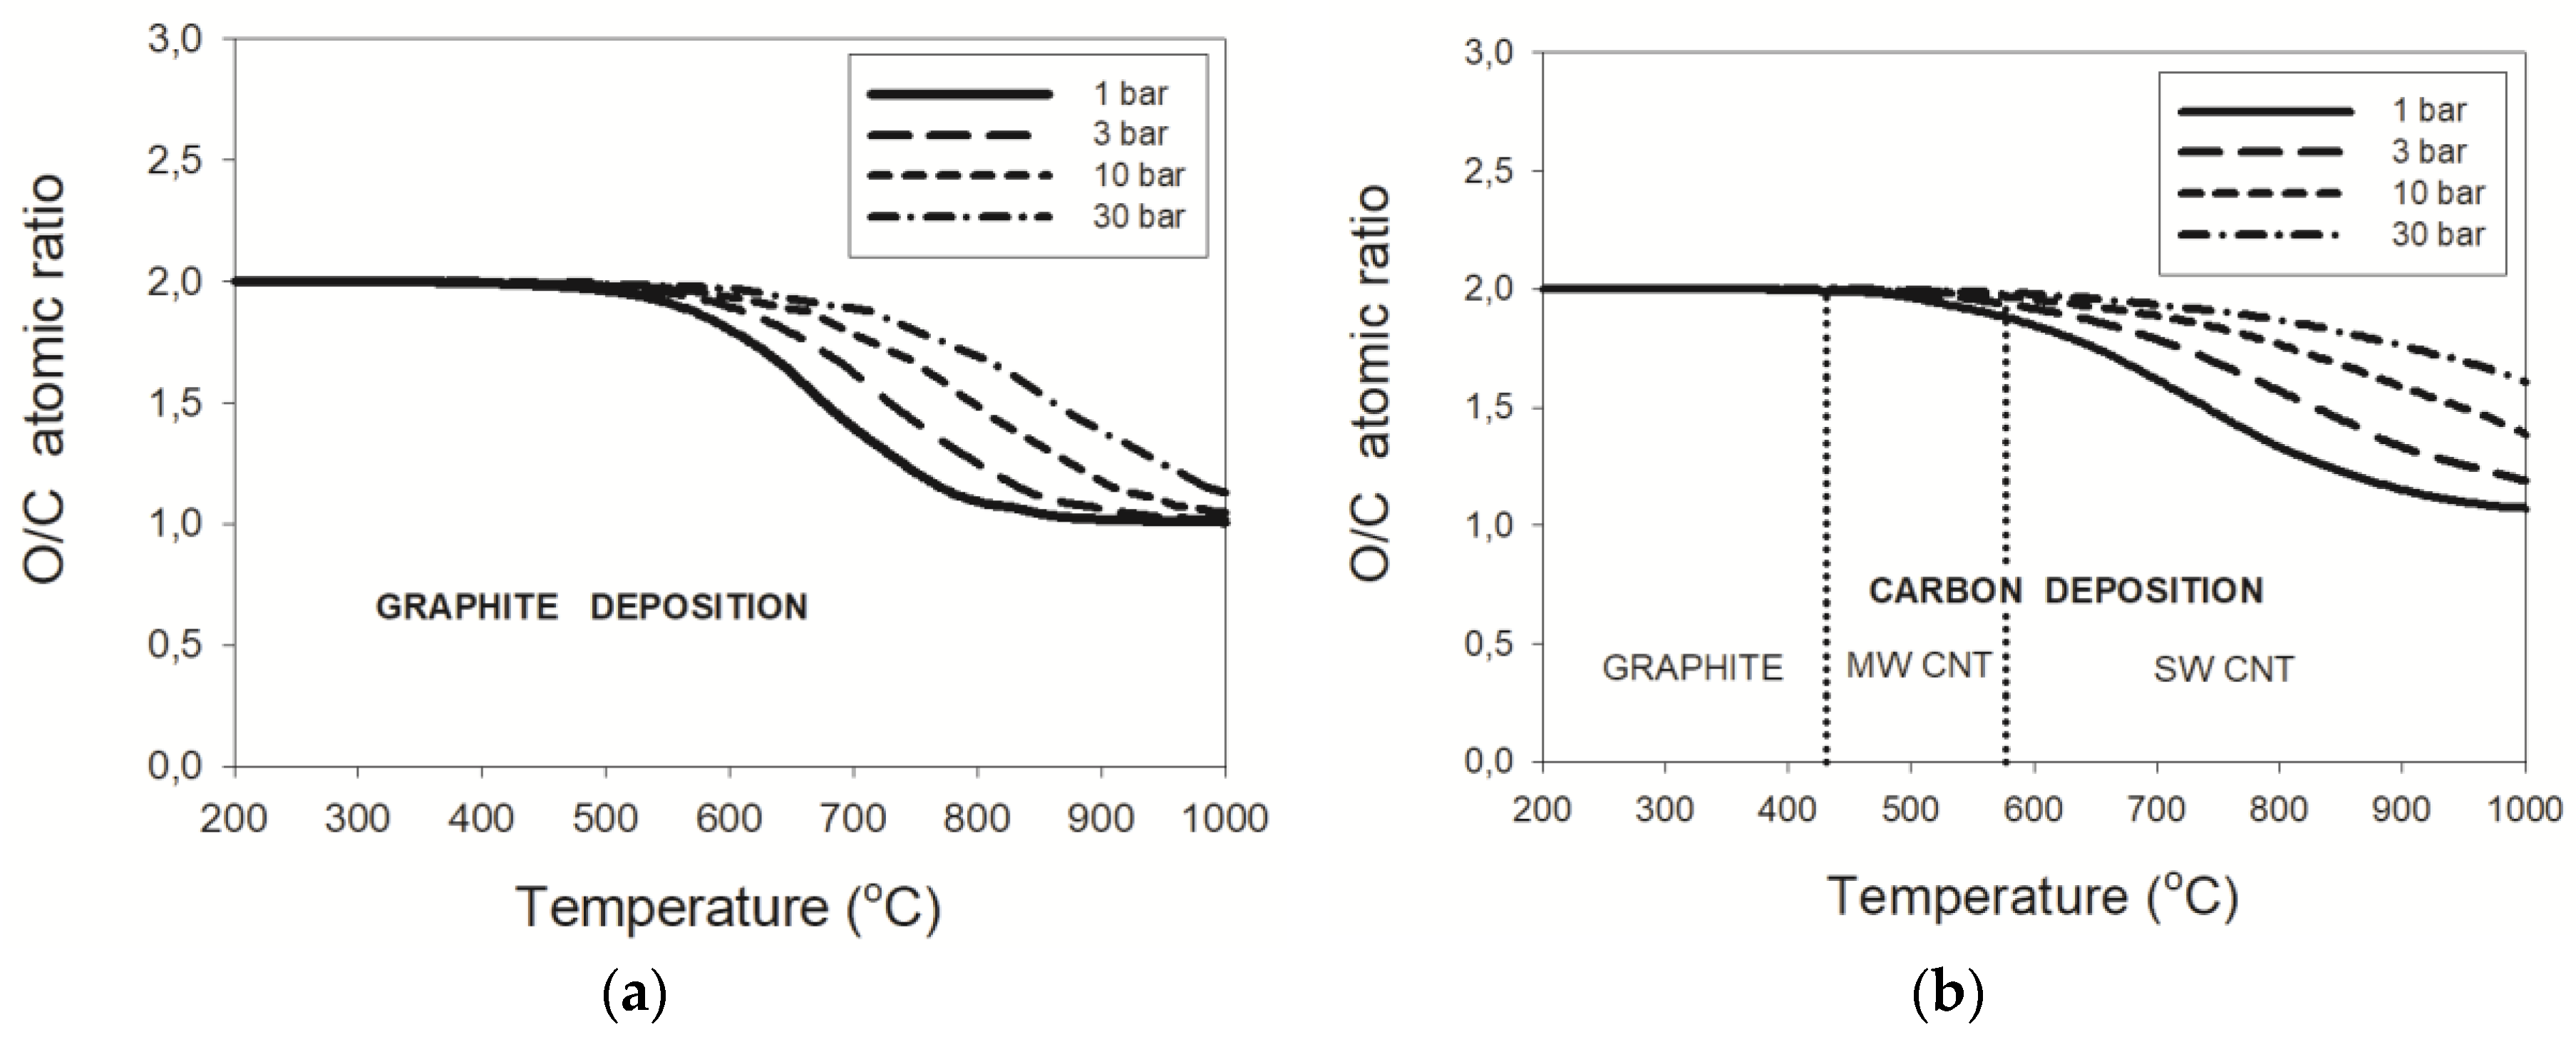
The computed influence of temperature and pressure on the boundaries between the carbon deposition and deposition-free zones are described in separate subsections for the wet (with pure H2O) and dry (with pure CO2) reforming of natural gas (NG) and liquefied petroleum gas (LPG). The hydrogen content in the C-H-O reformates was assumed according to the relevant reaction, either Equation (4) or Equation (5). The computing results are shown here separately for the two fuels in the O/C = f(T) diagrams, which contain four critical curves to display the influence of the form of solid carbon and pressure. The figures, from 1 to 6, have two adjacent diagrams, with: (a) graphs for just graphite deposition; and (b) graphs for the predicted deposition of either graphite or filamentous carbon, either MWCNT or SWCNT.
3.1. Wet Reforming
3.1.1. Natural Gas (NG)–Water Mixtures
The boundary lines separating the deposition/deposition-free regions for thermodynamic equilibrium are computed using the described computational procedure and are presented in Figure 1, Figure 2 and Figure 3. The dependence of the threshold line of the atomic oxygen-to-carbon ratio O/C = f(T) for depositing solely graphite is presented in Figure 1a for four levels of the total pressure of the reacting NG–water steam mixture. By raising the temperature from 200 °C, a continuous increase in the boundary oxygen-to-carbon ratio can be noticed, up to a maximum, and then an O/C decrease follows. The starting point, maximum, and end values of the threshold O/C ratio are found to be dependent on the process pressure, with lower values of the critical O/C for higher pressure. The three characteristic values for the two boundary pressures of 1 bar or 30 bar are about (0.23, 1.45, 0.99) or (0.10, 0.82, 0.80), respectively. It follows from Figure 1a and the listed values that both temperature and pressure have a considerable impact on the critical O/C value.
The course of the critical O/C curves is significantly different when the presence of solid carbon nanotubes was also considered in the equilibrium computations for NG reforming with water, cf. Figure 1b. Though the curves for the graphite deposition region remain unchanged, the MWCNT deposition region starts at 431 °C and it is characterized by higher threshold O/C values than those in Figure 1a. Most importantly for practical reforming is that the maximum O/C values to avoid SWCNT formation are computed to be much higher than those for graphite. In addition, the temperatures of the maximum points also shifted to higher values. The values of the maximum critical O/C with their corresponding temperatures are (2.0 at 630 °C), (2.4 at 690 °C), (2.7 at 750 °C), and (3.2 at 820 °C) for the process pressures of 1, 3, 10, and 30 bar, respectively. The results also indicate a partly different trend in the pressure’s influence on those maximum values than that for the graphite-only deposition. Moreover, the minimum O/C value of 2.5 [6] is found to be strongly exceeded for pressures above 3 bar.
3.1.2. LPG–Water Mixtures
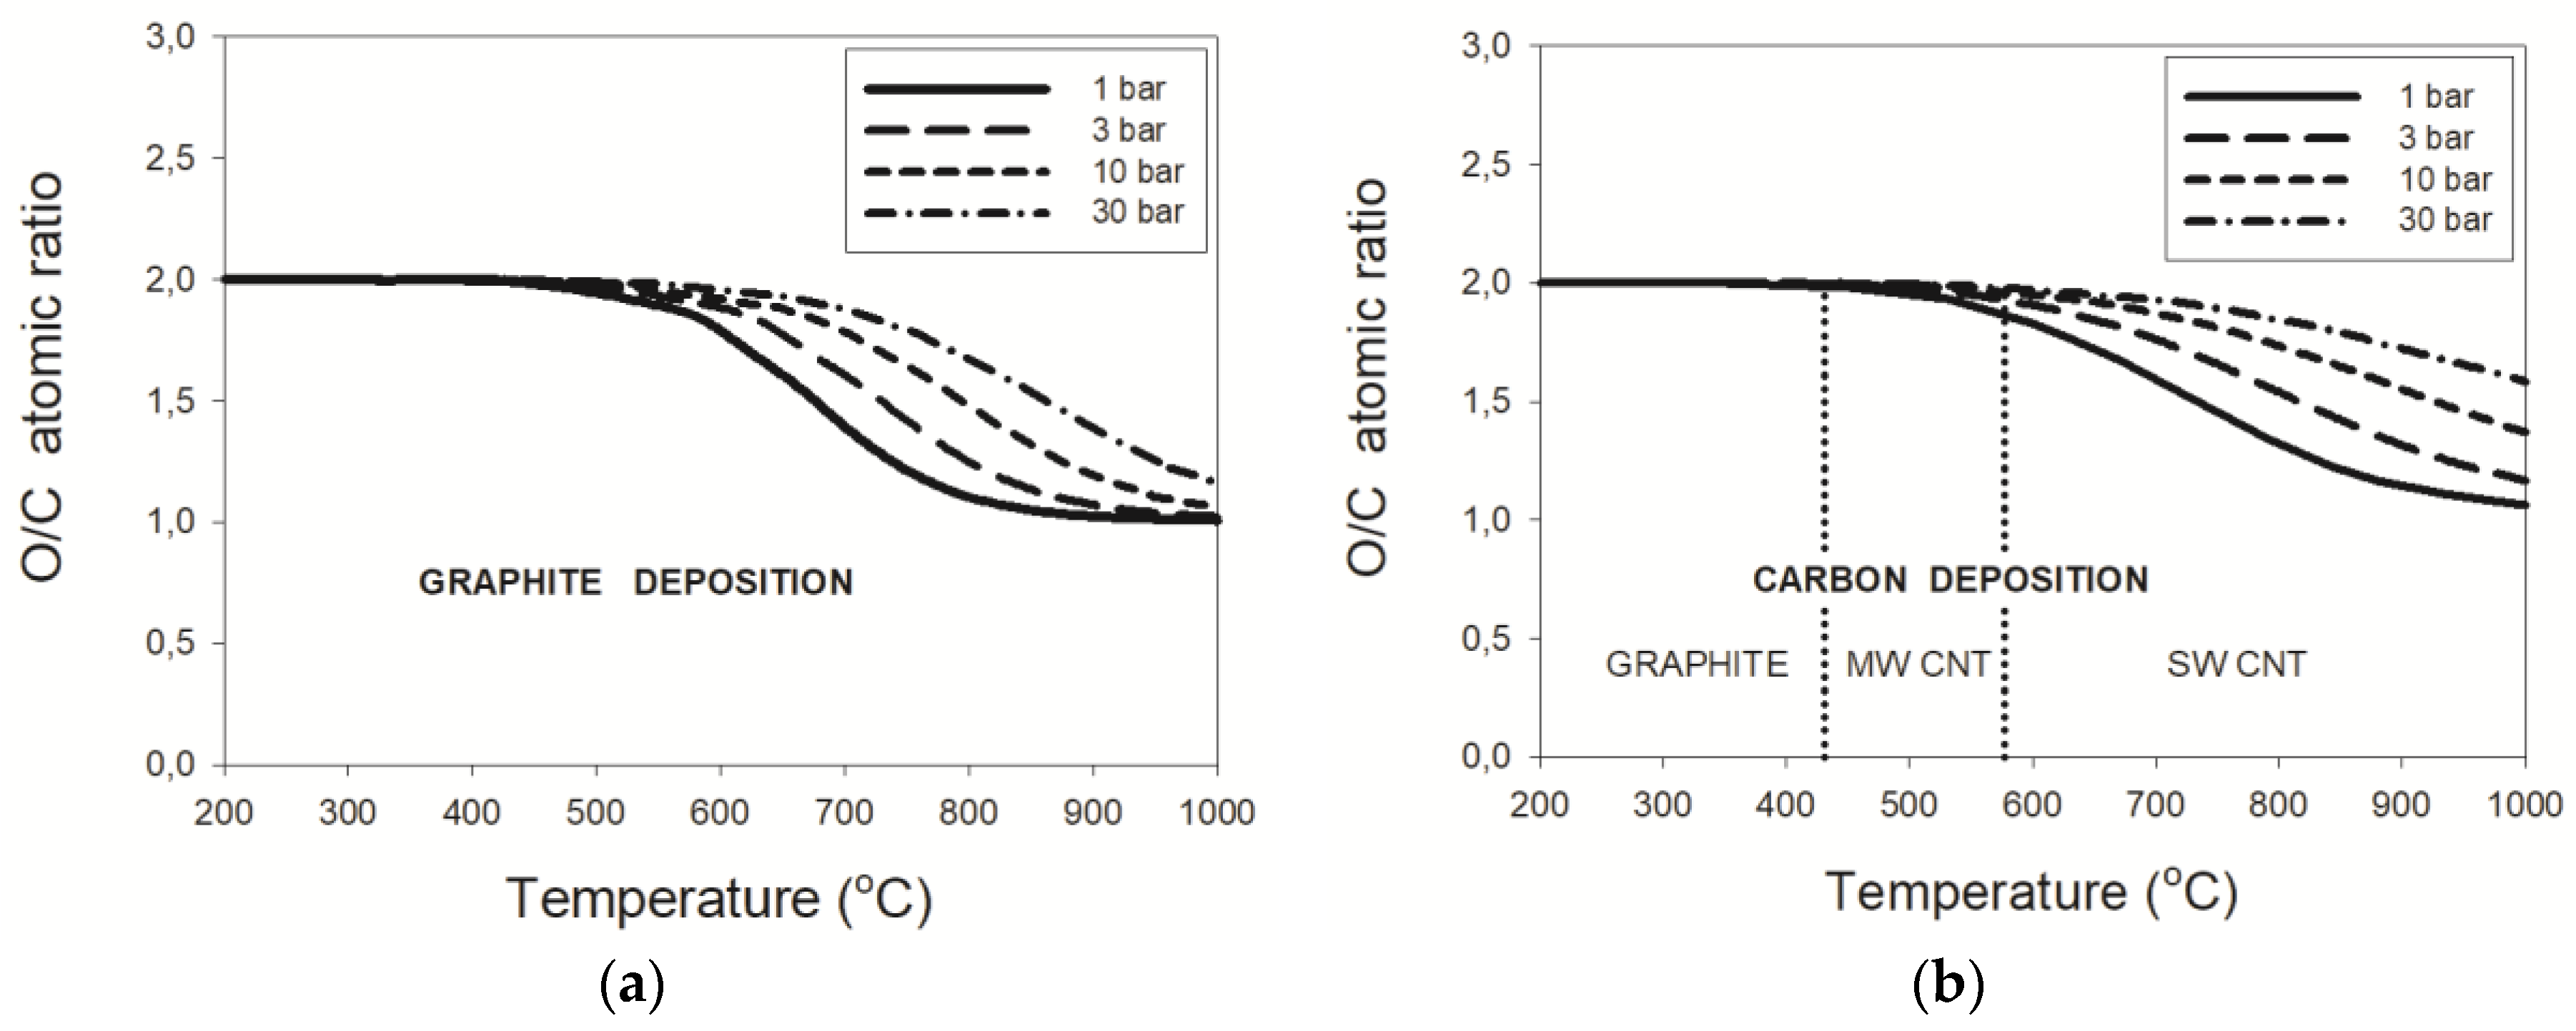
The threshold lines for the liquefied petroleum gas (LPG) reformates with water are shown in Figure 2a,b, and they significantly differ from their counterparts for the NG reformates. As shown in Figure 2a, by increasing the temperature from 200 °C, first a continuous lowering in the boundary O/C ratio can be noticed, from nearly 1.9 down to a minimum that depends on pressure; then, its increase follows to a maximum and finally again a decrease towards 0.9 to 1.0 at 1000 °C. Differences in the starting point, as well as the maximum and end values of the critical O/C ratio for graphite in the wet reforming of LPG, are found to be less dependent on the process pressure than for NG. This conclusion follows from a comparison of Figure 1a and Figure 2a.
Nevertheless, the course of the threshold lines of all possible deposits from the LPG reformates with water (Figure 2b) mostly differ from those for the natural gas–water mixtures in the regions of depositing graphite and MWCNT, i.e., for temperatures below 577 °C. Surprisingly, accounting for depositing carbon nanotubes resulted in significant and very similar changes in O/C = f(T) to those for the NG–H2O reformates in the region of SWCNT deposition. The values of the maximum allowable O/C in LPG wet reforming shown in Figure 2b are practically the same as those for NG wet reforming (Figure 1b), with only slight increases of about 20 °C in the temperature of the O/C’s maximum point.
3.1.3. Pressure Effects
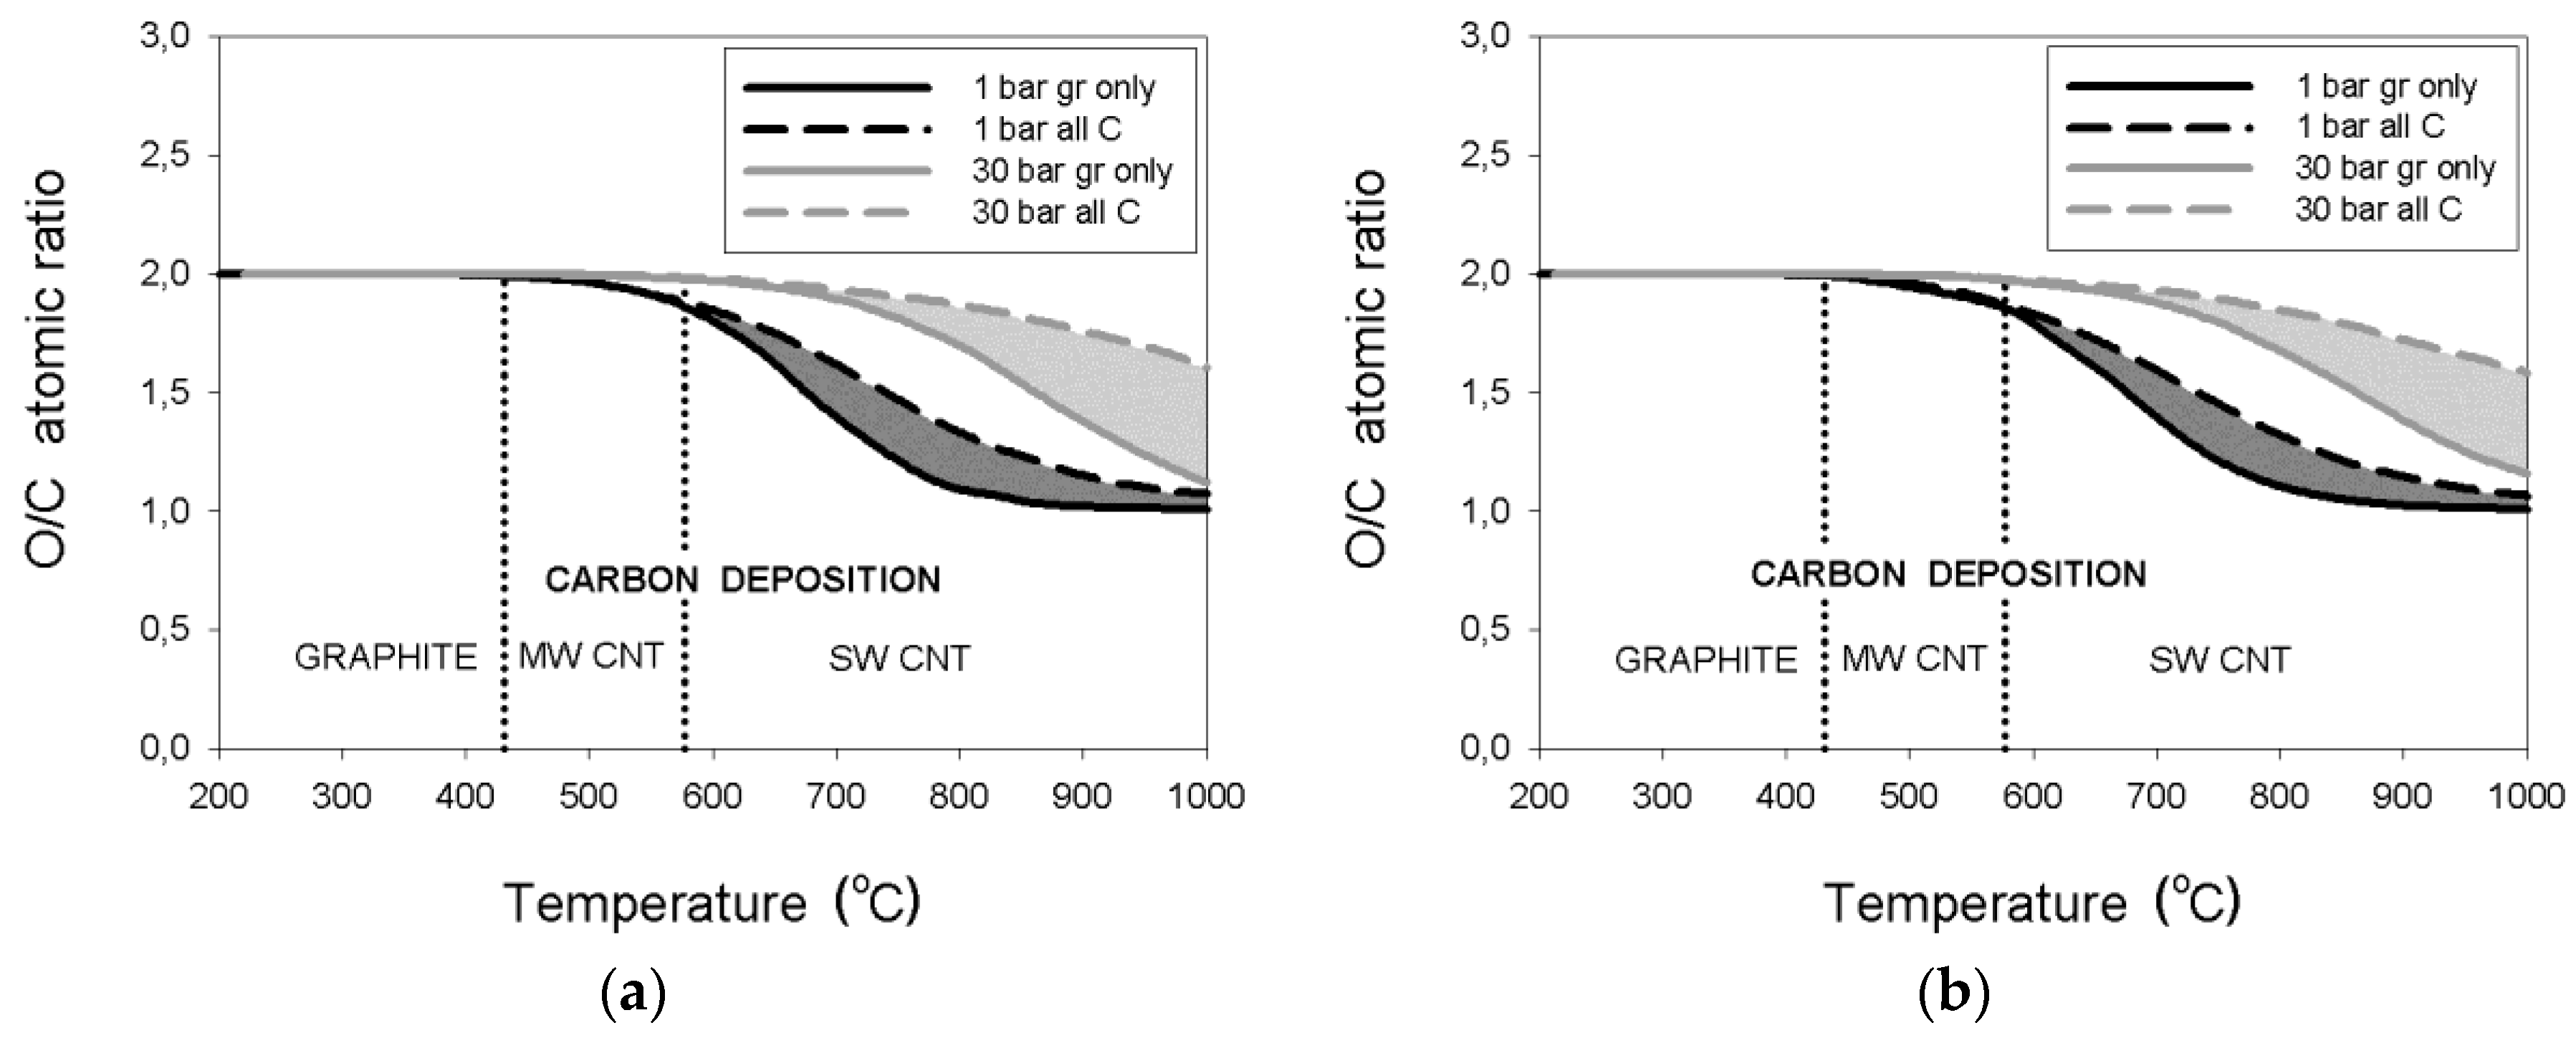
The process pressure was also found to have a substantial influence on the critical O/C ratio in wet reforming. With the purpose of clearly showing the joint effect of pressure and filamentous carbon deposits, Figure 3a,b was constructed for the wet reforming of NG and LPG, respectively. The solid lines represent the dependence of the critical O/C against temperature when only graphite was allowed to appear in the solid phase, “gr only”, and the broken lines show that dependence for all considered solid carbon allotropes, “all C”. To better visualize differences in O/C values for graphite only versus all carbon allotropes, the differences are shown in Figure 3 by shading. Both the critical lines and shaded areas use black for 1 bar and gray for 30 bar.
The maximum difference of about 0.6, in the threshold O/C values between the lines for depositing graphite-only and graphite/filamentous carbon, occurs for 1 bar close to 630 °C for the two wet reformates. Much higher maximum differences in the O/C critical values were obtained for the pressure of 30 bar. These O/C differences, which fall close to 820 °C for NG or LPG, are about 2.4 and 2.2, respectively.
3.2. Dry Reforming
3.2.1. Natural Gas–CO2 Mixtures
Carbon deposition can also occur during reforming with CO2 of lower hydrocarbons that have one to four carbons in a molecule. The same computational procedure and processing of the computing results for NG and LPG were applied as before for the wet reforming. The modeling results are presented in Figure 4, Figure 5 and Figure 6, also as plots of the critical O/C against temperature.
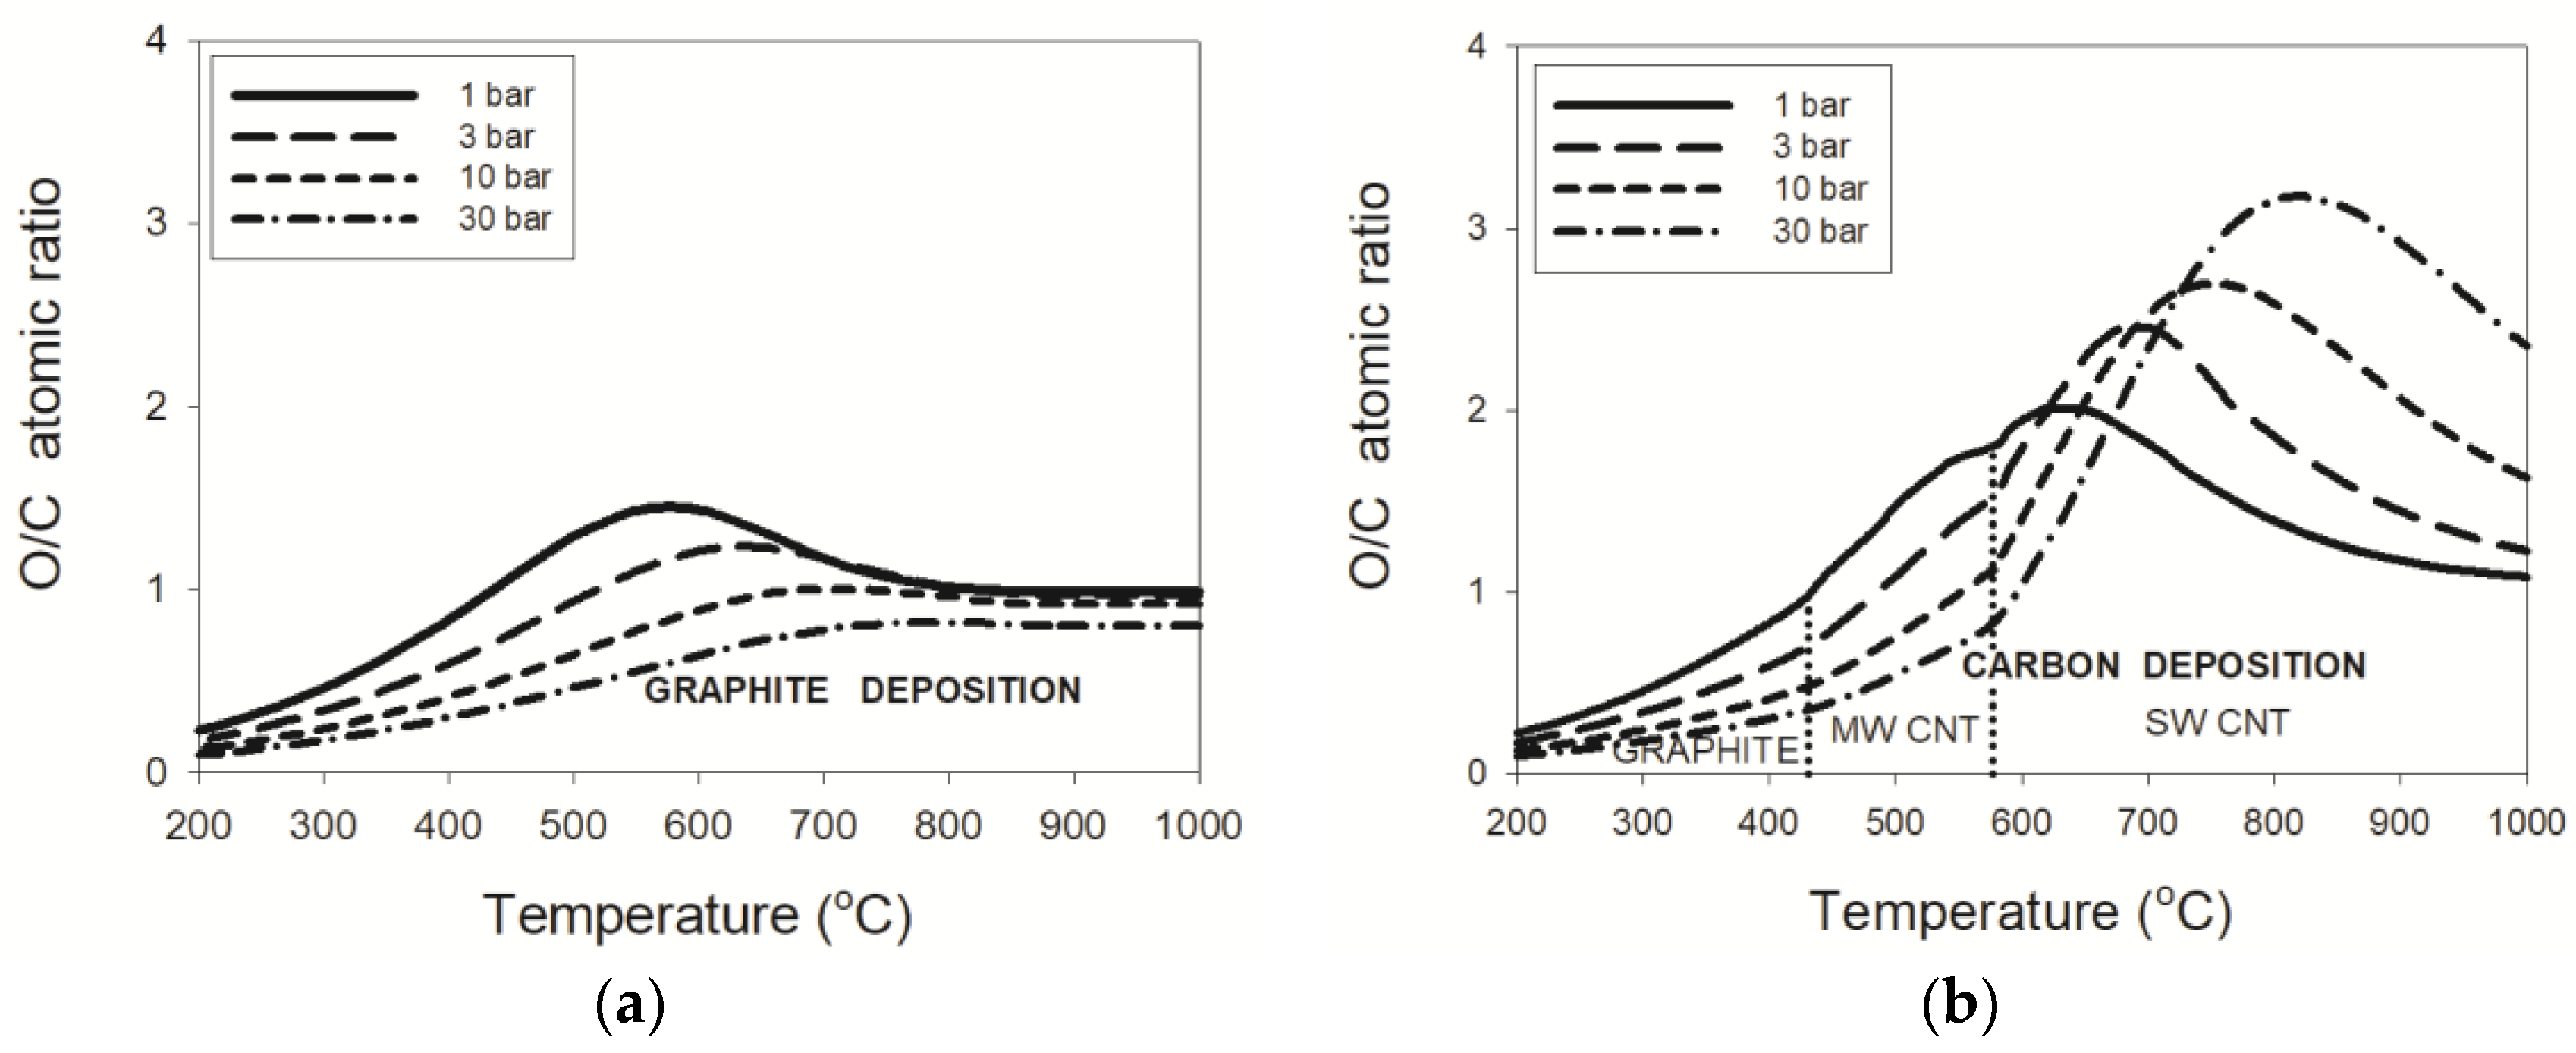
The character of the critical O/C dependence on temperature is now very different from that for natural gas reformed with water steam as presented in Figure 1a,b. The most characteristic feature of the deposition boundaries (Figure 4a) for dry reforming is a varying decrease in the threshold O/C with increasing temperature from 200 °C to 1000 °C. However, up to about 450 °C, the O/C lowering from 2.0 is very slow and rather independent of the studied pressure. Then, for higher temperatures, a gradual decrease of the threshold O/C follows to the asymptotic value of 1.0 and it occurs more slowly for higher pressures. When all of the solid carbon forms are included in the modeling, then only a slight increase in the critical O/C values is found at a temperature, cf. Figure 4b. Nevertheless, the increase in the critical O/C grows with rising pressures.
3.2.2. LPG–CO2 Mixtures
The computed threshold lines for LPG reformates with carbon dioxide are shown in Figure 5a,b. Remarkably, they only differ slightly from their counterparts for the NG dry reformates. This observation is valid both for the graphite-only deposits, shown in Figure 4a and Figure 5a, and also for all depositing carbon forms presented in Figure 4b and Figure 5b.
3.2.3. Pressure Effects
The pressure of dry reforming now has a weaker impact on the critical O/C values than in the wet reforming, both for NG and LPG. This is presented in Figure 6a,b, where the same types of lines and shading are applied (as in Figure 3).
The temperatures of the maximum difference in the atomic O/C ratio between the dry reforming curves for graphite-only and all carbon deposits depend on pressure. With increasing pressure, both the difference in critical O/C and the temperature of that maximum grow almost equally for the two dry reformates. The following values of the maximum difference in critical O/C were obtained at relevant temperatures: (0.23, 790 °C), (0.28, 840 °C), (0.36, 920 °C), and (0.41, 1000 °C), respectively, for 1, 3, 10, and 30 bar. These results further emphasize the strong influence of the filamentous form present in carbon deposits during the dry reforming of lower hydrocarbons. As a consequence, higher O/C values have to be applied as compared to predictions for non-nanotubular carbon deposits.
4. Discussion
The formation of filamentous carbon deposits have been well-documented in the literature when non-noble metals are used as catalysts in the wet and dry reforming of hydrocarbons. However, the modeling of the process has suffered from a lack of reliable thermodynamic data for carbon nanotubes. It was therefore assumed essential to theoretically study the contribution of the MWCNT and SWCNT deposits at thermodynamic equilibrium.
The presented computation results of deposition conditions are based on the approach defined in Equations (16) and (17). Such an analysis of the thermodynamic equilibrium was carried out numerically using the specialized, commercial HSC software [23]. Its basic databank was supplemented using information from the literature on the chemical potential function of temperature for pure carbonic nanotubes, both multi-walled [26] and single-walled in bundles [27]. Four pairs of C-H-O mixtures consisting of NG or LPG fuel, with either water steam or carbon dioxide, were analyzed to reflect the equilibrium conditions of reforming the fuels. Calculations of the threshold conditions for the deposition onset of various carbon allotropes were performed for a temperature varying from 200 °C to 1000 °C and a pressure set at either 1, 3, 10, or 30 bar. They led to an indication in the solid phase that only one of the three carbon forms—graphite below 431 °C, then MWCNT up to 577 °C, followed by SWCNT up to 1000 °C—was independent of analyzed pressure. Those characteristic temperatures and deposit types are equal to those reported previously [25] for catalytic partial oxidation. No other types of solid carbon allotrope were computed as stable within the analyzed temperature and pressure ranges.
A comparison of the corresponding O/C = f(T) graphs for the wet and dry reforming of the lower hydrocarbons gives a general impression of their fundamental difference. Figure 1, Figure 2 and Figure 3 for the wet reforming exhibit local extrema of O/C, whereas those for the dry reforming, Figure 4, Figure 5 and Figure 6, show a continuous decrease of varying intensity towards the highest temperature. Another characteristic difference refers to relatively small differences between the O/C = f(T) critical lines for the dry reforming of NG and LPG, while significant differences were found between such lines for the wet fuel reforming, especially at lower temperatures. The computed maximum increase in the critical O/C for CNTs versus graphite was from 21 to 37% for the dry reformates, whereas for wet reforming the differences were growing from about 50% at 1 bar up to 290% at 30 bar of the process pressure.
The critical lines for the dry reforming of both fuels are of somewhat similar character to those in catalytic partial oxidation, CPOx [25], but the latter lines were beginning for CPOx at O/C ≅ 2.9 for 200 °C instead of 2.0 in dry reforming here. In the two reforming types, the critical lines proceed to O/C = 1 alongside a growing temperature, but with a rate that depends on the process pressure. Another similarity to the CPOx results concerns a negligible influence of pressure on the critical O/C course below the temperature of 400 °C. On the other hand, in wet reforming, the pressure effect is distinct but its magnitude and direction depend on temperature, which also determines the deposit type.
The presented calculations evidently suggest using higher O/C ratios than those for graphite in the wet and dry reforming reactions to avoid the degradation of non-noble catalysts by the filamentous carbon deposits. This condition turns out to be particularly valid above 577 °C, i.e., in the region of depositing SWCNT. In particular, a narrower excess of steam, over the suggested maximum O/C value of 2.5 [6], may be important in the optimization of the heat supplied in wet reforming with an avoidance of catalyst coking. Proper accounting for the potential deposition of filamentous carbon is especially important when wet reforming is carried out at an elevated pressure.
5. Conclusions
The presented results on equilibrium deposition for the wet or dry reforming of lower hydrocarbons in NG and LPG allow for the following conclusions to be drawn:
- (i)
- thermodynamic data for purified carbon nanotubes indicate a substantially different dependence of the critical O/C ratio on temperature, in comparison to that for graphite deposition;
- (ii)
- the threshold temperature of 431 °C or 577 °C for the deposition boundaries between, respectively, graphite and MWCNT or MWCNT and SWCNT were confirmed regardless of pressure;
- (iii)
- an enlargement of the critical O/C ratio for SWCNT relative to that for graphite was computed at 30 bar to a maximum of about 290% or 37%, respectively, for the wet or dry reformate; and
- (iv)
- maximum critical O/C ratios were found for the wet reforming of NG and LPG at 2.0, 2.4, 2.7, and 3.2 for the process pressures of 1, 3, 10, and 30 bar, respectively.
Acknowledgments
The research program leading to these results received funding from the European Union’s Seventh Framework Programme (FP7/2007–2013) for the Fuel Cells and Hydrogen Joint Undertaking (FCH JU) under grant agreement No621213 with the STAGE-SOFC acronym. Information contained in the paper reflects only view of the authors. The FCH JU and the Union are not liable for any use that may be made of the information contained therein. The work was also financed from the Polish research funds awarded for the project No. 3126/7.PR/2014/2 of international cooperation within STAGE-SOFC in the years 2014–2017. The authors received funds from FCH JU for covering the costs to publish in open access. Grzegorz Story helped in the graphical editing of the figures.
Author Contributions
Z.J. and P.P.-O. designed the study; Z.J. designed and performed the computations, Z.J. analyzed a majority of the data; P.P.-O. contributed to analyses of the data and wrote the main part of the Introduction; and Z.J. wrote the rest of the paper.
Conflicts of Interest
The authors declare no conflicts of interest.
References
- Mundhwa, M.; Thurgood, C.P. Numerical study of methane steam reforming and methane combustion over the segmented and continuously coated layers of catalysts in a plate reactor. Fuel Process. Technol. 2017, 158, 57–72. [Google Scholar] [CrossRef]
- Rostrup-Nielsen, J.R.; Christiansen, L.J.; Hansen, J.H. Activity of steam reforming catalysts: Role and assessment. Appl. Catal. A 1988, 32, 287–303. [Google Scholar] [CrossRef]
- Maier, L.; Schadel, B.; Delgado, K.H.; Tischer, S.; Deutschmann, O. Steam reforming of methane over nickel: Development of a multi-step surface reaction mechanism. Top. Catal. 2011, 54, 845–858. [Google Scholar] [CrossRef]
- Dixit, M.; Baruah, R.; Parikh, D.; Sharma, S.; Bhargav, A. Authothermal reforming of methane on rhodium catalysts: Microkinetic analysis for model reduction. Comput. Chem. Eng. 2016, 89, 149–157. [Google Scholar] [CrossRef]
- Michael, B.C.; Donazzi, A.; Schmidt, L.D. Effects of H2O and CO2 addition in catalytic partial oxidation of methane on Rh. J. Catal. 2009, 265, 117–129. [Google Scholar] [CrossRef]
- Yang, Z.; Zhang, Y.; Wang, X.; Zhang, Y.; Lu, X.; Ding, W. Steam reforming of coke oven gas for hydrogen production over a NiO/MgO solid solution catalyst. Energy Fuels 2010, 24, 785–788. [Google Scholar] [CrossRef]
- Bengaard, H.S.; Norskov, J.K.; Sehested, J.; Clausen, B.S.; Nielsen, L.P.; Molenbroek, A.M.; Rostrup-Nielsen, J.R. Steam reforming and graphite formation on Ni catalysts. J. Catal. 2002, 209, 365–384. [Google Scholar] [CrossRef]
- Tang, Y.H.; Li, X.C.; Li, J.L.; Lin, L.W.; Xu, H.F.; Huang, B.Y. Experimental evidence for the formation mechanism of metallic catalyst-free carbon nanotubes. Nano-Micro Lett. 2010, 2, 18–21. [Google Scholar] [CrossRef]
- Avetisov, A.K.; Rostrup-Nielsen, J.R.; Kuchaev, V.L.; Bak Hansen, J.H.; Zyskin, A.G.; Shapatina, E.N. Steady-state kinetics and mechanism of methane reforming with steam and carbon dioxide over Ni catalyst. J. Mol. Catal. A Chem. 2010, 315, 155–162. [Google Scholar] [CrossRef]
- Schulz, L.A.; Kahle, L.C.S.; Delgado, K.H.; Schunk, S.A.; Jentys, A.; Deutschmann, O.; Lercher, J.A. On the coke deposition in dry reforming of methane at elevated pressures. Appl. Catal. A Gen. 2015, 504, 599–607. [Google Scholar] [CrossRef]
- Chen, D.; Lodeng, R.; Svendsen, H.; Holmen, A. Hierarchical multiscale odelling of methane steam reforming reactions. Ind. Eng. Chem. Res. 2011, 50, 2600–2612. [Google Scholar] [CrossRef]
- Snoeck, J.W.; Froment, G.F.; Fowles, M. Filamentous carbon formation and gasification: Thermodynamics, driving force, nucleation and steady-state growth. J. Catal. 1997, 169, 240–249. [Google Scholar] [CrossRef]
- Snoeck, J.W.; Froment, G.F.; Fowles, M. Kinetic study of the carbon filament formation by methane cracking on a nickel catalyst. J. Catal. 1997, 169, 250–262. [Google Scholar] [CrossRef]
- Silva, P.P.; Ferreira, R.A.R.; Noronha, F.B.; Hori, C.E. Hydrogen production from steam and oxidative steam reforming of liquefied petroleum gas over cerium and strontium doped LaNiO3 catalysts. Catal. Today 2017, 289, 211–221. [Google Scholar] [CrossRef]
- Laosiripojana, N.; Assabumrungrat, S. Hydrogen production from steam and autothermal reforming of LPG over high surface area ceria. J. Power Sources 2006, 158, 1348–1357. [Google Scholar] [CrossRef]
- Jaworski, Z.; Zakrzewska, B.; Pianko-Oprych, P. On thermodynamic equilibrium of carbon deposition from gaseous C-H-O mixtures: Updating for nanotubes. Rev. Chem. Eng. 2017, 33, 217–235. [Google Scholar] [CrossRef]
- Wagg, L.M.; Hornyak, G.L.; Grigorian, L.; Dillon, A.C.; Jones, K.M.; Blackburn, J.; Parilla, P.A.; Heben, M.J. Experimental Gibbs free energy considerations in the nucleation and growth of single-walled carbon nanotubes. J. Phys. Chem. B 2005, 109, 10435–10440. [Google Scholar] [CrossRef] [PubMed]
- Yaws, C.L. Yaws’ Critical Property Data for Chemical Engineers and Chemists; Knovel: New York, NY, USA, 2012; ISBN 978-1-61344-932-5. Available online: http://app.knovel.com/hotlink/toc/id:kpYCPDCECD/yaws-critical-property (accessed on 12 September 2016).
- Smith, J.M.; Van Ness, H.C.; Abbott, M.M. Introduction to Chemical Engineering Thermodynamics, 7th ed.; McGraw Hill Higher Education: New York, NY, USA, 2004; ISBN 0-07-310445-0. [Google Scholar]
- Miller, S.A.; Jolivet, C.S.; Stoner, J.O., Jr. New methods for testing cyclotron carbon stripper foils. Nucl. Instrum. Methods Phys. Res. Sect. A 2008, 590, 57–65. [Google Scholar] [CrossRef]
- Castillo, J.; Grossmann, I.E. Computation of phase and chemical equilibria. Comput. Chem. Eng. 1981, 5, 99–108. [Google Scholar] [CrossRef]
- Nikoo, M.K.; Amin, N.A.S. Thermodynamic analysis of carbon dioxide reforming of methane in view of solid carbon formation. Fuel Process. Technol. 2011, 92, 678–691. [Google Scholar] [CrossRef] [Green Version]
- Outotec (Finland) Oy, Research Center Pori. Outotec’s HSC Chemistry v.8.0 Software; Outotec (Finland) Oy, Research Center Pori: Pori, Finland, 2014. [Google Scholar]
- Armor, J.N. The multiple roles for catalysis in the production of H2. Appl. Catal. A Gen. 1999, 176, 159–176. [Google Scholar] [CrossRef]
- Jaworski, Z.; Pianko-Oprych, P. On nanotube carbon deposition at equilibrium in catalytic partial oxidation of selected hydrocarbon fuels. Int. J. Hydrog. Energy 2017, 42, 6920–6931. [Google Scholar] [CrossRef]
- Gozzi, D.; Iervolino, M.; Latini, A. The thermodynamics of the transformation of graphite to multiwalled carbon nanotubes. J. Am. Chem. Soc. 2007, 129, 10269–10275. [Google Scholar] [CrossRef] [PubMed]
- Gozzi, D.; Latini, A.; Lazzarini, L. Experimental thermodynamics of high temperature transformations in single-walled carbon nanotube bundles. J. Am. Chem. Soc. 2009, 131, 12474–12482. [Google Scholar] [CrossRef] [PubMed]
- Rodriguez, K.R.; Malone, M.A.; Nanney, W.A.; Maddux, C.J.A.; Coe, J.V.; Martinez, H.L. Generalizing thermodynamic properties of bulk single-walled carbon nanotubes. AIP Adv. 2014, 4, 127149. [Google Scholar] [CrossRef] [PubMed]
Figure 1.
Critical O/C lines for natural gas (NG)–H2O mixtures for (a) solely graphite and (b) all carbon deposits. MWCNT: multi-walled carbon nanotubes; SWCNT: single-walled carbon nanotubes in bundles; O/C: oxygen-to-carbon ratio.
Figure 1.
Critical O/C lines for natural gas (NG)–H2O mixtures for (a) solely graphite and (b) all carbon deposits. MWCNT: multi-walled carbon nanotubes; SWCNT: single-walled carbon nanotubes in bundles; O/C: oxygen-to-carbon ratio.

Figure 2.
Critical O/C lines for the liquid petroleum gas (LPG)–H2O mixtures for (a) solely graphite and (b) all carbon deposits.
Figure 2.
Critical O/C lines for the liquid petroleum gas (LPG)–H2O mixtures for (a) solely graphite and (b) all carbon deposits.
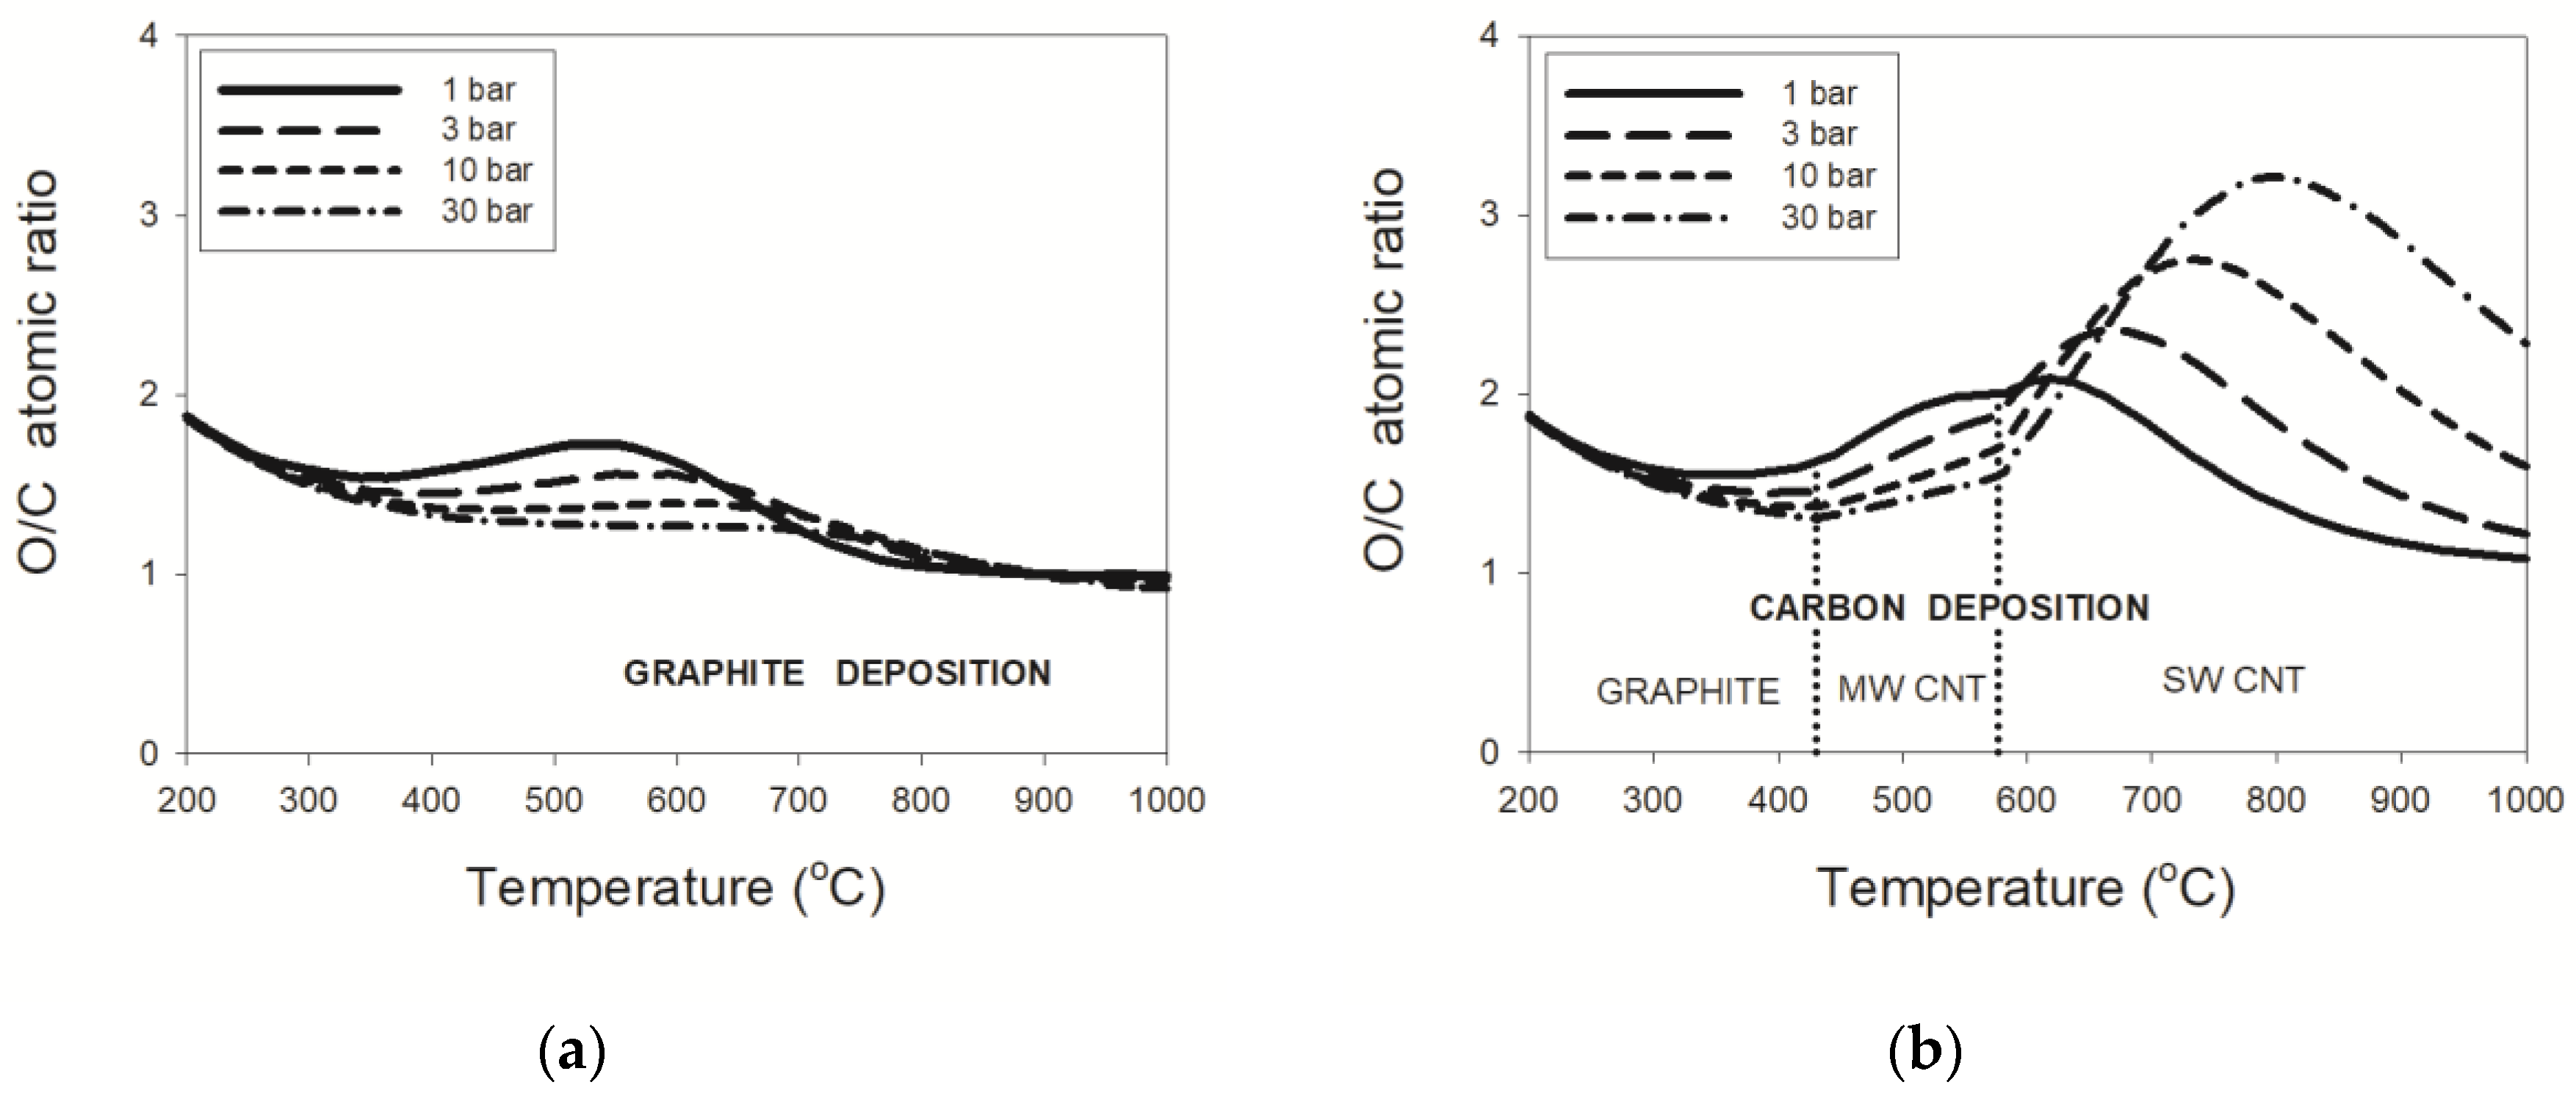
Figure 3.
Critical O/C lines for the fuel–H2O mixtures for (a) NG and (b) LPG at 1 and 30 bar.
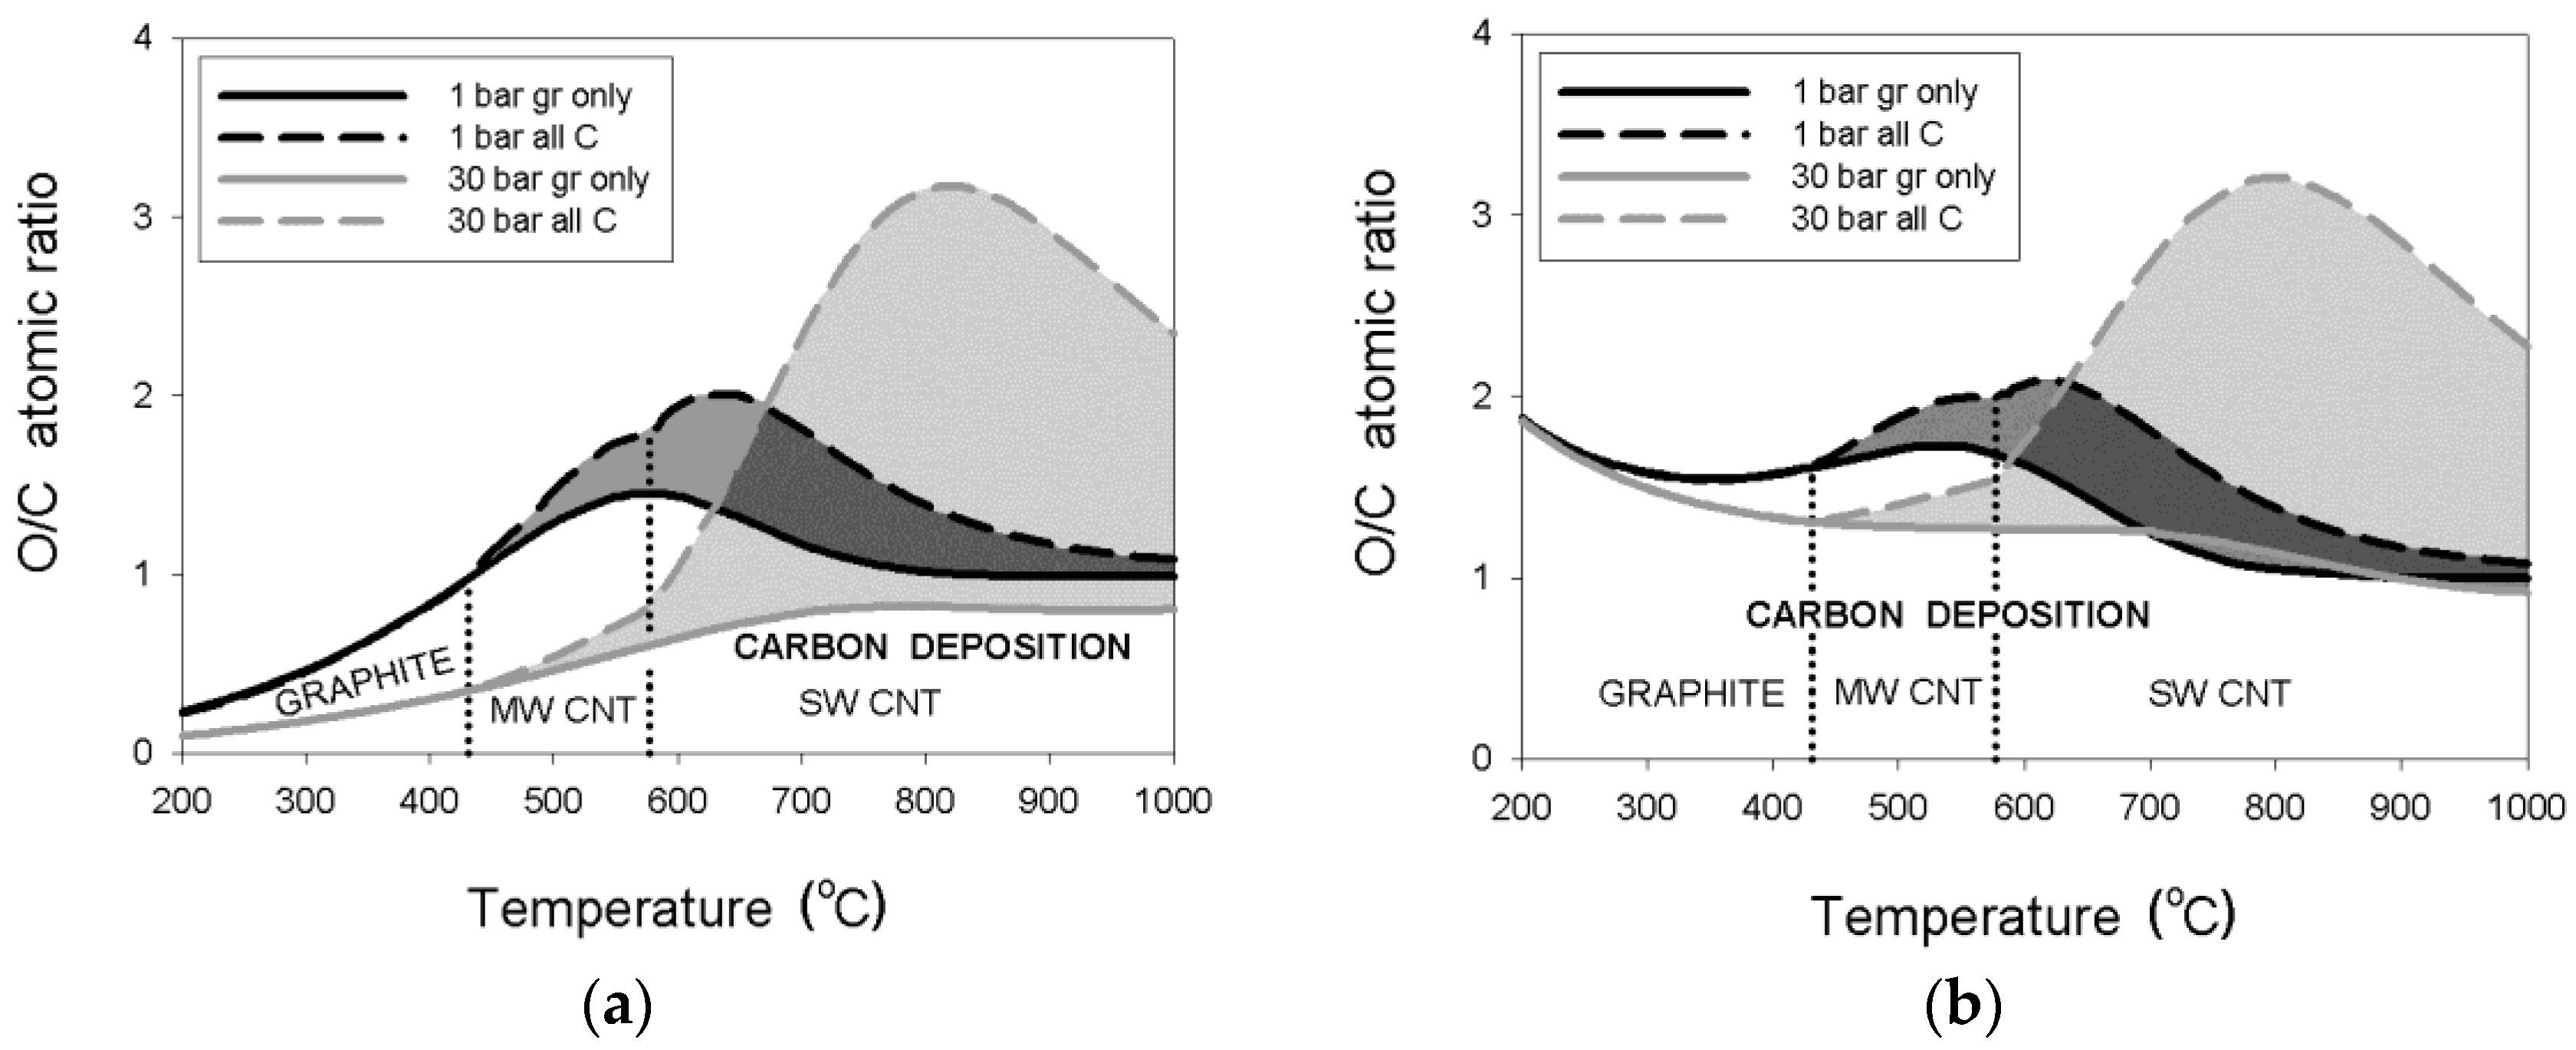
Figure 4.
Critical O/C lines for NG–CO2 mixtures for (a) solely graphite and (b) all carbon deposits.
Figure 4.
Critical O/C lines for NG–CO2 mixtures for (a) solely graphite and (b) all carbon deposits.

Figure 5.
Critical O/C lines for LPG–CO2 mixtures for (a) solely graphite and (b) all carbon deposits.
Figure 5.
Critical O/C lines for LPG–CO2 mixtures for (a) solely graphite and (b) all carbon deposits.

Figure 6.
Critical O/C lines for fuel–CO2 mixtures for (a) NG and (b) LPG at 1 and 30 bar.


Table 1.
Reference thermodynamic data for basic reactions.
| Reaction “i” | Equation | kJ mol−1 | kJ mol−1 |
|---|---|---|---|
| 2 | CO + H2O = CO2 + H2 | −28.7 | −41.2 |
| 4 | CnH2n+2 + nH2O(g) = nCO + (2n + 1)H2 | ≅61.6 + 79.6 n | ≅56.4 + 148.4 n |
| 5 | CnH2n+2 + nCO2 = 2nCO + (n + 1) H2 | ≅61.6 + 108.2 n | ≅56.4 + 189.6 n |
| 6 | CH4 = C(g) + 2H2 | 721.8 | 791.2 |
| 7 | 2CO = C(g) + CO2 | 551.2 | 544.2 |
| 8 | CO + H2 = C(g) + H2O | 579.8 | 585.4 |
| 9 | 2H2 + CO2 = C(g) + 2H2O | 608.5 | 626.5 |
© 2017 by the authors. Licensee MDPI, Basel, Switzerland. This article is an open access article distributed under the terms and conditions of the Creative Commons Attribution (CC BY) license (http://creativecommons.org/licenses/by/4.0/).
Share and Cite
MDPI and ACS Style
Jaworski, Z.; Pianko-Oprych, P. On the Deposition Equilibrium of Carbon Nanotubes or Graphite in the Reforming Processes of Lower Hydrocarbon Fuels. Entropy 2017, 19, 650. https://doi.org/10.3390/e19120650
AMA Style
Jaworski Z, Pianko-Oprych P. On the Deposition Equilibrium of Carbon Nanotubes or Graphite in the Reforming Processes of Lower Hydrocarbon Fuels. Entropy. 2017; 19(12):650. https://doi.org/10.3390/e19120650
Chicago/Turabian StyleJaworski, Zdzisław, and Paulina Pianko-Oprych. 2017. "On the Deposition Equilibrium of Carbon Nanotubes or Graphite in the Reforming Processes of Lower Hydrocarbon Fuels" Entropy 19, no. 12: 650. https://doi.org/10.3390/e19120650
Note that from the first issue of 2016, this journal uses article numbers instead of page numbers. See further details here.