Is an Entropy-Based Approach Suitable for an Understanding of the Metabolic Pathways of Fermentation and Respiration?


1
Department of Physics and Earth Sciences, University of Ferrara, 44122 Ferrara, Italy
2
Department of Mathematical and Computer Sciences, Physical Sciences and Earth Sciences, University of Messina, 98166 Messina, Italy
3
Laboratory of Biochemistry F. Pacini, 89100 Reggio Calabria, Italy
4
Department of General Surgery and Senology, University Hospital Company, 95124 Catania, Italy
*
Author to whom correspondence should be addressed.
Entropy 2017, 19(12), 662; https://doi.org/10.3390/e19120662
Submission received: 15 November 2017
/
Revised: 30 November 2017
/
Accepted: 1 December 2017
/
Published: 4 December 2017
(This article belongs to the Special Issue Entropy and Its Applications across Disciplines)
Abstract
:Lactic fermentation and respiration are important metabolic pathways on which life is based. Here, the rate of entropy in a cell associated to fermentation and respiration processes in glucose catabolism of living systems is calculated. This is done for both internal and external heat and matter transport according to a thermodynamic approach based on Prigogine’s formalism. It is shown that the rate of entropy associated to irreversible reactions in fermentation processes is higher than the corresponding one in respiration processes. Instead, this behaviour is reversed for diffusion of chemical species and for heat exchanges. The ratio between the rates of entropy associated to the two metabolic pathways has a space and time dependence for diffusion of chemical species and is invariant for heat and irreversible reactions. In both fermentation and respiration processes studied separately, the total entropy rate tends towards a minimum value fulfilling Prigogine’s minimum dissipation principle and is in accordance with the second principle of thermodynamics. The applications of these results could be important for cancer detection and therapy.
1. Introduction
There are two main classes of chemical reactions: reversible and irreversible. The former are characterized by the presence of a stationary state of equilibrium where only a small amount of products are again transformed into reagents under the control of the mass action law. The latter are identified at equilibrium by the presence of products of reactions and by an almost total lack of reagents [1,2].
During the development of living systems, irreversibility has played a crucial role and, as a result, irreversible reactions in the ancestral ocean led to the formation of the first elements for the synthesis of biomass. Quite conceivably, also the cellular metabolic network has originated from irreversible reactions [3,4,5].
Recently, the spontaneous formation of intermediate metabolites like, for example, glucose-1-phosphate, pyruvate ion and ribose-1-phosphate via metal-mediated catalysis, has been demonstrated [6,7]. It is well-known that the chemical stability of products of irreversible reactions temporally stabilizes them and establishes a precise time arrow making possible the development of living systems. However, irreversible reactions not only are important in bioenergetics homeostasis but play a crucial role in living systems maintenance. Warburg [8,9] observed that cancer cells employed prevalently lactic acid fermentation (Warburg effect) and several studies in vivo and in vitro have confirmed this specific metabolic pattern in cancer cells [10,11,12].
In addition, in the last years various studies have shown that metabolic patterns have a strong effect on genetic and epigenetic patterns and on chromatin structure [13,14,15]. As a result, there is a strict relationship between thermodynamic irreversibility and information expressed as the dialectic between Clausius entropy, Boltzmann entropy and informational Shannon entropy [16,17,18,19].
A further aspect that, in recent years, has revolutionized oncological research has been the discovery of the heterogeneity of neoplastic parenchyma strongly supported by its population of cancer stem cells (CSC). Indeed, according to various studies neoplastic tissue is, like other tissues, supported by CSC and has transit-amplifying cells and differentiated cells. Although there has been a confirmation by several models of this behaviour [20,21], it is not yet clear whether the CSC originate from adult stem cells (ASC) or from a process similar to the induction of pluripotency stem cells (iPSC), namely from the reprogramming of somatic cells. However, there are experimental evidences [22,23] suggesting that the CSC could originate from ASC and from phenomena correlated to their asymmetric division [22,23,24]. An essential aspect is that totipotent embryonic cells and ASC use prevalently lactic acid fermentation and have a lower rate of oxidative phosphorylation (OXPHOs) together with a smaller mitocondrial network. On the other hand, during the iPSC there is a rewiring of metabolic patterns consisting of a metabolic switching from OXPHOs to lactic acid fermentation. Several experiments have shown that the rewiring of metabolic network during differentiation/dedifferentiation is an essential step of the whole process [25,26,27,28,29,30,31]. In summary, the differentiation or dedifferentiation processes are not only genetic and epigenetic phenomena but also metabolic. Within this framework, in recent works the neoplastic process has been regarded as a cellular plasticity process driven by the cooperative interaction among the genetic, epigenetic and metabolic networks.
Nevertheless, even though the study of the metabolic network and of the dynamical aspects of the mitochondria network has received a great attention, there are only few thermodynamic descriptions of metabolism [25,26,27,28,29,30,31,32,33]. For this reason, in [34] we have developed a thermodynamic model to calculate the rate of entropy density production for irreversible reactions in living systems.
Here, we discuss some interesting applications of the model to lactic fermentation and respiration processes occurring during glucose catabolism in living systems. For our purposes, in the calculations we have not considered recurrent metabolites, like NAD+/NADH and ATP/ADP/AMP, because the oxide/reduction reactions of NAD+/NADH are reversible and the reactions leading to ATP synthesis are not spontaneous and irreversible processes.
The key results of this work are: (1) the rate of entropy associated to irreversible reactions and to exchanges of chemical species with the intercellular environment is higher during lactic fermentation; (2) the rate of entropy due to diffusion of chemical species inside and outside cells and to heat flow with intercellular environment is higher during respiration process and (3) the ratio between the rates of entropy associated to the two metabolic pathways has a space and time dependence only for diffusion of chemical species. Finally, the total rate of entropy production in both fermentation and respiration metabolic pathways is consistent with Prigogine’s minimum dissipation principle tending to vanish with increasing time when approaching the global equilibrium.
2. Methods
In this section, we recall the basic thermodynamic and statistical principles of the theoretical model developed in [34] and we apply them to glucose catabolism. This model bases on consolidated experimental measurements carried on with different techniques on human cells.
2.1. Basic Principles of the Model
We restrict ourselves to the study of the thermodynamics in the single cell representing an open thermodynamic system, namely a system that exchanges energy and matter with the environment represented by the intercellular space. Since we are dealing with phenomena taking place locally and under conditions of local equilibrium inside and outside a typical cell, all intensive and extensive thermodynamic variables have a space and time dependence [35].
On this basis, it is useful to define the rate of entropy density production, r = ri + re, where ri is the rate of internal entropy density production (RIEDP) and re the rate of external entropy density production (REEDP). For a system in local equilibrium but not in global equilibrium, it is convenient to define an entropy density s = S/Vcell with s = si + se where si is the internal entropy density (subscript “i” indicates internal), se the external entropy density (subscript “e” indicates external) and Vcell the volume of the cell. The entropy density infinitesimal variation ds = dsi + dse includes the contribution dsi related to internal irreversible processes and dse associated to the external exchanges of heat and matter with the intercellular environment. To fully describe the temporal evolution, it is useful to define the rate of entropy density production in a time interval dt (t is the time) in the form r = dsi/dt + dse/dt where ri = dsi/dt and re = dse/dt. This quantity gives a direct measure of irreversible processes.
2.2. Rate of Internal Entropy Density Production for Glucose Catabolism
The RIEDP gives the amount of local increase of entropy inside a cell. The calculation was made under some reasonable assumptions based on direct observations for both normal and cancer cells, namely [34]:
- (1)
- Cells are of cubic shape having volume Vcell = L3 with L the side of the average cube;
- (2)
- Heat and mass flows are along the x direction chosen as the preferential direction;
- (3)
- Irreversible processes start in the centre of the cytoplasm region;
- (4)
- Mass and heat flow are separate with no cross-effects between each other;
- (5)
- The volume of cell nucleus is small with respect to the cell volume and neglected.
For a description of the reasons at the basis of assumptions (1)–(5) see [36,37,38]. The RIEDP takes the form:
Here, the first term on the second member is associated with the internal flow expressed as with N the number of chemical species, getting contributions from irreversible heat flow JQ and diffusion flow JDk of the k-th chemical species with uk the partial molar energy and driven by the heat thermodynamic force with T(x,t) the temperature distribution. The second term is due to the diffusion flow JDk and is driven by the matter thermodynamic force with μk the chemical potential of the k-th chemical species [35].
Finally, the last term is associated with irreversible reactions being M the number of chemical reactions with the thermodynamic force represented by the affinity with υjk the stoichiometric coefficients, and the corresponding flow by the velocity of the j-th reaction υj = 1/Vcell dξj/dt with dξj the variation of the jth degree of advancement [35].
The RIEDP can be written as, ri(x,t) = ri Q(x,t) + ri D(x,t) + ri r(x,t), with ri Q(x,t) the contribution due to heat flow, ri D(x,t) the one associated to molecules diffusion and ri r(x,t) the one related to irreversible chemical reactions. Both ri D(x,t) and ri r(x,t) express the contribution due to mass transport. For every term, we take into account wresp (wferm), namely the weight expressing the frequency of occurrence of respiration (fermentation) process during glucose catabolism.
In explicit form, the contribution due to heat flow reads:
Here, K is the thermal conductivity, κ is the thermal diffusivity, and τ is a characteristic decaying time. The coefficient p = 0.85 (0.90) expresses the frequency of occurrence of glucose catabolism in a normal (cancer) cell. Instead, the contribution to RIEDP due to diffusion of chemical species characterized by a Dk diffusion coefficient involved in glucose catabolism takes the form:
Here, T0 is the maximum cell temperature, is the space and time dependent chemical potential of the k-th species, Nresp (Nferm) is the number of chemical species in the respiration (fermentation) process and Nm k is the number of moles of the kth chemical species.
Finally, the contribution to RIEDP due to irreversible reactions involved in the glucose catabolism and obtained taking into account that chemical reactions occurring in the glucose catabolism are first-order is:
where kkinresp (kkinferm) is the kinetic constant of the respiration (fermentation) process, υk are stoichiometric coefficients, Nm C6H12O6 the number of glucose moles. For a detailed derivation of Equations (2)–(4) see [34] (note the different notation with respect to Equation (S26) of [34] where kkin appears outside round brackets labelling either respiration or fermentation kinetic constant).
2.3. Rate of External Entropy Density Production
The REEDP re = dse/dt gives the amount of local increase of entropy outside the cell (intercellular environment) due to heat and matter exchanges. In its general form:
Here, 1/Vcell dQ/dt = du/dt + 1/Vcell pdV/dt according to the first principle of thermodynamics dQ = dU + pdV. dQ is the infinitesimal heat transfer, du = 1/V dU is the infinitesimal variation of the internal energy density u (dU is the infinitesimal variation of the internal energy U), p the pressure and dV the infinitesimal variation of the volume V. In addition, Tic(x,t) is the intercellular temperature distribution and deNm k the variation of the number of moles of the k-th chemical species with Npr the number of products of the irreversible reaction (“pr” indicates products) due to exchange of matter with the intercellular environment. The first term on the second member expresses the heat flow outside the cell, while the second one results from the exchange of matter with the intercellular environment.
We now discuss the REEDP. The calculation of the heat and mass entropy external exchanges was carried out taking into account the assumptions (1), (2) and (5) listed in the previous subsection. The REEDP is expressed by two contributions, viz. re(x,t) = re Q(x,t) + re exch(x,t) where re Q(x,t) is the contribution due to heat released by the cell in the intercellular environment, while re exch(x,t) is the one related to exchanges of matter with the extracellular environment with the subscript “exch” standing for exchanges.
The derivation of the REEDP associated to heat flow re Q(x,t) in the intercellular environment lies on simple thermodynamic considerations exploiting the analogy of the behaviour of the cellular system with that of a gas. This analogy bases on two main features: (1) Thermodynamic properties of a cell mainly composed by water can be described as those of a fluid and (2) Irreversible chemical reactions occur in a vapor phase where vapor is a mixture between a gaseous and a liquid phase at room temperature. Owing to this thermodynamic analogy, the cell energy, neglecting rotational and vibrational degrees of freedom of water molecules, is thus equivalent to the translational kinetic energy of the monoatomic gas. Hence, in the thermodynamic limit, the cell continuous spectrum energy is derived from the partition function of a monoatomic gas that has a direct thermodynamic relation with the internal energy. It turns out that re Q(x,t) reads:
where, kB = 1.3805 × 10⁻²³ J/K is the Boltzmann constant, Nm pr resp (Nm pr ferm) is the number of moles of the products in respiration (fermentation) process. Instead, the REEDP due to irreversible exchange of matter with the intercellular environment is:
Here, x0 is a characteristic length of the order of the size of a normal cell, dτ1 (dτ2) is a characteristic time such that 1/dτ1 (1/dτ2) is of the order of kkinresp (kkinferm), Npr resp (Npr ferm) is the number of products of the respiration (fermentation) process. For the details of the derivation of Equations (6) and (7) see [34].
Finally, we remark that the model bases on a series of well-known assumptions confirmed by many techniques. Note that all biological models represent interpretative tools of reality and base on objective data. Also for this reason, the model presented here can be adapted case by case by setting the specific parameters according to the studied context.
2.4. Rate of Entropy Density Production for Fermentation and Respiration Processes
In this subsection, we apply the model for the calculation of the rate of entropy density to the two key pathways of glucose catabolism in living systems. The first one refers to the cell respiration process involving the catabolism of glucose (C6H12O6) via the oxygen molecule (O2) and consists of: (a) glycolysis; (b) Krebs cycle and (c) oxidative phosphorylation. The general balancing of all reactions is C6H12O6 + 6O2 → 6CO2 + 6H2O leading to the formation of carbon dioxide (CO2) and water (H2O). The second process is the lactic acid fermentation process with no Krebs cycle and oxidative phosphorylation. The corresponding reaction leads to the formation of lactic acid ions (C3H5O3−) and is C6H12O6 → 2C3H5O3− + 2H+. It is thus interesting to consider separately the two processes and to calculate for both of them the exchange of entropy basing on the expressions of the rate of entropy density applied to glucose catabolism with the only exception of the RIEDP associated to heat transfer inside cells.
First, we consider the contribution to the RIEDP summarized in Equations (3) and (4). To get the rate of entropy density associated to fermentation process due to diffusion of chemical species we set wferm = 1 and wresp = 0 in Equation (3) yielding:
where the superscript “ferm” stands for fermentation. The corresponding rate for respiration process is obtained by setting in Equation (3) wferm = 0 and wresp = 1, viz.:
where, the superscript “resp” stands for respiration.
Analogously, the RIEDP due to irreversible reactions for the fermentation process is obtained setting wferm = 1 and wresp = 0 in Equation (4):
Instead, the RIEDP due to irreversible reactions for the respiration process reads:
via wferm = 0 and wresp = 1 in Equation (4). For both processes, the dependence on the cell parameters differentiates because of the different kinetic constants and different chemical potentials.
Interestingly, also for the REEDP it is possible to express the contribution due to fermentation and respiration processes. Starting from Equation (6) giving the REEDP due to heat exchanges of the cell with the intercellular environment, the contribution due to lactic fermentation reads:
setting wferm = 1 and wresp = 0 in Equation (6) and the one associated to respiration process is:
setting wferm = 0 and wresp = 1 in Equation (6).
Performing the same manipulations on Equation (7) giving the REEDP due to exchanges of matter between the cell and the intercellular environment, we get:
for the lactic fermentation process and:
for the respiration process.
2.5. Ratios between the Rates of Entropy Density for Fermentation and Respiration Metabolic Pathways
In order to understand the behaviour of the entropy production associated to fermentation and respiration metabolic pathways, it is useful to compare the corresponding rates of entropy density by calculating their ratios. This allows us to draw some important conclusions about the thermodynamics underlying the main metabolic pathways occurring in cells.
The first calculated ratio is the one referred to diffusion of chemical species inside cells:
This ratio has an explicit dependence on the spatial coordinate x and is not time-invariant. This is due to the different time-dependence of the diffusion terms for the chemical species involved in the two metabolic processes.
Instead, the ratio associated to irreversible chemical reactions occurring inside cells takes the form:
This ratio is space- and time-invariant and depends only on the partial molar energies of the chemical species (reagent and products) defined as the chemical potential at x = L/2 and at t = 0 and on the stoichiometric coefficients.
For the exchanges with the intercellular environment, we get:
The ratio depends on the number of products of lactic fermentation and of respiration and is spatially and temporally invariant. Finally:
The ratio is a function of the number of moles of the reaction products for these two processes and strictly depends on the kinetics of reactions via the kinetic constants.
3. Results
In this section, we outline the main results of this study obtained by means of the numerical calculations based on the previous formalism applied to glucose catabolism in breast cells. In the numerical calculations, we have employed an average size L = 10 μm for the normal cell and L = 20 μm for the cancer cell [39], dimensions that are typical of the breast epithelium assuming a cubic shape. These choices are not restrictive, and the drawn conclusions are valid for other tissues and other cell shapes [34]. In addition, for the same tissue we have taken an average size of the intercellular space about 0.2–0.3 μm between two adjacent normal cells and about 1.5 μm between two cancer cells [40].
As shown in Figure 1, there are two kinds of chemical reactions occurring during glucose catabolism process. The first one refers to the cell respiration process involving the catabolism of glucose (C6H12O6) via the oxygen molecule (O2) and consists of: (a) glycolysis, (b) Krebs cycle and (c) oxidative phosphorylation. The general balancing of all reactions is C6H12O6 + 6O2 → 6CO2 + 6H2O leading to the formation of carbon dioxide (CO2) and water (H2O). The second process is the lactic acid fermentation process with no Krebs cycle and oxidative phosphorylation. The corresponding reaction leads to the formation of lactic acid ions (C3H5O3−) and is C6H12O6 → 2 C3H5O3− + 2 H+. In normal cells, the glucose catabolism is 80% through OXPHOs and 20% through lactic acid fermentation, while in cancer cells 90% occurs through lactic acid fermentation and 10% through OXPHOs [32]. Both respiration and lactic acid fermentation are first-order processes.
3.1. Rate of Entropy Density Production for Normal and Cancer Cells: Numerical Calculations
In this study, we show the numerical calculations of the RIEDP and REEDP for normal and cancer breast cells. For every term, we represent the rate of entropy density in the time interval of 1000 μs, a typical time [41] for most biological processes and we compare it with a smaller window of time consisting of the first 100 μs. This comparison permits to understand better the trend of the rate of entropy density and the differences between normal cells and cancer cells. For all rates, we have chosen τ ≈ 10−4 s as a typical cell decaying time.
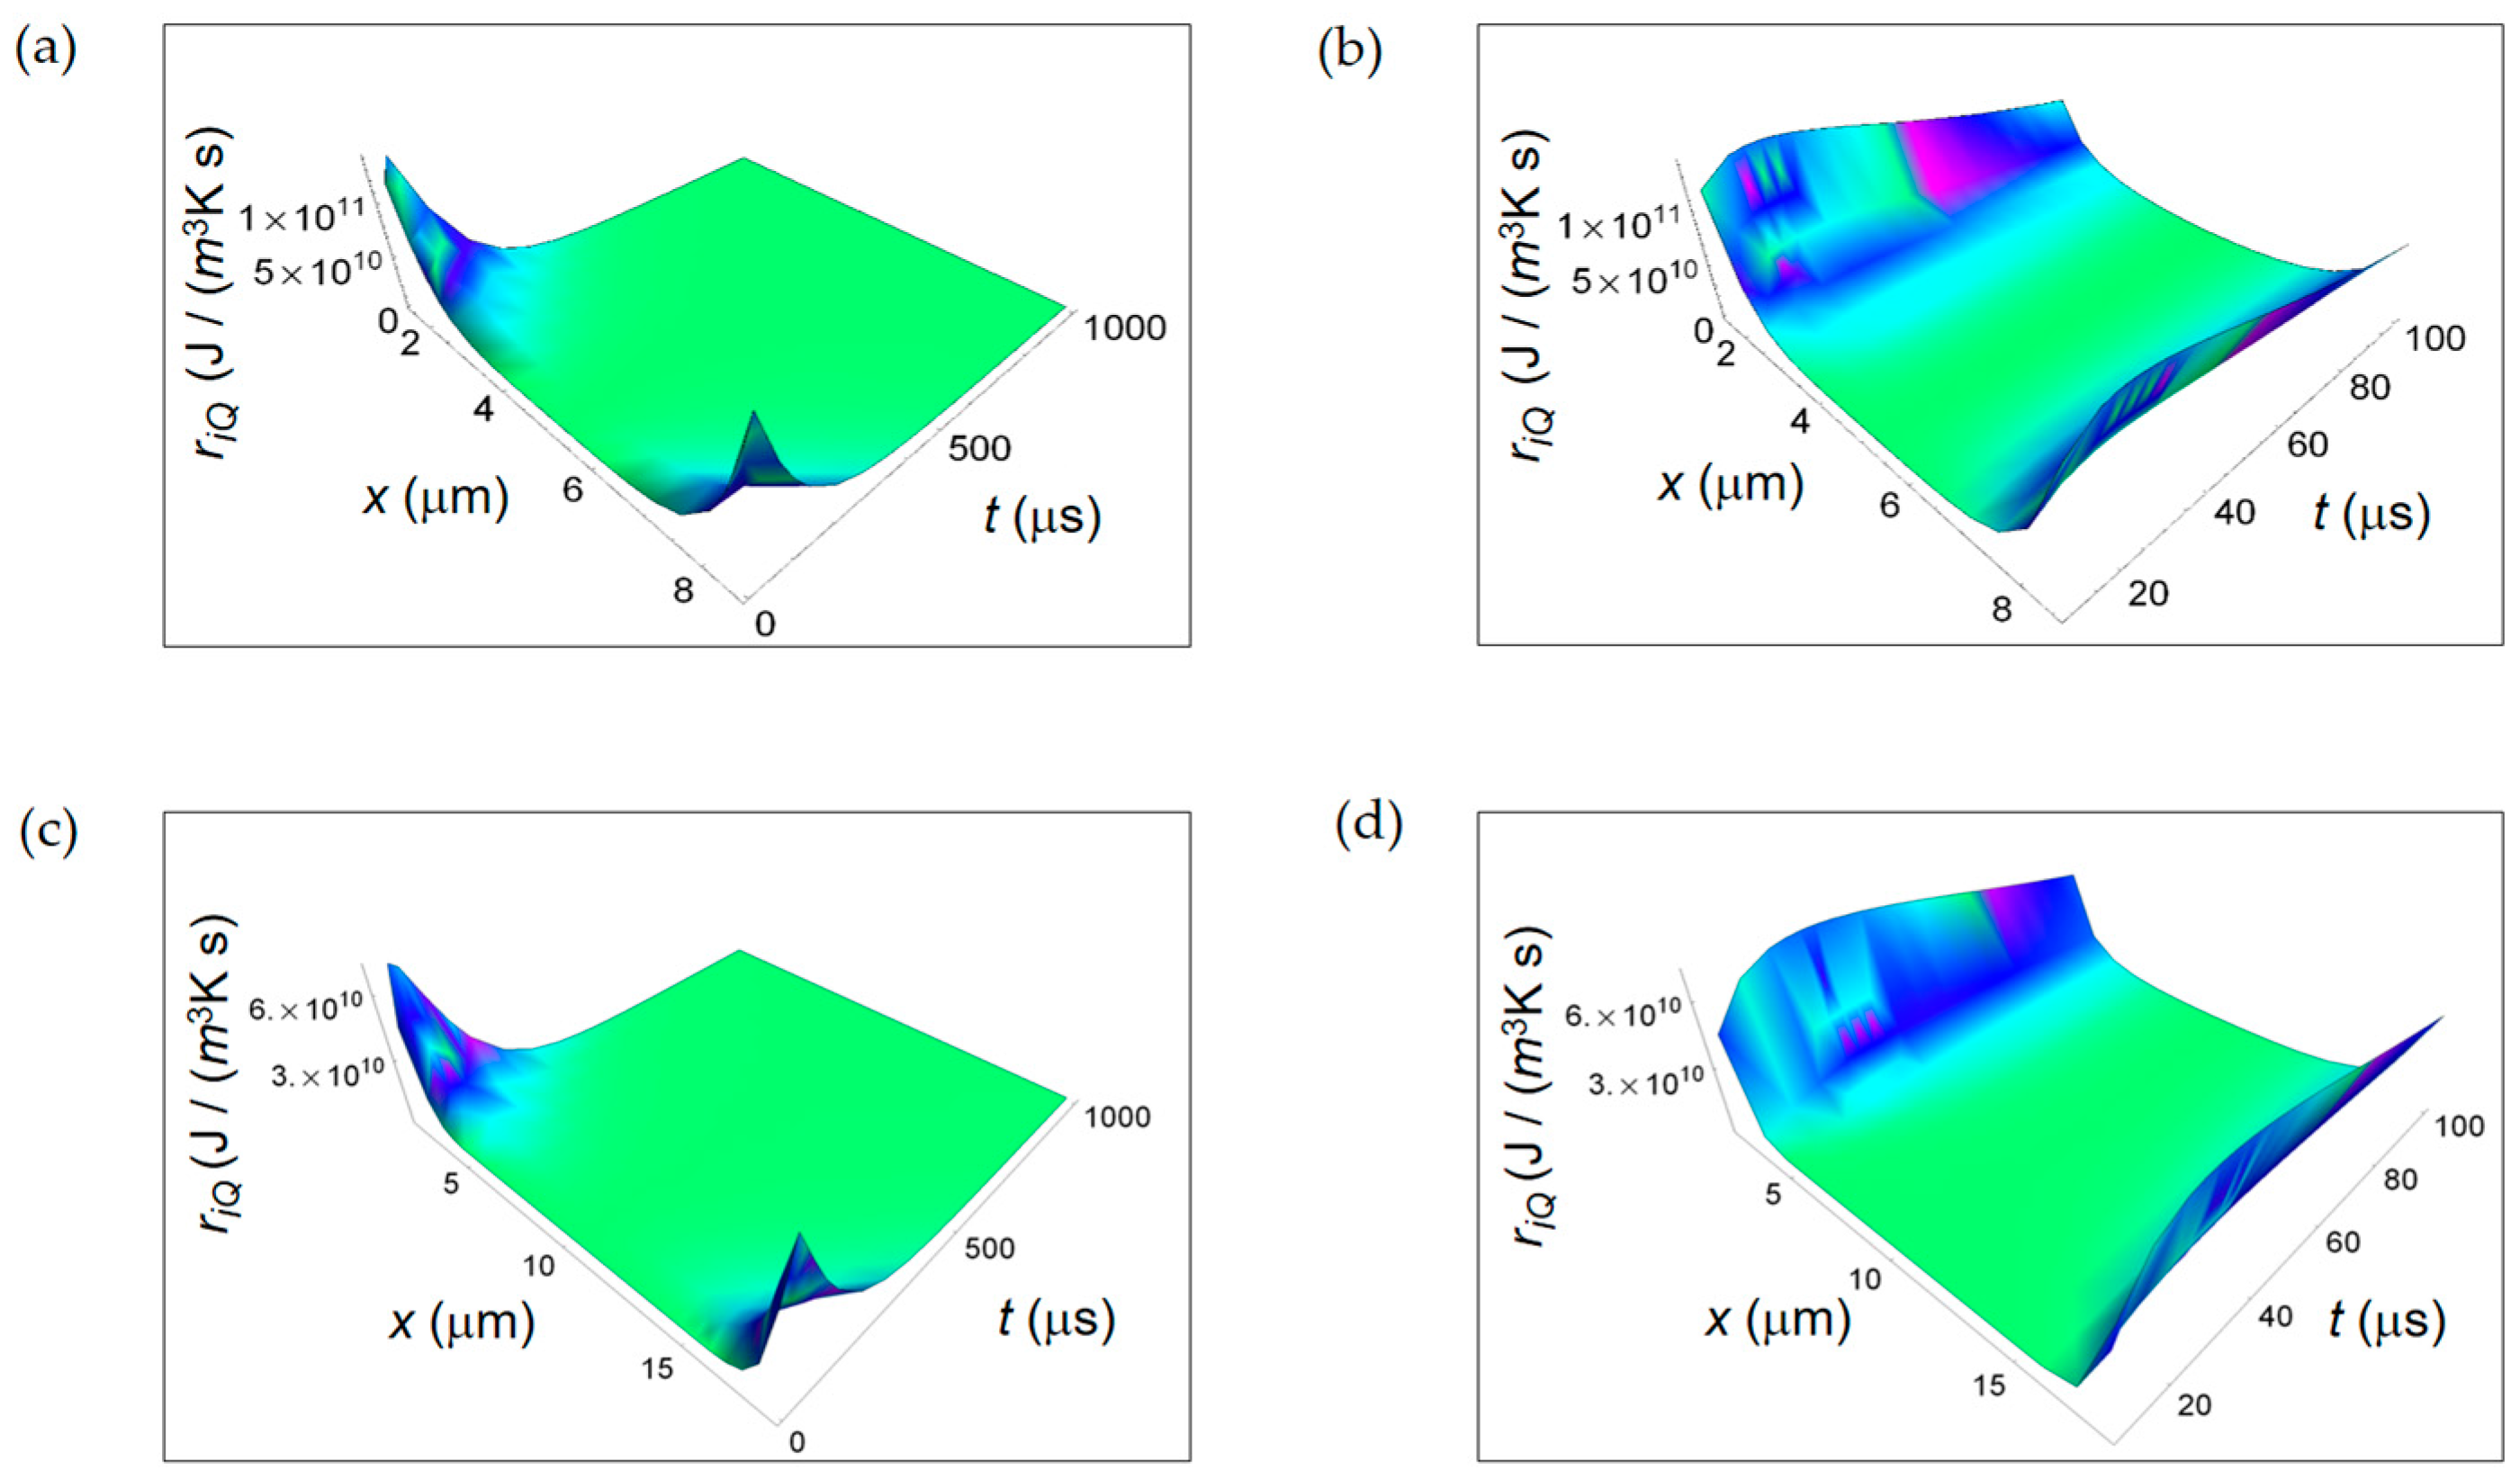
In Figure 2 we display ri Q calculated according to Equation (2) taking K = 0.600 J/(m s K) and κH20 = 0.143 × 10⁻⁶ m2/s, the thermal diffusivity in water [34]. ri Q is a decreasing function of time for both normal and cancer cells with a consistent magnitude close to the cell borders and almost zero magnitude close to the cell centers and no significant differences between normal and cancer cells in the first instant of time (Figure 2b,d, respectively).
ri D was calculated according to Equation (3), while ri r was calculated according to Equation (4). We have taken Nresp = 4 (Nferm = 3), the number of chemical species involved in the respiration (fermentation) process, wresp = 0.8 (wferm = 0.2) for a normal cell and wresp = 0.1 (wferm = 0.9) for a cancer cell [32,33]. In addition, the partial molar energies or chemical potentials at t = 0 and x = L/2, at standard conditions, used in the numerical calculations were: μC6H12O6 = −917.44 kJ/mole, μO2 = 16.44 kJ/mole, μcO2 = −385.99 kJ/mole, μH2O = −237.18 kJ/mole, μC3H5O3− = −516.72 kJ/mole where C3H5O3− is the lactate ion and μH+ = 0 kJ/mole in aqueous solution. Instead, we have employed the following diffusion constants at standard conditions: DC6H12O6 = 6.73 × 10⁻¹⁰ m2s−1, DO2 = 21.00 × 10⁻¹⁰ m2s−1, DcO2 = 19.20 kJ/mole × 10−10 m2s−1, DH2O = 21.00 × 10⁻¹⁰ m2s−1, DC3H5O3− = 9.00 × 10⁻¹⁰ m2s−1 and DH+ = 45.00 × 10⁻¹⁰ m2s−1 in aqueous solution. For the calculation of ri r we have taken as values of the pathway kinetic constants kkinresp = 10−5 s−1 and kkinferm = 10−4 s−1, and Nm C6H12O6 = 1 as a reference concentration [34]. We stress that we have used Nm C6H12O6 = 1 and not the real concentration during fermentation and respiration processes because this is a model calculation focusing on the comparison of the trend of the rates during the main metabolic pathways and not on their absolute values. It is also evident that cells predominantly fermentative compared to cells predominantly respiratory use a significant higher glucose quantity in the same unit of time.
Figure 3 shows the RIEDP due to chemical species diffusion during glucose catabolism inside a cell expressed by ri D. For both normal and cancer cells ri D exhibits a significant magnitude close to the centre of the cell and decreases towards the borders and with increasing time. In addition, in the first instants of time (see Figure 3b,d), ri D has a vanishing magnitude especially in a cancer cell and then it increases reaching a maximum to decrease with time. This initial trend is due to the combined decreasing exponential time dependence that includes diffusion coefficients and inverse power time dependence.
Interestingly, the rate of decreasing for a cancer cell is lower than the corresponding one for a normal cell highlighting the tendency for diffusion processes in cancer cells to reach the global equilibrium in a slower way.
ri r displayed in Figure 4 is maximum close to the centre of the cell, slightly reduces the amplitude towards the cell border and strongly decreases with increasing time. This behaviour is typical of both normal and cancer cell. Analogously, ri r exhibits a slower rate with increasing time for a cancer cell and this trend is even more evident narrowing down to the temporal window of 100 μs (see Figure 4b,d).
It is evident that, close to the cancer cell borders, the ri r surface ends in two wings where it has a higher magnitude with respect to the one in the centre of the cell. Therefore, we can state that the rate of entropy density due to internal cell mass transport exhibits a lower decrease with increasing time in a cancer cell.
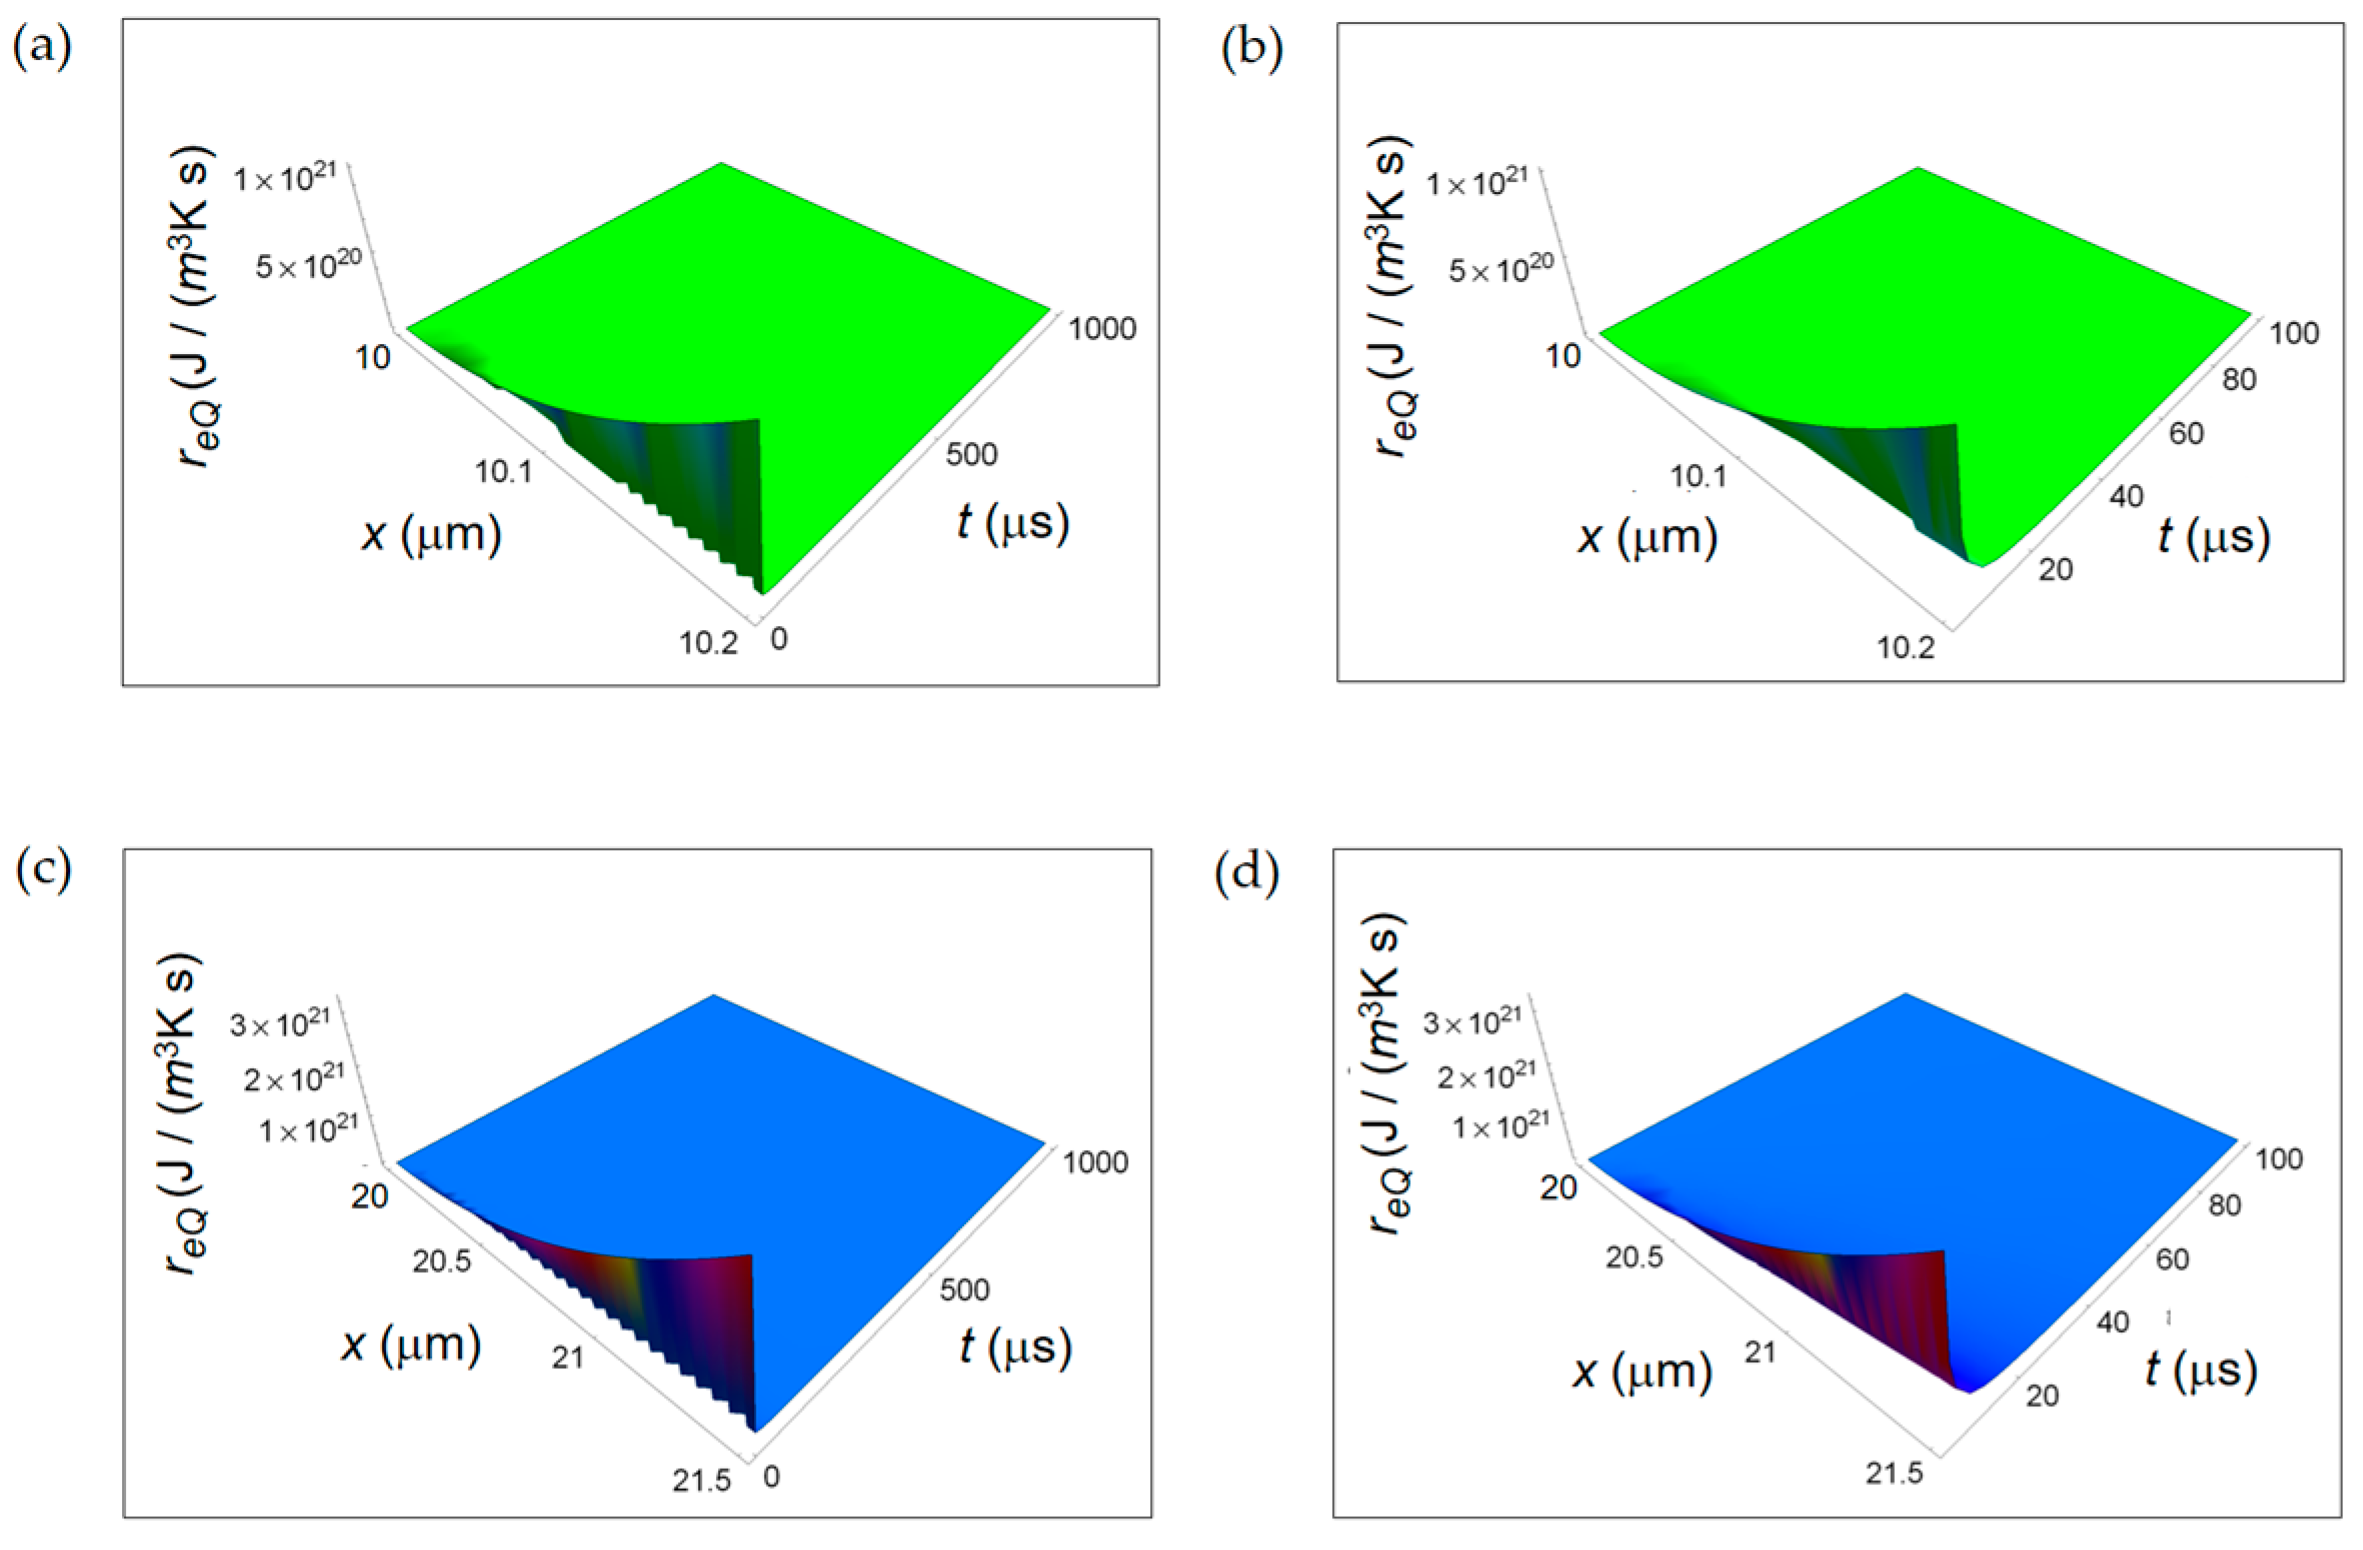
In Figure 5 re Q calculated according to Equation (6) is displayed. The parameters employed in the numerical calculations are: Nm pr resp = 12, the number of moles of the products of respiration, Nm pr ferm = 4, the number of moles of the products of the lactic acid fermentation. The spatial range corresponds to the average size of the intercellular space for breast tissue, namely 0.2 μm for the normal cell and 1.5 μm for the cancer cell [40]. At the initial instants of time, the further from the cell the more the magnitude of re Q increases, and with increasing time it tends to vanish. This vanishing behaviour is already evident looking at Figure 5b for a normal cell and Figure 5d for a cancer cell for a time interval of 100 μs. Likewise ri Q, also re Q decreases with time with the same rate for a normal and a cancer cell.
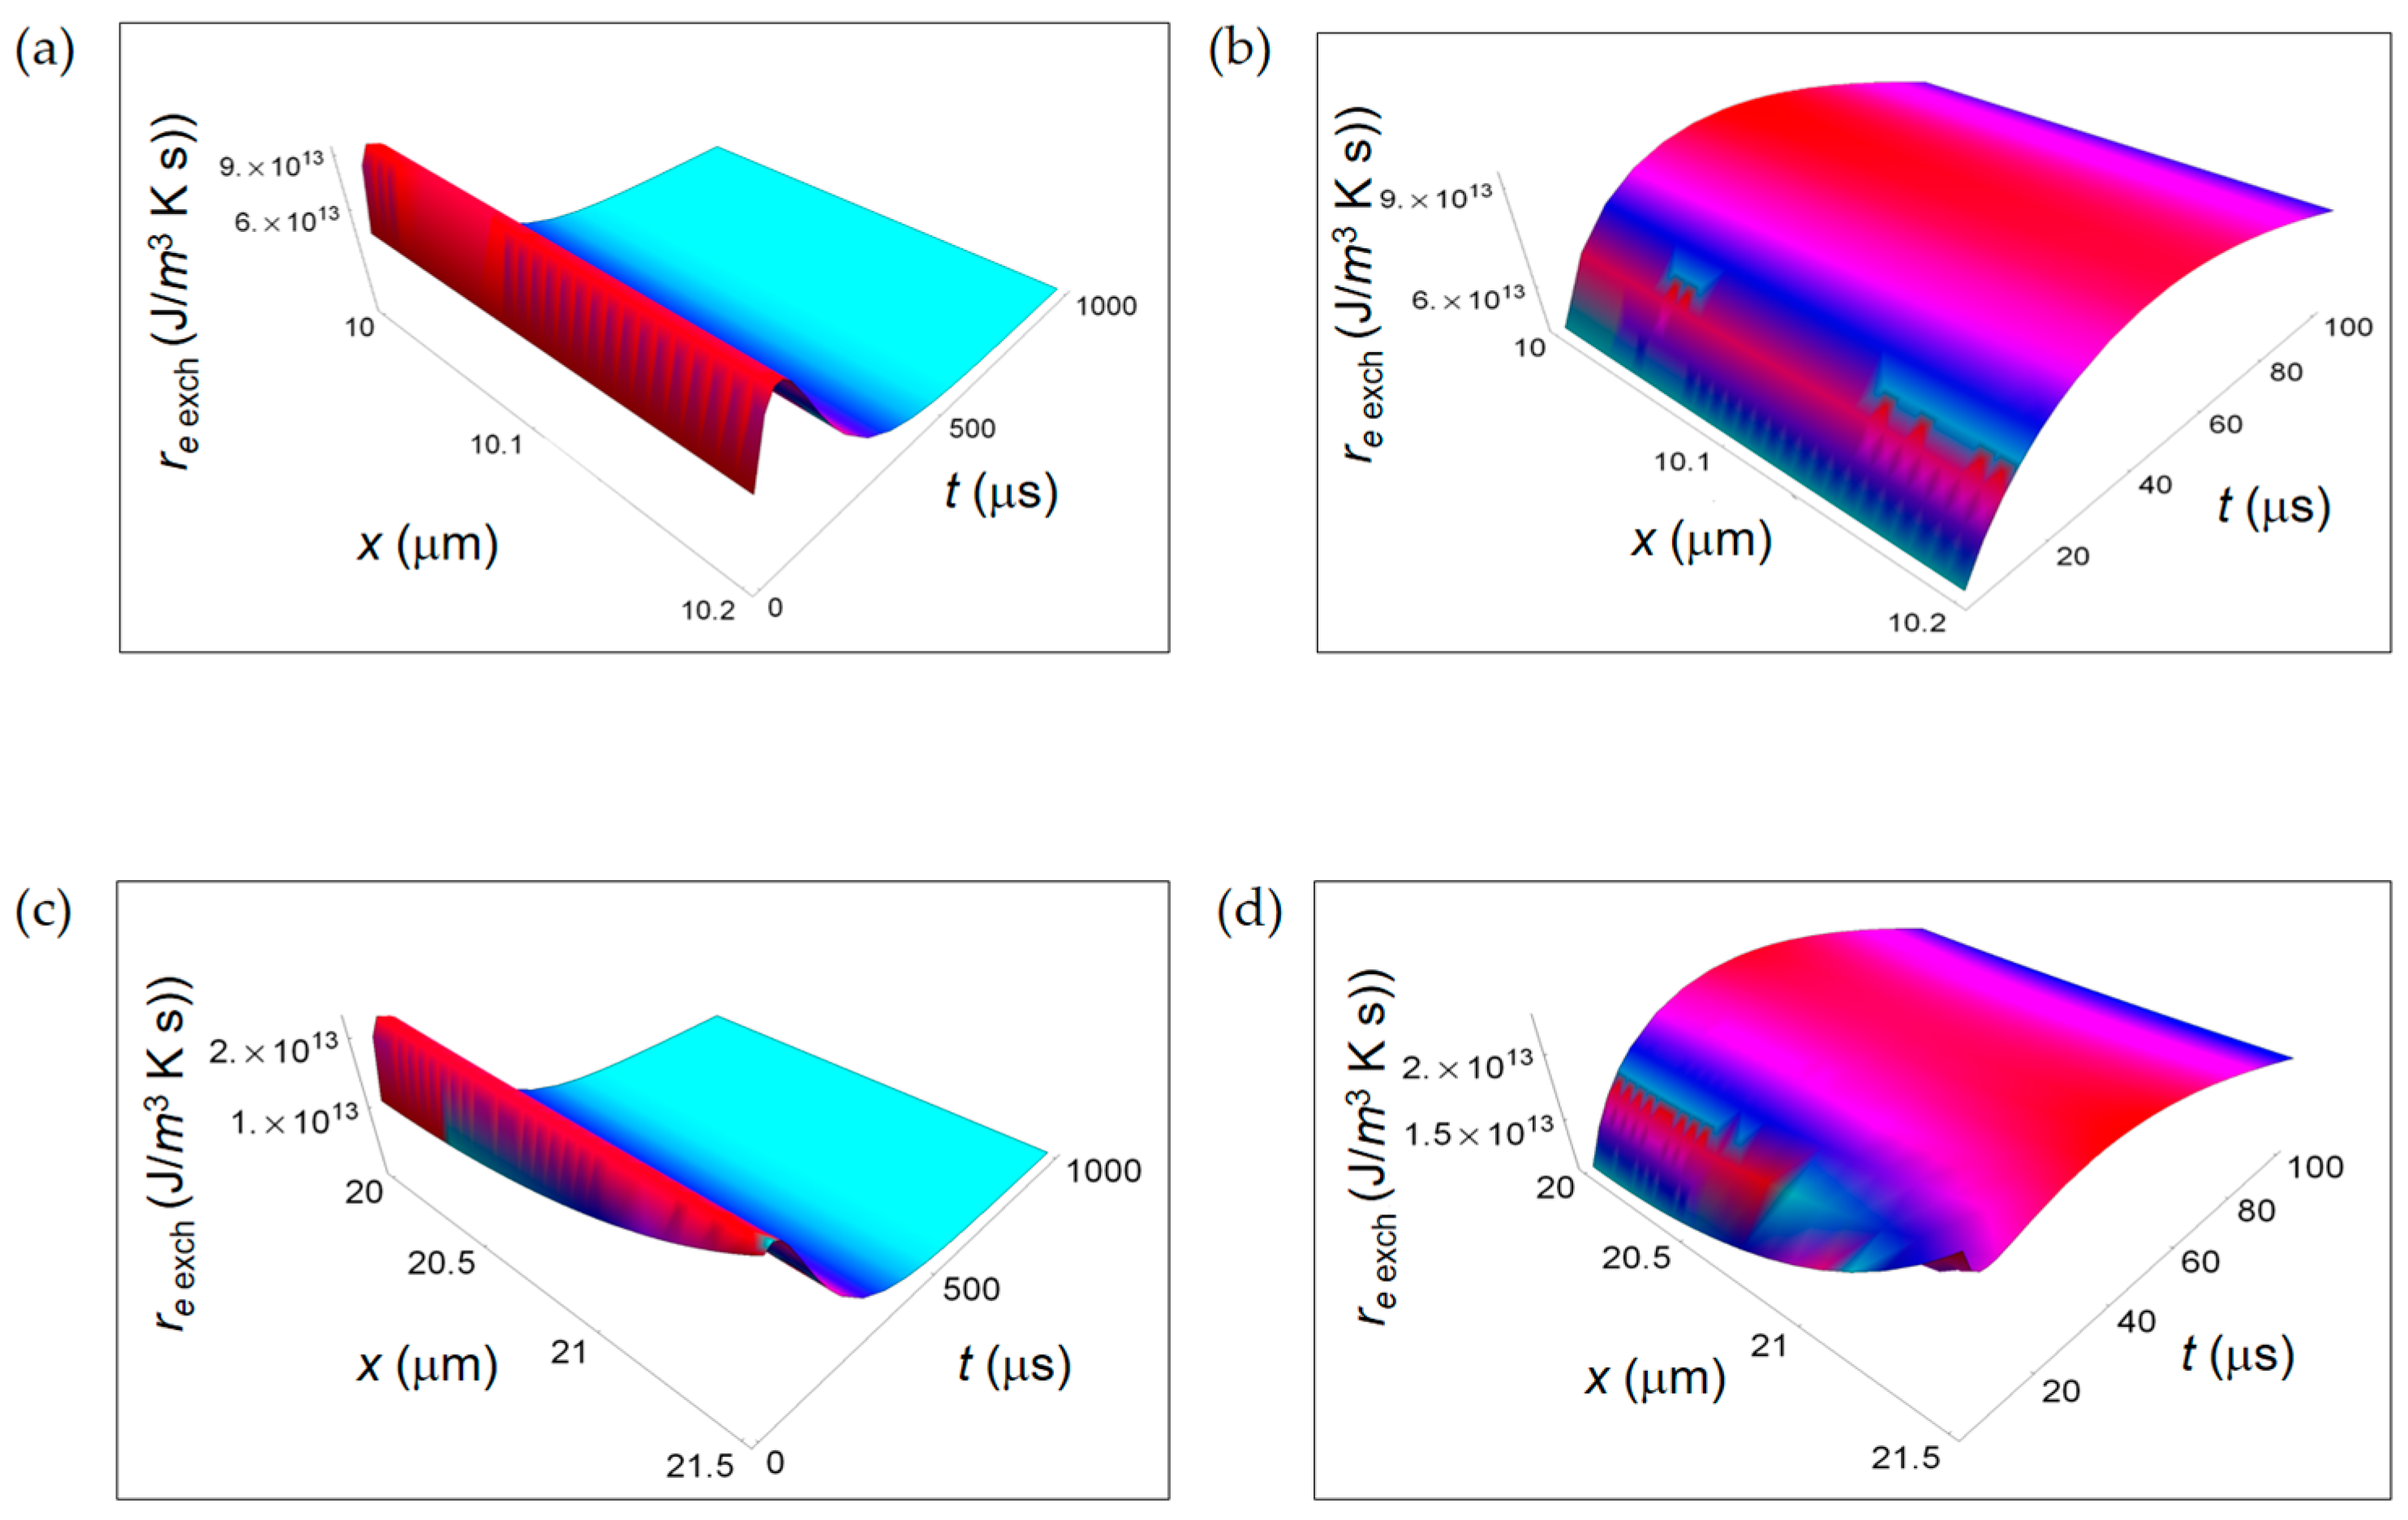
Figure 6 shows re exch computed by using Equation (7) taking the characteristic length x0 = 10 nm. In particular, re exch starts from a minimum value very close to t = 0 and then increases as a function of t at the first instant of times reaching a maximum for all x. Finally, it decreases tending to vanish with increasing time. This initial trend is not surprising and is due to the combined exponential time dependence and square root time dependence. Also re exch exhibits a lower decreasing rate in a cancer cell with increasing time. This behaviour is already observable comparing Figure 6a with Figure 6c and, more clearly, comparing Figure 6b with Figure 6d in the small temporal window of 100 μs. The trend of re exch in the first instant of times is different with respect to the one shown in [34] because of the different chosen origin of time in the two calculations.
3.2. Rate of Entropy Density Production for Lactic Fermentation and Respiration Processes: Numerical Results
In this study, we present the numerical results obtained for the rate of entropy density when considering separately the lactic fermentation from the respiration pathways. We write the total rate of energy density for the two processes, viz. r resp (x,t) = ri resp (x,t) + re resp (x,t) and r ferm (x,t) = ri ferm (x,t) + re ferm (x,t).
For consistency with the previous results, we apply the calculation to glucose catabolism of breast cells but the conclusions drawn are valid also for other tissues. Without loss of generality, we have taken a representative cell having average size comparable to that of a normal cell.
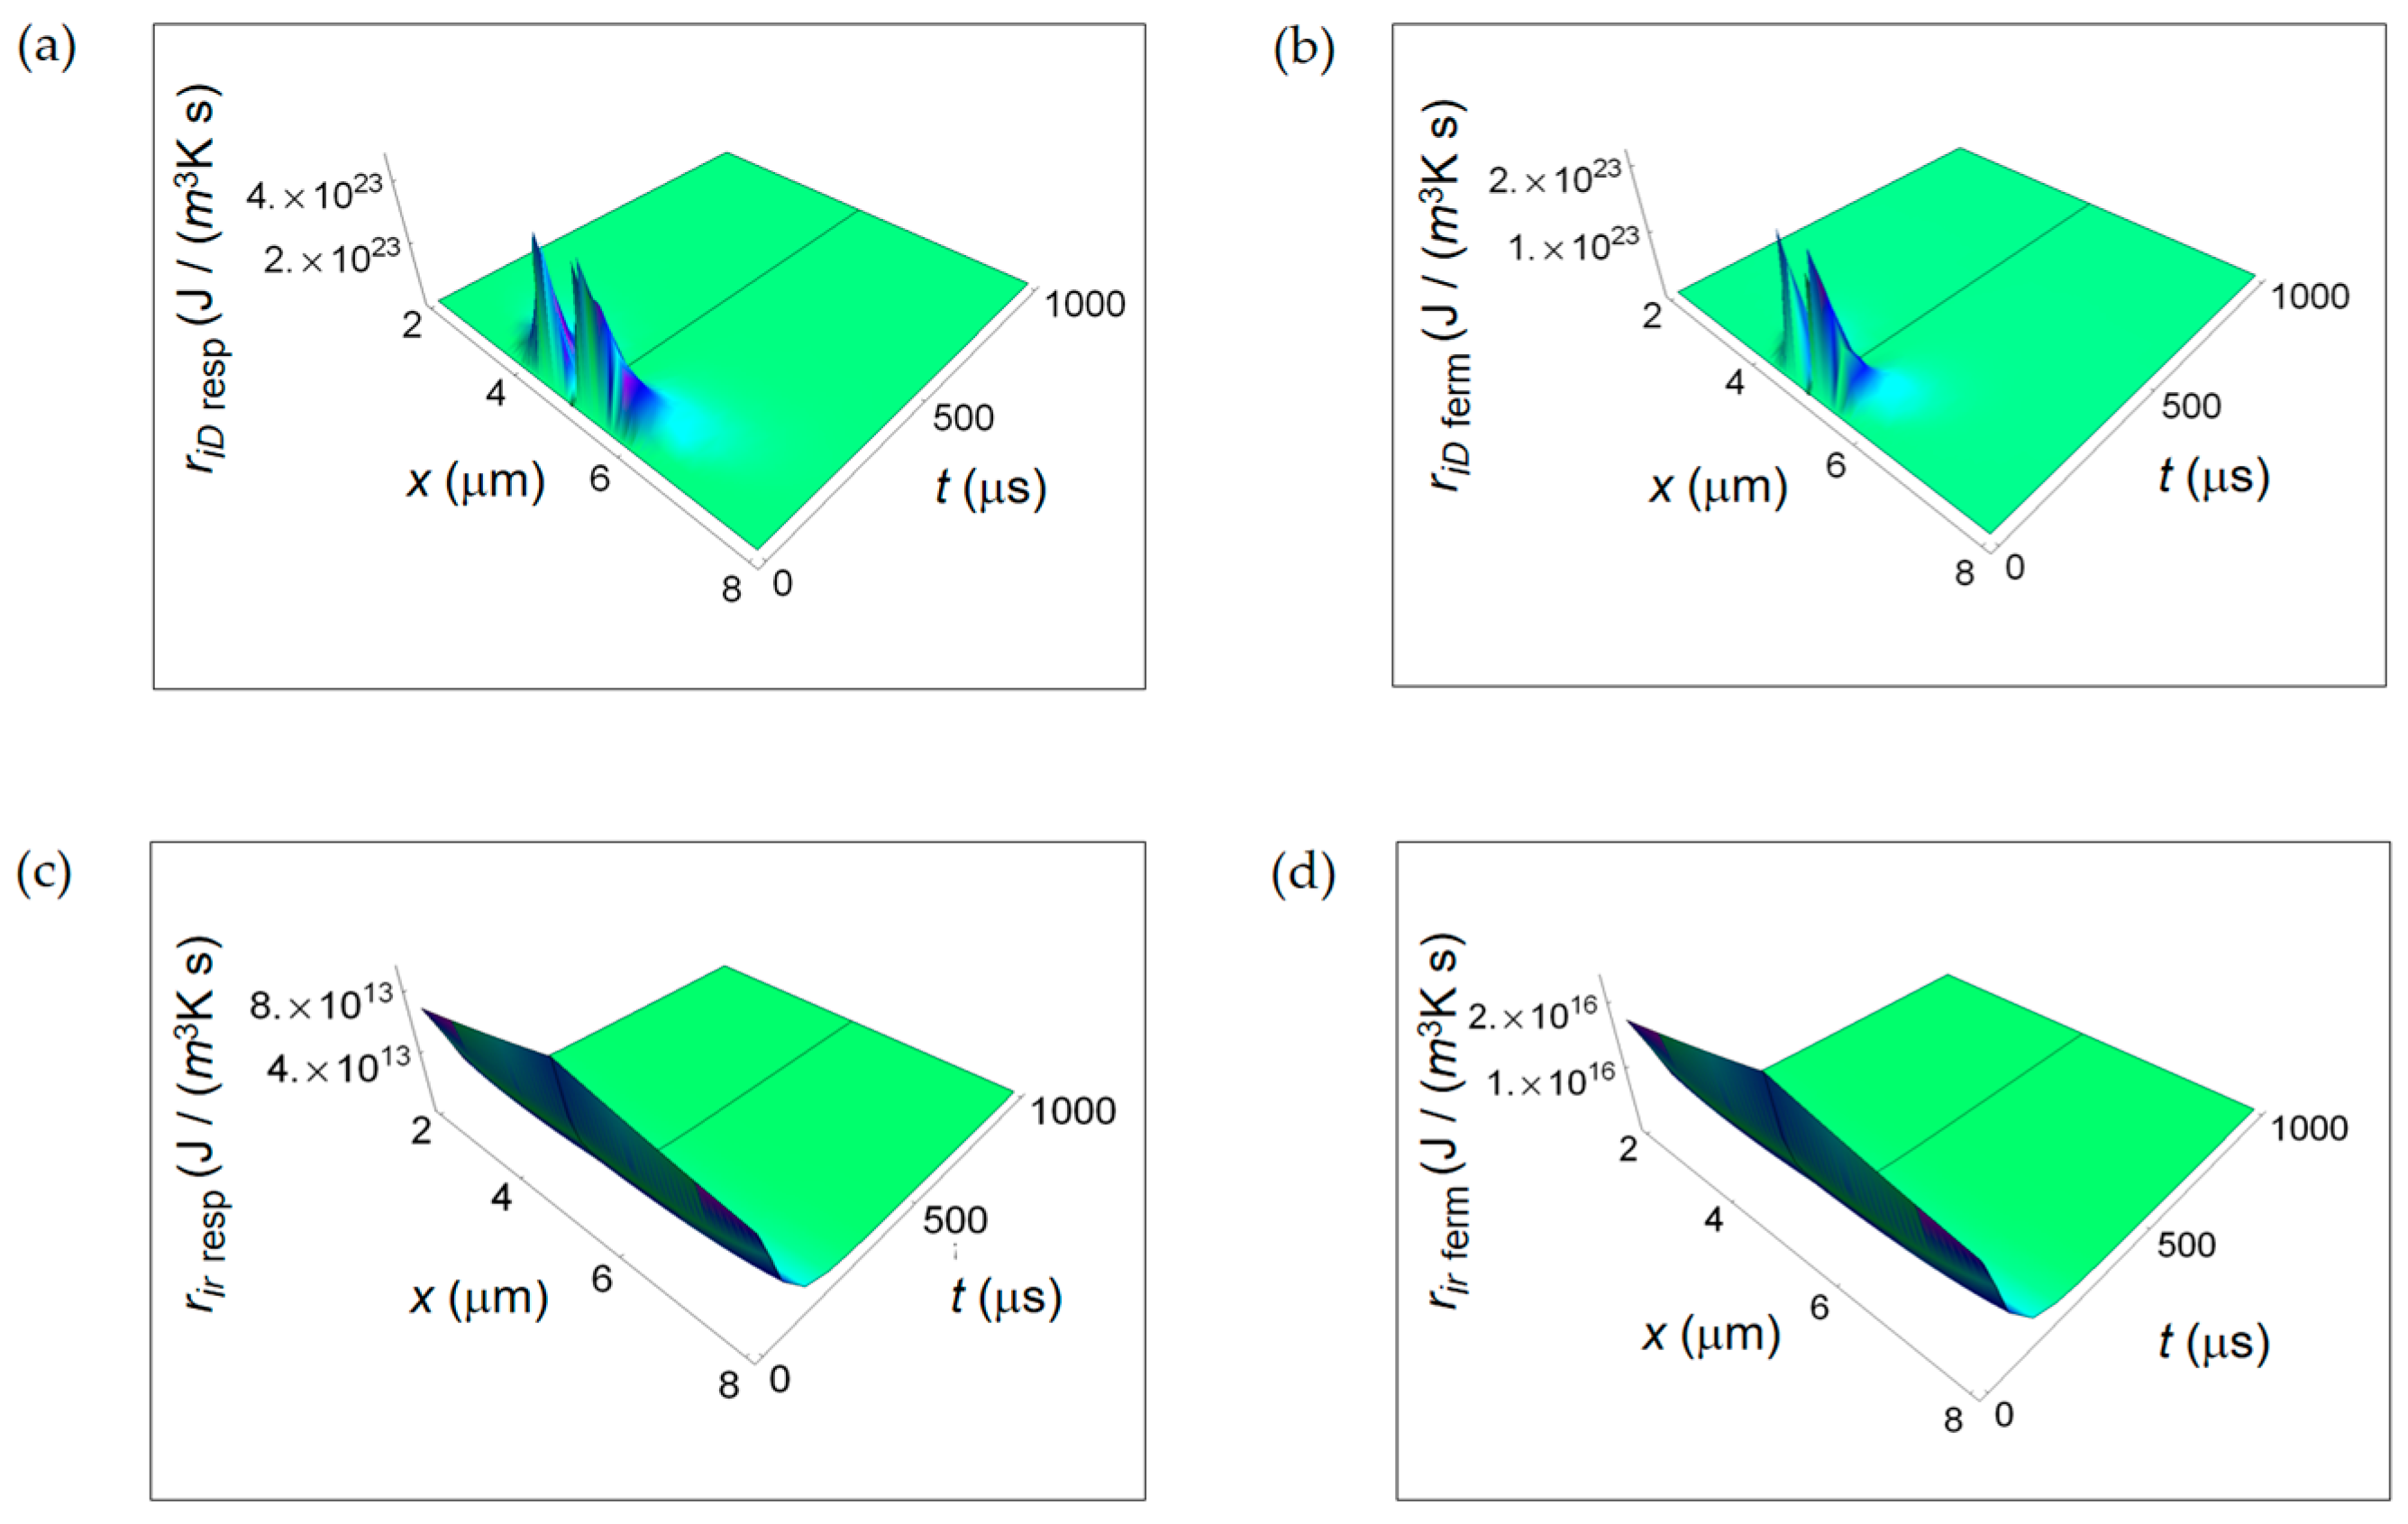
Figure 7 illustrates ri D due to internal mass transport getting contributions from diffusion of chemical species (Figure 7a,b) and ri r for irreversible chemical reactions (Figure 7c,d) for purely respiration and lactic fermentation processes, respectively. While ri D is comparable for the two metabolic pathways, there is a strong prevalence of ri r related to the fermentation process. This means that, in the minimum living system, the entropy exchanges per unit time occurring during fermentation irreversible reactions prevail over the ones taking place during respiration irreversible reactions. We will come back to this argument in the next subsection when discussing the corresponding ratios.
In Figure 8, we display, for both respiration and fermentation processes, re Q, respectively due to heat flow from the cell towards the intercellular environment for respiration and fermentation processes and re exch for the exchanges of matter between the cell and the intercellular space. In both cases, re Q increases away from the border of the cell and is larger for the respiration process. The space and time dependence of re exch as a function of x and t is rather similar for the two metabolic pathways with re exch resp of one-order of magnitude larger than re exch ferm. Therefore, for the REEDP the entropy exchange per unit time of respiration prevails over the one of fermentation. Likewise the RIEP, also the REEDP associated to these metabolic processes considered separately decreases with time and the total rate of entropy density production r(x,t) = ri(x,t) + re(x,t) reaches a global minimum in accordance with Prigogine’s minimum dissipation principle.
3.3. Ratios of the Rates of Entropy Densities for Fermentation and Respiration Processes
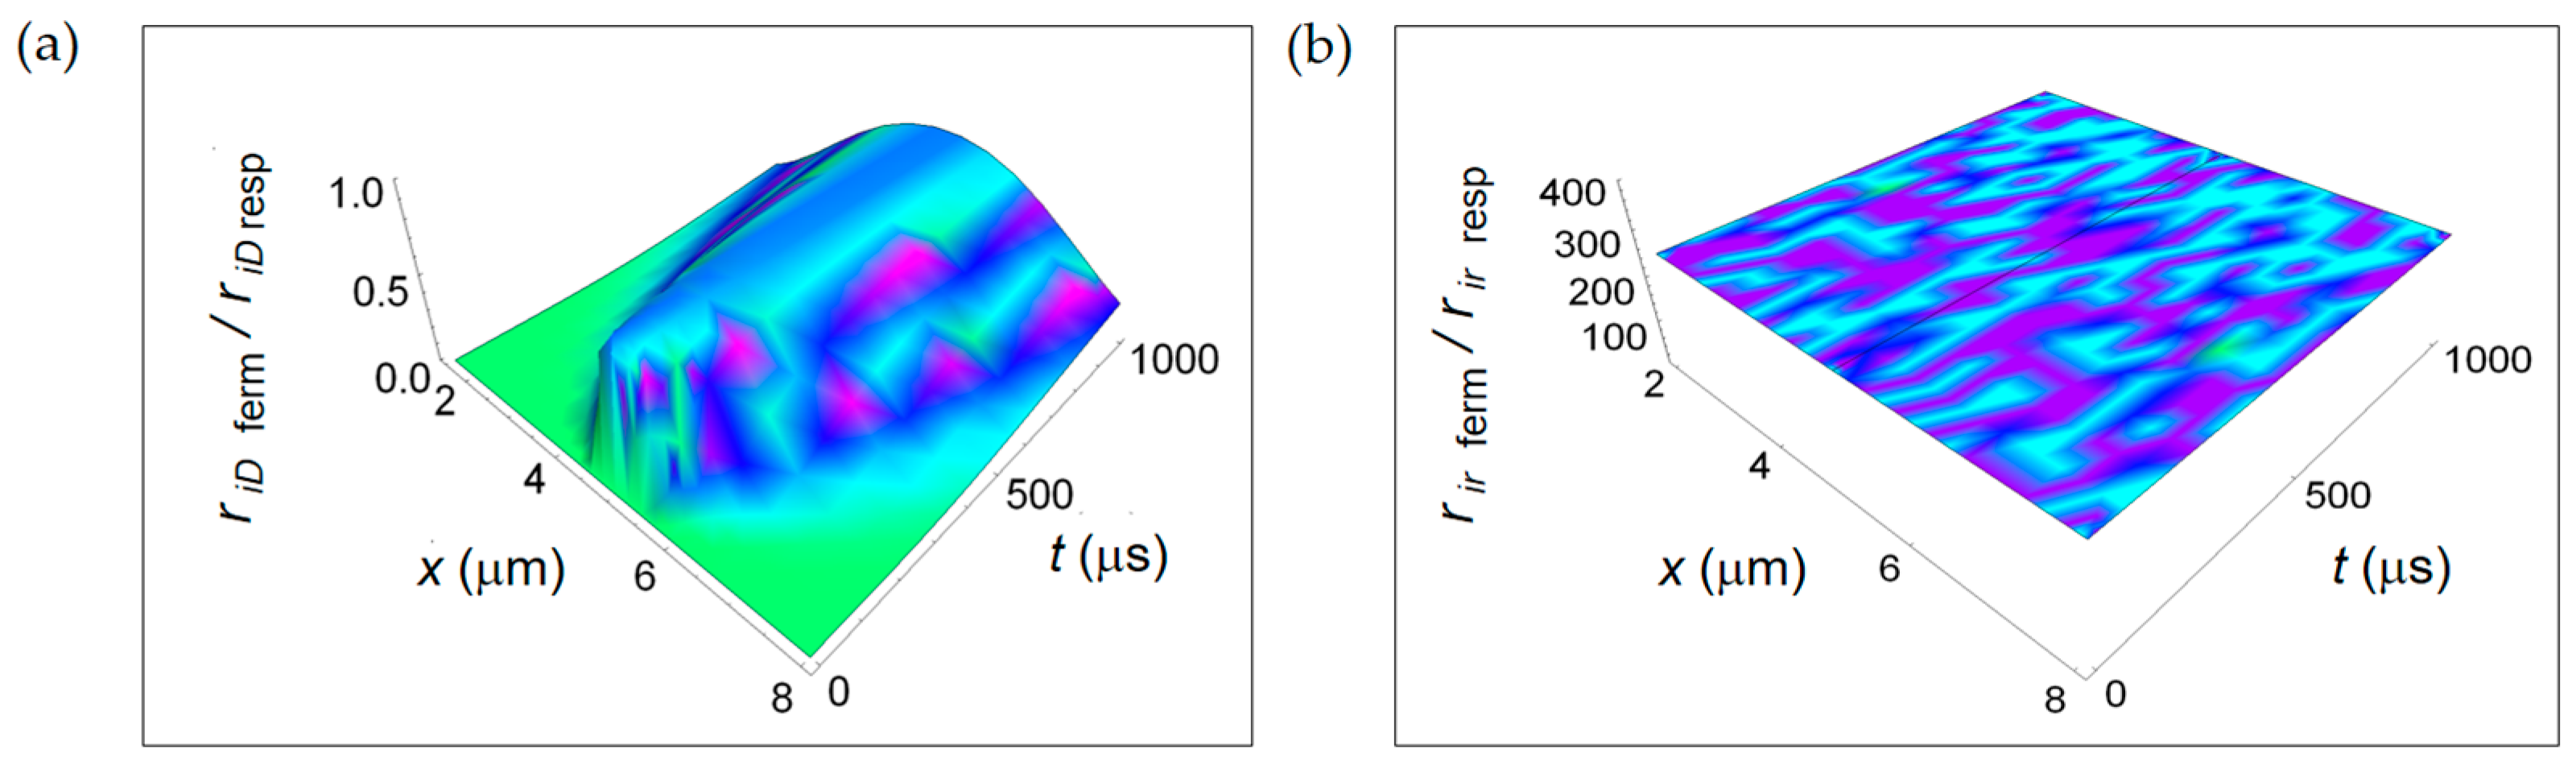
In this study, we discuss the key results of the work focusing our attention on the qualitative and quantitative behaviour of the ratios of the rate of entropy density for the two investigated metabolic processes. This approach is a real advantage with respect to the description through the rate of entropy density because it allows to single out only the thermodynamic dependence for the different contributions not considering the geometric dependence (e.g., the volume of the cell) contained in the entropy density definition. In Figure 9, we depict the ratios ri D ferm/ri D resp and ri r ferm/ri r resp. Interestingly, the ratio ri D ferm/ri D resp has a space and time dependence and dramatically increases passing from the cell borders to the cell centre. This trend is due to the different time-dependence of the chemical species involved in the two metabolic processes through their diffusion coefficients and chemical potentials.
However, ri D ferm/ri D resp < 1 and, on average, is about 0.5. This trend is an evidence for a little bigger entropy gain per unit time due to chemical species diffusion in reactions characterizing the respiration process. On the other hand, the ratio ri r ferm/ri r resp related to irreversible reactions is constant in space and time and graphically represented as a plane parallel to the x-t plane. From Equation (17) it turns out that ri r ferm/ri r resp ≈ 250 with kferm/kresp = 10. This behaviour is due to the much larger contribution of the chemical potentials weighted by the stoichiometric coefficients characterizing the fermentation metabolic pathway. As a result, there is a consistent internal entropy gain per unit time for irreversible reactions occurring during the faster fermentation process. This is the key result of the paper and is independent of the size and type of the cell, either normal or cancer.
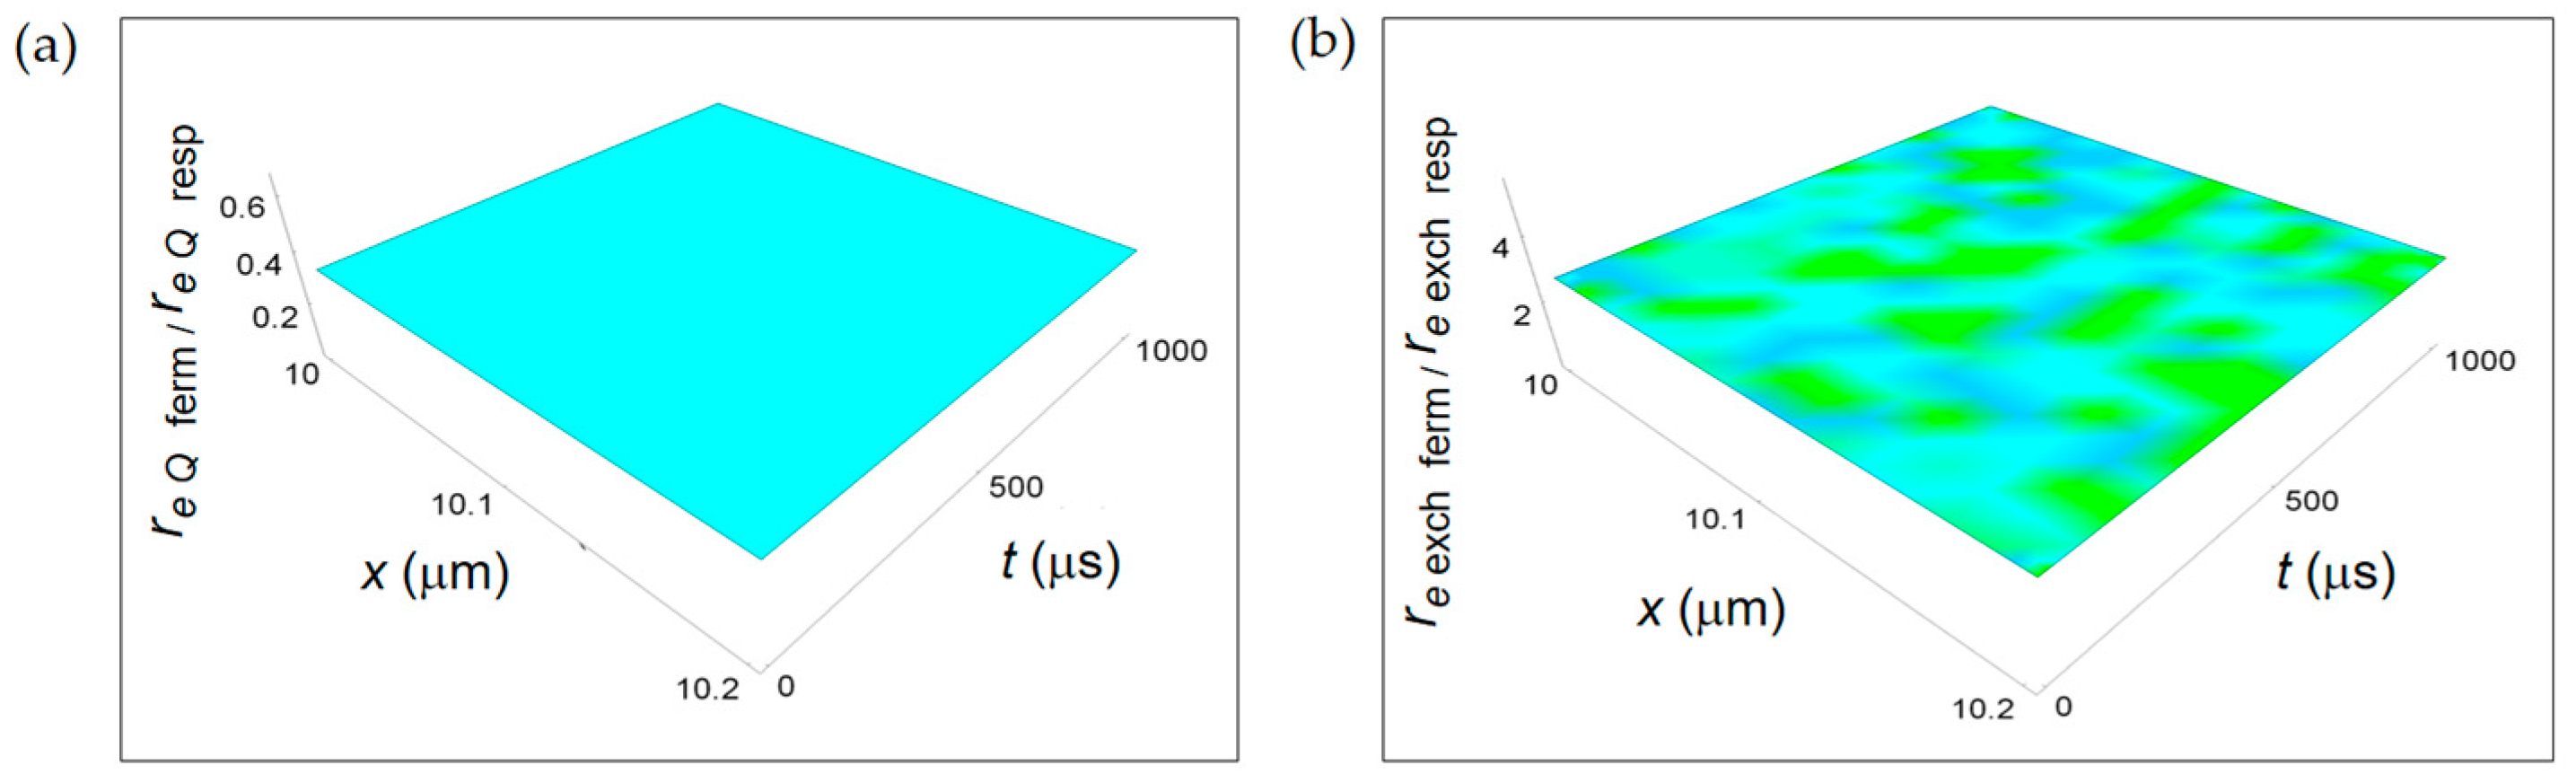
Figure 10 displays the ratios re Q ferm/re Q resp and re exch ferm/re exch resp derived from the REEDP contributions. Both ratios do not have a space and time dependence and are represented by planes parallel to the x-t plane. In particular, re Q ferm/re Q resp < 1, while re exch ferm/re exch resp > 1 and one order of magnitude bigger than the re Q ferm/re Q resp ratio. Therefore, there is a prevalence of entropy exchanges per unit time between the cell and the intercellular space during the respiration metabolic pathway occurring via the transport of heat and a prevalence of exchanges of products of chemical reactions per unit time during the fermentation metabolic pathway.
This result is similar to the one obtained for the ratio ri r ferm/ri r resp associated to irreversible chemical reactions confirming that reactions occurring during the fermentation process are highly entropic in time. This behaviour does not contradict the fact that the total entropy variation per mole associated to a fermentation process is lower than the one due to respiration process because of the reactions time that is much higher for respiration.
4. Discussion
Although for many years there has been a reductionist vision of biological systems, it is clear today that living systems are the result of complex network interconnections and non-linear self-organization. In recent years, it has been shown a strong link between irreversible metabolic reactions, epigenetic patterns and gene expression patterns [13,14,15,34] as an evidence of a new and unified scenario. In this context, the phenomenological and thermodynamic approach could provide a solid basis for a new systemic conception. In fact, it is plausible that living systems originate from a high value of the rate of entropy dissipation to reach a stationary minimum dissipation phase [14,15,42].
In this respect, the results found in our theoretical analysis of fermentation and respiration processes lead to draw important conclusions about the description of cell thermodynamics via the computation of the rate of entropy density production. The cell, either normal or cancer, during its irreversible processes always reaches a state of global equilibrium with increasing time in accordance with the minimum dissipation Prigogine’s theorem and this occurs independently for the two main metabolic pathways. The definition of the ratios between the corresponding rates of entropy density has the relevant advantage to remove the cell size dependence and any geometrical dependence appearing in the definition of the rates themselves leaving only the thermodynamic dependence. Consequently, there is no difference between normal and cancer cells with different sizes and the found behaviour of the ratios can be regarded as universal.
Owing to this, the calculation of the ratios between the rates of entropy density is crucial and leads to the key result of this work: the entropy gain per unit time for irreversible reactions inside cells during fermentation is higher than the corresponding one during respiration. From this point of view, it is particularly interesting to note that cellular systems that are stable in time or, in other words, resistant to environment changes (for example, ASC, CSC and cancer cells) are characterized by a prevalence of lactic fermentation. Regarding this, because of the high lactic fermentation frequency occurring for maintaining constant the ATP pool there is a strong entropy per unit time gain associated to irreversible reactions.
Irreversible reactions are at the origin of life and we can affirm that the ones related to fermentation metabolism have been during evolution those producing the maximum entropy per unit time. We can also state the existence of a principle of maximum entropy per unit time applied to living systems supposing that there has been a deviation of metabolism towards fermentation. Finally, the space- and time-invariance of ri r ferm/ri r resp endows this ratio with universality. Another relevant result, obtained by means of numerical calculations, is the space- and time-dependence of the ratio ri D ferm/ri D resp related to the diffusion inside cells of the chemical species marking the different trend of this ratio with respect to the other calculated ratios that are spatially and time invariant. This peculiar behaviour is due to the time-dependence of the rates ri D ferm and ri D resp with the exponentials appearing in Equation (16) that are weighted by the different diffusion coefficients of the reagents and products of reactions and lead to a considerable concentration of this ratio, especially in the centre of the cell at any instant of time.
The achievement of a stationary phase of lower dissipation and thermodynamic stability could be a key interpretation to understand the robustness and redundancy of neoplastic systems associated with greater gene modification and Shannon entropy [16,17]. As a result, there is an increase of the possible number of responses of the system to environment changes or equivalently the concept of Darwinian fitness [43,44].
It is interesting to note that the link among gene, epigenetic and metabolic networks and the link among their corresponding contributions to the rate of entropy density production shows a unitary paradigm according to which the thermodynamic description of a cell (either normal or cancer) is the result of a nonlinear combination of every single network. In other words, the cell, regarded as the minimum living system, is more than the sum of each of its subsystems.
5. Conclusions
In summary, the thermodynamic approach to describe the physics at the basis of the main metabolic pathways of glucose catabolism could play a crucial role in describing a unified vision of biological systems. More precisely, the study of the rate of entropy density represents a starting point able to reveal the phenomenological and unitary feature of life opening new perspectives in modern biology via a simple picture of irreversible processes in living systems.
The analysis of the thermodynamics at the basis of fermentation and respiration processes via the calculation of the corresponding rates of entropy density separately for the two metabolic pathways has allowed the understanding of their entropy gain per unit time. The interpretation of the thermodynamic behaviour of these two key processes typical of glucose catabolism and characterizing normal and cancer cells has been validated by means of the definition of thermodynamic ratios between the corresponding rates. We believe that our findings might be useful for future studies able to confirm our predictions even though our analysis has already partially confirmed by several studies with special regard to the rate of entropy contribution due to heat exchanges with the intercellular environment for normal and cancer cells [45].
Acknowledgments
This work was partially supported by National Group of Mathematical Physics (GNFM-INdAM). We are grateful to Santi Gangi, Angela Strazzanti and Fabio Borziani for helpful discussion and kind support in this research activity. This study is dedicated to the important work of Otto Heinrich Warburg.
Author Contributions
Roberto Zivieri performed the analytical and numerical calculations with inputs from Nicola Pacini. Both authors contributed to the research work, wrote, read and approved the manuscript.
Conflicts of Interest
The authors declare no conflict of interest.
References
- Guldberg, C.M.; Waage, P. Concerning Chemical Affinity. Erdmann’s J. Pract. Chem. 1879, 127, 69–114. [Google Scholar] [CrossRef]
- Schrödinger, E. What is Life? The Physical Aspect of the Living Cell; University Press: Cambridge, MA, USA, 1944. [Google Scholar]
- Luisi, P.L. The minimal autopoietic unit. Orig. Life Evol. Biosph. 2014, 44, 335–338. [Google Scholar] [CrossRef] [PubMed]
- Varela, F.G.; Maturana, H.R.; Uribe, R. Autopoiesis: The organization of living systems, its characterization and a model. Curr. Mod. Biol. 1974, 4, 187–196. [Google Scholar] [CrossRef]
- Ozernyuk, N.D.; Zotin, A.I.; Yurowitzky, Y.G. Deviation of the living system from the stationary state during oogenesis. Wilhelm Roux Arch. Entwickl. Mech. Org. 1973, 172, 66–74. [Google Scholar] [CrossRef] [PubMed]
- Keller, M.A.; Turchyn, A.V.; Ralser, M. Non-enzymatic glycolysis and pentose phosphate pathway-like reactions in a plausible Archean ocean. Mol. Syst. Biol. 2014, 10, 725. [Google Scholar] [CrossRef] [PubMed] [Green Version]
- Messner, C.B.; Driscoll, P.C.; Piedrafita, G.; De Volder, M.F.L.; Ralser, M. Nonenzymatic gluconeogenesis-like formation of fructose 1,6-bisphosphate in ice. Proc. Natl. Acad. Sci. USA 2017, 114, 7403–7407. [Google Scholar] [CrossRef] [PubMed]
- Warburg, O.; Wind, F.; Negelein, E. The metabolism of tumors in the body. J. Gen. Physiol. 1927, 8, 519–530. [Google Scholar] [CrossRef] [PubMed]
- Weinhouse, S.; Warburg, O.; Burg, D.; Schade, A.L. On respiratory impairment in cancer cells. Science 1956, 124, 267–272. [Google Scholar] [CrossRef] [PubMed]
- Dong, T.; Liu, Z.; Xuan, Q.; Wang, Z.; Ma, W.; Zhang, Q. Tumor LDH-A expression and serum LDH status are two metabolic predictors for triple negative breast cancer brain metastasis. Sci. Rep. 2017, 7, 6069. [Google Scholar] [CrossRef] [PubMed]
- Hur, H.; Xuan, Y.; Kim, Y.B.; Lee, G.; Shim, W.; Yun, J.; Ham, I.-H.; Han, S.-U. Expression of pyruvate dehydrogenase kinase-1 in gastric cancer as a potential therapeutic target. Int. J. Oncol. 2013, 42, 44–54. [Google Scholar] [CrossRef] [PubMed]
- Koukourakis, M.I.; Giatromanolaki, A.; Sivridis, E.; Gatter, K.C.; Trarbach, T.; Folprecht, G.; Shi, M.M.; Lebwohl, D.; Jalava, T.; Laurent, D.; et al. Prognostic and predictive role of lactate dehydrogenase 5 expression in colorectal cancer patients treated with PTK787/ZK 222584 (vatalanib) antiangiogenic therapy. Clin. Cancer Res. 2011, 17, 4892–4900. [Google Scholar] [CrossRef] [PubMed]
- Wong, C.C.; Qian, Y.; Yu, J. Interplay between epigenetics and metabolism in oncogenesis: Mechanisms and therapeutic approaches. Oncogene 2017, 36, 3359–3374. [Google Scholar] [CrossRef] [PubMed]
- Peng, M.; Yin, N.; Chhangawala, S.; Xu, K.; Leslie, C.S.; Li, M. Aerobic glycolysis promotes T helper 1 cell differentiation through an epigenetic mechanism. Science 2016, 354, 481–484. [Google Scholar] [CrossRef] [PubMed]
- Moussaieff, A.; Rouleau, M.; Kitsberg, D.; Cohen, M.; Levy, G.; Barasch, D.; Nemirovski, A.; Shen-Orr, S.; Laevsky, I.; Amit, M.; et al. Glycolysis-mediated changes in acetyl-CoA and histone acetylation control the early differentiation of embryonic stem cells. Cell Metab. 2015, 21, 392–402. [Google Scholar] [CrossRef] [PubMed]
- Hsu, C.F.; Wei, S.-Y.; Huang, H.-P.; Hsu, L.; Chi, S.; Peng, C.-K. Entropy of Entropy: Measurement of Dynamical Complexity for Biological Systems. Entropy 2017, 19, 550. [Google Scholar] [CrossRef]
- Banerji, C.R.; Miranda-Saavedra, D.; Severini, S.; Widschwendter, M.; Enver, T.; Zhou, J.X.; Teschendorff, A.E. Cellular network entropy as the energy potential in Waddington’s differentiation landscape. Sci. Rep. 2013, 3, 3039. [Google Scholar] [CrossRef] [PubMed]
- Vilar, J.M.G. Entropy of leukemia on multidimensional morphological and molecular landscapes. Phys. Rev. X 2014, 4, 021038. [Google Scholar] [CrossRef]
- Ridden, S.J.; Chang, H.H.; Zygalakis, K.C.; MacArthur, B.D. Entropy, ergodicity, and stem cell multipotency. Phys. Rev. Lett. 2015, 115, 208103. [Google Scholar] [CrossRef] [PubMed]
- Clevers, H. The intestinal crypt, a prototype stem cell compartment. Cell 2013, 154, 274–284. [Google Scholar] [CrossRef] [PubMed]
- Wahl, G.M.; Spike, B.T. Cell state plasticity, stem cells, EMT, and the generation of intra-tumoral heterogeneity. NPJ Breast Cancer 2017, 3, 14. [Google Scholar] [CrossRef] [PubMed]
- Sánchez-Danés, A.; Hannezo, E.; Larsimont, J.-C.; Liagre, M.; Youssef, K.K.; Simons, D.B.; Blanpain, C. Defining the clonal dynamics leading to mouse skin tumour initiation. Nature 2016, 536, 298–303. [Google Scholar]
- O’Brien, C.A.; Pollett, A.; Gallinger, S.; Dick, J.E. A human colon cancer cell capable of initiating tumour growth in immunodeficient mice. Nature 2007, 445, 106–110. [Google Scholar] [CrossRef] [PubMed]
- Tomasetti, C.; Li, L.; Vogelstein, B. Stem cell divisions, somatic mutations, cancer etiology, and cancer prevention. Science 2015, 355, 1330–1334. [Google Scholar] [CrossRef] [PubMed]
- Prigione, A.; Lichtner, B.; Kuhl, H.; Struys, E.A.; Wamelink, M.; Lehrach, H.; Ralser, M.; Timmermann, B.; Adjaye, J. Human induced pluripotent stem cells harbor homoplasmic and heteroplasmic mitochondrial DNA mutatens while maintaining human embryonic stem cell-like metabolic reprogramming. Stem Cells 2011, 29, 1338–1348. [Google Scholar] [PubMed]
- Folmes, C.D.; Nelson, T.J.; Martinez-Fernandez, A.; Arrel, D.K.; Lindor, J.Z.; Dzeja, P.P.; Ikeda, Y.; Perez-Terzic, C.; Terzic, A. Somatic oxidative bioenergetics transitions into pluripotency-dependent glycolysis to facilitate nuclear reprogramming. Cell Metab. 2011, 14, 264–271. [Google Scholar] [CrossRef] [PubMed]
- Son, M.J.; Ryu, J.S.; Kim, J.Y.; Kwon, Y.; Chung, K.S.; Mun, S.J.; Cho, Y.S. Upregulation of mitochondrial NAD+ levels impairs the clonogenicity of SSEA1+ glioblastoma tumor-initiating cells. Exp. Mol. Med. 2017, 49, e344. [Google Scholar] [CrossRef] [PubMed]
- Pavlović, M.; Radotić, K. Animal and Plant Stem Cells; Springer International Publishing: New York, NY, USA, 2017. [Google Scholar]
- Wang, P.; Wan, W.-W.; Xiong, S.-L.; Feng, H.; Wu, N. Cancer stem-like cells can be induced through dedifferentiation under hypoxic conditions in glioma, hepatoma and lung cancer. Cell Death Discov. 2017, 23, 16105. [Google Scholar] [CrossRef] [PubMed]
- Li, X.; Zhong, Y.; Lu, J.; Axcrona, K.; Eide, L.; Syljuåsen, R.G.; Peng, Q.; Wang, J.; Zhang, H.; Goscinski, M.A.; et al. MtDNA depleted PC3 cells exhibit Warburg effect and cancer stem cell features. Oncotarget 2016, 7, 40297–40313. [Google Scholar] [CrossRef] [PubMed]
- Li, X.; Lu, J.; Kan, Q.; Li, X.; Fan, Q.; Li, Y.; Huang, R.; Slipicevic, A.; Dong, H.P.; Eide, L.; et al. Metabolic reprogramming is associated with flavopiridol resistance in prostate cancer DU145 cells. Sci. Rep. 2017, 7, 5081. [Google Scholar] [CrossRef] [PubMed]
- Pacini, N.; Borziani, F. Oncostatic-Cytoprotective Effect of Melatonin and Other Bioactive Molecules: A Common Target in Mitochondrial Respiration. Int. J. Mol. Sci. 2016, 17, 344. [Google Scholar] [CrossRef] [PubMed]
- Pacini, N.; Borziani, F. Cancer stem cell theory and the Warburg effect, two sides of the same coin? Int. J. Mol. Sci. 2014, 15, 8893–8930. [Google Scholar] [CrossRef] [PubMed]
- Zivieri, R.; Pacini, N.; Finocchio, G.; Carpentieri, M. Rate of entropy model for irreversible processes in living systems. Sci. Rep. 2017, 7, 9134. [Google Scholar] [CrossRef] [PubMed]
- Kondepudi, D.; Prigogine, I. Modern Thermodynamics: From Heat Engines to Dissipative Structures; Wiley: New York, NY, USA, 2015. [Google Scholar]
- Dabbs, D.J.; Carter, G.; Fudge, M.; Peng, Y.; Swalsky, P.; Finkelstein, S. Molecular alterations in columnar cell lesions of the breast. Mod. Pathol. 2006, 19, 344–349. [Google Scholar] [CrossRef] [PubMed]
- Iden, S.; Collard, J.G. Crosstalk between small GTPases and polarity proteins in cell polarization. Nat. Rev. Mol. Cell Biol. 2008, 9, 846–859. [Google Scholar] [CrossRef] [PubMed]
- Lim, C.S.; Kim, E.S.; Kim, J.Y.; Hong, S.T.; Chun, H.J.; Kang, D.E.; Cho, B.R. Measurement of the nucleus area and nucleus/cytoplasm and mitochondria/nucleus ratios in human colon tissues by dual-colour two-photon microscopy imaging. Sci. Rep. 2015, 5, 18521. [Google Scholar] [CrossRef] [PubMed]
- Geltmeier, A.; Rinner, B.; Bade, D.; Meditz, K.; Witt, R.; Bicker, U.; Bludszuweit-Phillip, C.; Maier, P. Characterization of dynamic behaviour of MCF7 and MCF10A cells in ultrasonic field using modal and harmonic analyses. PLoS ONE 2015, 10, e0134999. [Google Scholar] [CrossRef] [PubMed]
- Ozzello, L. Ultrastructure of human mammary carcinoma cells in vivo and in vitro. J. Natl. Cancer Inst. 1972, 48, 1043–1050. [Google Scholar] [PubMed]
- Beck, W.S. A kinetic analysis of the glycolytic rate and certain glycolytic enzymes in normal and leukemic leucocytes. J. Biol. Chem. 1955, 216, 333–350. [Google Scholar] [PubMed]
- Zotin, A.A.; Zotin, A.I. Phenomenological theory of ontogenesis. Int. J. Dev. Biol. 1997, 41, 917–921. [Google Scholar] [PubMed]
- Barbera, E.; Consolo, G.; Valenti, G. Spread of infectious diseases in a hyperbolic reaction-diffusion susceptible-infected-removed model. Phys. Rev. E 2013, 88, 052719. [Google Scholar] [CrossRef] [PubMed]
- Barbera, E.; Consolo, G.; Valenti, G. A two or three compartments hyperbolic reaction-diffusion model for the aquatic food chain. Math. Biosci. Eng. 2015, 12, 451–472. [Google Scholar] [CrossRef] [PubMed]
- Lawson, R.N.; Chughtai, M.S. Breast cancer and body temperature. Can. Med. Assoc. J. 1963, 88, 68–70. [Google Scholar] [PubMed]
Figure 1.
Main pathways of glucose catabolism and metabolic effects of aerobic glycolysis or Warburg effect (WE) vs. OXPHOs.
Figure 1.
Main pathways of glucose catabolism and metabolic effects of aerobic glycolysis or Warburg effect (WE) vs. OXPHOs.

Figure 2.
RIEDP associated to internal heat flow for two different temporal windows. (a) Calculated ri Q for a normal cell for a time interval of 1000 μs; (b) As in (a), but for a time interval of 100 μs; (c) Calculated ri Q for a cancer cell for a time interval of 1000 μs; (d) As in (c), but for a time interval of 100 μs.

Figure 3.
RIEDP associated to internal diffusion flow for two different temporal windows. (a) Calculated ri D for a normal cell for a time interval of 1000 μs; (b) As in (a), but for a time interval of 100 μs; (c) Calculated ri D for a cancer cell for a time interval of 1000 μs; (d) As in (c), but for a time interval of 100 μs.
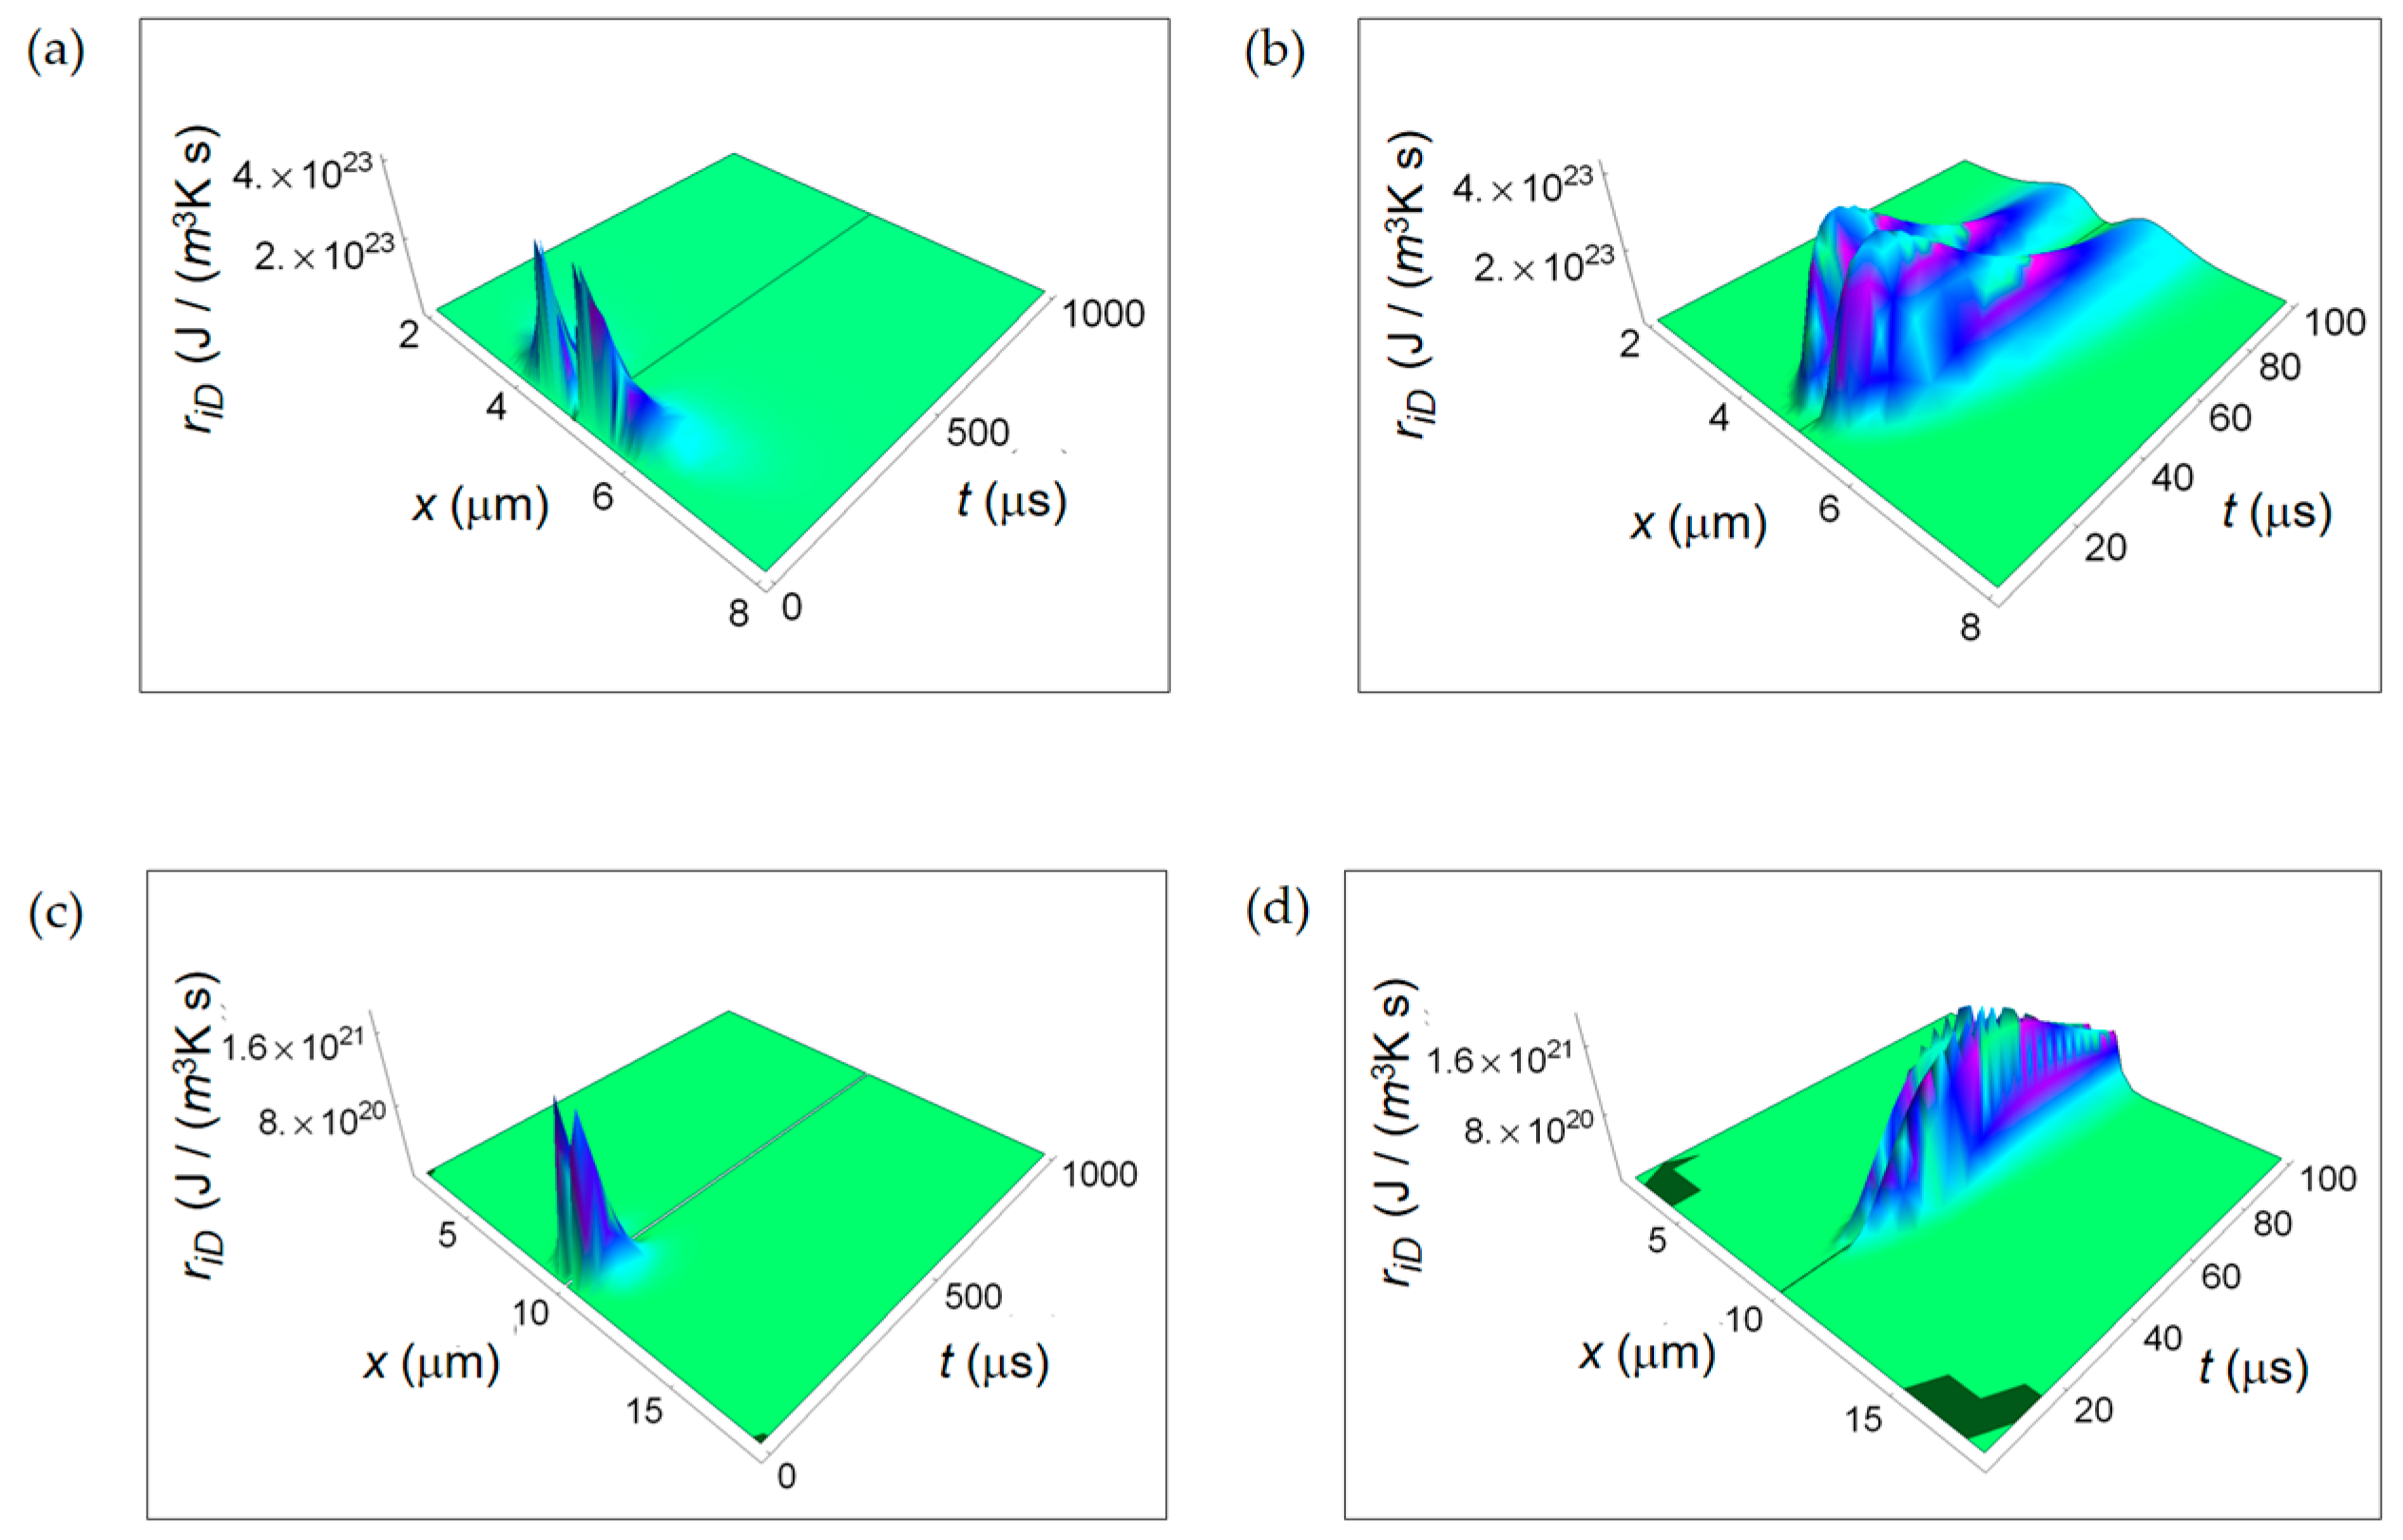
Figure 4.
RIEDP associated to irreversible chemical reactions for two different temporal windows. (a) Calculated ri r for a normal cell for a time interval of 1000 μs; (b) As in (a), but for a time interval of 100 μs; (c) Calculated ri r for a cancer cell for a time interval of 1000 μs; (d) As in (c), but for a time interval of 100 μs.
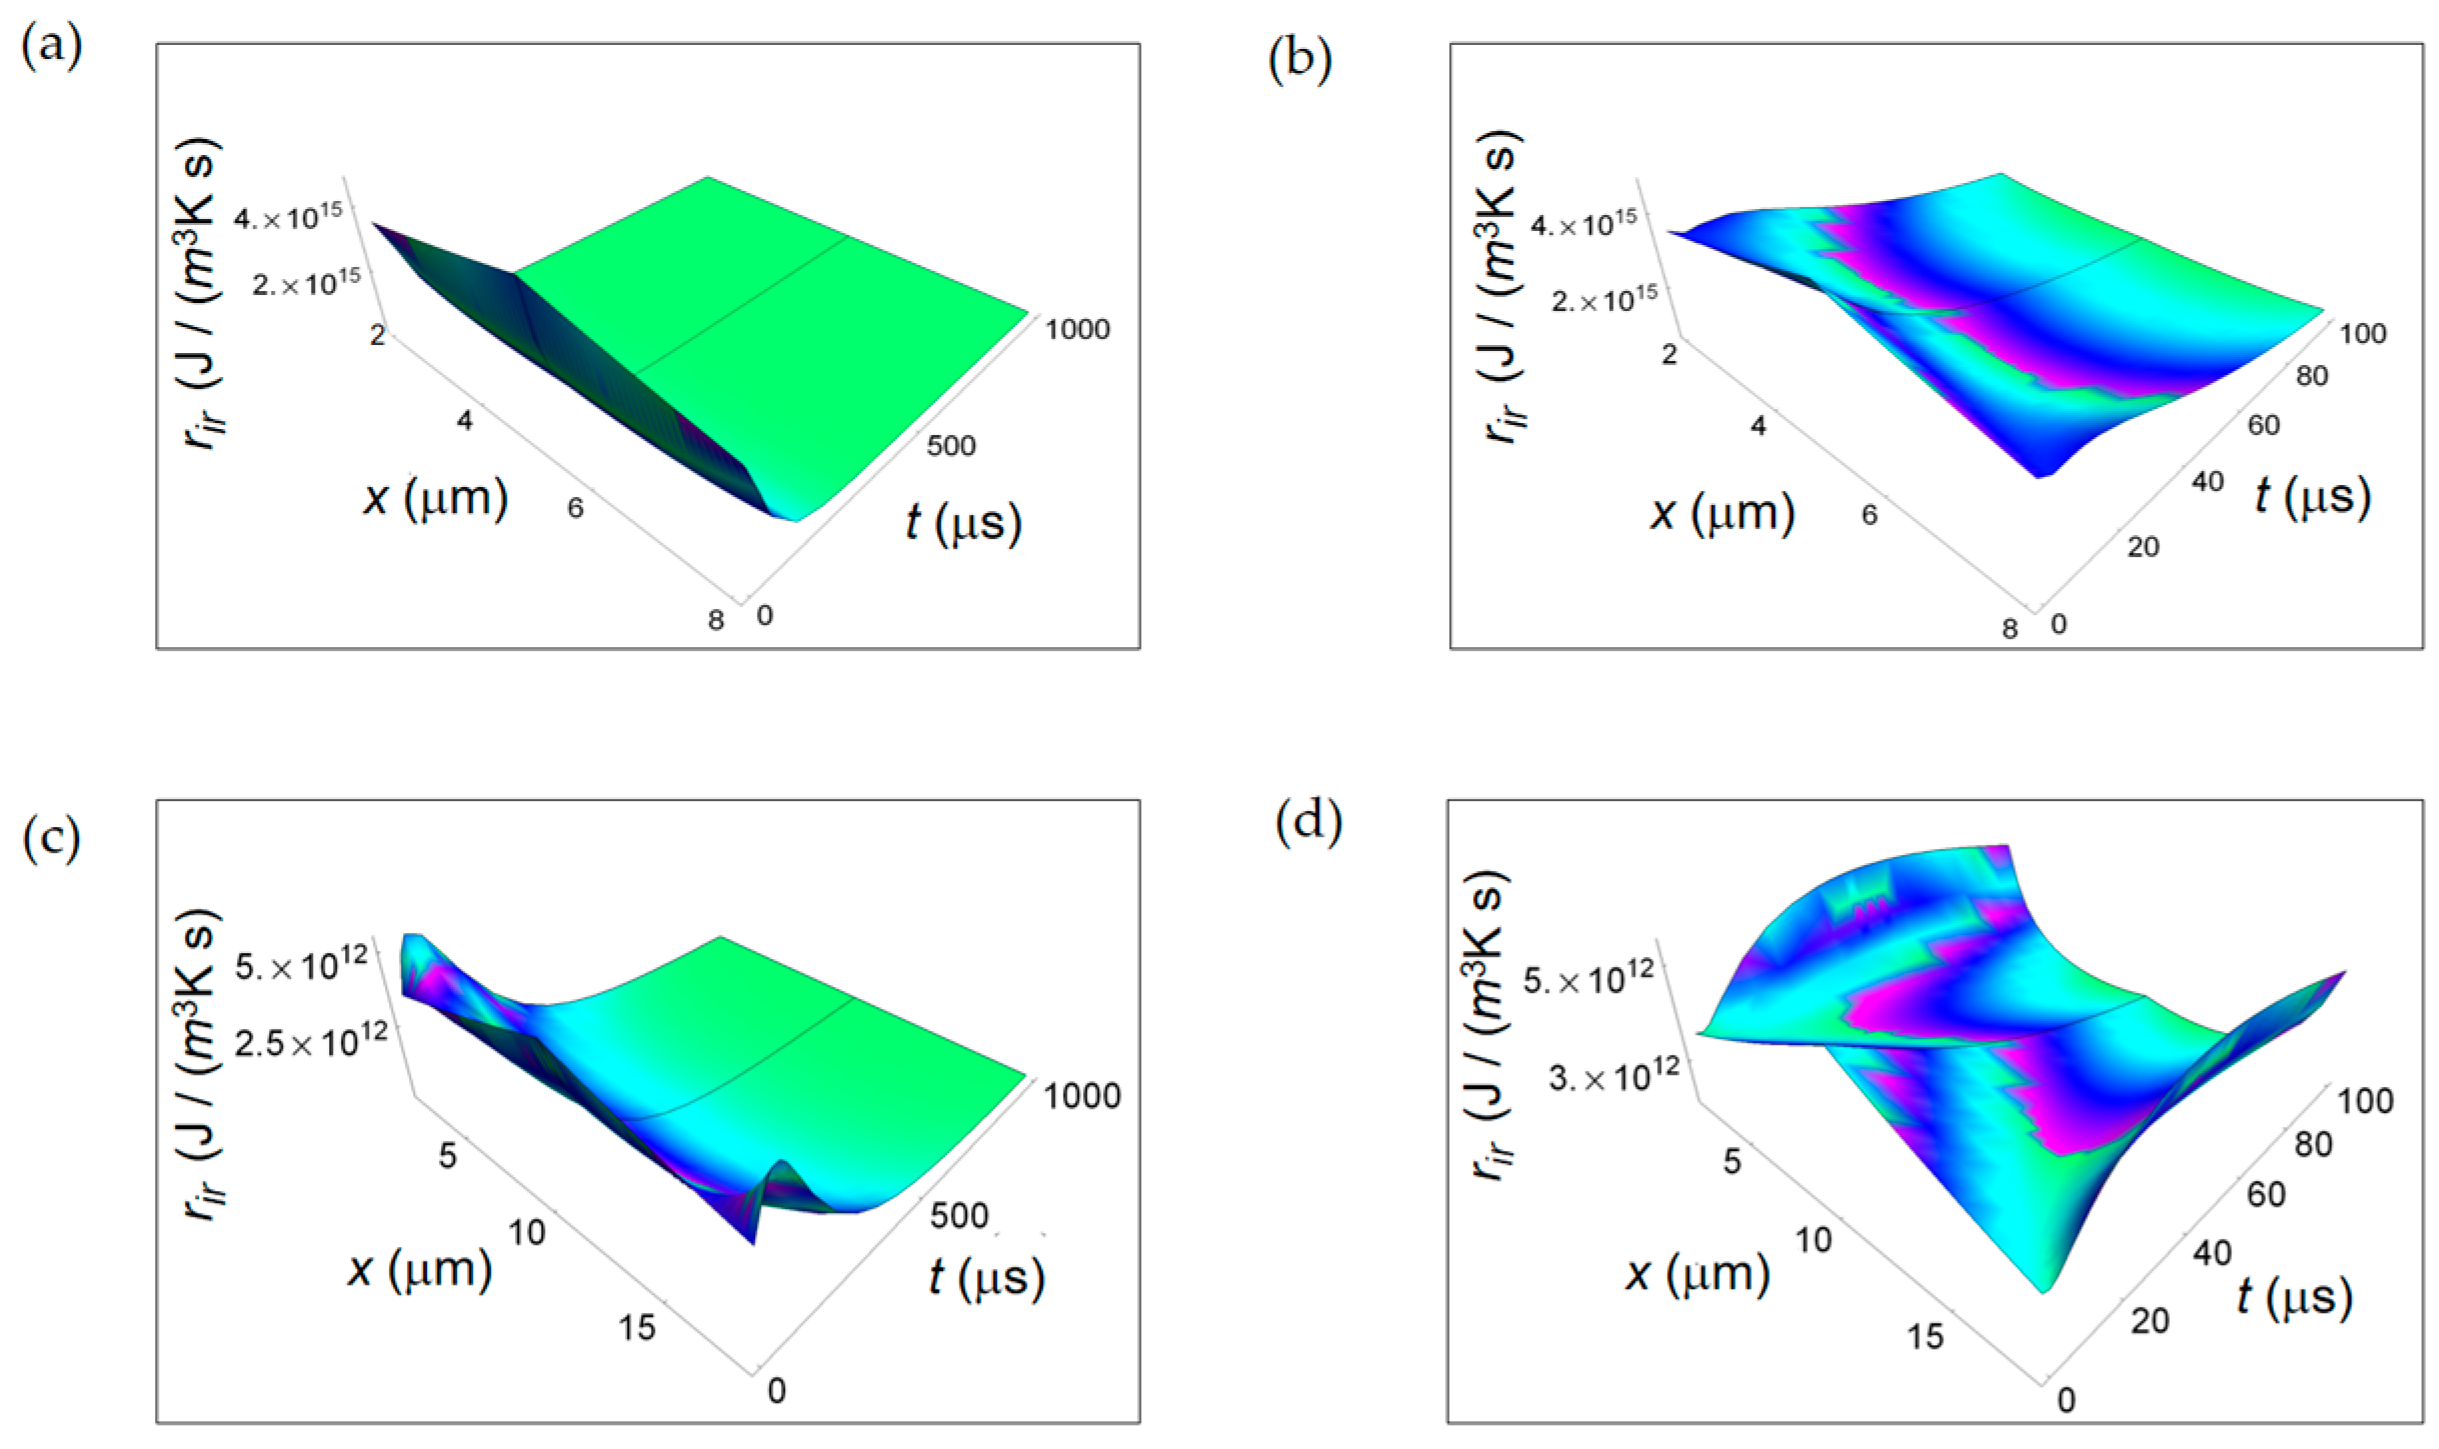
Figure 5.
REEDP associated to exchange of heat for two different temporal windows. (a) Calculated re Q for a normal cell for a time interval of 1000 μs; (b) As in (a), but for a time interval of 100 μs; (c) Calculated re Q for a cancer cell for a time interval of 1000 μs; (d) As in (c), but for a time interval of 100 μs.

Figure 6.
Calculated REEDP associated to exchange of matter between the cell and the intercellular environment for two different temporal windows. (a) REEDP for a normal cell and a temporal window of 1000 μs; (b) As in (a) but for a temporal window of 100 μs; (c) REDP for a cancer cell and a temporal window of 1000 μs; (d) As in (c) but for a temporal window of 100 μs.

Figure 7.
RIEDP associated to mass flow for respiration and lactic fermentation processes. The subscript “resp” (“ferm”) stands for respiration (fermentation). (a) RIEDP calculated according to Equation (8) and associated to diffusion flow for respiration metabolic pathway; (b) As in (a) but for lactic fermentation and computed by means of Equation (9); (c) RIEDP associated to irreversible reactions for respiration metabolic pathway resulting from Equation (10); (d) As in (c) but for lactic fermentation and obtained from Equation (11).

Figure 8.
REEDP associated to respiration and fermentation processes. (a) REEDP due to heat diffusion for a respiration process calculated according to Equation (12); (b) As in (a) but for a lactic fermentation process and computed via Equation (13); (c) REEDP due to exchange of matter with the intercellular environment for a respiration process obtained from Equation (14); (d) As in (c) but for a lactic acid fermentation process and calculated by means of Equation (15).
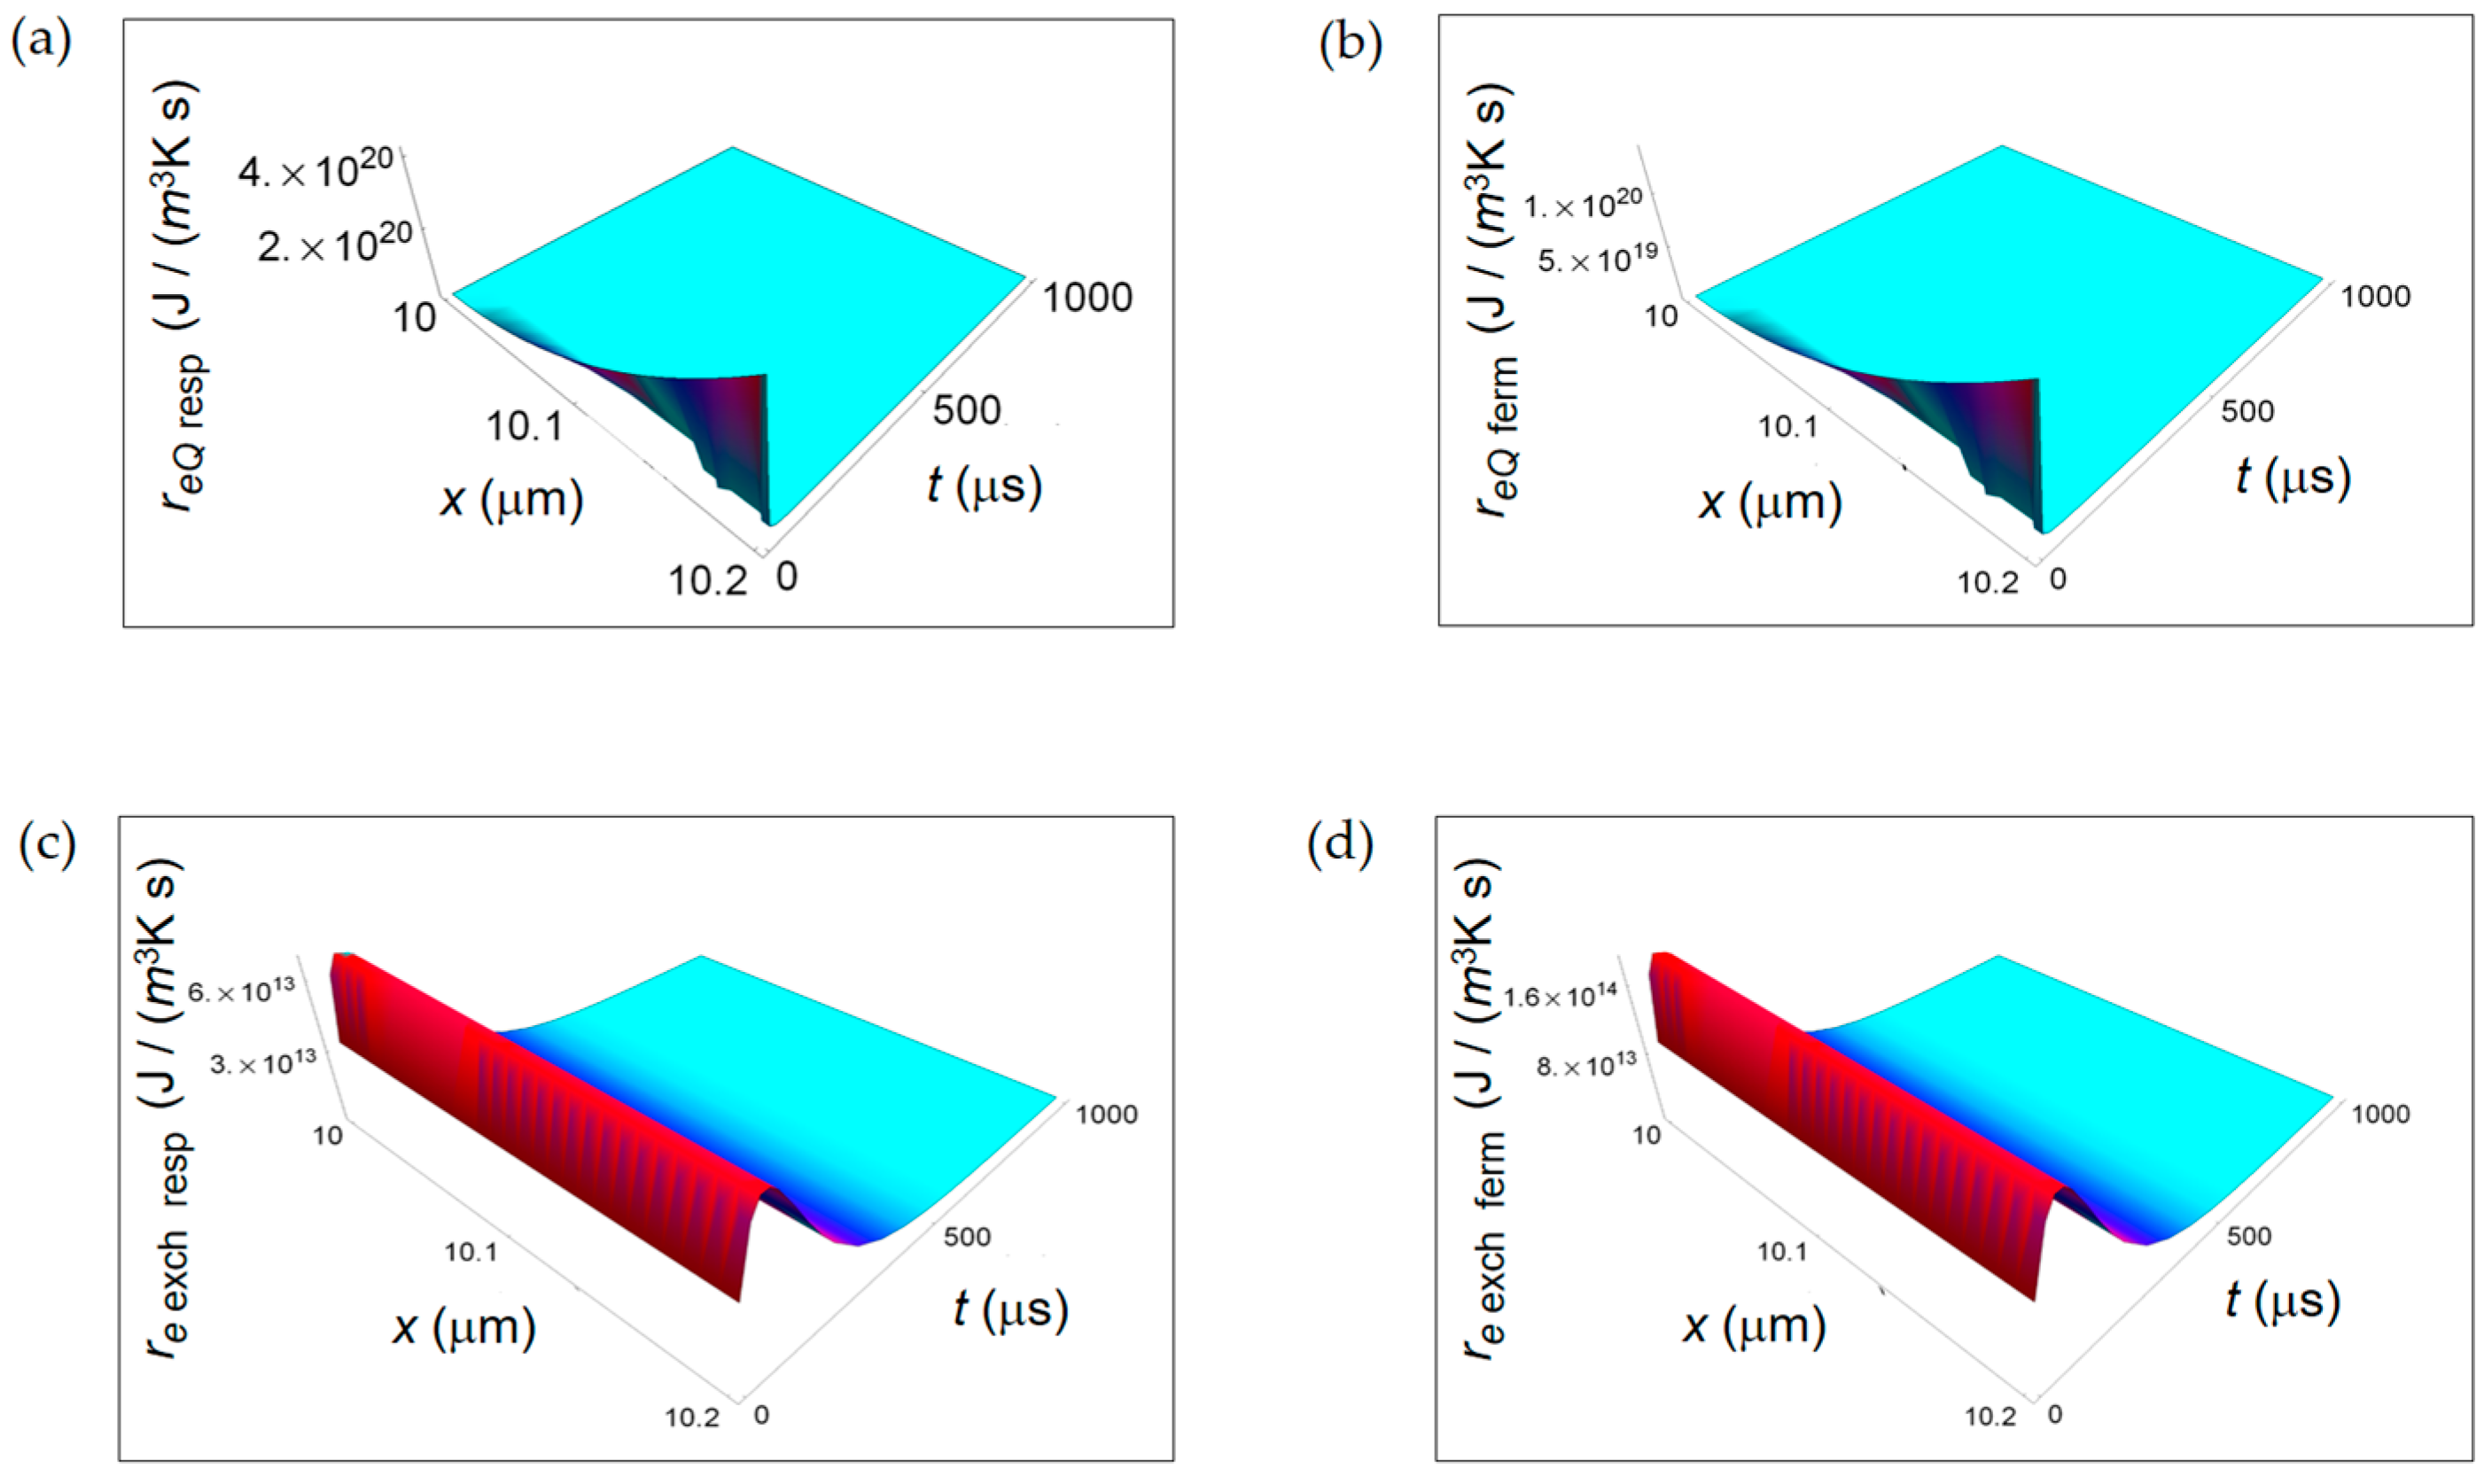
Figure 9.
Ratios between the rate of internal entropy associated to mass transport for lactic fermentation and the corresponding one associated to respiration. (a) ri D ferm/ri D resp expressed by Equation (16); (b) ri r ferm/ri r resp given in Equation (17).
Figure 9.
Ratios between the rate of internal entropy associated to mass transport for lactic fermentation and the corresponding one associated to respiration. (a) ri D ferm/ri D resp expressed by Equation (16); (b) ri r ferm/ri r resp given in Equation (17).

Figure 10.
Ratios between the rate of external entropy density associated to heat flow and to matter exchange with the intercellular environment and the corresponding one associated to respiration. (a) re Q ferm/re Q resp calculated according to Equation (18); (b) re exch ferm/re exch resp obtained by means of Equation (19).

© 2017 by the authors. Licensee MDPI, Basel, Switzerland. This article is an open access article distributed under the terms and conditions of the Creative Commons Attribution (CC BY) license (http://creativecommons.org/licenses/by/4.0/).
Share and Cite
MDPI and ACS Style
Zivieri, R.; Pacini, N. Is an Entropy-Based Approach Suitable for an Understanding of the Metabolic Pathways of Fermentation and Respiration? Entropy 2017, 19, 662. https://doi.org/10.3390/e19120662
AMA Style
Zivieri R, Pacini N. Is an Entropy-Based Approach Suitable for an Understanding of the Metabolic Pathways of Fermentation and Respiration? Entropy. 2017; 19(12):662. https://doi.org/10.3390/e19120662
Chicago/Turabian StyleZivieri, Roberto, and Nicola Pacini. 2017. "Is an Entropy-Based Approach Suitable for an Understanding of the Metabolic Pathways of Fermentation and Respiration?" Entropy 19, no. 12: 662. https://doi.org/10.3390/e19120662
Note that from the first issue of 2016, this journal uses article numbers instead of page numbers. See further details here.