Article

An Android Malicious Code Detection Method Based on Improved DCA Algorithm

1
Key Laboratory of Computer Vision and System, Ministry of Education, Tianjin University of Technology, 300384 Tianjin, China
2
Tianjin Key Laboratory of Intelligence Computing and Novel Software Technology, Ministry of Education, Tianjin University of Technology, 300384 Tianjin, China
*
Author to whom correspondence should be addressed.
Entropy 2017, 19(2), 65; https://doi.org/10.3390/e19020065
Submission received: 27 October 2016 / Revised: 29 January 2017 / Accepted: 30 January 2017 / Published: 11 February 2017

Abstract

:
Recently, Android malicious code has increased dramatically and the technology of reinforcement is increasingly powerful. Due to the development of code obfuscation and polymorphic deformation technology, the current Android malicious code static detection method whose feature selected is the semantic of application source code can not completely extract malware’s code features. The Android malware static detection methods whose features used are only obtained from the AndroidManifest.xml file are easily affected by useless permissions. Therefore, there are some limitations in current Android malware static detection methods. The current Android malware dynamic detection algorithm is mostly required to customize the system or needs system root permissions. Based on the Dendritic Cell Algorithm (DCA), this paper proposes an Android malware algorithm that has a higher detection rate, does not need to modify the system, and reduces the impact of code obfuscation to a certain degree. This algorithm is applied to an Android malware detection method based on oriented Dalvik disassembly sequence and application interface (API) calling sequence. Through the designed experiments, the effectiveness of this method is verified for the detection of Android malware.

1. Introduction

In the second quarter of 2016, from Statista’s global market share held by the leading smartphone operating systems in sales to end users from 1st quarter 2009 to 2nd quarter 2016, it can be seen that the market share of Android equipment has reached 87.8% [1]. According to a 2015 Android malicious code development report from the Wuhan Antiy Mobile Security Laboratory (AVL Team) mobile security team [2], it can be found that Android malicious code has had explosive growth since 2014. In addition, the outbreak of an Short Messaging Service (SMS) interception Trojan has resulted in a significant increase in the number of privacy theft malicious applications.
In a word, the current Android security situation is grim [3], malicious code types continue to increase, and users’ privacy and personal property are still being confronted with the threat [4]. Due to the influence of code obfuscation and polymorphic deformation technology, most of the existing detection methods can hardly extract features that have a strong classification effect from an Android installation Package. These problems lead to the fact that it is difficult for the current Android malicious code static detection algorithm to extract the code features from the Android Package (APK) file.
For these reasons, based on the Dendritic Cell Algorithm (DCA), this paper presents an Android malicious code detection method. This method is mainly divided into two parts: training and detection. For the training part, the main task is to extract features from the APK through Dalvik reduced instruction sequence (DRIS) and N-perm, and to mark the characteristics as a different level of danger by danger theory. DRIS and N-perm are introduced, respectively, in Section 3.1 and Section 3.2. After the training part, the experiment can gain a feature database which is composed of a risk feature set (RFS), a common feature set (CFS) and a safe feature set (SFS). In a feature database, each characteristic will has a danger level v d and security level v s . For the detection part, the main task is to classify suspicious APK by using an improved DCA and feature database. The feature extraction of the detection section is the same as the training section.
In the experiment, all malware are obtained from AndroMalShare and VirusShare projects. In the malware data set, 15 kinds of major malicious code family are selected as specimens, such as FakeInst, Fakesysui, Jxt, ADRD, and Geinimi. Ultimately, the experiment has a high detection precision rate (97.4%) in the best cases and a low false positive rate (2%) in the worst cases.
The remainder of this paper is organized as follows: in Section 2, the related work of this paper is introduced, which includes the analysis of the characteristics of the existing research work. Section 3 briefly introduces the related technology of this paper. Section 4 and Section 5, respectively, introduce the algorithm implementation and the design of experiments, and Section 6 presents conclusions.

2. Related Works

With the rapid popularization of Android, the Android system security has become an important research direction around the world.
Shabtai and Qing Sihan [5,6] have carried on the analysis of the Android system structure and security mechanism. Enck, Ongtang, Nauman and others [7,8,9] put forward an optimizing of an Android authorization mechanism. Wognsen et al. [10] have conducted in-depth research and analysis on the Dalvik byte code. Sarma, Sato, Wu and Weichselbaum [11,12,13,14], respectively, focus on the AndroidManifest file for Android malicious code static detection. Grace et al. [15] developed an automated system called RiskRanker to scalably analyze whether a particular Android application exhibits dangerous behavior. These pieces of research have laid a solid foundation for the study of Android malicious code detection.
In 2014, Li et al. [16] presented a static detection scheme for Android malicious code detection. Li’s method proposed a way to extract the features using a streamlined Dalvik assembly sequence, and retained the structure of the application source code. However, Li used singularly original Dalvik assembly sequence characteristics, did not make further processing, and the classification used only the text edit distance metric. Therefore, Li’s method is still uneffective in the treatment of polymorphic malicious code and new malware variants. At the same time, Suarez-Tangil [17] put forward a detection system about the code structure of an Android malicious code family whose analysis and classification method are based on text mining. Guillermo uses hierarchical clustering to classify feature vectors which are obtained from a Dalvik reduced instruction sequence (DRIS), and uses phylogenetic trees to study the evolution of the malicious code family. Compared with Li [16], the system proposed by Guillermo has more complete abstraction of the malicious application code structure, can identify existing malicious code family quickly, but is not able to achieve the same classification results for polymorphic malicious code. Kong Deguang, Abdurrahman et al. [18,19], in the research of malicious code on the X86 platform, are, respectively, using the N-perm algorithm and N-gram algorithm to extract the statistical features of malicious code assembly sequences. Kong’s research proves that the N-perm algorithm can extract the statistical features of the code sequence. Seung-Hyun [4] studies the Android code application interface (API) and selects 17 kinds of dangerous API calls. Deniel [20] et al. use the dendritic cell algorithm (DCA) with principal component analysis (PCA) to classify each of the Android applications as a benign application or as malware. However, there are still some shortcomings because of running in the sandbox, such as poor real-time, low detection efficiency.
Based on the dendritic cell algorithm, this paper proposes a new Android malicious code detection method. Compared to other Android malicious code detection algorithms, this algorithm has a faster detection speed under the premise of guaranteeing the detection accuracy, and is suitable for Android malicious code lightweight detection. In addition, the APK code feature extraction method of this algorithm can reduce the effect of code obfuscation to a certain degree.

3. Problem Statement and Preliminaries

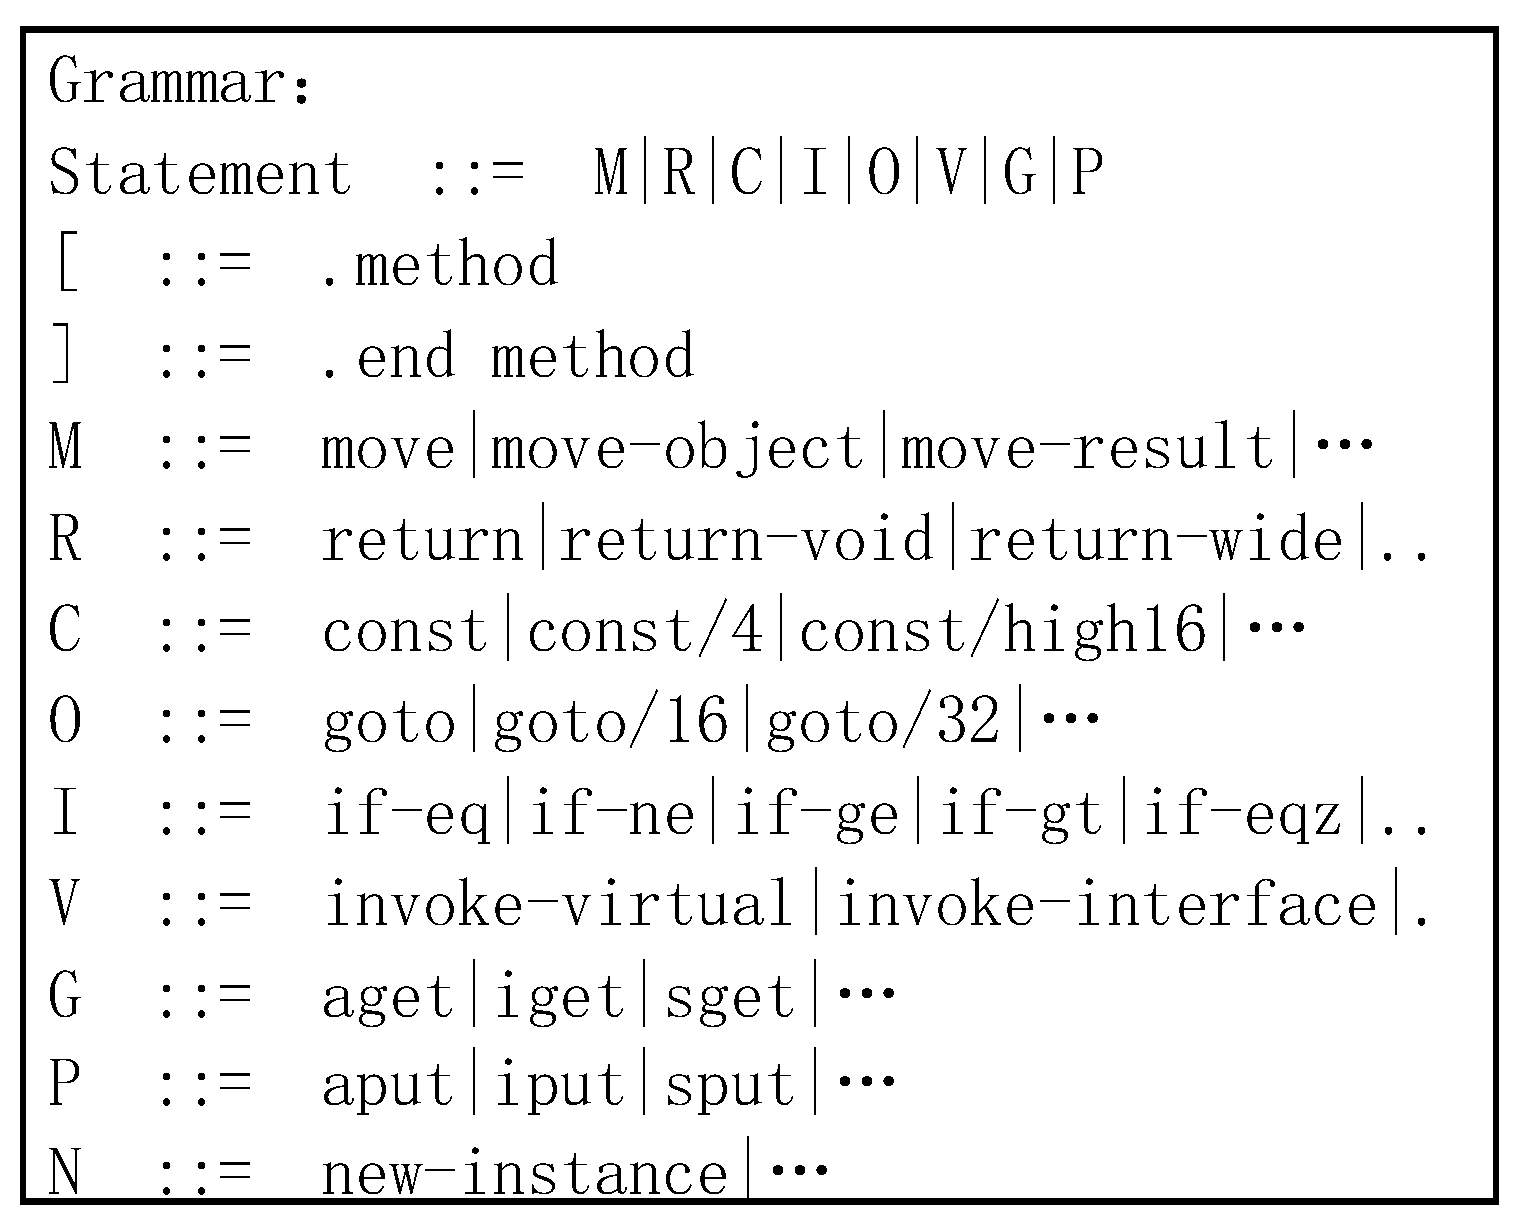
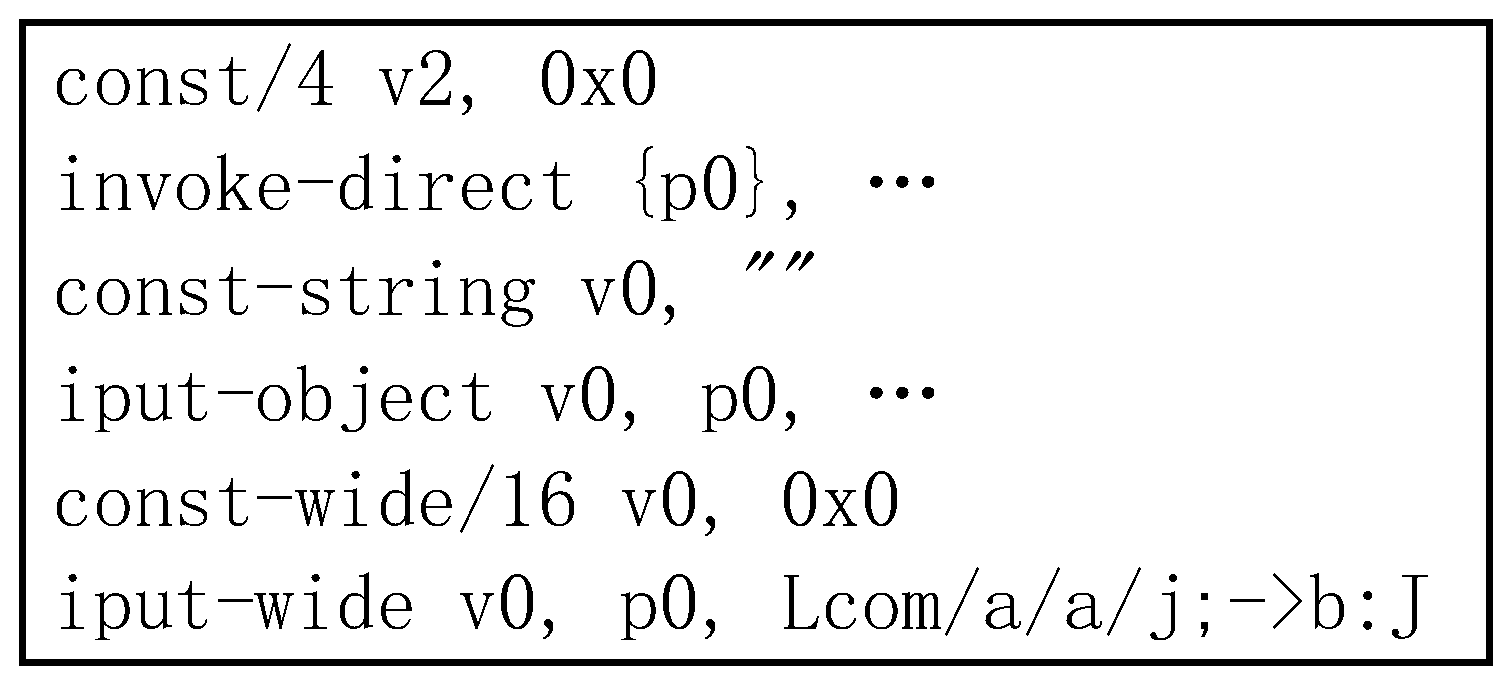
3.1. Dalvik Reduced Instruction Set

Dalvik Reduced Instruction Set (DRIS) is based on a grammar proposed by literature [21] and shown in Figure 1. DRIS refers to the processing of a Dalvik assembly sequence, which reflects the program semantic instruction program, such as goto, if, move, invoke and so on. DRIS removed independent instructions and interference, such as jump destination address and register parameters. Finally, the single letter is used to substitute the extracted instruction and to obtain sequences. This sequence can represent the semantics of code. The use of DRIS will be introduced in Section 4.

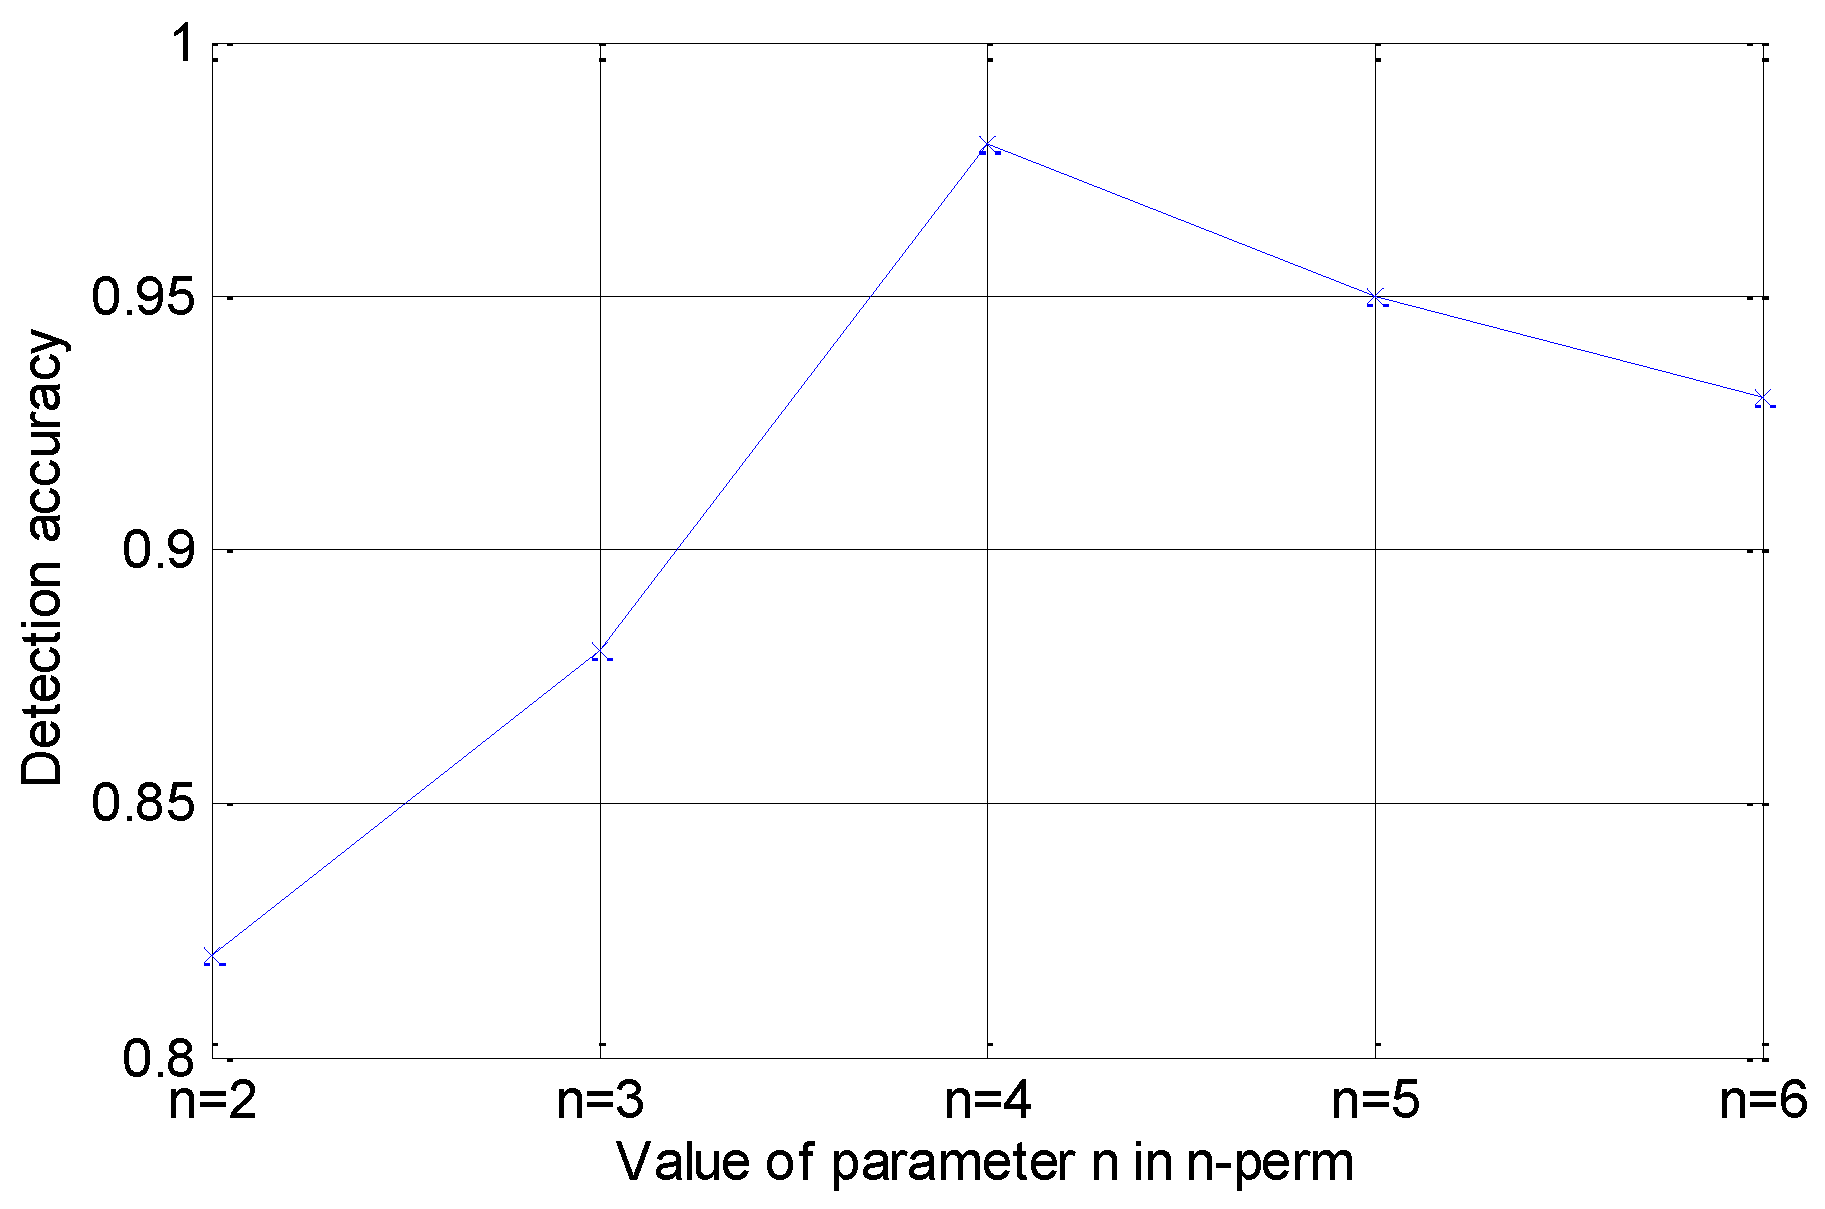
3.2. N-Perm Algorithm

Previously, the N-gram algorithm is used for text classification and information retrieval technology [22], whose core idea is to calculate the frequency of continuous N words. The N-perm algorithm is the deformation of the N-gram algorithm [18], and the difference between two algorithms being N-perm ignored the sequence when computing the frequency of continuous N words, which can reduce the influence of polymorphism in the experiment. As shown in Figure 2, in the extraction of the specified operation code from the Dalvik bytecode, the experiment counts the frequency of operation code (Opcode) combination, and uses the two-tuple (Opcode combination, frequency) as the feature vector. Assuming that the Opcode sequence is CVCPCP. After using the 1-perm algorithm, the two-tuple ({C, V, P}, {3,1,2}) can be obtained. Using the 2-perm algorithm, the two- tuple ({CV, VC, CP, PC}, {1,1,2,1}) can be obtained. Using the 3-perm algorithm, the two tuple ({CVC, VCP, CPC, PCP}, {1,1,1,1}) can be obtained. By analogy, when n = 4, 5, 6, they have the same algorithm.

3.3. DCA Algorithm

Danger theory is a controversial and famous immune theory, proposed by immunologist Matzinger [23] in 1994, which has challenged the traditional Self-NonSelf (SNS) theory. Based on danger theory, Greensmith et al. [24], in the study of natural dendritic cells (DC), proposed the dendritic cell algorithm (DCA). There are four kinds of signals that can be transmitted: pathogen-associated molecular patterns (PAMP), safe, danger and inflammatory. A PAMP signal is transmitted if any bacteria exist. A safe signal is transmitted if a cell dies from aging. A danger signal is transmitted if a cell is damaged and dies. An inflammatory signal is transmitted if there is any inflammation in the body.
DCA is a population-based algorithm. The population in a DCA is filled with Dendritic Cells (DCs). Dendritic Cells (DC) are a kind of special antigen presenting cell that is sensitive to the change of environment. The main functions of a DC are processing signals and representing antigens. DC is divided into three states: immature DC (iDC), semi mature DC (smDC), and mature DC (mDC). When the Costimulatory Molecules (CSM) signal concentration reaches the threshold, the iDC will be changed to smDC or mDC, which is determined by the concentration of semi-mature output signal and mature output signal. The transformation relations of DC’s three states are shown in Figure 3.
Compared with other algorithms, the DCA algorithm has a faster detection speed and does not reduce the detection accuracy. These features make the DCA suitable for Android malicious code lightweight detection.

3.4. Code Obfuscation

To protect their applications, Android application developers use code obfuscation technology to counter the reverse analysis. Android platform code obfuscation mainly uses ProGuard tools for completion. Android application code obfuscation replaces the source code’s variable name, function name, class name and package name with meaningless characters [25], which prevents the analyst from performing a reverse analysis of the code logic. Code obfuscation gives greater resistance to static analysis of Android malicious code [26]. However, in the Android application source code, to ensure the correct execution of the code, there are some code segments that can not be confused such as Android system components, native method, the method which needs to use Android serialization, enum, API, the content that resources file reference, the place where the reflection method is used, and the reference to a third-party library. In addition, code obfuscation does not cause large changes to the application code structure [27], so the statistical characteristics of the application code will not be greatly affected.

4. Design of Detection Method Based on Improved DCA Algorithm

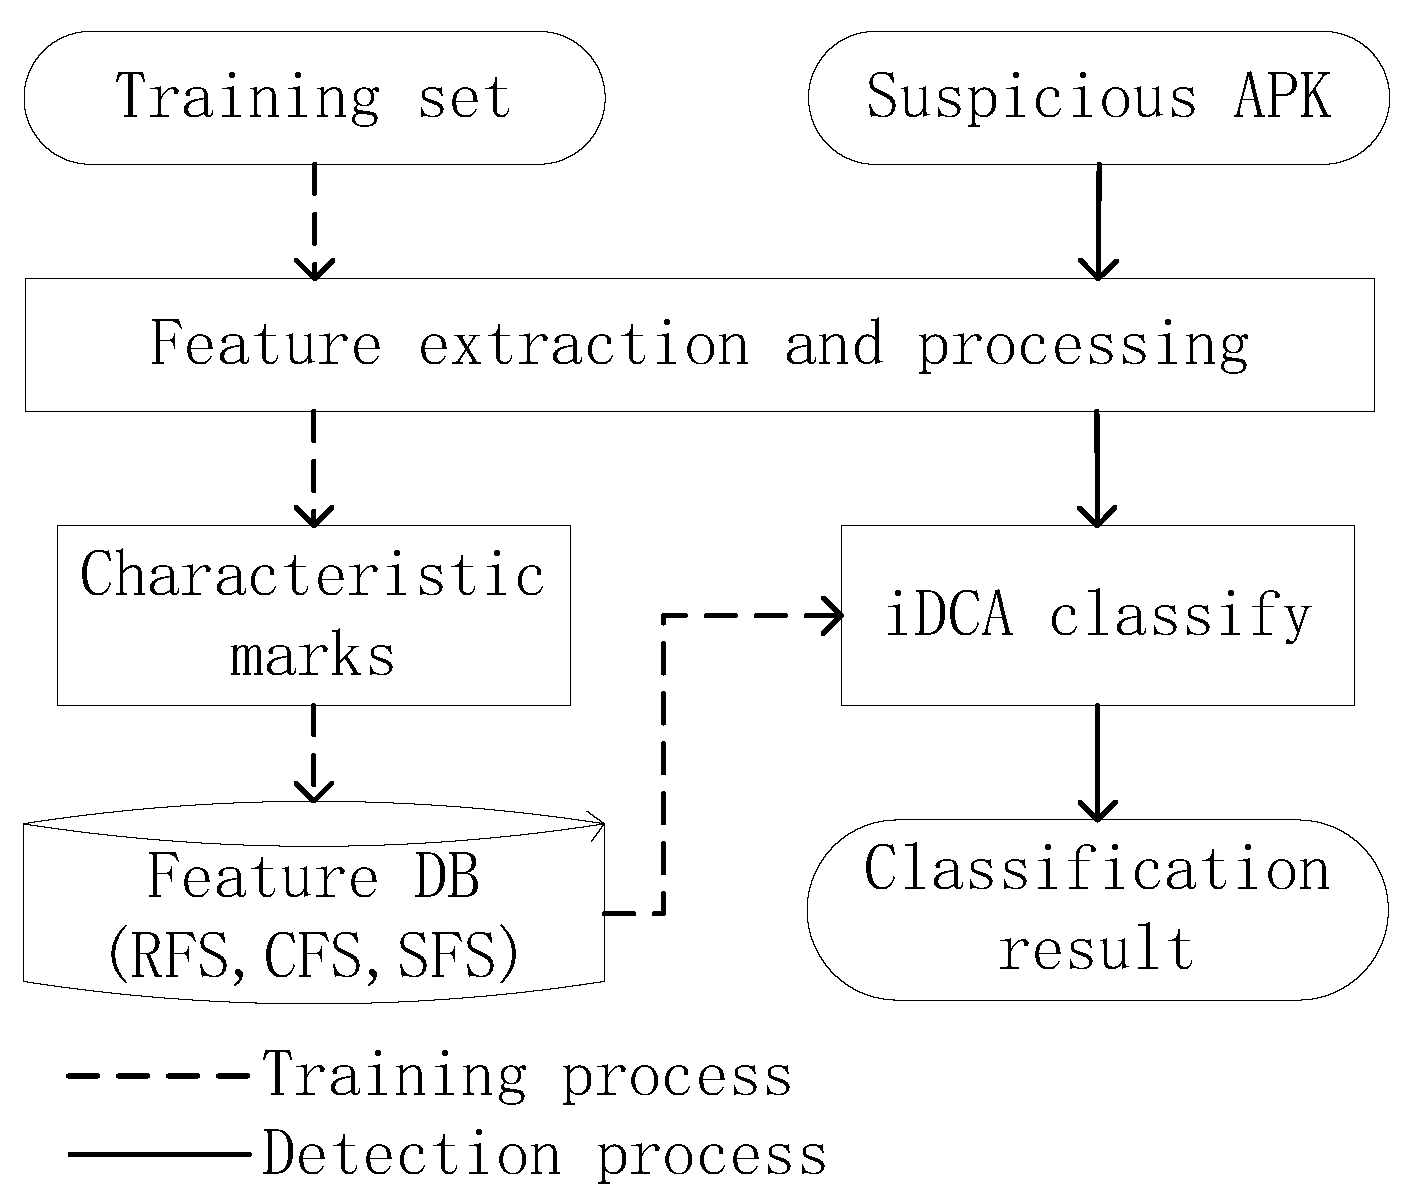
4.1. System Overview
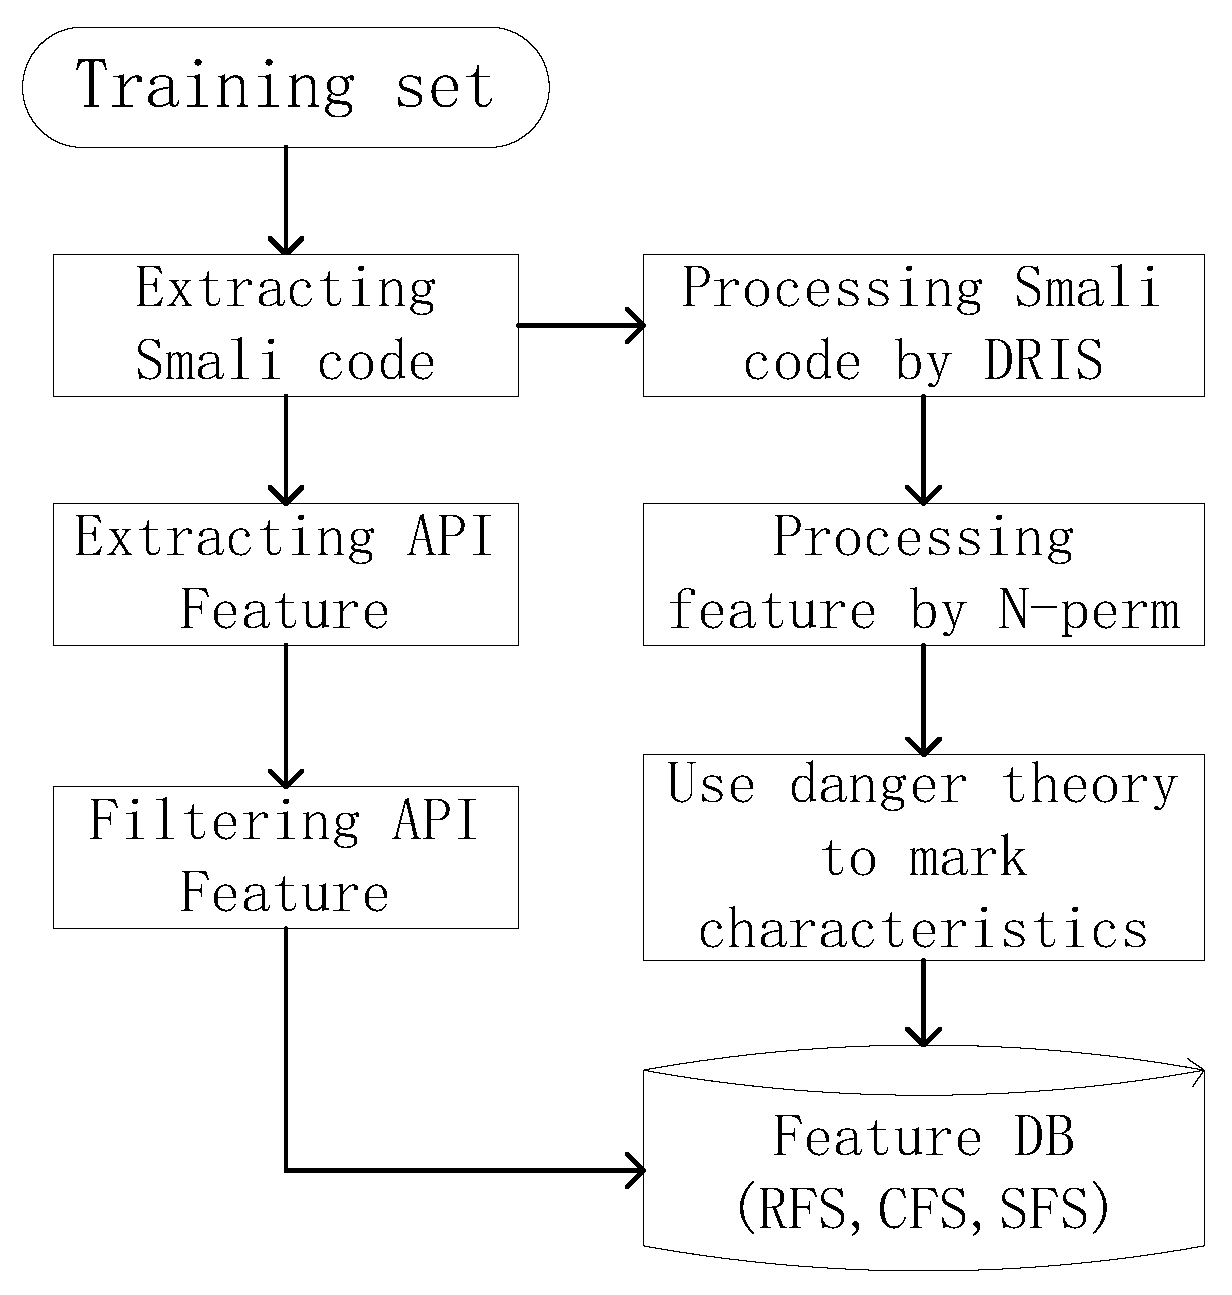
Based on the Dendritic Cell Algorithm, this paper proposes an Android malicious code detection method, and the detection process is shown in Figure 4. The method that this paper proposed mainly consists of two parts, training and detection. The symbols that appear in this section are shown in Table 1.
In the training part, the experiment has extracted Dalvik code features by DRIS and N-perm from training set APKs. Then, the experiment uses danger theoryto mark Dalvik code features as risk features (RFs), common features (CFs) and safe features (SFs). Finally, RFs, CFs and SFs are stored in risk feature sets (RFS), common feature sets (CFS) and safe feature sets (SFS), respectively.
In the detection part, the experiment uses improved DCA to classify the detected APK after feature extraction and processing.

4.2. Training Part

The training part of this experiment mainly consists of two parts: input data processing and mark characteristics. The training flow is shown in Figure 5.

4.2.1. Input Data Processing Method

Algorithm input includes DRIS and Android static code APIs.
The processes of obtaining DRIS are as follows. First of all, for the batch of APK files, the experiment uses ApkTool to decompile it to extract the .smali files. The .smali file is the Android application source code file which analyzes from the classes.dex file. Classes.dex file is a part of the Android package (APK) file, including the source code of the logic realization of the Android application. Smali source code and Dalvik code are based on a similar grammar rules, so the DRIS can be used to deal with the .smali file. Then, the method content has extracted from the .samli file and replaced by reduced instruction set to get the reduced instruction set sequence. Next, the 4-perm algorithm is used to simplify the instruction set sequence, and to get a set of two-tuples that is organized by method. At last, the two-dimensional array is used to store all two-tuples.
Android static code APIs are also obtained from the smali file, in which dangerous API list references from the Seo’s paper [4].
API feature extraction uses two-tuple (API list, frequency) to complete statistics. Finally, the API feature Two-Tuple will attach to the tail of Dalvik sequence features two-dimensional array.
In the N-perm algorithm, selecting a suitable N is essential. The smaller the N value, the less sufficient the extracted characteristic information. The bigger the N value, the less representative the extracted features. In this paper, the N value is set as 4. The experiments of different N value selections are shown in Figure 6.

4.2.2. Mark Characteristic

The 4-perm algorithm will produce more features, so the information gain value is used to measure the classification performance of feature and screen features [28]. Random variable Y represents the classification results, and random variable X i represents features i corresponding random variable. Information gain of features i is determined by the formula (1):
I ( Y ; X i ) = H ( Y ) H ( Y | X i ) .
In formula (1), H ( Y ) is the entropy of the random variable Y, and H ( Y | X i ) is the conditional entropy of random variable Y that is under the premise of random variables X i . The information gain value can be used to measure the difference of information entropy before and after the occurrence of the feature [29], which is applied with multiple domains, such as the intrusion detection system [30]. The more the entropy gain, the better the classification of corresponding features.
For each APK used for training, 400 features that have the largest information gain value have been selected, and combined with 17 suspicious APIs, the characteristic set S is composed. In DCA, the algorithm’s input is antigen and signal. The antigen and signal are the Android malicious code sample and the set S after the information fusion, respectively.
Let U represent a set of programs with known classification, u U , and u j is a feature set of the method j in u, where u j = < x 1 , x 2 , x 3 , . . . , x n , y > , ( j = 1 , 2 , . . . , m ) , x i , y { 0 , 1 , 2 , . . . } , ( i = 1 , 2 , . . . , n ) . The x i = 0 indicates the feature x i not appearing in u j . On the contrary, the feature x i has appeared in u j when x i is equal to 1. The y = 0 indicates that u is a normal sample. Contrarily, it is a malicious sample. Set M represents the set of malicious code, and set N represents the set of normal code. The provisions of the set M and set N are as follows:
Definition 1.
U = M N .
Definition 2.
M = { m | m U y = 1 } .
Definition 3.
N = { n | n U y = 0 } .
Set V represents an unknown malicious code set. For v V , v j is the set of features in method j, where v j = < x 1 , x 2 , x 3 , . . . , x n , y > , y = 2 represents that v is unclassified.
In the algorithm, set V is the antigen, and the features x 1 , x 2 , x 3 , . . . , x n will be integrated into the danger signal (DS) and security signal (SS). The specific steps are as follows.
(1) S is the set of features, which is composed of 1233 features extracted from DRIS and 17 features extracted from suspicious APIs. The feature set S is divided into three sub sets—Risk Feature Set ( R F S ), Security Feature Set ( S F S ), and Common Feature Set ( C F S )—which are defined as follows. R F S , defined by Definition 4, includes features that only appear in malicious applications. S F S defined by Definition 5 includes features that only appear in normal applications. C F S defined by Definition 6 includes features that appear in both malicious applications and normal applications:
Definition 4.
R F S = { x i | u U ( x i 0 ( u M u N ) ) } .
Definition 5.
S F S = { x i | u U ( x i 0 ( u N u M ) ) } .
Definition 6.
C F S = { x i | u U ( x i 0 ( u N u M ) ) } .
(2) Denote n m i as the number of elements for which x i 0 and x i M . Denote n b i as the number of elements for which x i 0 and x i N . The weight of each signal component which forms by features are calculated by the following formula:
(a) When x i R F S ,
w d i = | S | | R F S | × I ( Y ; X i ) a n d w s i = 0 .
(b) When x i S F S ,
w s i = | S | | S F S | × I ( Y ; X i ) a n d w d i = 0 .
(c) When x i C F S ,
w d i = | S | | R F S | × I ( Y ; X i ) × n m i n b i + n m i ,
w d i = | S | | S F S | × I ( Y ; X i ) × n b i n b i + n m i .
In the above formula, w d i represents the risk weight, and w s i represents the security weight.
(3) Finally, calculate the danger signal v d j and security signal v s j , where j = 1 , 2 , . . . , m , and m is the total number of method which belongs to u. Let z i be the value of x i . The calculation formulas are as follows:
v d j = i = 1 n w d i × z i ,
v s j = i = 1 n w s i × z i .

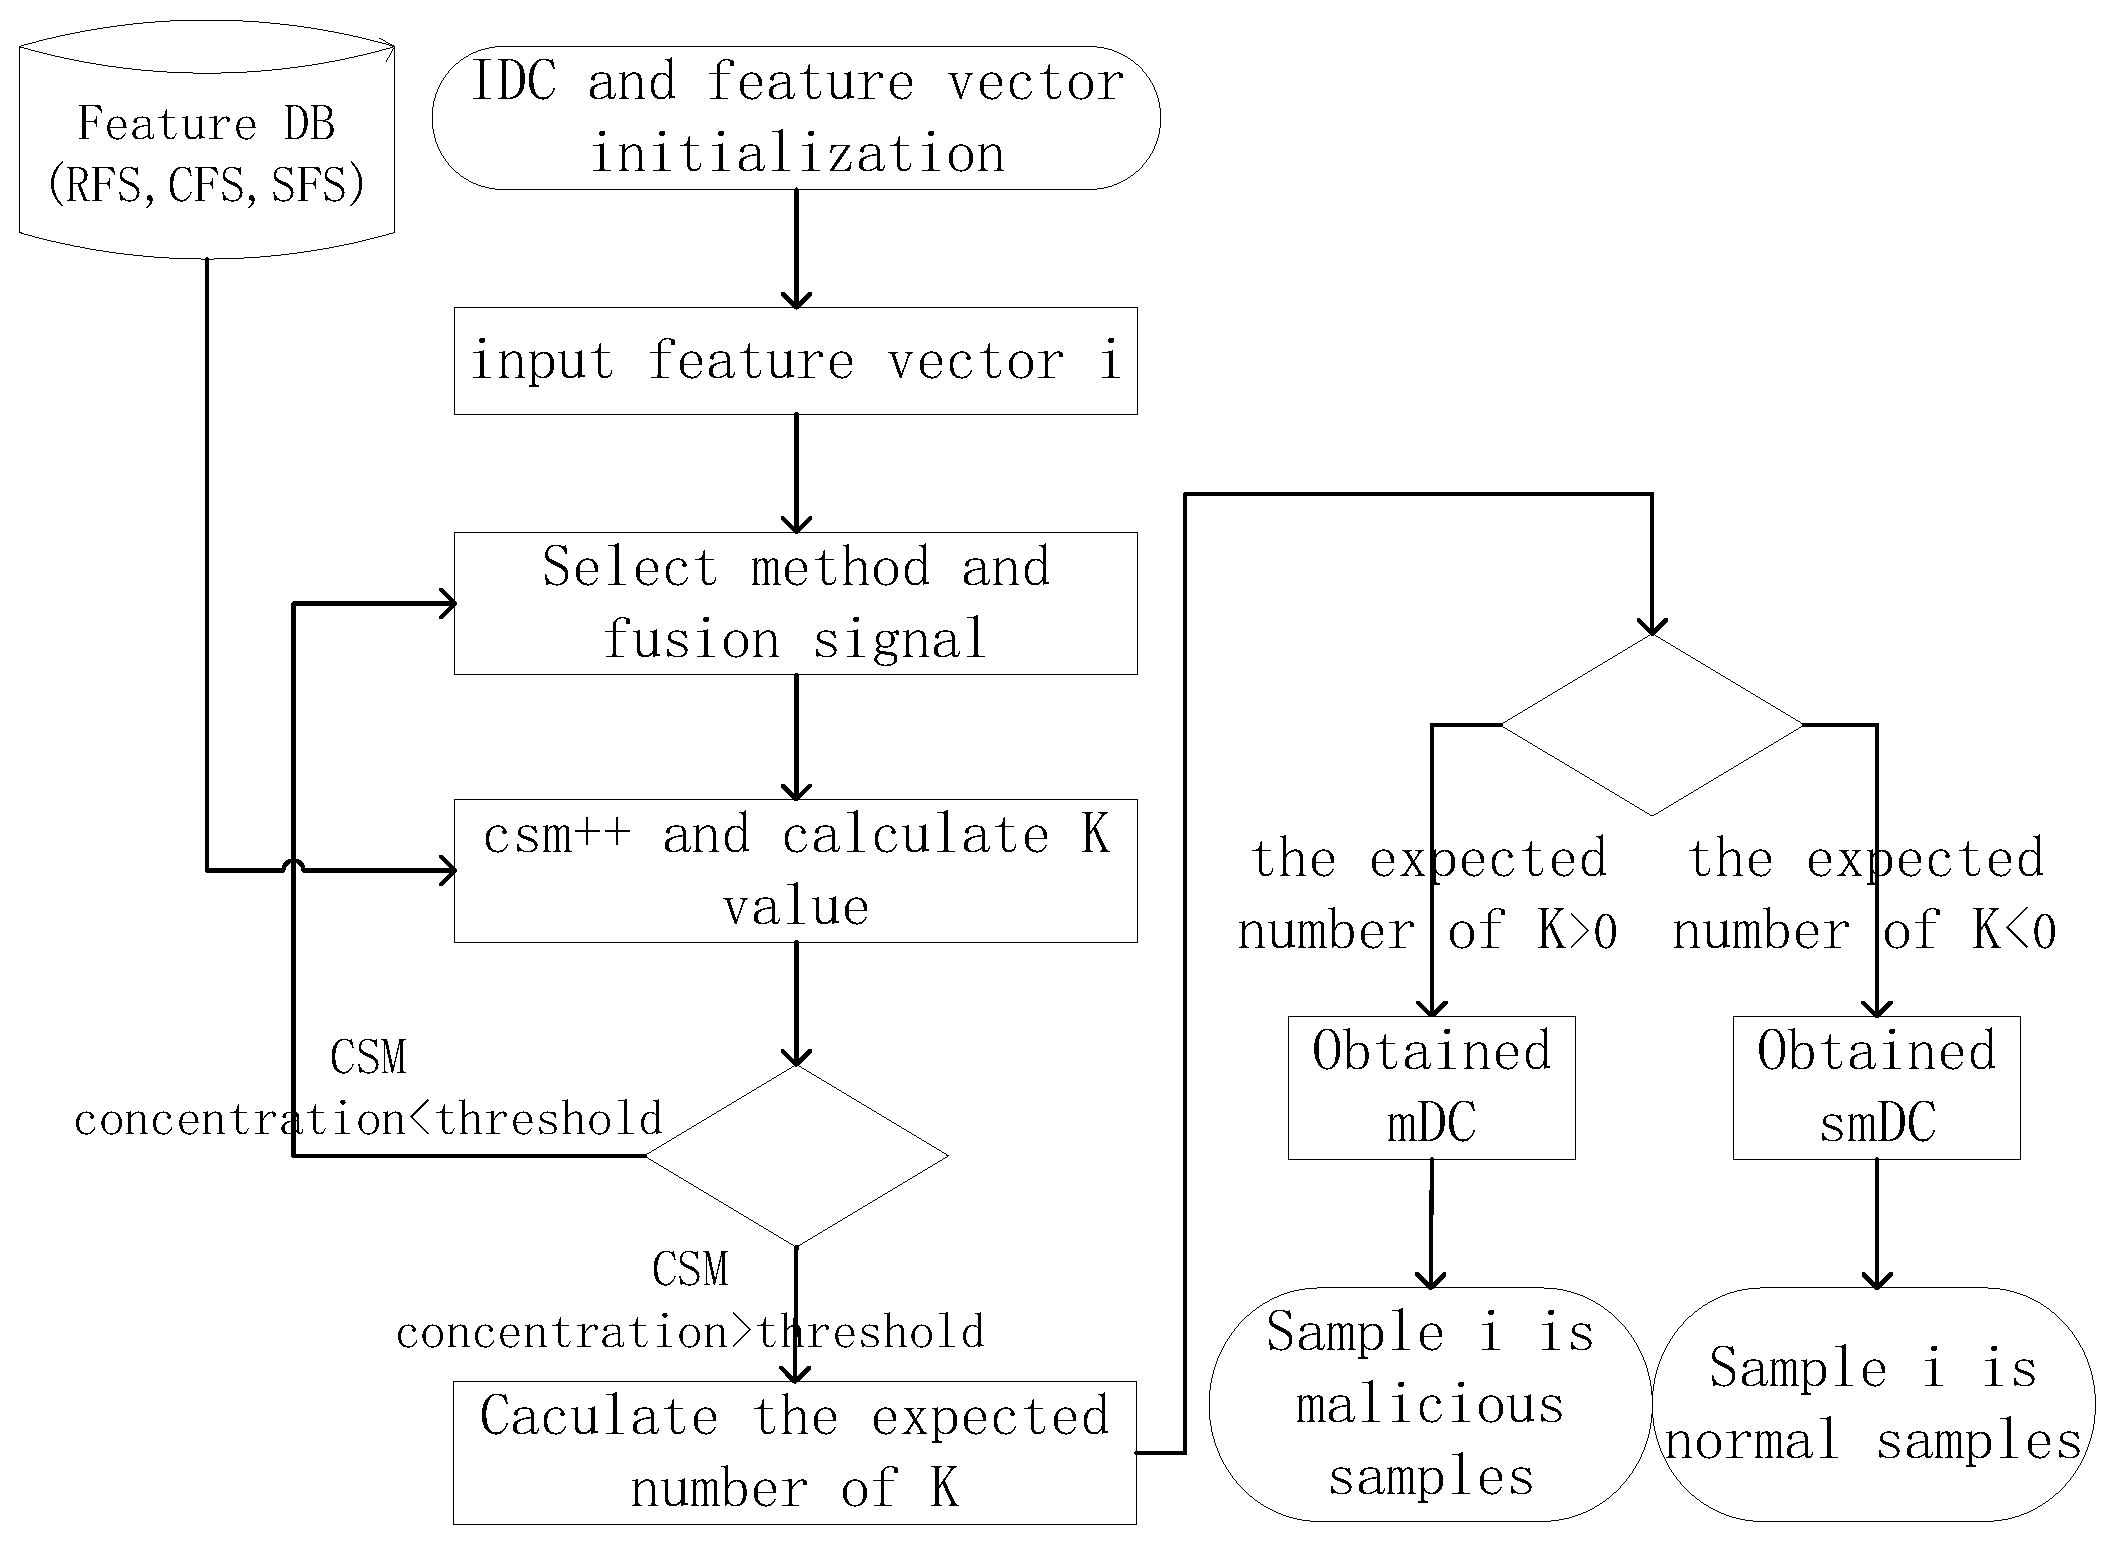
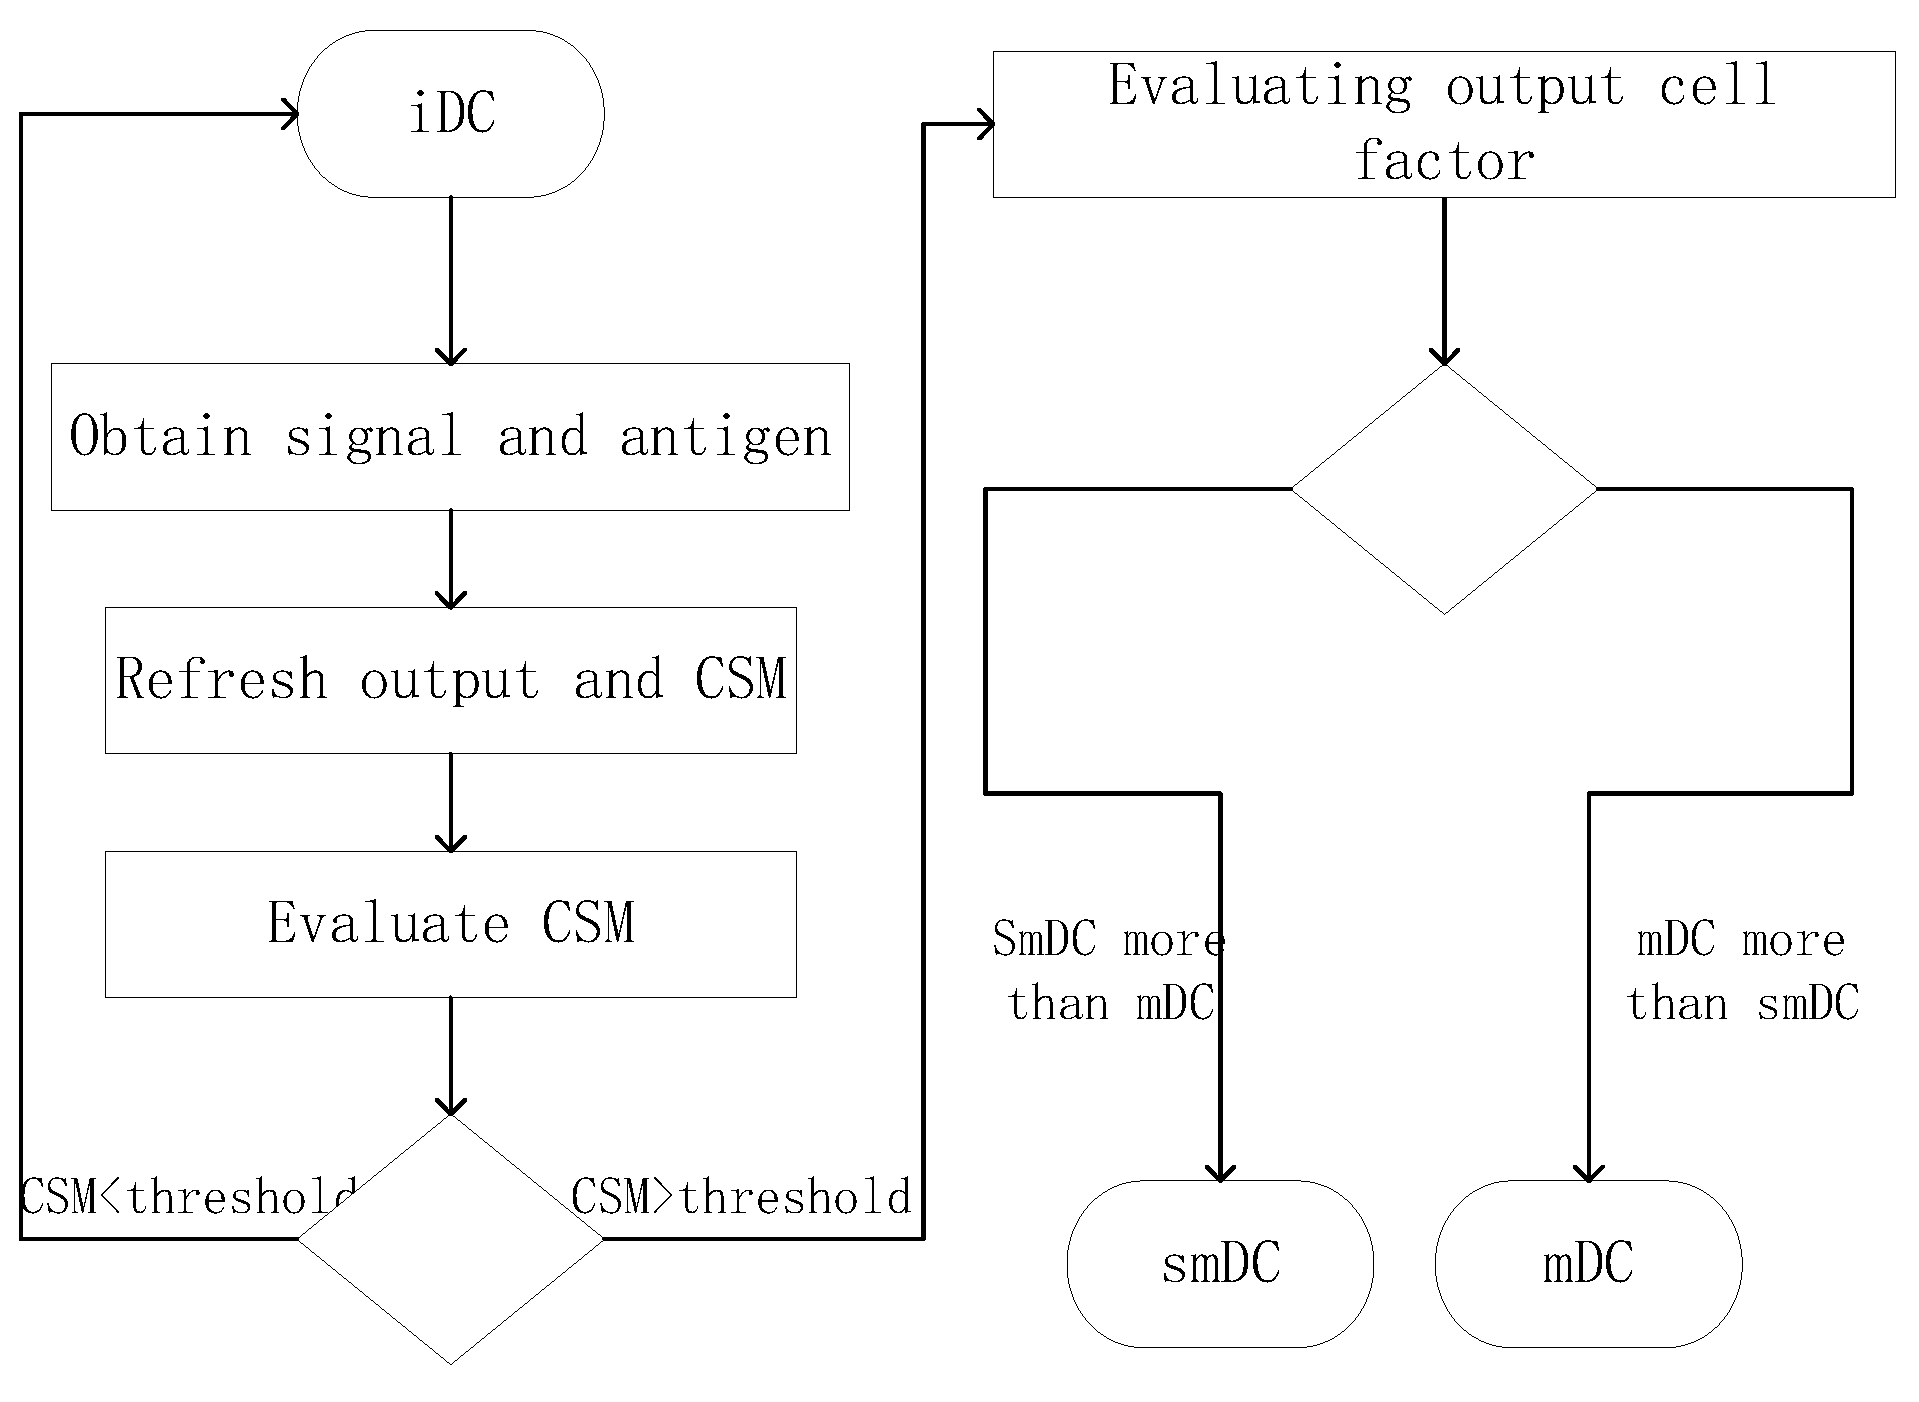
4.3. The Improved Dendritic Cell Algorithm

The process of iDCA is simply described as follows. Firstly, the experiment extracts DRIS and suspicious APIs from the APK file, and generates the feature vector by feature fusion. An application corresponds to a feature vector. Then, the experiment initializes the iDC with the i-th feature vector, calculates the CSM concentration in a DC environment and the k value of each method in the i-th feature vector. If the CSM concentration is higher than the threshold value, then calculate the expected of k marked k ¯ . If k ¯ is larger than zero, the iDC state would migrate to mDC. If k ¯ is smaller than zero, the iDC state would migrate to smDC. Through the final state of DC, it can be judged whether the feature vector belongs to malware or not. The iDCA detection flow is shown in Figure 7.
Because of a large number of uncertain parameters, traditional Dendritic Cell Algorithm (DCA) has excessive uncertainty and a lack of a formal definition [31], which could lead to ambiguity in understanding and using the algorithm. Based on literature [31], the experiment attempts to streamline and optimize the traditional dendritic cell algorithm, which is suitable for use in Android malware detection. This method is referred to as iDCA.
By streamlining, the algorithm input signal is reduced to danger signal v d j and security signal v s j . The concentration threshold of CSM is the number of methods. The life cycle of DCs is uniformly distributed, and each DC is used alone for a single sample processing. The input of DC is two kinds of signals and antigens, the output of DC is k ¯ , and the result of classification is context. The k ¯ calculation formula in iDCA are as follows:
k ¯ = k 1 + k 2 + k 3 + · · · + k m m ,
k i = v d i v s i .
The k i in the above formula is the risk degree of the i-th method from the current sample.
The pseudocode for the iDCA is shown in Algorithm 1.
Classification results are stored in array r e s u l t [ ] , in which array r e s u l t [ i ] = 1 indicates the i-th sample is malware. Conversely, r e s u l t [ i ] = 0 indicates that the i-th sample is normal.
Algorithm 1 Pseudocode for iDCA
Input: Antigen and Signals
Output: Antigen Types and k ¯
1:procedure iDCA
2: I n i t i a l i z e D C ( )
3:while A n t i g e n i f r o m 1 t o n do
4:  while m e t h o d j f r o m 1 t o m do
5:    i n i t i a l i z e v d j , v s j , k j
6:    c a l c u l a t e v d j , v s j , k j
7:    D C . c s m + +
8:    D C . l i f e s p a n m D C . c s m
9:    k ¯ k ¯ + k j
10:   if D C . l i f e s p a n 0 then
11:     D C . k ¯ D C . k ¯ ÷ m
12:    if D C . k ¯ > 0 then
13:      D C . C o n t e x t = 1
14:    else
15:      D C . c o n t e x t = 0
16:    end if
17:   end if
18:  end while
19:   r e s u l t [ i ] D C . c o n t e x t
20:   r e s e t D C ( )
21:end while
22:return r e s u l t [ ]
23:end procedure

4.4. Analysis of iDCA

As a simulation of the natural dendritic cells’ working principle, iDCA has many advantages. First of all, the training phase workload of iDCA is very small, which only needs to classify the features in S into RFS, CFS, and SFS, and calculate the danger degree v d and the safe degree v s of each feature separately. Secondly, due to the low complexity of the iDCA, the algorithm has higher efficiency than DCA and some other algorithms. From Algorithm 1, it can be seen that the time complexity of iDCA is O ( n × m ) . Then, the iDCA has the advantages of highlighted data feature fusion, which can fuse a large number of features as the danger signal and the security signal. Fourthly, due to the low sensitivity of system parameters in a certain range (such as the change of the weight in feature data fusion and the change of the antigen storage space), the iDCA algorithm has strong robustness. Finally, for the whole detection process, the calculation of the feature’s information gain value removes a large number of results that have poor classification performance, and the overall classification efficiency of the algorithm is improved.
At the same time, the detection algorithm still has some shortcomings. Firstly, because of the different sizes of the Android applications, the number of methods in which application contained have a large difference, and this situation will affect the computational efficiency of weight. Secondly, this algorithm is sensitive to the amount of antigen. When there is an insufficient amount of antigen, the feature classification performance will lose effectiveness and then affect the classification performance of the overall algorithm.

5. Experimental Design

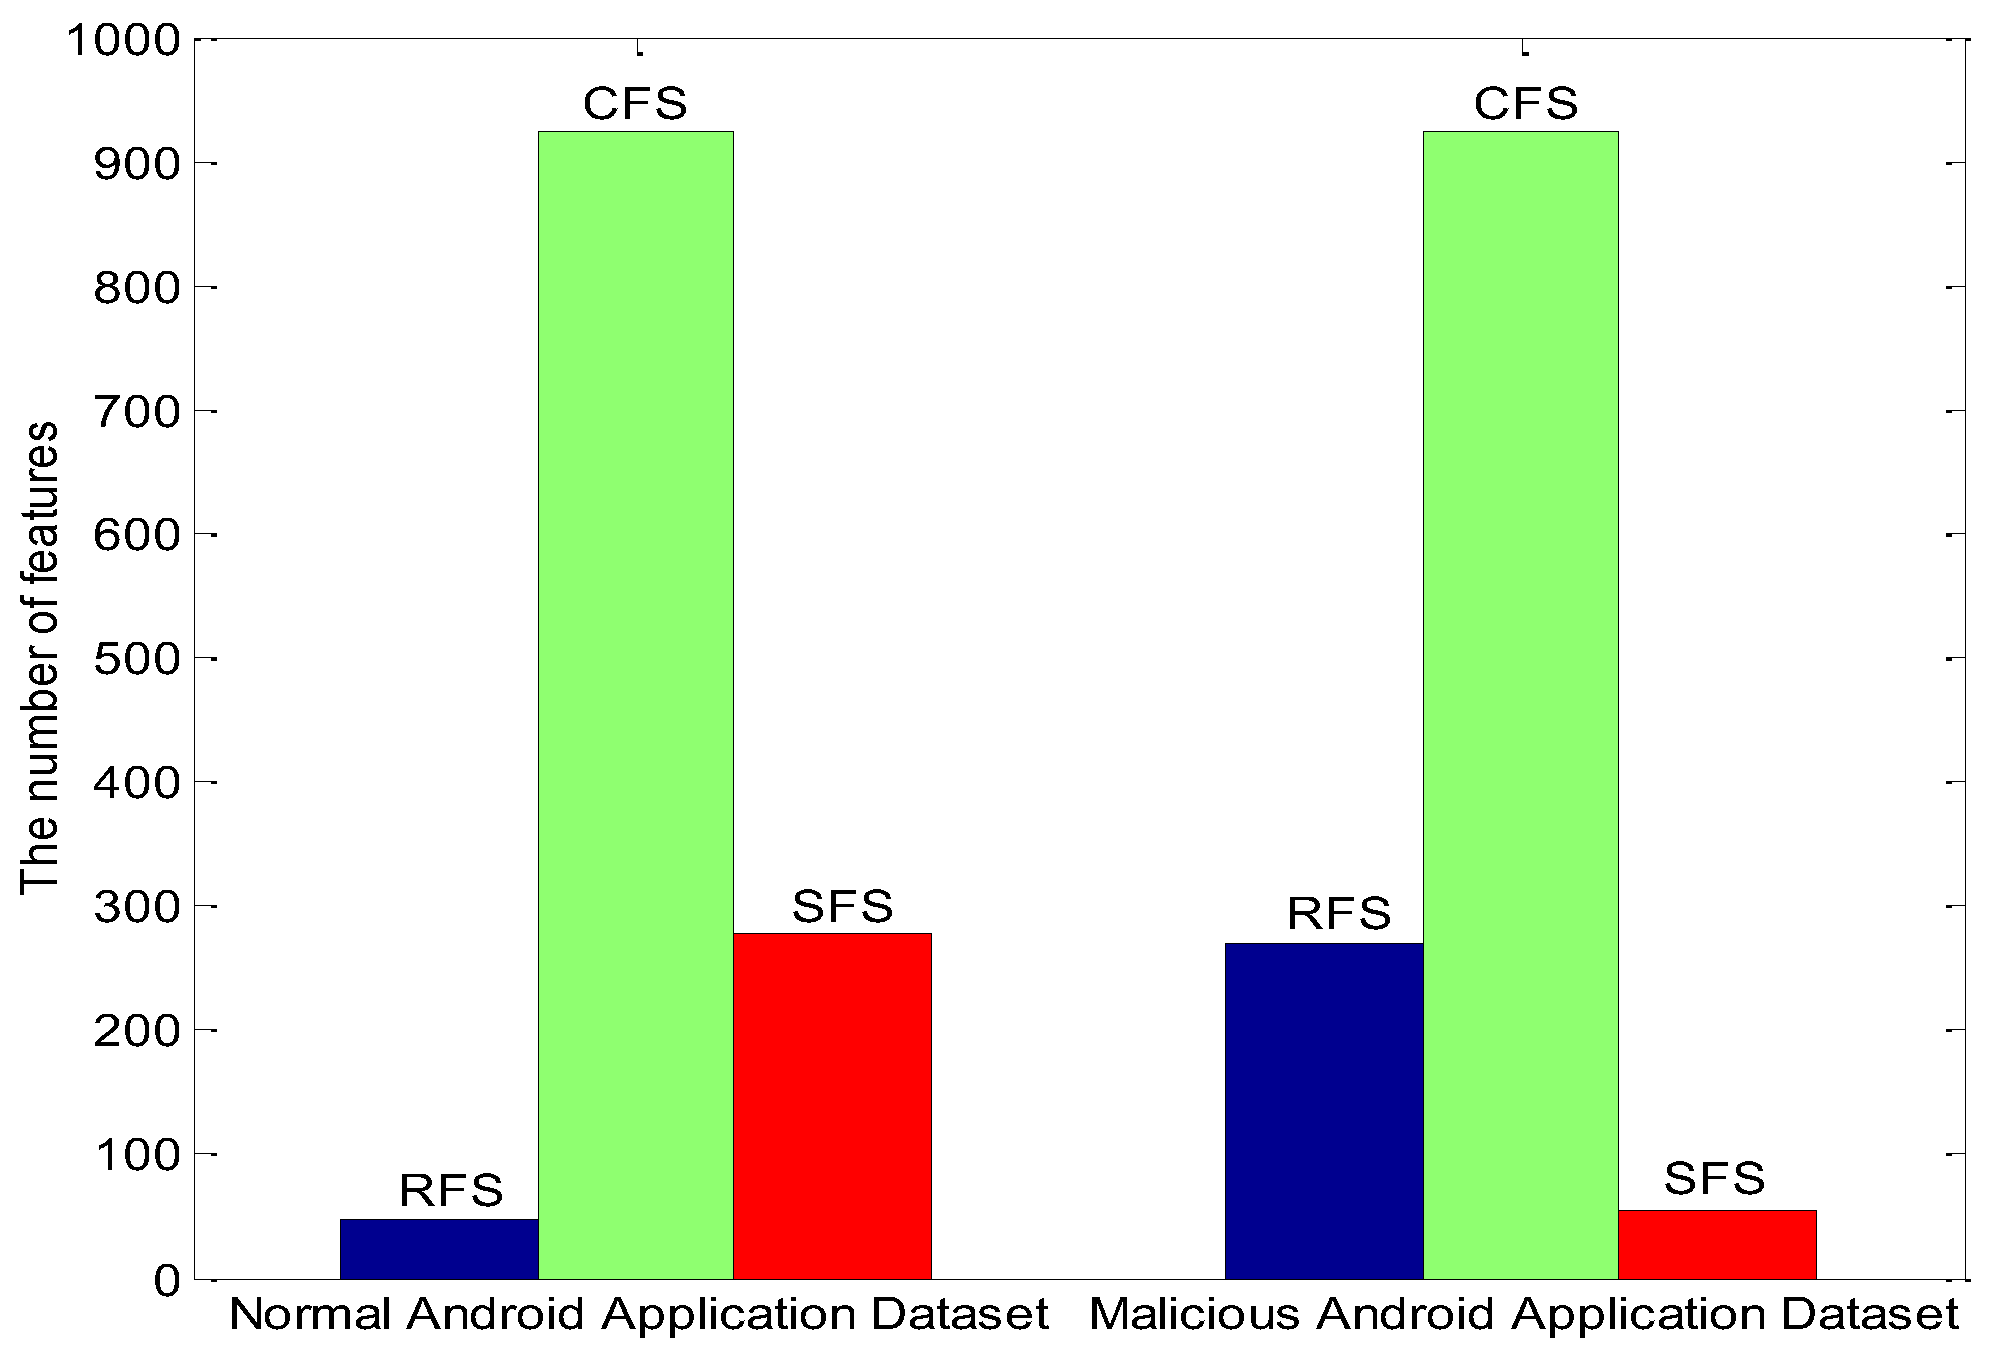
5.1. Experimental Data Processing

The experimental environment of algorithm designs is as follows: Intel Core i7-4710MQ CPU, 16GDDR31600Mhz memory and Windows 10 professional operating system. This experiment uses Python as the programming language.
Datasets are divided into normal samples and malware samples. In this experiment, from Google Play, 1000 samples have been selected as normal samples, and, from AndroMalShare and VirusShare, two Android malicious code sharing projects of 15 mainstream malicious code families have been selected. From each family, 50 cases (750 in total) are selected as malicious samples. In the malicious sample data set, half of the samples have been processed by code obfuscation. Due to the use of 10-fold-cross-validation, the proportion of the training set and the test set in the experiment is 9:1. Specific division methods are as follows: all samples were divided into 10 parts, each of the parts keeps the normal samples and malicious samples ratio of 4:3 constant, that is, 100 cases of normal samples and 75 cases of malicious samples. In the division of the training set and test set, 10 parts were successively set as the test set, and the remaining 9 parts were used as the training set. Finally, in each experiment, the total number of training sets is 1575 cases, and the total number of test sets is 175 cases.
Because of the static characteristic detecting method, the experiment does not need to run the Android application. The method that paper proposed mainly consists of two parts: training and detection.
For the training section, the main task is to extract features from the APK and to mark the characteristics as a different level of danger. Firstly, by using the APK unpacking tool (apktool), each sample has been unpacked, and the smali file is extracted from each unpacked APK. Secondly, for all smali source files, methods and Android static code APIs were extracted by python script in experiment. Thirdly, for the extracted method, DRIS and 4-perm algorithm complete statistical feature extraction are used to obtain two-tuples. According to a well-defined API call sequence table, the experiment processes the extracted API calls and generates a feature vector.Because the contrast table of dangerous API contains 17 APIs, the size of API feature vector is 17.
The selection of parameter N value in N-perm is important. When N is small, the N-perm algorithm will produce a large number of features, and these features do not have a better classification effect. When N is large, the N-perm algorithm will produce fewer features, whose features may only exist with the current APK file and are not universal. Through Figure 6, it can be seen that when the value of N is equal to 4, the detection result is best.
Next, the algorithm calculates the information gain value of characteristics from Dalvik sequence two-tuples, and, for each APK used for training, our experiment selects 400 characteristics that have maximum value of the information gain as a part of the final feature vector. Another part of the final feature vector is generated by the API calls.
As shown in Figure 8, although the numbers of RFSs and SFSs are not dominant, this algorithm can reduce the impact of CFS from weight calculation and feature fusion mode, and enhance the classification accuracy of the detection algorithm.
For the detection section, the main task is to classify suspicious APK by using a feature database that is obtained during the training section. The feature extraction of the detection section is the same as the training section.

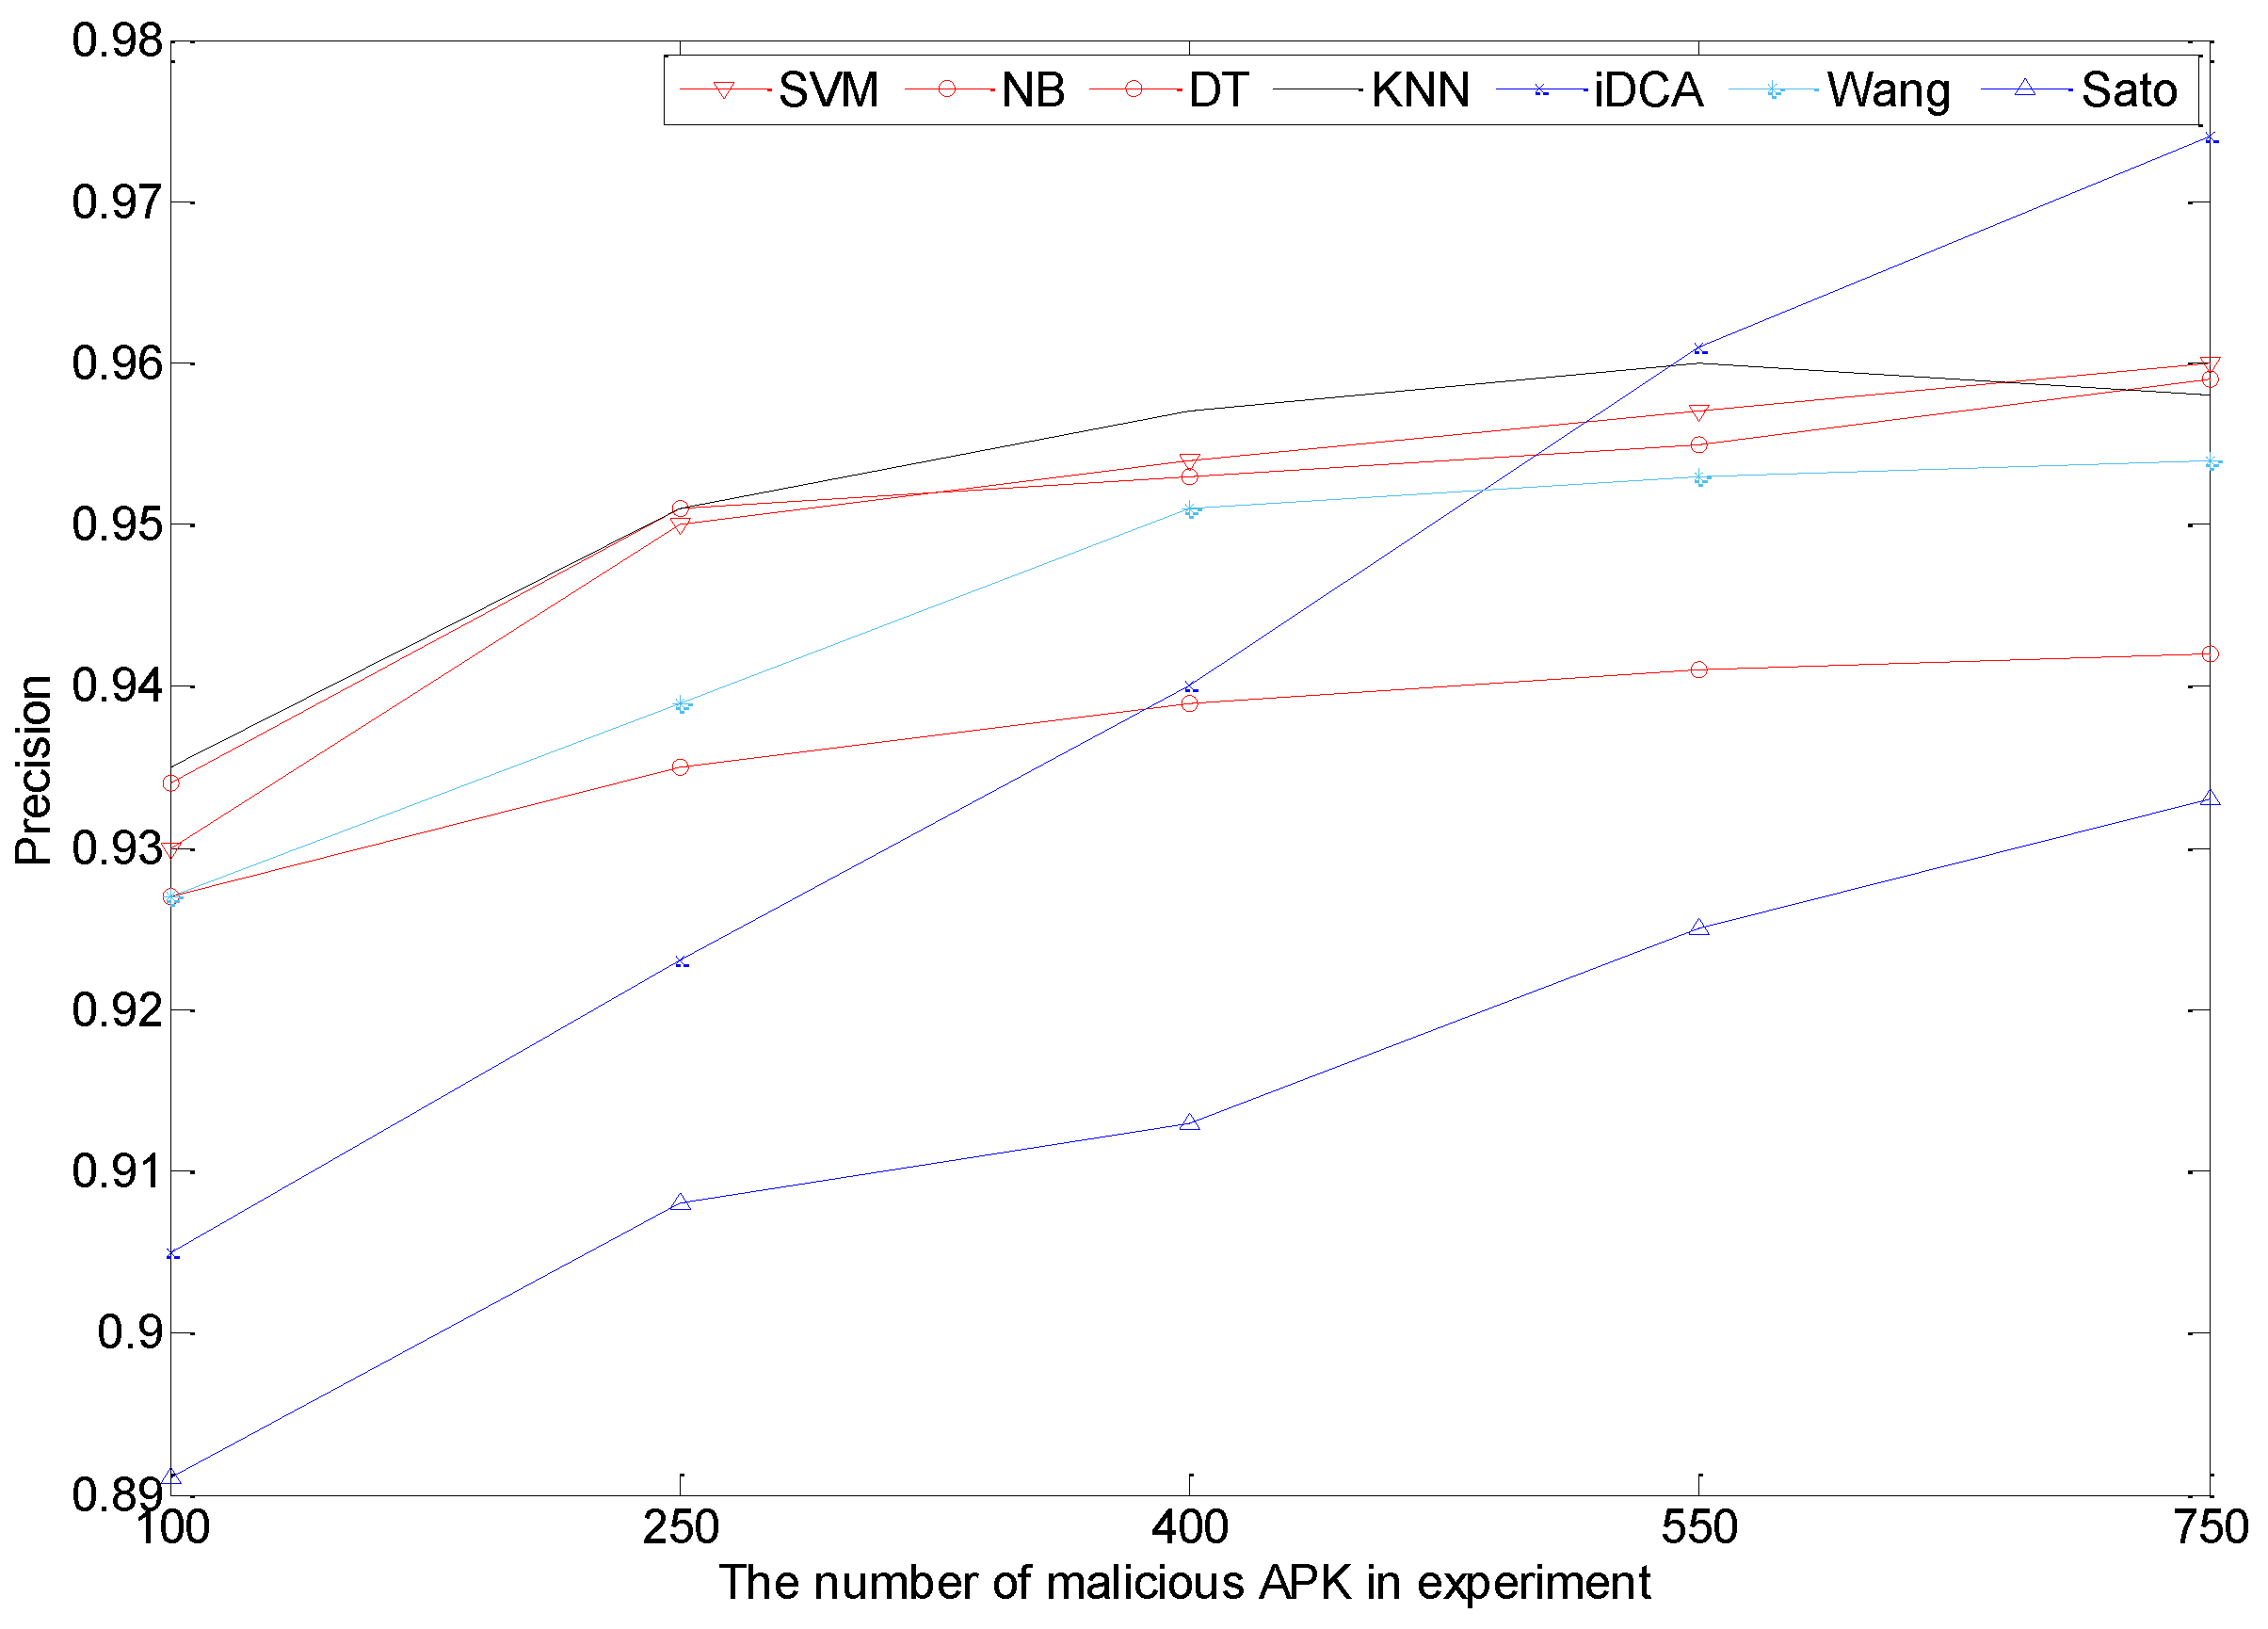
5.2. Results Contrast

In addition to the detection algorithm of this paper, as a comparison, the experiment has selected support vector machines (SVM), Naive Bayes (NB), J48 Decision Tree (DT) and the k-Nearest Neighbor (KNN) algorithm to verify the effect of the classification algorithm. These algorithms are applied to many fields of machine learning because of being simple and efficient [32,33]. At the same time, the method this paper proposed is compared with the method proposed by Wang [34] and Sato [12]. Wang [34] detected the malware by building different information models from Android permission. Sato [12] extracts permission, intent filter (action), intent filter (category) and process name from the AndroidManifest.xml file as the basis of classification, and uses the J48 decision tree to detect the Android malware.
Test results use the true position rate (TPR), false position rate (FPR) and accuracy as the evaluation index. Accuracy is the proportion of samples that are correctly classified. The TPR, FPR and accuracy are calculated by the following formula:
T P R = T P T P + F N ,
F P R = F P F P + T N ,
A c c u r a c y = T P + T N T P + F P + T N + F N .
The malware samples are regarded as positive in the classification model. TP is the number of correctly classified malware; FN is the number of malware samples wrongly identified as benign; FP is the number of Google app samples misclassified as malware, and TN is the number of correctly identified benign applications. From the 10-fold cross-validation, when the number of malicious samples is 750, the test results are shown in Table 3. As is shown in Table 2, compared with SVM, NB, DT, KNN, Wang [34], and Sato [12], iDCA has a higher detection accuracy rate when the number of malicious samples is 750. However, from Figure 9, it can be seen that the performance of iDCA is poor when the number of samples is small.
The FPR of iDCA is mainly caused by the features in CFS. There are three reasons for the FPR of iDCA: (1) the number of features in CFS is more than the sum of RFS and SFS features; (2) there are still a lot of sensitive operations in the normal code, which will increase the weight of the risk signal of the normal sample feature vector; (3)through the analysis of the false positive sample feature vector, it can be found that the number of feature items with a value of 1 is smaller than the items with a value of 0, which means that the false positive sample feature vector misses identification information because some samples just have a small amount of code. These problems also lead to the other four classifiers generating false positives.
From Table 2, the detection result of the iDCA is much better than Wang [34] and Sato [12], to which it can be attributed that some developers will declare more permissions than they require. The DRIS and the suspicious APIs compared to permissions have a better performance in identifying malicious applications.
In addition, it can be seen from Table 3 that, due to the low time complexity, iDCA training time and testing time is much smaller than the other methods, respectively achieved with 0.85 s and 0.55 s.

6. Conclusions

Compared with the other machine learning based detection methods, the method this paper proposed has the following improvements. This method takes DRIS and suspicious APIs as features in the experiment. The N-perm algorithm and information gain value are used in the characteristic processing, which reduce the data redundancy and improve the classification ability of data. Danger theory is used to complete feature mark and feature fusion. Finally, iDCA is used for classification.
Through these improvements, this method has a higher classification precision and a higher time efficiency than the other existing machine learning based detection algorithms. In addition, because code obfuscation mainly aims at anti-reverse analysis by substituting variable name, function name, class name and package name, the code statistical characteristics and system API call adopted by this algorithm will not produce big changes. This algorithm can reduce the influence of code obfuscation to a certain degree.
However, this algorithm still has some shortcomings: (1) this detection algorithm is not used in small sample training data sets; (2) this algorithm can not detect the malicious code with dynamical loading, which is also vulnerable to the influence of the deformation of the polymorphic environment. Because this algorithm requires a large number of samples to learn, and the sample experiments used is less, the ability for detection unknown malware still needs to be verified.
In the future, the main focus of the research is to reduce the sensitivity of the polymorphic code and build a more effective feature library by expanding sets for training, which may improve the practicality of the algorithm. Meanwhile, to detect malware more accurately, the study of malicious code dynamic loading technology is also needed.

Acknowledgments

The work is supported by the Foundation of Educational Commission of Tianjin, China (Grant No. 20130801), the General Project of Tianjin Municipal Science and Technology Commission (No. 15JCYBJC15600), the Major Project of Tianjin Municipal Science and Technology Commission (No. 15ZXDSGX00030), and NSFC: The United Foundation of General Technology and Fundamental Research (No. U1536122).

Author Contributions

Zhiyuan Li put forward the original ideas and performed the research. Chundong Wang and Liangyi Gong conceived and designed the simulations of the iDCA. Hong Yang and Yi Zhao collected the experimental data and carried out experiments. Xiuliang Mo reviewed the paper and provided useful comments. All authors have read and approved the final manuscript.

Conflicts of Interest

The authors declare no conflict of interest.

References

  1. Statista. Available online: https://www.statista.com/statistics/266136/global-market-share-held-by-smartphone-operating-systems/ (accessed on 1 November 2016).
  2. AVL. Available online: http://blog.avlyun.com/2016/02/2759/2015report/ (accessed on 5 February 2016).
  3. Shangguan, L.; Yang, Z.; Liu, A.X.; Zhou, Z.; Liu, Y. Relative localization of RFID tags using spatial-temporal phase profiling. In Proceedings of the 12th USENIX Symposium on Networked Systems Design and Implementation (NSDI 15th), Oakland, CA, USA, 4–6 May 2015.
  4. Seo, S.H.; Gupta, A.; Sallam, A.M.; Bertino, E.; Yim, K. Detecting mobile malware threats to homeland security through static analysis. J. Netw. Comput. Appl. 2014, 38, 43–53. [Google Scholar] [CrossRef]
  5. Shabtai, A.; Fledel, Y.; Kanonov, U.; Elovici, Y.; Dolev, S. Google android: A state-of-the-art review of security mechanisms. arXiv, 2009; arXiv:0912.5101. [Google Scholar]
  6. Si-han, Q. Research Progress on Android Security. J. Softw. 2016, 27, 45–71. [Google Scholar]
  7. Enck, W.; Ongtang, M.; McDaniel, P. On lightweight mobile phone application certification. In Proceedings of the 16th ACM Conference on Computer and Communications Security, Chicago, IL, USA, 9–13 November 2009; pp. 235–245.
  8. Ongtang, M.; McLaughlin, S.; Enck, W.; McDaniel, P. Semantically rich application-centric security in Android. Secur. Commun. Netw. 2012, 5, 658–673. [Google Scholar] [CrossRef]
  9. Nauman, M.; Khan, S.; Zhang, X. Apex: Extending android permission model and enforcement with user-defined runtime constraints. In Proceedings of the 5th ACM Symposium on Information, Computer and Communications Security, Beijing, China, 13–16 April 2010; pp. 328–332.
  10. Wognsen, E.R.; Karlsen, H.S.; Olesen, M.C.; Hansen, R.R. Formalisation and analysis of Dalvik bytecode. Sci. Comput. Programm. 2014, 92, 25–55. [Google Scholar] [CrossRef]
  11. Sarma, B.P.; Li, N.; Gates, C.; Potharaju, R.; Nita-Rotaru, C.; Molloy, I. Android permissions: A perspective combining risks and benefits. In Proceedings of the ACM Symposium on Access Control Models & Technologies Ser Sacmat, Newark, NJ, USA, 20–22 June 2012; pp. 13–22.
  12. Sato, R.; Chiba, D.; Goto, S. Detecting Android malware by analyzing manifest files. APAN 2013, 36, 23–31. [Google Scholar] [CrossRef]
  13. Wu, D.J.; Mao, C.H.; Wei, T.E.; Lee, H.M.; Wu, K.P. Droidmat: Android malware detection through manifest and api calls tracing. In Proceedings of the 2012 Seventh Asia Joint Conference on Information Security (Asia JCIS), Tokyo, Japan, 9–10 August 2012; pp. 62–69.
  14. Weichselbaum, L.; Neugschwandtner, M.; Lindorfer, M.; Fratantonio, Y.; van der Veen, V.; Platzer, C. Andrubis: Android Malware under the Magnifying Glass; TR-ISECLAB-0414-001; Vienna University of Technology: Vienna, Austria, May 2014. [Google Scholar]
  15. Grace, M.; Zhou, Y.; Zhang, Q.; Zou, S.; Jiang, X. Riskranker: Scalable and accurate zero-day android malware detection. In Proceedings of the 10th International Conference on Mobile Systems, Applications, and Services, Lake District, UK, 25–29 June 2012; pp. 281–294.
  16. Li, T.; Dong, H.; Yuan, C.Y.; Du, Y.J.; Xu, G.A. Description of Android Malware Feature Based on Dalvik Instructions. J. Comput. Res. Dev. 2014, 7, 1458–1466. [Google Scholar]
  17. Suarez-Tangil, G.; Tapiador, J.E.; Peris-Lopez, P.; Blasco, J. Dendroid: A text mining approach to analyzing and classifying code structures in Android malware families. Expert Syst. Appl. 2014, 41, 1104–1117. [Google Scholar] [CrossRef] [Green Version]
  18. Kong, D.G.; Tan, X.B.; Xi, H.S.; Gong, T.; Shuai, J.M. Obfuscated Malware Detection Based on Boosting Multilevel Features. J. Softw. 2011, 3, 522–533. [Google Scholar] [CrossRef]
  19. Pektas, A.; Eris, M.; Acarman, T. Proposal of n-gram based algorithm for malware classification. In Proceedings of the Fifth International Conference on Emerging Security Information, Systems and Technologies, French Riviera, France, 21–27 August 2011; pp. 14–18.
  20. Ng, D.V.; Hwang, J.I.G. Android malware detection using the dendritic cell algorithm. In Proceedings of the 2014 International Conference on Machine Learning and Cybernetics (ICMLC), Lanzhou, China, 13–16 July 2014; Volume 1, pp. 257–262.
  21. Cesare, S.; Xiang, Y. Classification of malware using structured control flow. In Proceedings of the Eighth Australasian Symposium on Parallel and Distributed Computing-Volume 107, Brisbane, Australia, 1 January 2010; pp. 61–70.
  22. Li, W.J.; Wang, K.; Stolfo, S.J.; Herzog, B. Fileprints: Identifying file types by n-gram analysis. In Proceedings of the Sixth Annual Workshop on Information Assurance, New York, NY, USA, 15–17 June 2005; pp. 64–71.
  23. Matzinger, P. Tolerance, danger, and the extended family. Annu. Rev. Immunol. 1994, 12, 991–1045. [Google Scholar] [CrossRef] [PubMed]
  24. Greensmith, J. The Dendritic Cell Algorithm. Ph.D. Thesis, University of Nottingham, Nottingham, UK, October 2007. [Google Scholar]
  25. Sahin, C.; Tornquist, P.; Mckenna, R.; Pearson, Z.; Clause, J. How Does Code Obfuscation Impact Energy Usage? In Proceedings of the IEEE International Conference on Software Maintenance and Evolution, Raleigh, NC, USA, 2–10 October 2016; pp. 131–140.
  26. Faruki, P.; Bharmal, A.; Laxmi, V.; Ganmoor, V.; Gaur, M.S.; Conti, M.; Rajarajan, M. Android Security: A Survey of Issues, Malware Penetration and Defenses. IEEE Commun. Surv. Tutor. 2014, 17, 998–1022. [Google Scholar] [CrossRef]
  27. Piao, Y.; Jung, J.H.; Yi, J.H. Server-based code obfuscation scheme for APK tamper detection. Secur. Commun. Netw. 2014, 9, 457–467. [Google Scholar] [CrossRef]
  28. Manzoor, S.; Shafiq, M.Z.; Tabish, S.M.; Farooq, M. A sense of danger for windows processes. In Artificial Immune Systems; Springer: Berlin, Germany, 2009; pp. 220–233. [Google Scholar]
  29. Rychtáriková, R.; Korbel, J.; Macháček, P.; Císař, P.; Urban, J.; Štys, D. Point Information Gain and Multidimensional Data Analysis. Entropy 2016, 18, 372. [Google Scholar] [CrossRef]
  30. Sung, Y. Intelligent Security IT System for Detecting Intruders Based on Received Signal Strength Indicators. Entropy 2016, 18, 366. [Google Scholar] [CrossRef]
  31. Gu, F.; Greensmith, J.; Aickelin, U. Theoretical formulation and analysis of the deterministic dendritic cell algorithm. Biosystems 2013, 111, 127–135. [Google Scholar] [CrossRef] [PubMed]
  32. Park, J.; Johnson, J.T.; Majurec, N.; Frankford, M.; Stewart, K.; Smith, G.E.; Westbrook, L. Simulation and analysis of polarimetric radar signatures of human gaits. IEEE Trans. Aerosp. Electron. Syst. 2014, 50, 2164–2175. [Google Scholar] [CrossRef]
  33. Jang, W.Y.; Park, J.; Fuchs, Z.; Parada, F.; Hanna, P.; Derov, J.; Noyola, M. Multispectral target recognition using adaptive radar and infrared data integration. In Proceedings of the 2014 IEEE Geoscience and Remote Sensing Symposium, Quebec City, QC, Canada, 13–18 July 2014; pp. 189–190.
  34. Wang, W.; Wang, X.; Feng, D.W.; Liu, J.Q.; Han, Z.; Zhang, X.L. Exploring permission-induced risk in Android applications for malicious application detection. IEEE Trans. Inf. Forensic Secur. 2014, 9, 1869–1882. [Google Scholar] [CrossRef]
Figure 1. Dalvik reduced instruction sequence (DRIS) letters and instructions mapping table.
Entropy 19 00065 g001
Figure 2. Dalvik instruction set sequence sample.
Entropy 19 00065 g002
Figure 3. Dendritic Cell (DC) state transformation.
Entropy 19 00065 g003
Figure 4. Overall system flow.
Entropy 19 00065 g004
Figure 5. Training flow.
Entropy 19 00065 g005
Figure 6. Effects of N-perm parameter N on detection accuracy.
Entropy 19 00065 g006
Figure 7. Detection flow.
Entropy 19 00065 g007
Figure 8. Comparison of feature classification results.
Entropy 19 00065 g008
Figure 9. Comparison of different numbers of malicious samples.
Entropy 19 00065 g009
Table 1. Symbol Table.
SymbolDescription
DCDendritic cell, in this paper is APK sample
iDCimmature DC, in this paper is test sample
smDCsemi-mature DC, in this paper is normal sample
mDCmature DC, in this paper is malicious sample
CSMthe concentration of co-stimulatory molecules, represents the process of iDC transforming
krepresents the danger degree of single method in current APK
k ¯ a measure indicating the polarisation towards anomaly or normality
Ma set of malicious APK
Na set of normal APK
Va set of suspicious APK
Sa set of characteristics after data extraction
DSdanger signal, represents the hazard degree
SSsafe signal, represents the safe degree
RFSrisk feature set, a set contains danger characteristic
CFScommon feature set, a set contains common characteristic
SFSsafe feature set, a set contains safe characteristic
v d represents the danger degree of current characteristic or method
v s represents the safe degree of current characteristic or method
Table 2. The results contrast of different algorithms.
AlgorithmSVMNBDTKNNiDCAWang [34]Sato [12]
TPR0.9370.9470.9250.9440.9800.9570.921
FPR0.0290.0300.0430.0310.0200.0350.050
Accuracy0.9570.9600.9430.9580.9740.9620.938
Table 3. The time efficiency contrast of different algorithms.
AlgorithmTraining Time (s)Testing Time (s)
SVM1.501.12
NB2.150.98
DT2.560.79
KNN1.980.85
Wang [34]1.880.69
Sato [12]2.130.63
iDCA0.850.55

