
Towards Operational Definition of Postictal Stage: Spectral Entropy as a Marker of Seizure Ending

 , ,
, ,
Abstract
:1. Introduction
2. Materials and Methods
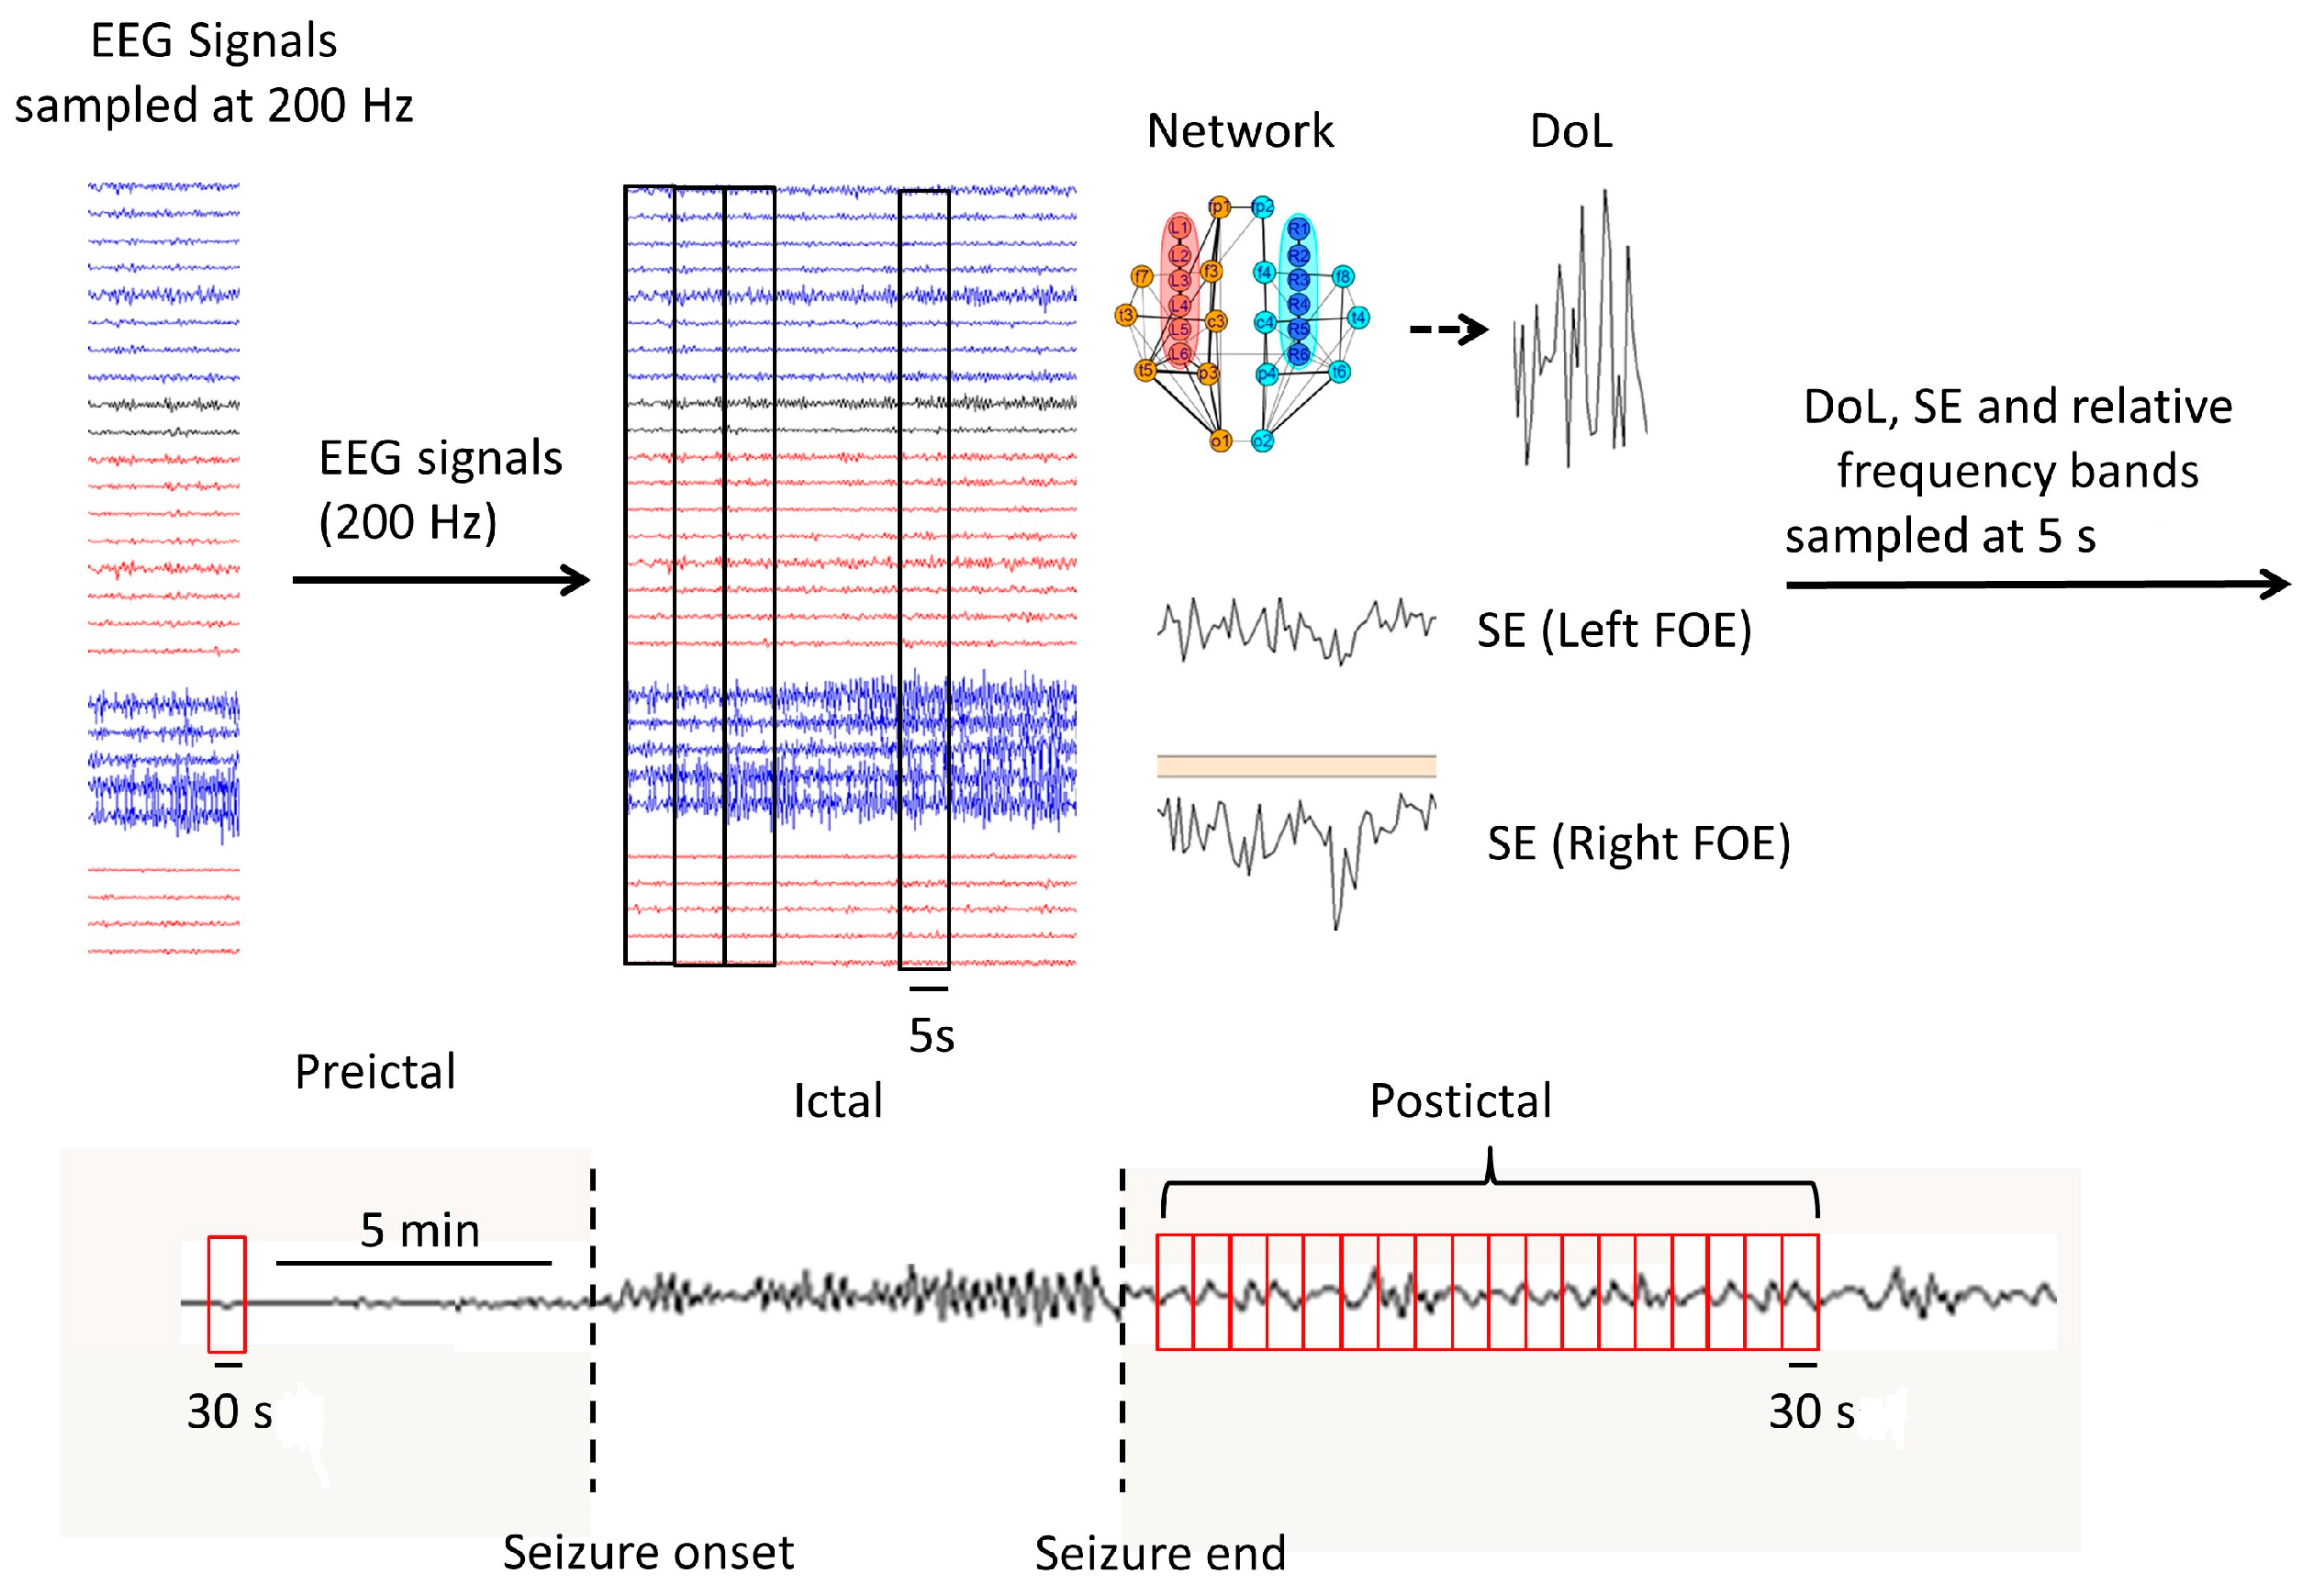
2.1. Neurophysiological Data
2.2. Synchronization and Spectral Analyses
2.3. Statistical Analyses
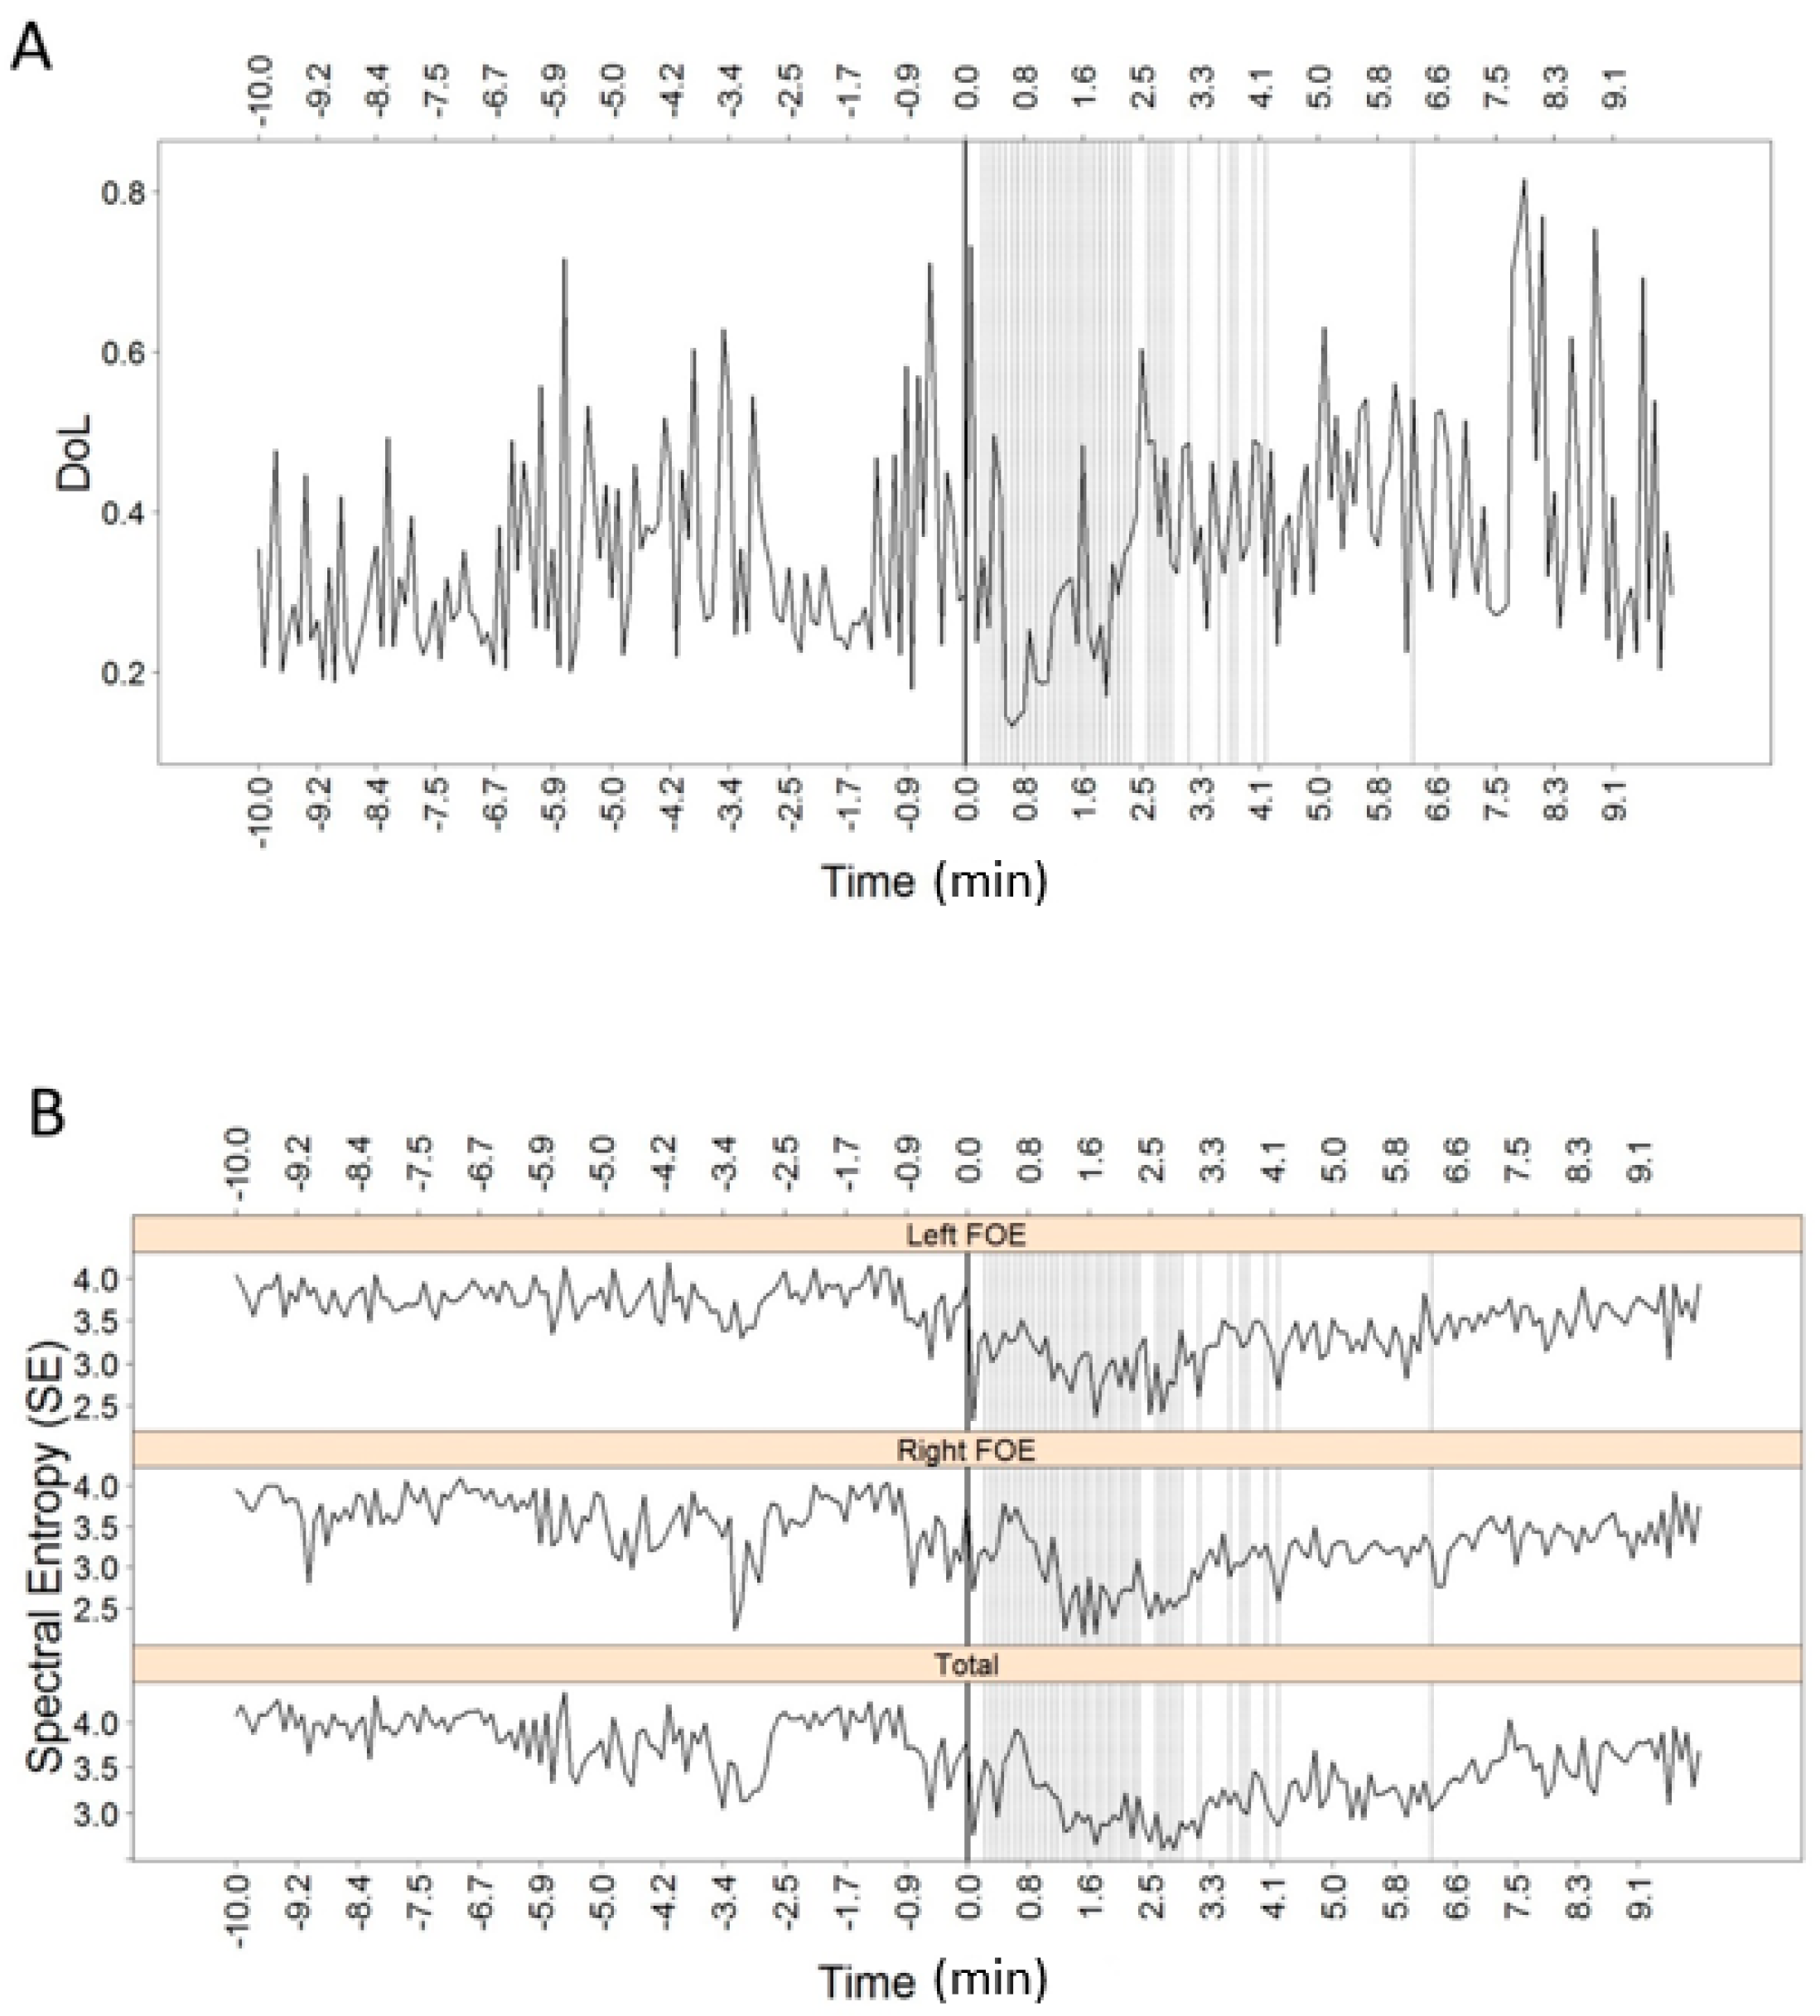
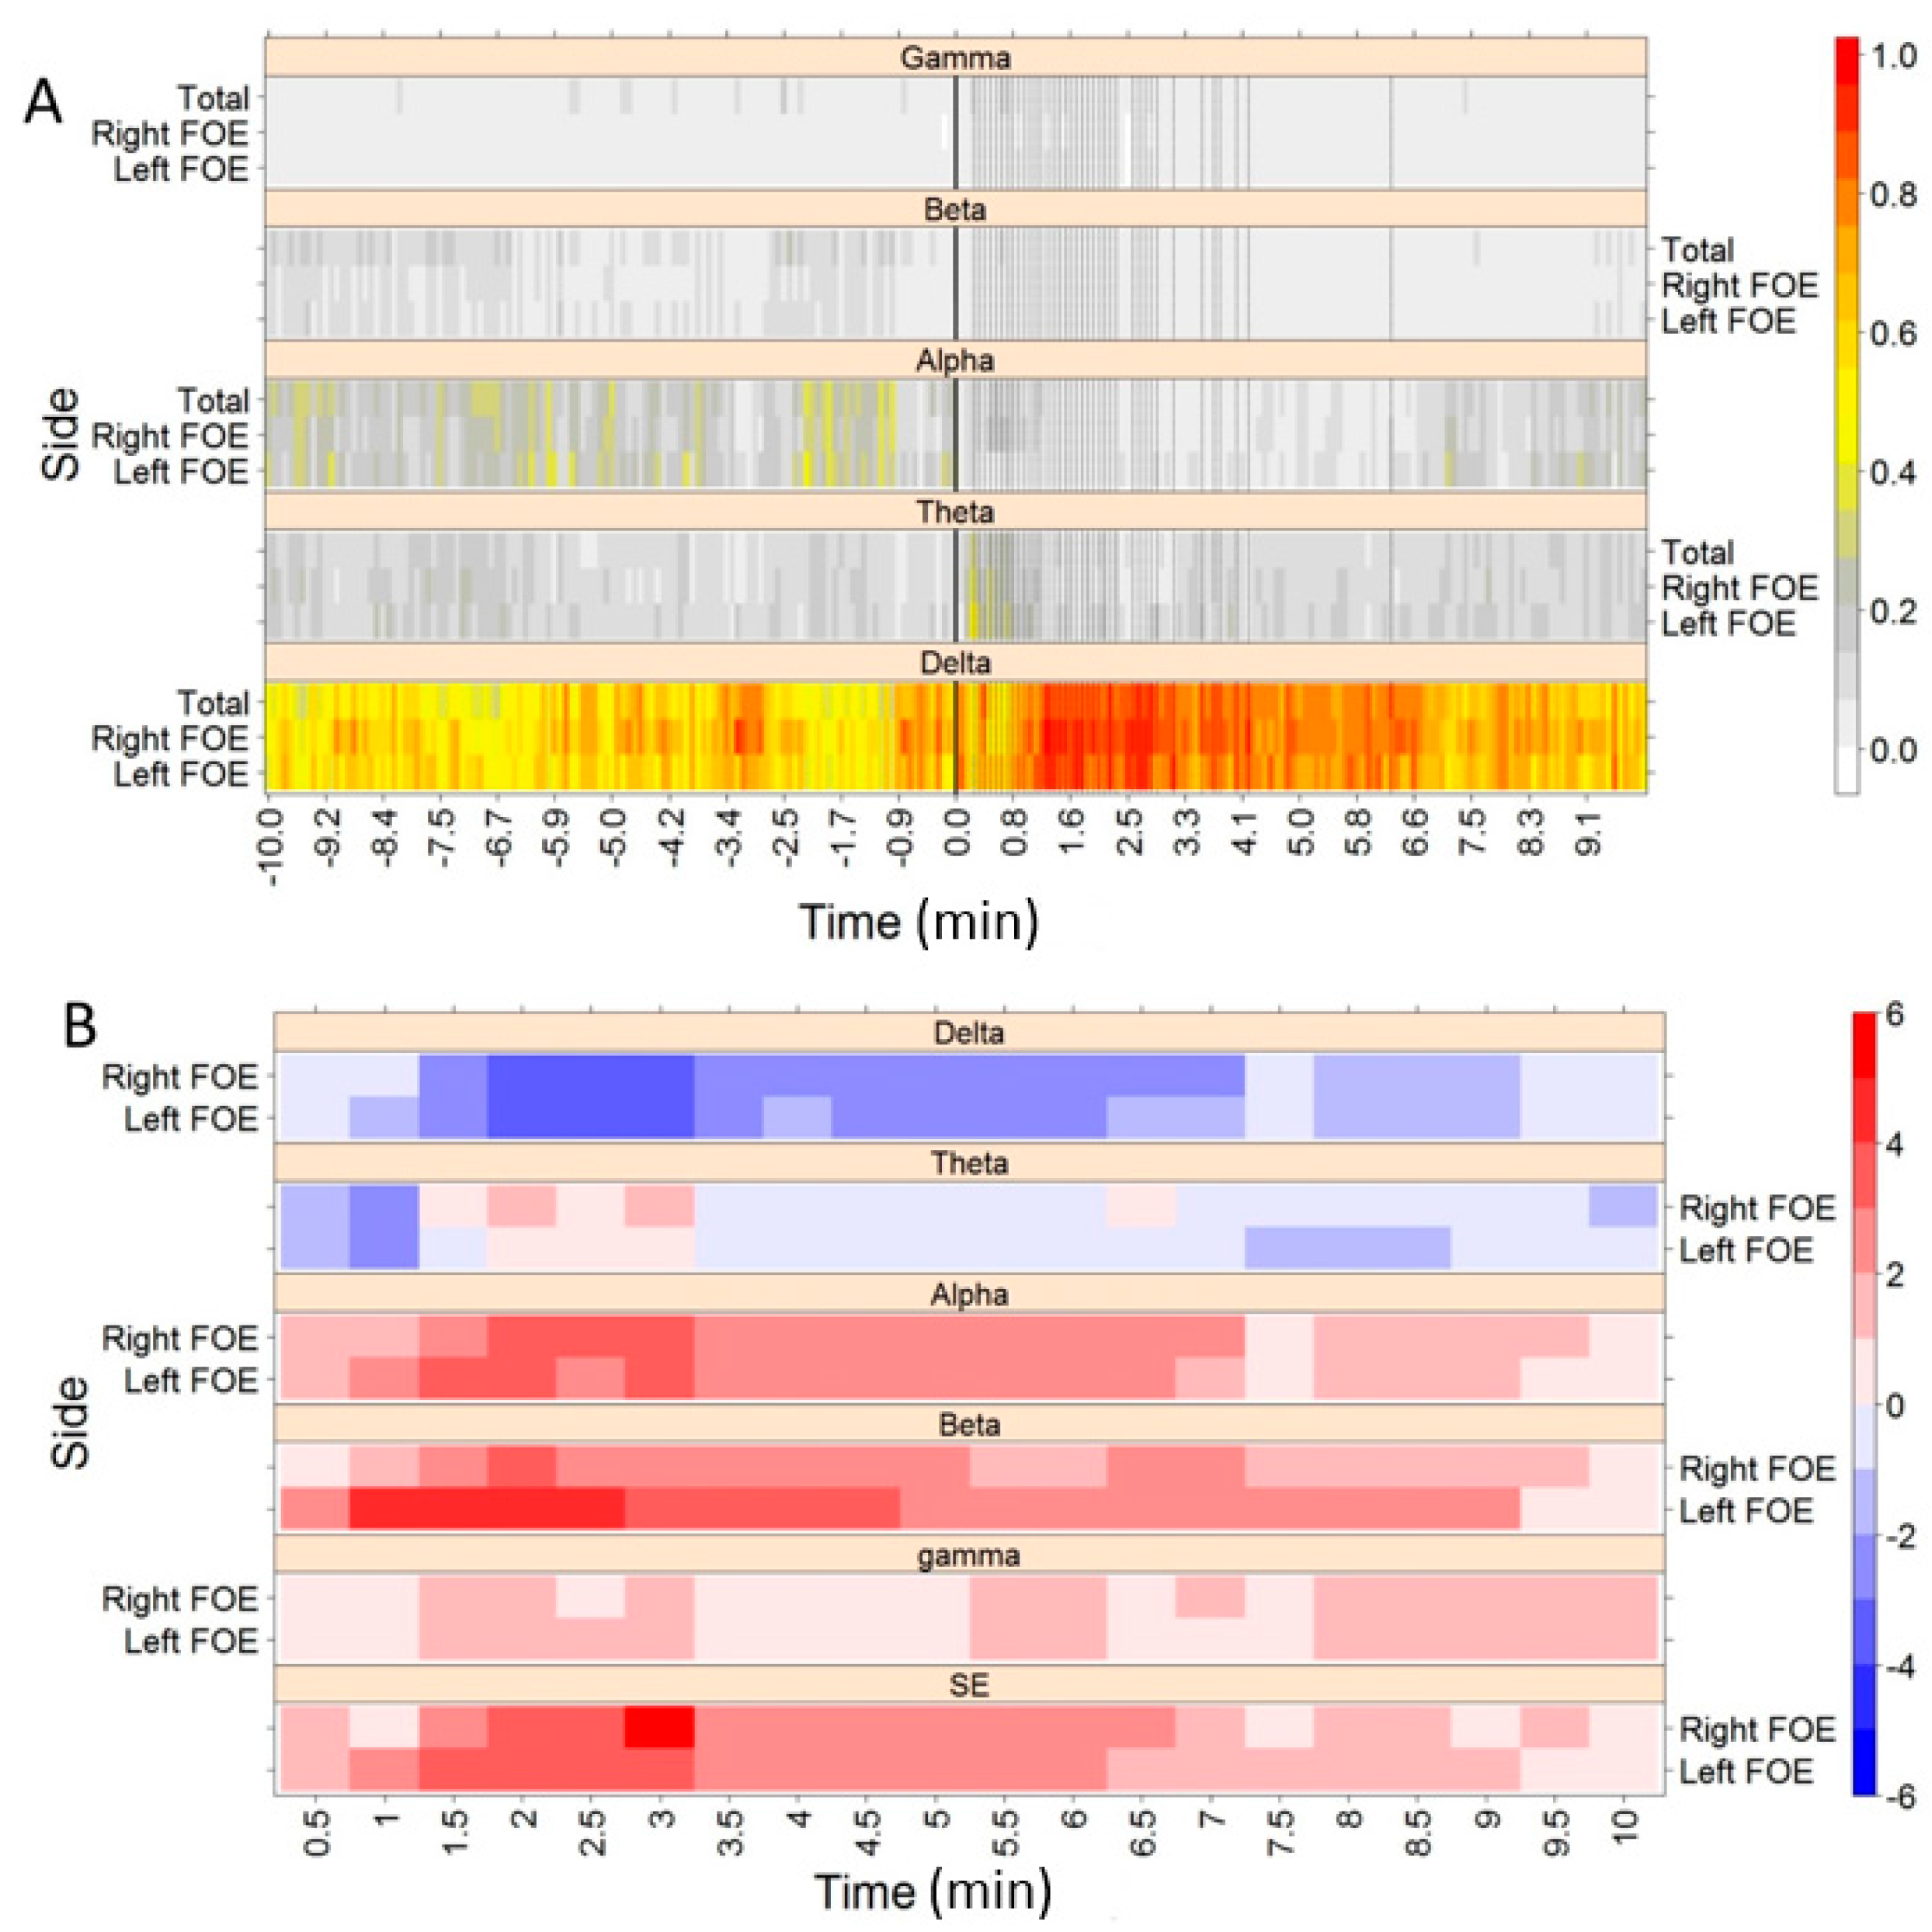
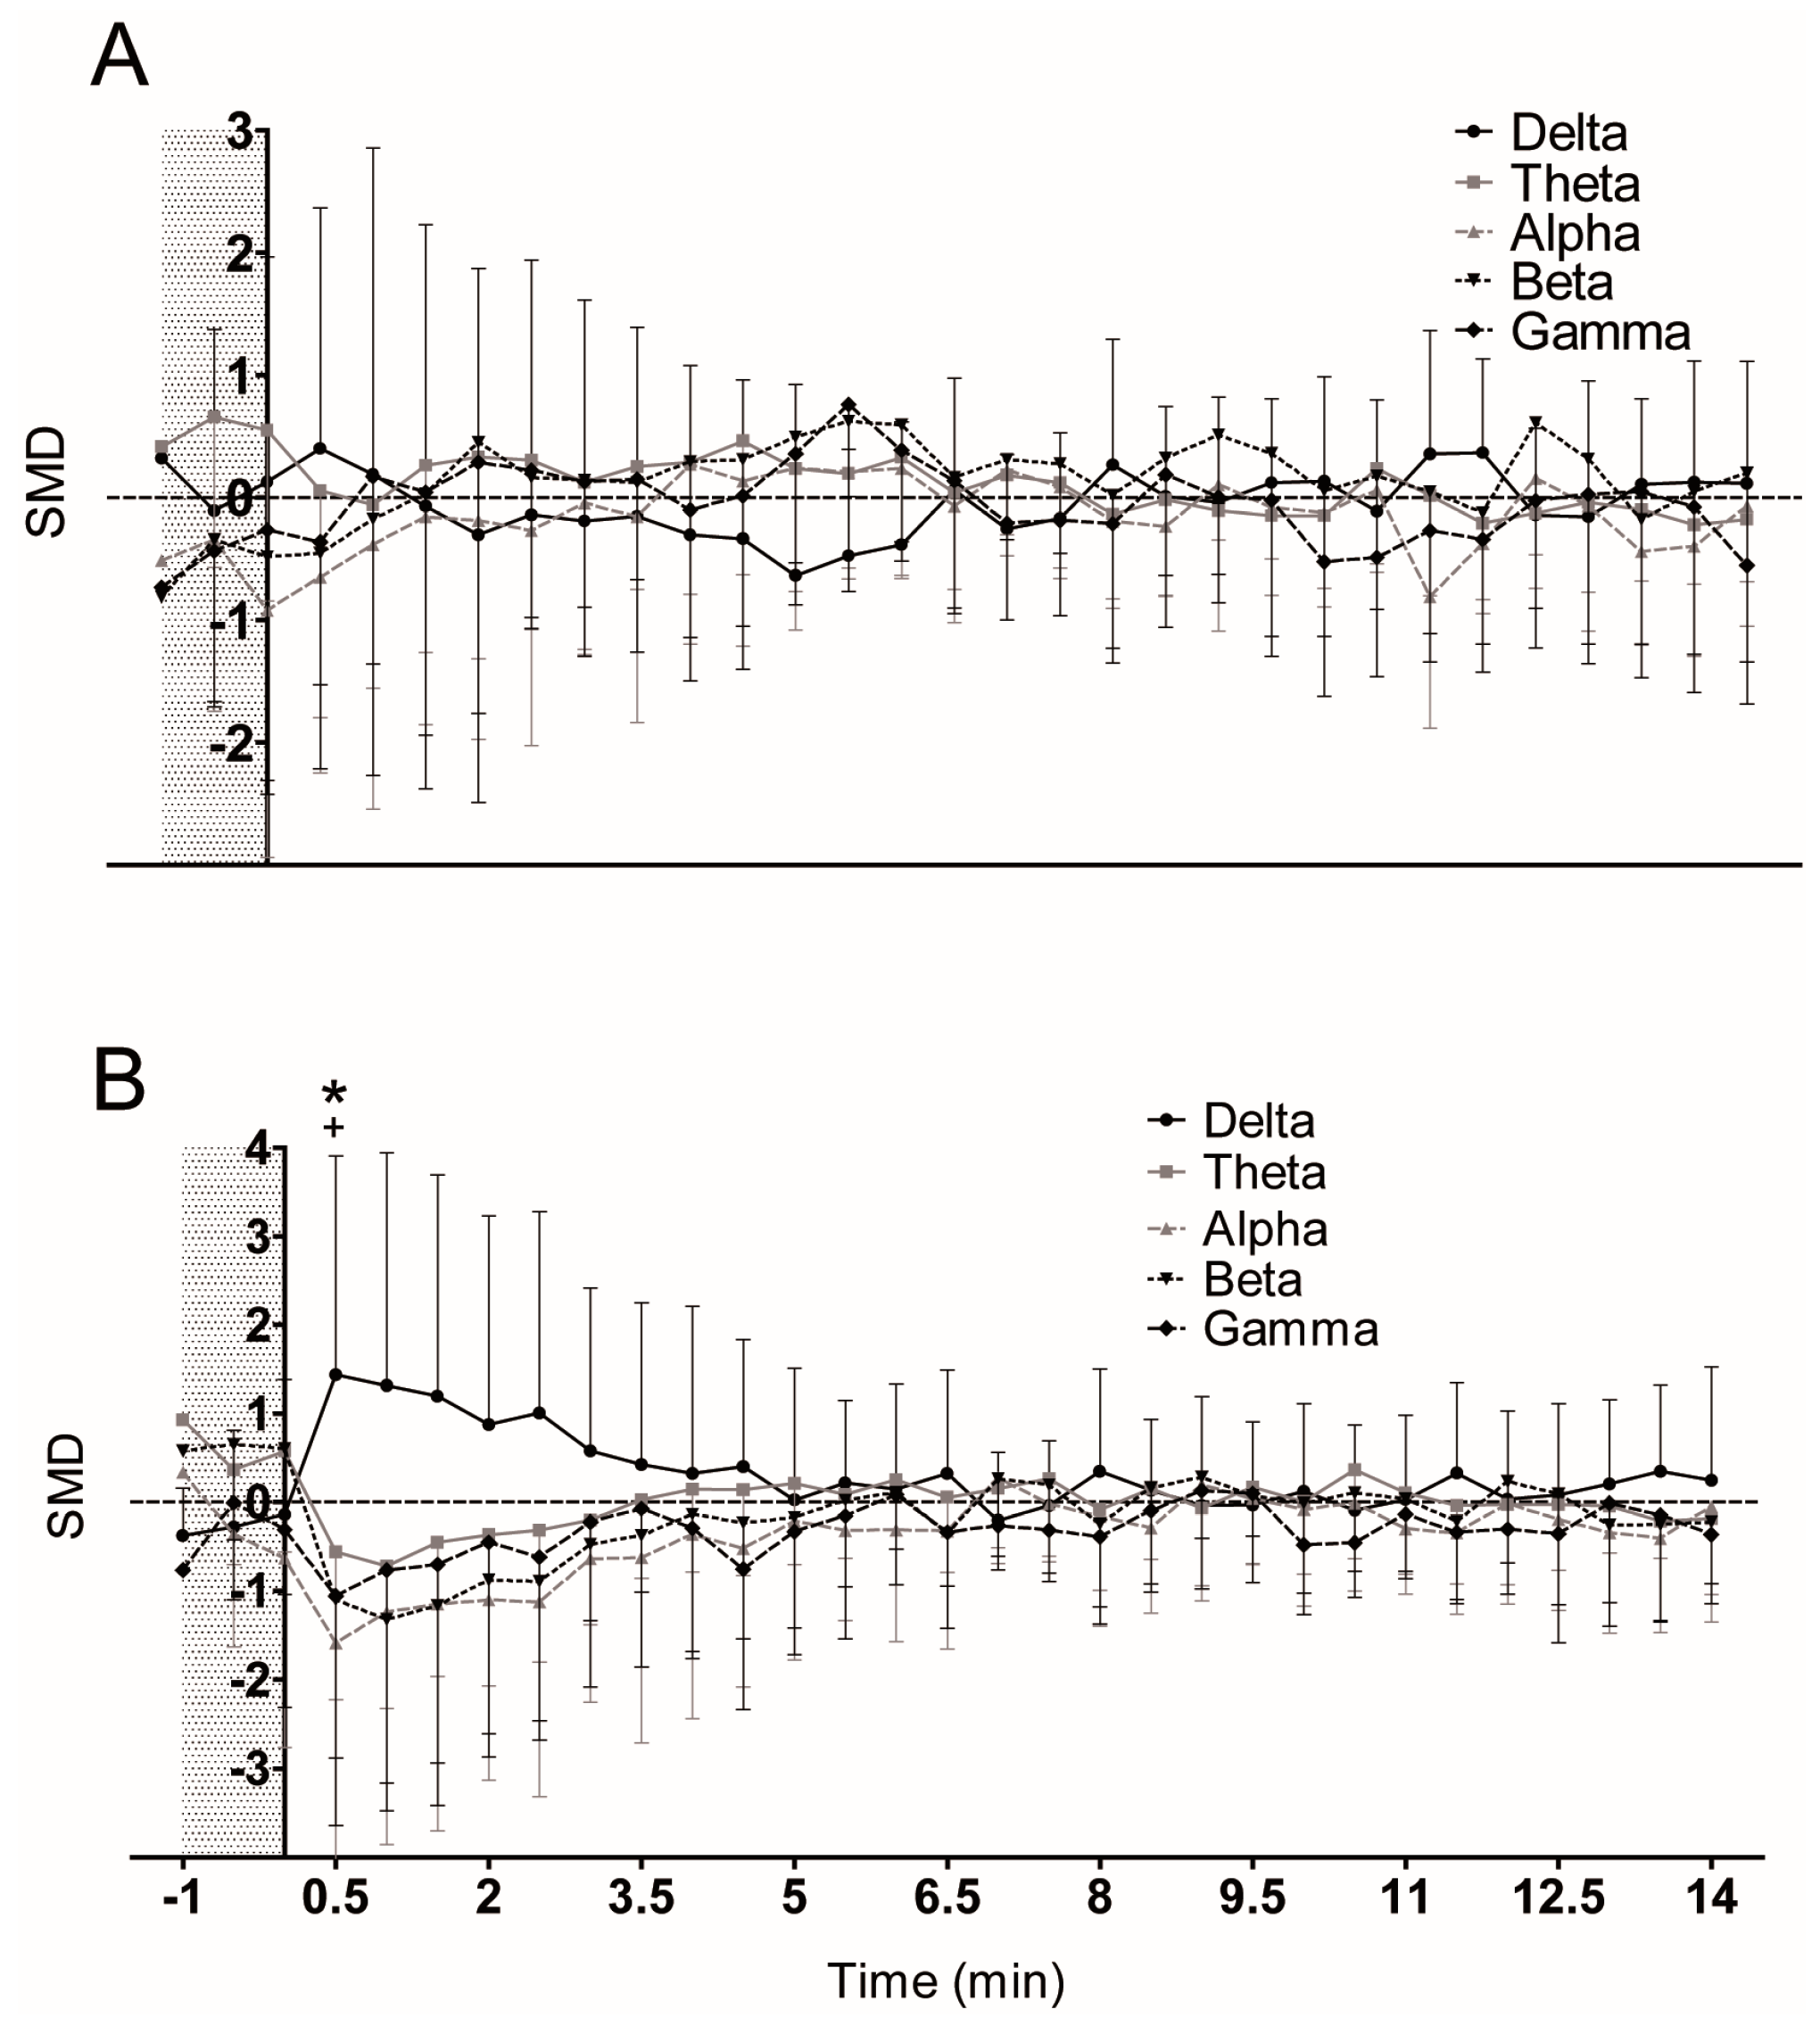
3. Results
4. Discussion
Acknowledgments
Author Contributions
Conflicts of Interest
References
- Le Van Quyen, M.; Martinerie, J.; Navarro, V.; Boon, P.; D’Havé, M.; Adam, C.; Renault, B.; Varela, F.; Baulac, M. Anticipation of epileptic seizures from standard EEG recordings. Lancet 2001, 357, 183–188. [Google Scholar] [CrossRef]
- Navarro, V.; Martinerie, J.; Le Van Quyen, M.; Clemenceau, S.; Adam, C.; Baulac, M.; Varela, F. Seizure anticipation in human neocortical partial epilepsy. Brain 2002, 125, 640–655. [Google Scholar] [CrossRef] [PubMed]
- Mormann, F.; Andrzejak, R.G.; Elger, C.E.; Lehnertz, K. Seizure prediction: the long and winding road. Brain 2007, 130, 314–333. [Google Scholar] [CrossRef] [PubMed]
- Gotman, J. Neurophysiology, Seizure Detection and Prediction. Encycl. Basic Epilepsy Res. 2009, 1606–1613. [Google Scholar] [CrossRef]
- Wilson, S.B. A neural network method for automatic and incremental learning applied to patient-dependent seizure detection. Clin. Neurophysiol. 2005, 116, 1785–1795. [Google Scholar] [CrossRef] [PubMed]
- Shoeb, A.; Kharbouch, A.; Soegaard, J.; Schachter, S.; Guttag, J. A machine-learning algorithm for detecting seizure termination in scalp EEG. Epilepsy Behav. 2011, 22, S36–S43. [Google Scholar] [CrossRef] [PubMed]
- Stamoulis, C.; Schomer, D.L.; Chang, B.S. Information theoretic measures of network coordination in high-frequency scalp EEG reveal dynamic patterns associated with seizure termination. Epilepsy Res. 2013, 105, 299–315. [Google Scholar] [CrossRef] [PubMed]
- Blume, W.T.; Lüders, H.O.; Mizrahi, E.; Tassinari, C.; Van Emde Boas, W.; Engel, J. Glossary of Descriptive Terminology for Ictal Semiology: Report of the ILAE Task Force on Classification and Terminology. Epilepsia 2001, 42, 1212–1218. [Google Scholar] [CrossRef] [PubMed]
- Fisher, R.S.; Engel, J., Jr. Definition of the postictal state: When does it start and end? Epilepsy Behav. 2010, 19, 100–104. [Google Scholar] [CrossRef] [PubMed]
- So, N.K.; Blume, W.T. The postictal EEG. Epilepsy Behav. 2010, 19, 121–126. [Google Scholar] [CrossRef] [PubMed]
- Kaibara, M.; Blume, W.T. The postictal electroencephalogram. Electroencephalogr. Clin. Neurophysiol. 1988, 70, 99–104. [Google Scholar] [CrossRef]
- Lieb, J.P.; Walsh, G.O.; Babb, T.L.; Walter, R.D.; Crandall, P.H.; Tassinari, C.A.; Portera, A.; Scheffner, D. A comparison of EEG seizure patterns recorded with surface and depth electrodes in patients with temporal lobe epilepsy. Epilepsia 1976, 17, 137–160. [Google Scholar] [CrossRef] [PubMed]
- Spencer, S.S.; Spencer, D.D. Implications of seizure termination location in temporal lobe epilepsy. Epilepsia 1996, 37, 455–458. [Google Scholar] [CrossRef] [PubMed]
- Brekelmans, G.J.F.; Velis, D.N.; van Veelen, C.W.; van Rijen, P.C.; da Silva, F.H.; Van Emde Boas, W. Intracranial EEG seizure-offset termination patterns: Relation to outcome of epilepsy surgery in temporal lobe epilepsy. Epilepsia 1998, 39, 259–266. [Google Scholar] [CrossRef] [PubMed]
- Jan, M.M.; Sadler, M.; Rahey, S.R. Lateralized postictal EEG delta predicts the side of seizure surgery in temporal lobe epilepsy. Epilepsia 2001, 42, 402–405. [Google Scholar] [CrossRef] [PubMed]
- Yang, L.; Worrell, G.A.; Nelson, C.; Brinkmann, B.; He, B. Spectral and spatial shifts of post-ictal slow waves in temporal lobe seizures. Brain 2012, 135, 3134–3143. [Google Scholar] [CrossRef] [PubMed]
- Engel, J., Jr.; Van Ness, P.C.; Rasmussen, T.B.; Ojemann, L.M. Outcome with respect to epileptic seizures. In Surgical Treatment of the Epilepsies; Engel, J., Jr., Ed.; Raven Press: New York, NY, USA, 1993; pp. 609–621. [Google Scholar]
- Pastor, J.; Hernando-Requejo, V.; Dominguez-Gadea, L.; De Llano, I.; Meilian-Paz, M.L.; Martinez-Chacon, J.L.; Sola, R.G. Impact of experience on improving the surgical outcome in temporal lobe epilepsy. Rev. Neurol. 2005, 41, 709–716. [Google Scholar] [PubMed]
- Sola, R.G.; Hernando, V.; Pastor, J.; Navarrete, E.G.; de Felipe, J.; Alijarde, M.T. Pharmacoresistant temporal-lobe epilepsy. Exploration with foramen ovale electrodes and surgical outcomes. Rev Neurol. 2005, 41, 4–16. [Google Scholar] [PubMed]
- Pastor, J.; Sola, R.G.; Hernando-Requejo, V.; Navarrete, E.G.; Pulido, P. Morbidity associated with the use of foramen ovale electrodes. Epilepsia 2008, 49, 464–469. [Google Scholar] [CrossRef] [PubMed]
- Wieser, G.H.; Schwarz, U. Topography of foramen ovale electrodes by 3D image reconstruction. Clin Neurophysiol. 2001, 112, 2053–2056. [Google Scholar] [CrossRef]
- Sanz-García, A.; Vega-Zelaya, L.; Pastor, J.; Torres, C.V.; Sola, R.G.; Ortega, G.J. Network Analysis of Foramen Ovale Electrode Recordings in Drug-resistant Temporal Lobe Epilepsy Patients. J. Vis. Exp. 2016, 118, e54746. [Google Scholar] [CrossRef] [PubMed]
- Bhardwaj, S.; Jadhav, P.; Adapa, B. Online and automated reliable system design to remove blink and muscle artefact in EEG. In Proceedings of the 2015 37th Annual International Conference of the IEEE Engineering in Medicine and Biology Society (EMBC), Milan, Italy, 25–29 August 2015; pp. 6784–6787.
- Kwon, Y.; Kim, K.I.; Tompkin, J.; Kim, J.H.; Theobalt, C. Efficient learning of image super-resolution and compression artifact removal with semi-local Gaussian processes. IEEE Trans. Pattern Anal. Mach. Intell. 2015, 37, 1792–1805. [Google Scholar] [CrossRef] [PubMed]
- Urigüen, J.A.; Garcia-Zapirain, B. EEG artifact removal—State-of-the-art and guidelines. J. Neural Eng. 2015, 12, 031001. [Google Scholar] [CrossRef] [PubMed]
- Vega-Zelaya, L.; Pastor, J.; de Sola, R.G.; Ortega, G.J. Disrupted Ipsilateral Network Connectivity in Temporal Lobe Epilepsy. PLoS ONE 2015, 10, e0140859. [Google Scholar] [CrossRef] [PubMed]
- Blanco, S.; Garcia, H.; Quian Quiroga, R.; Romanelli, L.; Rosso, O.A. Stationarity of the EEG series. IEEE Eng. Med. Biol. Mag. 1995, 14, 395–399. [Google Scholar] [CrossRef]
- Ortega, G.J.; Peco, I.H.; Sola, R.G.; Pastor, J. Impaired mesial synchronization in temporal lobe epilepsy. Clin. Neurophysiol. 2011, 122, 1106–1116. [Google Scholar] [CrossRef] [PubMed]
- Vega-Zelaya, L.; Pastor, J.; Sola, R.G.; Ortega, G.J. Inhomogeneous Cortical Synchronization and Partial Epileptic Seizures. Front. Neurol. 2014, 5, 187. [Google Scholar] [CrossRef] [PubMed]
- Rosenblum, M.G.; Pikovsky, A.S.; Kurths, J. Phase synchronization of chaotic oscillators. Phys. Rev. Lett. 1996, 76, 1804–1807. [Google Scholar] [CrossRef] [PubMed]
- Schindler, K.; Leung, H.; Elger, C.E.; Lehnertz, K. Assessing seizure dynamics by analysing the correlation structure of multichannel intracranial EEG. Brain 2007, 130, 65–77. [Google Scholar] [CrossRef] [PubMed]
- Jiruska, P.; de Curtis, M.; Jefferys, J.G.; Schevon, C.A.; Schiff, S.J.; Schindler, K. Synchronization and desynchronization in epilepsy: Controversies and hypotheses. J. Physiol. 2013, 591, 787–797. [Google Scholar] [CrossRef] [PubMed] [Green Version]
- Blumenfeld, H. Impaired consciousness in epilepsy. Lancet Neurol. 2012, 11, 814–826. [Google Scholar] [CrossRef]
- Englot, D.J.; Yang, L.; Hamid, H.; Danielson, N.; Bai, X.; Marfeo, A.; Yu, L.; Gordon, A.; Purcaro, M.J.; Motelow, J.E.; et al. Impaired consciousness in temporal lobe seizures: Role of cortical slow activity. Brain 2010, 133, 3764–3777. [Google Scholar] [CrossRef] [PubMed]
- Evangelista, E.; Bénar, C.; Bonini, F.; Carron, R.; Colombet, B.; Régis, J.; Bartolomei, F. Does the thalamo-cortical synchrony play a role in seizure termination? Front. Neurol. 2015, 6, 192. [Google Scholar] [CrossRef] [PubMed]
- Afra, P.; Jouny, C.C.; Bergey, G.K. Termination patterns of complex partial seizures: An intracranial EEG study. Seizure 2015, 32, 9–15. [Google Scholar] [CrossRef] [PubMed]
- Berg, A.T.; Scheffer, I.E. New concepts in classification of the epilepsies: Entering the 21st century. Epilepsia 2011, 52, 1058–1062. [Google Scholar] [CrossRef] [PubMed]
- Giannakakis, G.; Sakkalis, V.; Pediaditis, M.; Tsiknakis, M. Methods for seizure detection and prediction: An overview. In Modern Electroencephalographic Assessment Techniques: Theory and Applications; Springer: New York, NY, USA; pp. 131–157.
- Rosso, O.A.; Blanco, S.; Yordanova, J.; Kolev, V.; Figliola, A.; Schürmann, M.; Basar, E. Wavelet entropy: A new tool for analysis of short duration brain electrical signals. J. Neurosci. Methods 2001, 105, 65–75. [Google Scholar] [CrossRef]
- Sharma, R.; Pachori, R.B.; Acharya, U.R. An integrated index for the identification of focal electroencephalogram signals using discrete wavelet transform and entropy measures. Entropy 2015, 17, 5218–5240. [Google Scholar] [CrossRef]


| Patient/Seizure | Pre-Surgery Studies | Diagnosis & Surgery | ||||||||
|---|---|---|---|---|---|---|---|---|---|---|
| Patient | Gender | Age (Years) | Epilepsy Duration | Type of Seizure | Freq. | MRI | v-EEG (Inter/Ictal) | Diag. | Surgery | Outcome (Engel) |
| A | Fe | 30 | 16 | PC | w | R MS | BiM(R > L)/RM | R | R AMTR | I |
| B | Fe | 21 | 9 | PS | w | R MS | RM/RM | R | R AMTR | I |
| C | Fe | 44 | 6 | PS | w | M asym | RM/RM | R | R AMTR | I |
| D | Fe | 36 | 35 | PC | w | R MS | RM/RM | R | R AMTR | I |
| E | Ma | 37 | 6 | PC | d | Normal | RM/RM | R | R AMTR | I |
| F | Ma | 47 | 26 | PC | w | R MS | RM/RM | R | R AMTR | I |
| G | Ma | 34 | 34 | PC | m | Bi MS | RM/RM | R | R AMTR | I |
| H | Ma | 48 | 43 | PC | m | R MS | RM/RM | R | R AMTR | I |
| I | Fe | 34 | 33 | PS/PC | m | R MS | RM/RM | R | R AMTR | I |
| J | Fe | 42 | 28 | PC | w | M asym | BiM(L > R)/LM | L | L AMTR | I |
| K | Fe | 39 | 30 | PC | w | L MS | BiM(L > R)/LM | L | L AMTR | I |
| L | Ma | 45 | 24 | PS | m | M asym | BiM(L > R)/LM | L | L AMTR | I |
| M | Ma | 54 | 44 | PC | w | Bi MS | BiM(L > R)/LM | L | L AMTR | I |
| N | Fe | 22 | 5 | PC | w | Bi MS | LM/LM | L | L Lat Cort | I |
| O | Fe | 28 | 27 | PS | w | L MS | LM/LM | L | L AMTR | I |
| Measure | Changes | Slope | |
|---|---|---|---|
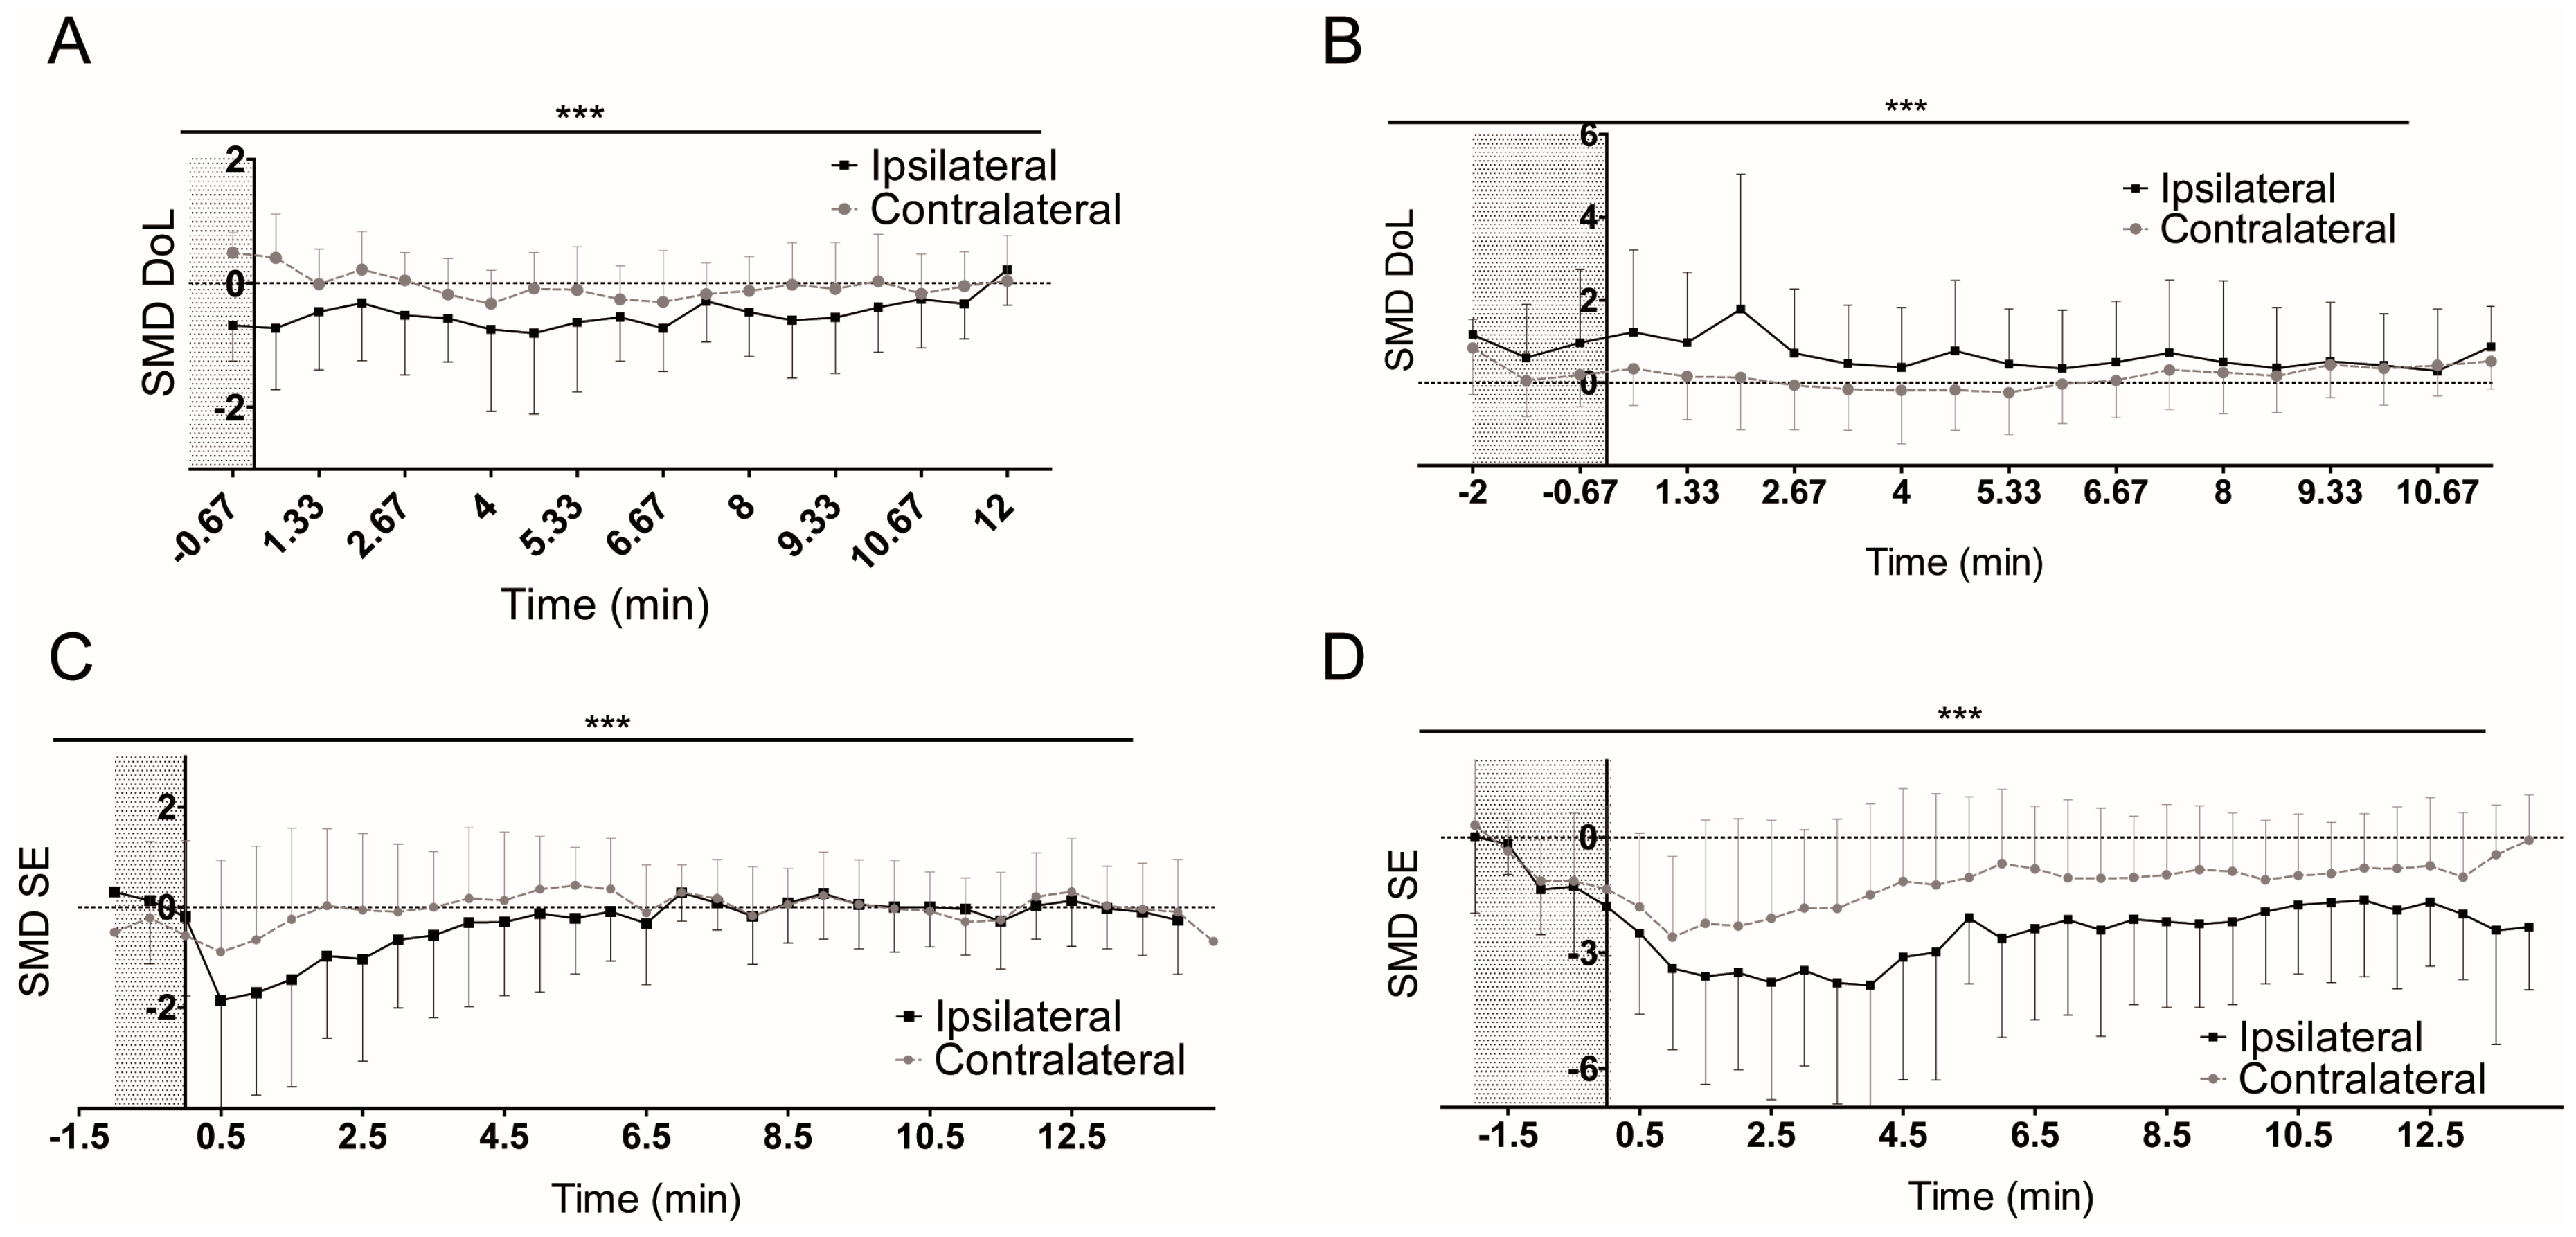
| Simple | DoL | Ipsi ↓, Contra = | n/a |
| SE | Ipsi ↓, Contra = | n/a | |
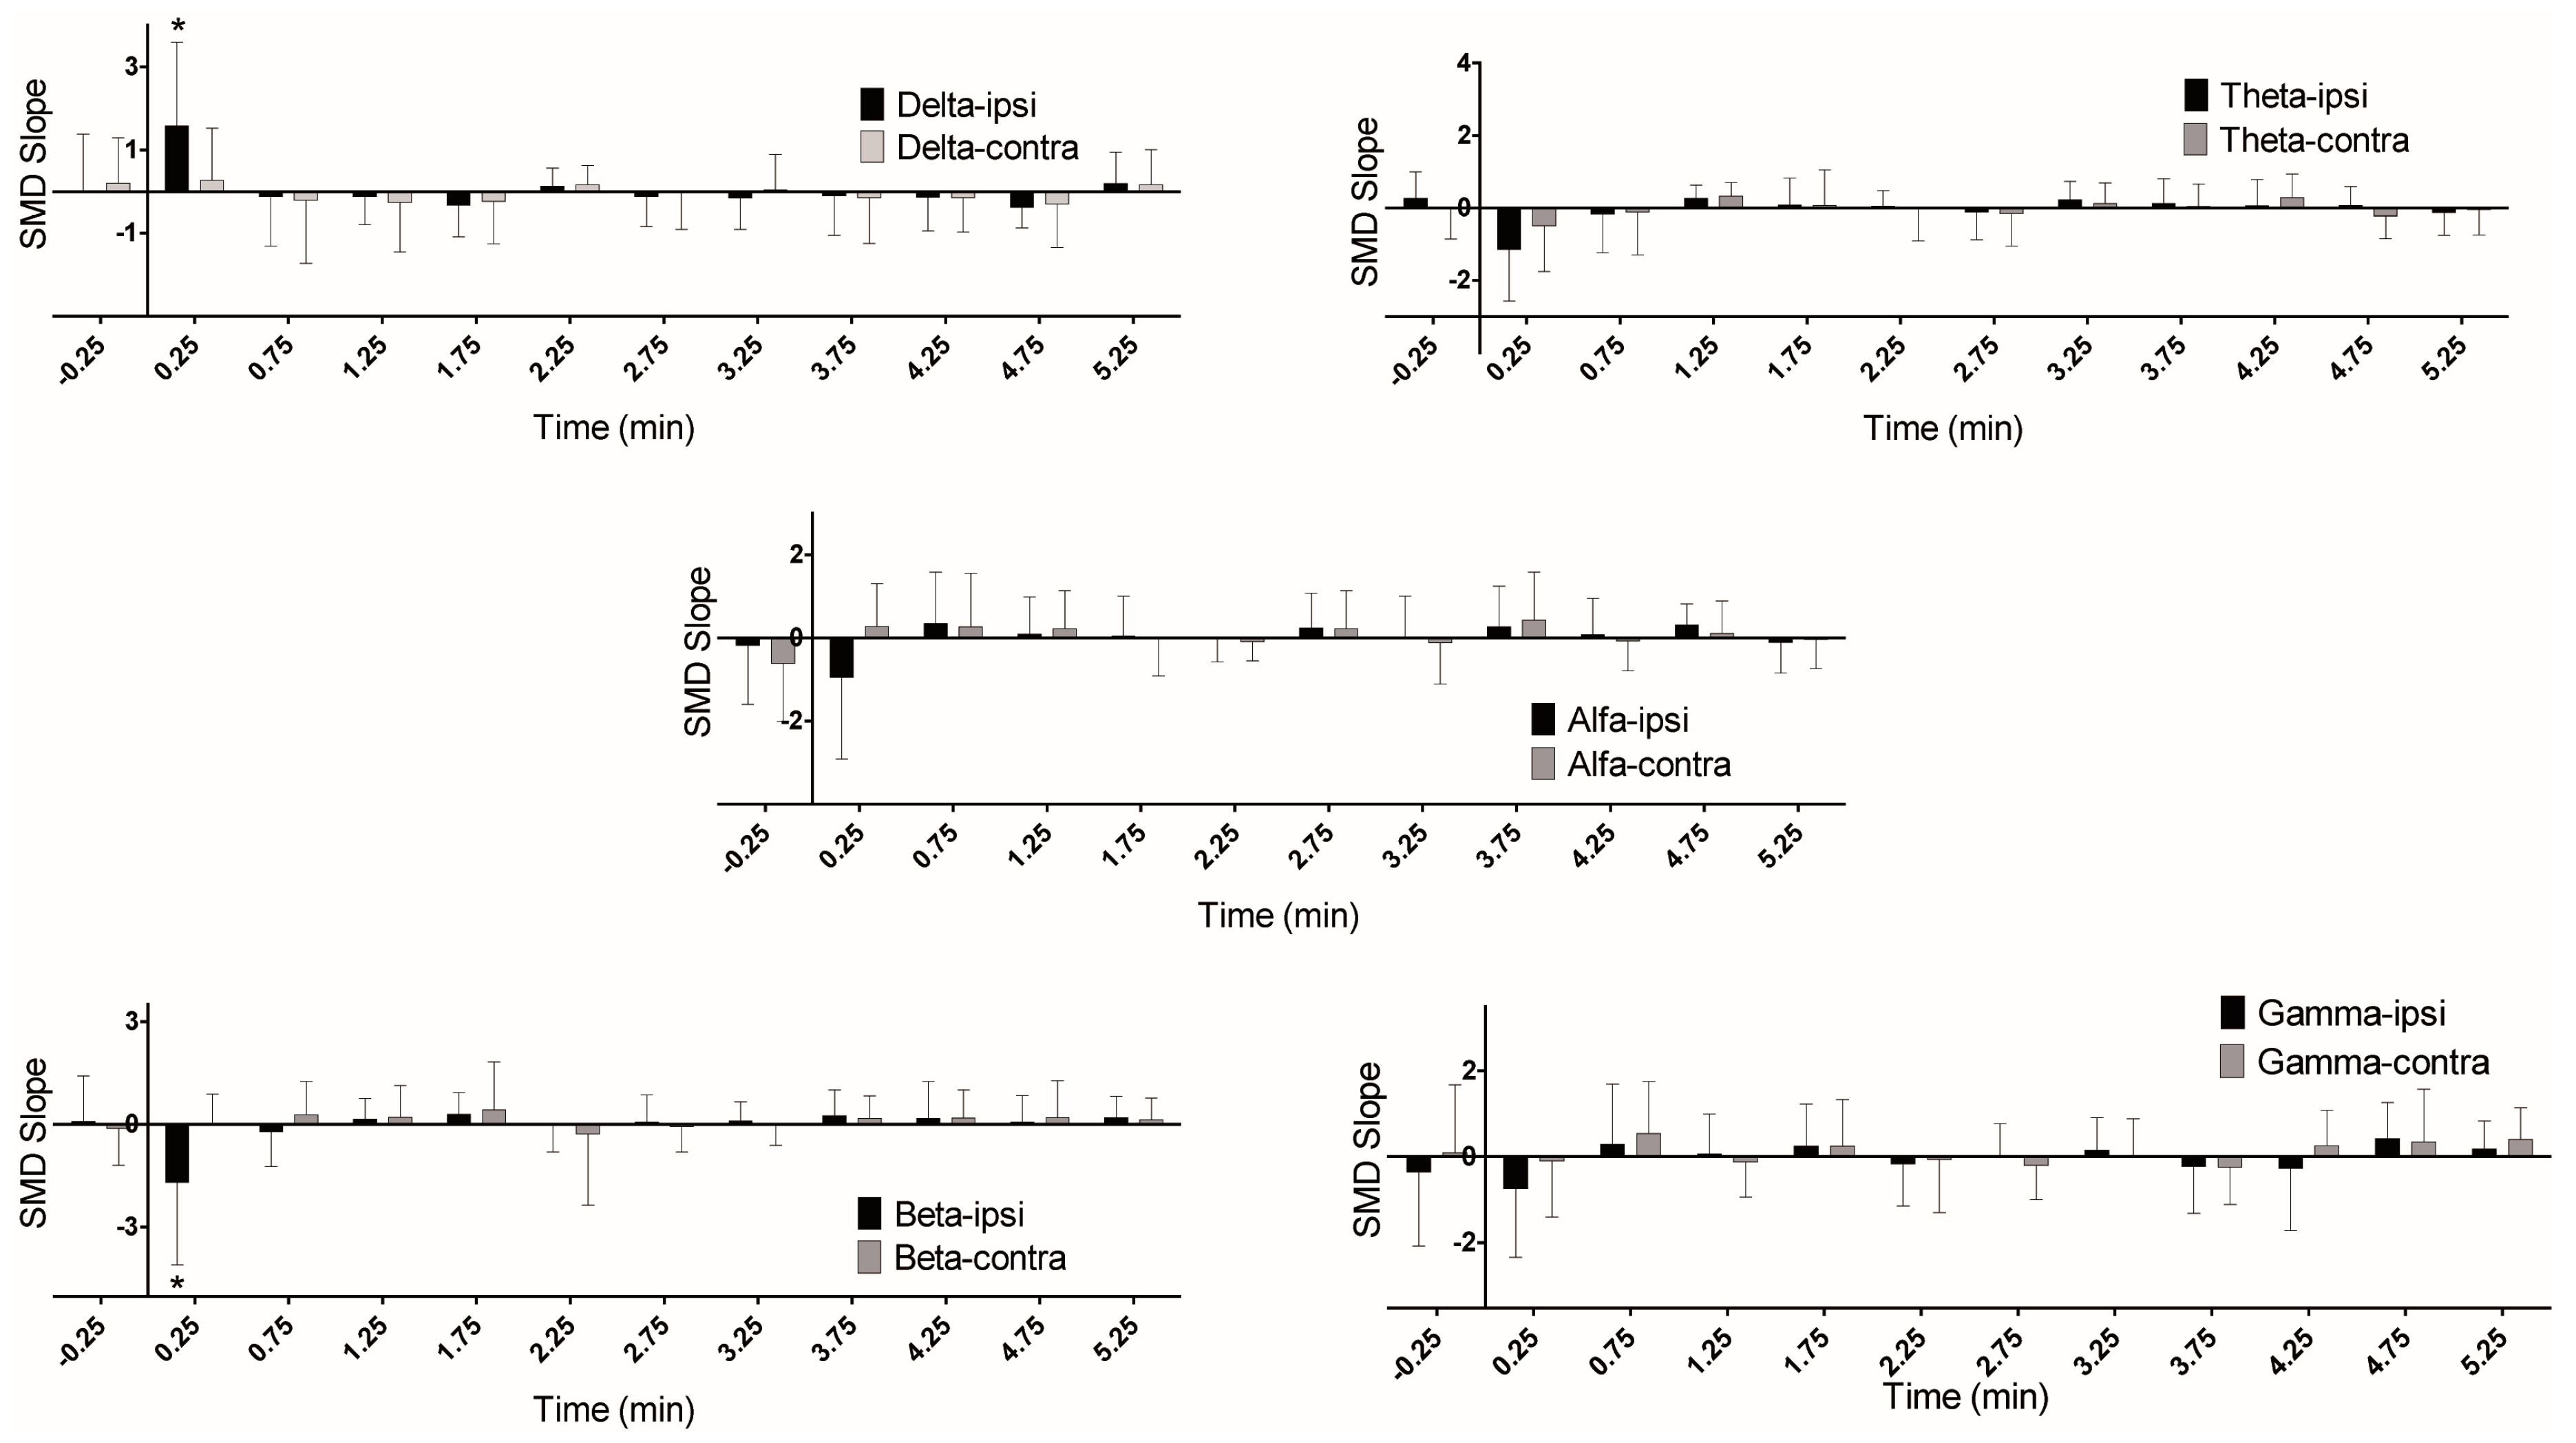
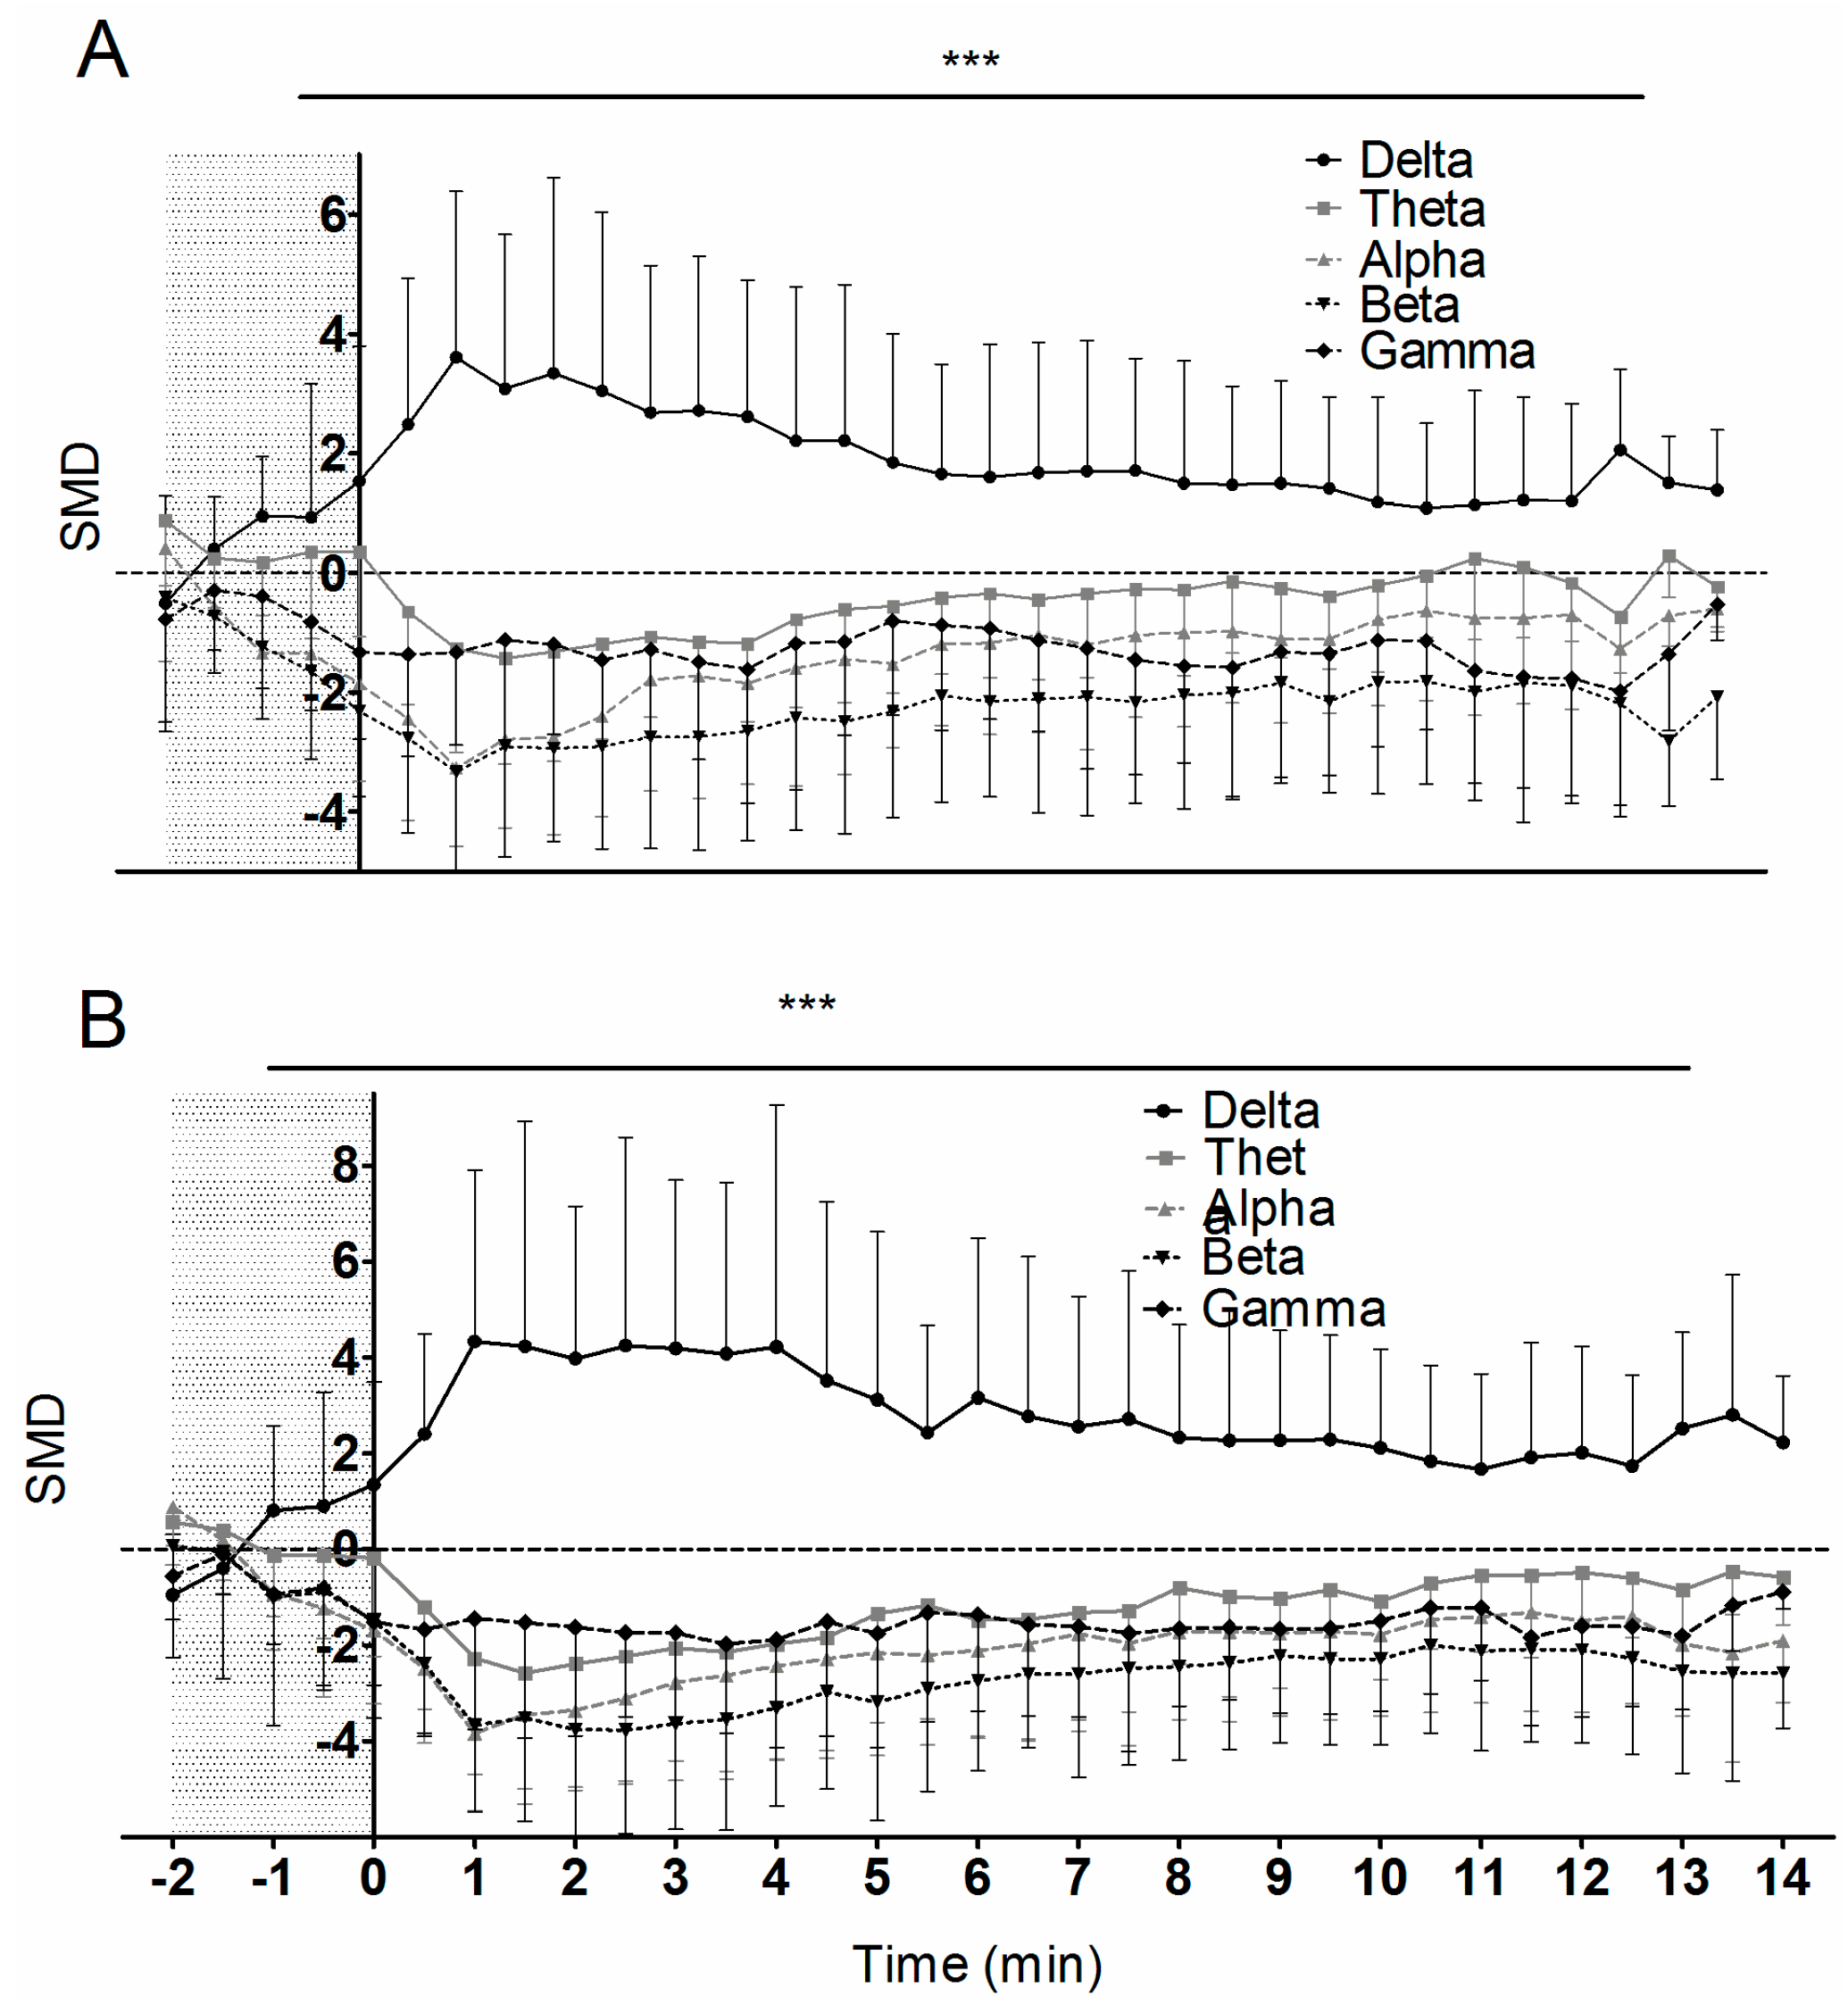
| Delta | Ipsi ↑, Contra = | Ipsi ↑ | |
| Beta | = | Ipsi ↓ | |
| Complex | DoL | Ipsi ↑, Contra NS | n/a |
| SE | Ipsi ↓, Contra ↓ | n/a | |
| Delta | Ipsi ↑, Contra ↑ | = |
© 2017 by the authors. Licensee MDPI, Basel, Switzerland. This article is an open access article distributed under the terms and conditions of the Creative Commons Attribution (CC BY) license ( http://creativecommons.org/licenses/by/4.0/).
Share and Cite
Sanz-García, A.; Vega-Zelaya, L.; Pastor, J.; Sola, R.G.; Ortega, G.J. Towards Operational Definition of Postictal Stage: Spectral Entropy as a Marker of Seizure Ending. Entropy 2017, 19, 81. https://doi.org/10.3390/e19020081
Sanz-García A, Vega-Zelaya L, Pastor J, Sola RG, Ortega GJ. Towards Operational Definition of Postictal Stage: Spectral Entropy as a Marker of Seizure Ending. Entropy. 2017; 19(2):81. https://doi.org/10.3390/e19020081
Chicago/Turabian StyleSanz-García, Ancor, Lorena Vega-Zelaya, Jesús Pastor, Rafael G. Sola, and Guillermo J. Ortega. 2017. "Towards Operational Definition of Postictal Stage: Spectral Entropy as a Marker of Seizure Ending" Entropy 19, no. 2: 81. https://doi.org/10.3390/e19020081