
Permutation Entropy for the Characterisation of Brain Activity Recorded with Magnetoencephalograms in Healthy Ageing


1
Centre for Biomedical Engineering, Department of Mechanical Engineering Sciences, Faculty of Engineering and Physical Sciences, University of Surrey, Guildford GU2 7XH, UK
2
Laboratorio Universidad Politécnica de Madrid-Universidad Complutense de Madrid (UPM-UCM) de Neurociencia Cognitiva y Computacional, Departamento de Psiquiatría y Psicología Médica, Universidad Complutense de Madrid, Madrid 28040, Spain
*
Author to whom correspondence should be addressed.
Entropy 2017, 19(4), 141; https://doi.org/10.3390/e19040141
Submission received: 30 January 2017
/
Revised: 14 March 2017
/
Accepted: 22 March 2017
/
Published: 25 March 2017
(This article belongs to the Special Issue Symbolic Entropy Analysis and Its Applications)
Abstract
:The characterisation of healthy ageing of the brain could help create a fingerprint of normal ageing that might assist in the early diagnosis of neurodegenerative conditions. This study examined changes in resting state magnetoencephalogram (MEG) permutation entropy due to age and gender in a sample of 220 healthy participants (98 males and 122 females, ages ranging between 7 and 84). Entropy was quantified using normalised permutation entropy and modified permutation entropy, with an embedding dimension of 5 and a lag of 1 as the input parameters for both algorithms. Effects of age were observed over the five regions of the brain, i.e., anterior, central, posterior, and left and right lateral, with the anterior and central regions containing the highest permutation entropy. Statistically significant differences due to age were observed in the different brain regions for both genders, with the evolutions described using the fitting of polynomial regressions. Nevertheless, no significant differences between the genders were observed across all ages. These results suggest that the evolution of entropy in the background brain activity, quantified with permutation entropy algorithms, might be considered an alternative illustration of a ‘nominal’ physiological rhythm.
1. Introduction
Neurophysiological studies of the human brain have long emphasised the rate of age effects in healthy individuals. Different studies have shown however that gender also plays an important role in the development of the brain throughout life [1,2,3,4].
The use of magnetoencephalograms (MEGs) to study the background activity of the brain has increased over the years as magnetoencephalography, a non-invasive analysis technique used to record the magnetic fields generated by electrical activity in the human brain [5,6,7], has become more widespread. Large arrays of superconducting quantum interface devices (SQUIDs) immersed in liquid helium at 4.2 K and below, are used to record the weak magnetic fields generated by the brain in a magnetically shielded room to reduce contamination by environmental noise [8,9,10].
The brain, as the main centre for the processing of all levels of activity, coordination, conscious and subconscious movement, is made up of soft nervous tissue and is one of the largest organs in the body [11,12,13]. The brain is subject to changes with age and thus, many studies have been conducted in a bid to understand how the structure and function of the brain are affected by the ageing process [14,15].
Brain growth can be divided into two stages; maturation, which lasts on average three to four decades, and ageing which starts in the 4th decade [15]. During maturation, the brain develops steadily, one area at a time with several post-mortem studies describing a general pattern of posterior to anterior maturation [14]. Furthermore, studies evaluating the changes in the oscillation frequencies in the brain have been able to reveal some of the changes the brain undergoes during maturation [3,16,17,18,19]. Ageing effects such as the steady shrinking of the brain, deterioration of the myelin sheaths and decreasing hormone levels [5,9,20,21] have also been studied with results observed being similar to those occurring in adolescence, but with decreased rate so that the transitions were not as radical during maturation [19,22,23]. From studies in the literature [15,20,24,25,26], it is evident that the effects of ageing have a greater effect on the anatomy of the brain, while maturation has a greater impact on the functioning, integration and connectivity of the brain.
Age-related changes of the electrical and magnetic activity of the brain have been investigated by means of conventional linear analysis, non-linear methods such as correlation dimension [2], fractal dimension [27], Lempel–Ziv complexity [4] as well as estimators such as sample entropy and multiscale entropy [28]. Results from these studies combined with various statistical analyses have been able to reveal the significant effects of age and gender on the brain.
Entropy is a measure that can be used to characterise the complexity of a time series so as to aid the identification and quantification of regular (e.g., periodic) signals, random signals, and chaotic signals. Many entropy measures have been proposed in recent years, such as Kolmogorov (or metric) entropy [29,30], approximate entropy (ApEn) [31,32] entropy of symbolic dynamics (SymDyn) [33], permutation entropy (PE) [34,35] and modified permutation entropy (mPE) [36].
Symbolic dynamics is arguably a computationally efficient way to analyse the dynamics of a time series. This branch of analysis techniques is an area of increasing research in the neuroscience field and has the potential to both highlight and characterise various effects of age, gender, pathology, etc., on the brain. PE is one such method that falls into the category of symbolic dynamics [37].
PE is a simple, robust and computationally efficient method that can be used to estimate the complexity of a time series whilst also taking into account the temporal order of these values. In addition to this, PE can be used to determine embedding parameters as well as to identify couplings between time series [38]. PE characterises the permutation patterns in a time series and directly accounts for the temporal information in the time series [9]. PE operates under the assumption that the time series under study has a continuous distribution. In spite of the proficiency of PE in time series analysis, the technique neglects equalities within signals, using the reasoning that in a continuous series, data-points with equal values are rare and can be ignored [36]. It must be noted that in PE the partitions are derived from comparing a data-point with its neighbouring data-points and in so doing, it emphasises that the technique is applicable to all series, even non-stationary chaotic series [9].
Over the years, various improvements to PE have been made in a bid to improve the results obtained by using the method. Such improvements include the introduction of: fine-grained PE (FGPE) which makes use of a precision regulation factor to incorporating the size of the differences between data-points into permutations [39]. Weighted PE (WPE) which is a method based on weighted PE patterns and depends on the amplitudes of constituent data points, multiscale PE which can account for the relative complexity of time series over multiple scales [40,41] multivariate multi-scale PE which incorporates the simultaneous analysis of multi-channel data in its analysis [42,43] and composite multi-scale permutation entropy (CMSPE) which can accurately account for subtle transitions in the time series more accurately that PE [44].
The introduction of a modification to PE where equal data of the embedding vector are mapped to the same rank led to a quantity called modified permutation entropy (mPE) by Bian et al. [36]. Their reasoning was that low resolution discrete signals tend to have repeated equal values which may be indicative of a feature of a system, therefore neglecting these repetitions, as done in PE, could result in the incorrect description of the complexity of a time series. However, though the motivation behind their work may have been centred on the fact that equalities are more frequent within discrete low resolution signals, it cannot be said as to whether or not mPE would be more proficient that PE when applied to all continuous signals even with low resolutions [36].
The aim of this pilot study was to determine the “normal” behaviour of PE according to age and gender influences in a large population. In this study we hypothesised that PE can highlight the changes imposed on resting state MEG by age and gender. As evidenced above, there are many different PE modifications. However, as all the modifications have embedded in them the original PE algorithm, this study makes use of the original PE. In addition, mPE was also be used in this study to determine if background MEG resting state activity contains significant repetitive activity throughout life.
The structure of this paper is as follows: Section 2 contains a description of the MEG data used as well as brief descriptions of the PE and mPE algorithms, results from the study are presented and described in Section 3, while Section 4 has a detailed discussion of the results and their relevance. The conclusions of the study are presented in Section 5.
2. Materials and Methods
MEGs were recorded in a shielded room using a whole head neuroimaging magnetometer (neuromag with the layout shown in Figure 1) with 148 channels (MAGNES 2500WH, 4D Neuroimaging) at the “Centro de Magnetoencefalografía Dr. Pérez-Modrego” (Madrid, Spain). The subjects lay comfortably awake in a relaxed state with eyes closed while 5 min of data were acquired. The MEGs were recorded at sampling frequency of 678.17 Hz using a hardware band-pass filter from 0.1 to 200 Hz. These recordings were then down-sampled to 169.549 Hz. A digital Hamming window finite impulse response band-pass filter of order 560 with corner frequencies at 1.5 Hz and 40 Hz was used to filter the data. The function filtfilt (MATLAB version 2016a) was used to avoid phase shift as it filters in the forward and reverse directions. Consequently, the resulting sequence has precisely zero-phase distortion and doubles the filter order [37]. This filtering process resulted in the removal of artefacts such as mains hum. Randomly spaced artefacts such as squid jumps and eye blinks were difficult to eliminate as they occurred rarely and only affected a few individuals in the sample population. However, these few random noise contaminations were not significant enough to skew the results.
The data set used was made up of 220 (98 male/122 female) healthy participants. Subjects ranged from 7 to 84 years, with no significant differences in terms of age found between males (mean ± standard deviation 42.92 ± 21.0) and females (45.0 ± 22.1). Subjects were grouped according to age and Table 1 summarises the relevant information about the different age groups.
2.1. Permutation Entropy
Permutation entropy (PE) is an entropy-based calculation that identifies changes in the permutation patterns in a time series and directly accounts for the temporal information in the time series. PE is based on the premise of measuring the entropy within a time embedded series [9,44]. The computation relies on the selection of a suitable embedding dimension and time delay. Cao et al. [45] observed that a low embedding dimension of 3 or 4 was not suitable to accurately track the dynamical changes in a signal, with the study done by [36] revealing that as the embedding dimension increased, PE’s ability to discriminate between different groups increased. Therefore, this study investigated the effects of changing the embedding dimension between 3 and 7 to identify the most suitable value for use.
Any time series given by can be embedded in the m-dimensional space to obtain vectors with a time delay [34,36]:
where is the embedding dimension. Then, using the (time) index of the element in the reconstruction vector, each can be arranged in increasing order:
If is a permutation of [1, 2,…, m], describing the order relations among the coordinates of vector then there are m! possible permutations of , where k = 1, 2, …, m!. In this paper, we let be the probability for at any instant which resulted in these probabilities being estimated by the relative frequencies of their occurrence in the considered time series. As a result, the permutation entropy of order m is defined by the Shannon–Entropy of this probability distribution:
here we set if . The maximum value of is reached for a uniform distribution on all permutations, i.e., when for all . Therefore, permutation entropy could be normalised as:
where . The lower limit represents a more regular time series while the upper limit represents a more random series.
2.2. Modified Permutation Entropy
Modified PE is well defined also in the case of tied ranks. That means, some coordinates of the embedding vectors (1) might be equal. Hence, (2) is replaced by the more general case:
We assign now the same rank to equal values, and thus get more than m! order patterns. For instance, in the case m = 3 we get m! = 6 order patterns (1; 2; 3), (1; 3; 2), (2; 1; 3), (2; 3; 1), (3; 1; 2), (3; 2; 1) representing all vectors with no ties, and 7 additional patterns for the case of ties, (1; 2; 2), (2; 1; 1), (1; 2; 1), (2; 1; 2), (1; 1; 2), (2; 2; 1), and (1; 1; 1). In this way we distinguish all together 13 order patterns. In the general case, the number of possible order patterns is calculated by the Bell number:
Some values are given in Table 2.
Let denote the probability for the -th pattern, then mPE is defined like PE in (3), however, the index runs now until B(m) instead of m!. Moreover, the normalised mPE (nmPE) is now defined analogously to (4) as:
From B(m) > m! follows that we need longer time series for reliable estimates of with respect to mPE (m), unless there are many -values with = 0.
2.3. MEG Data Reduction and Analysis
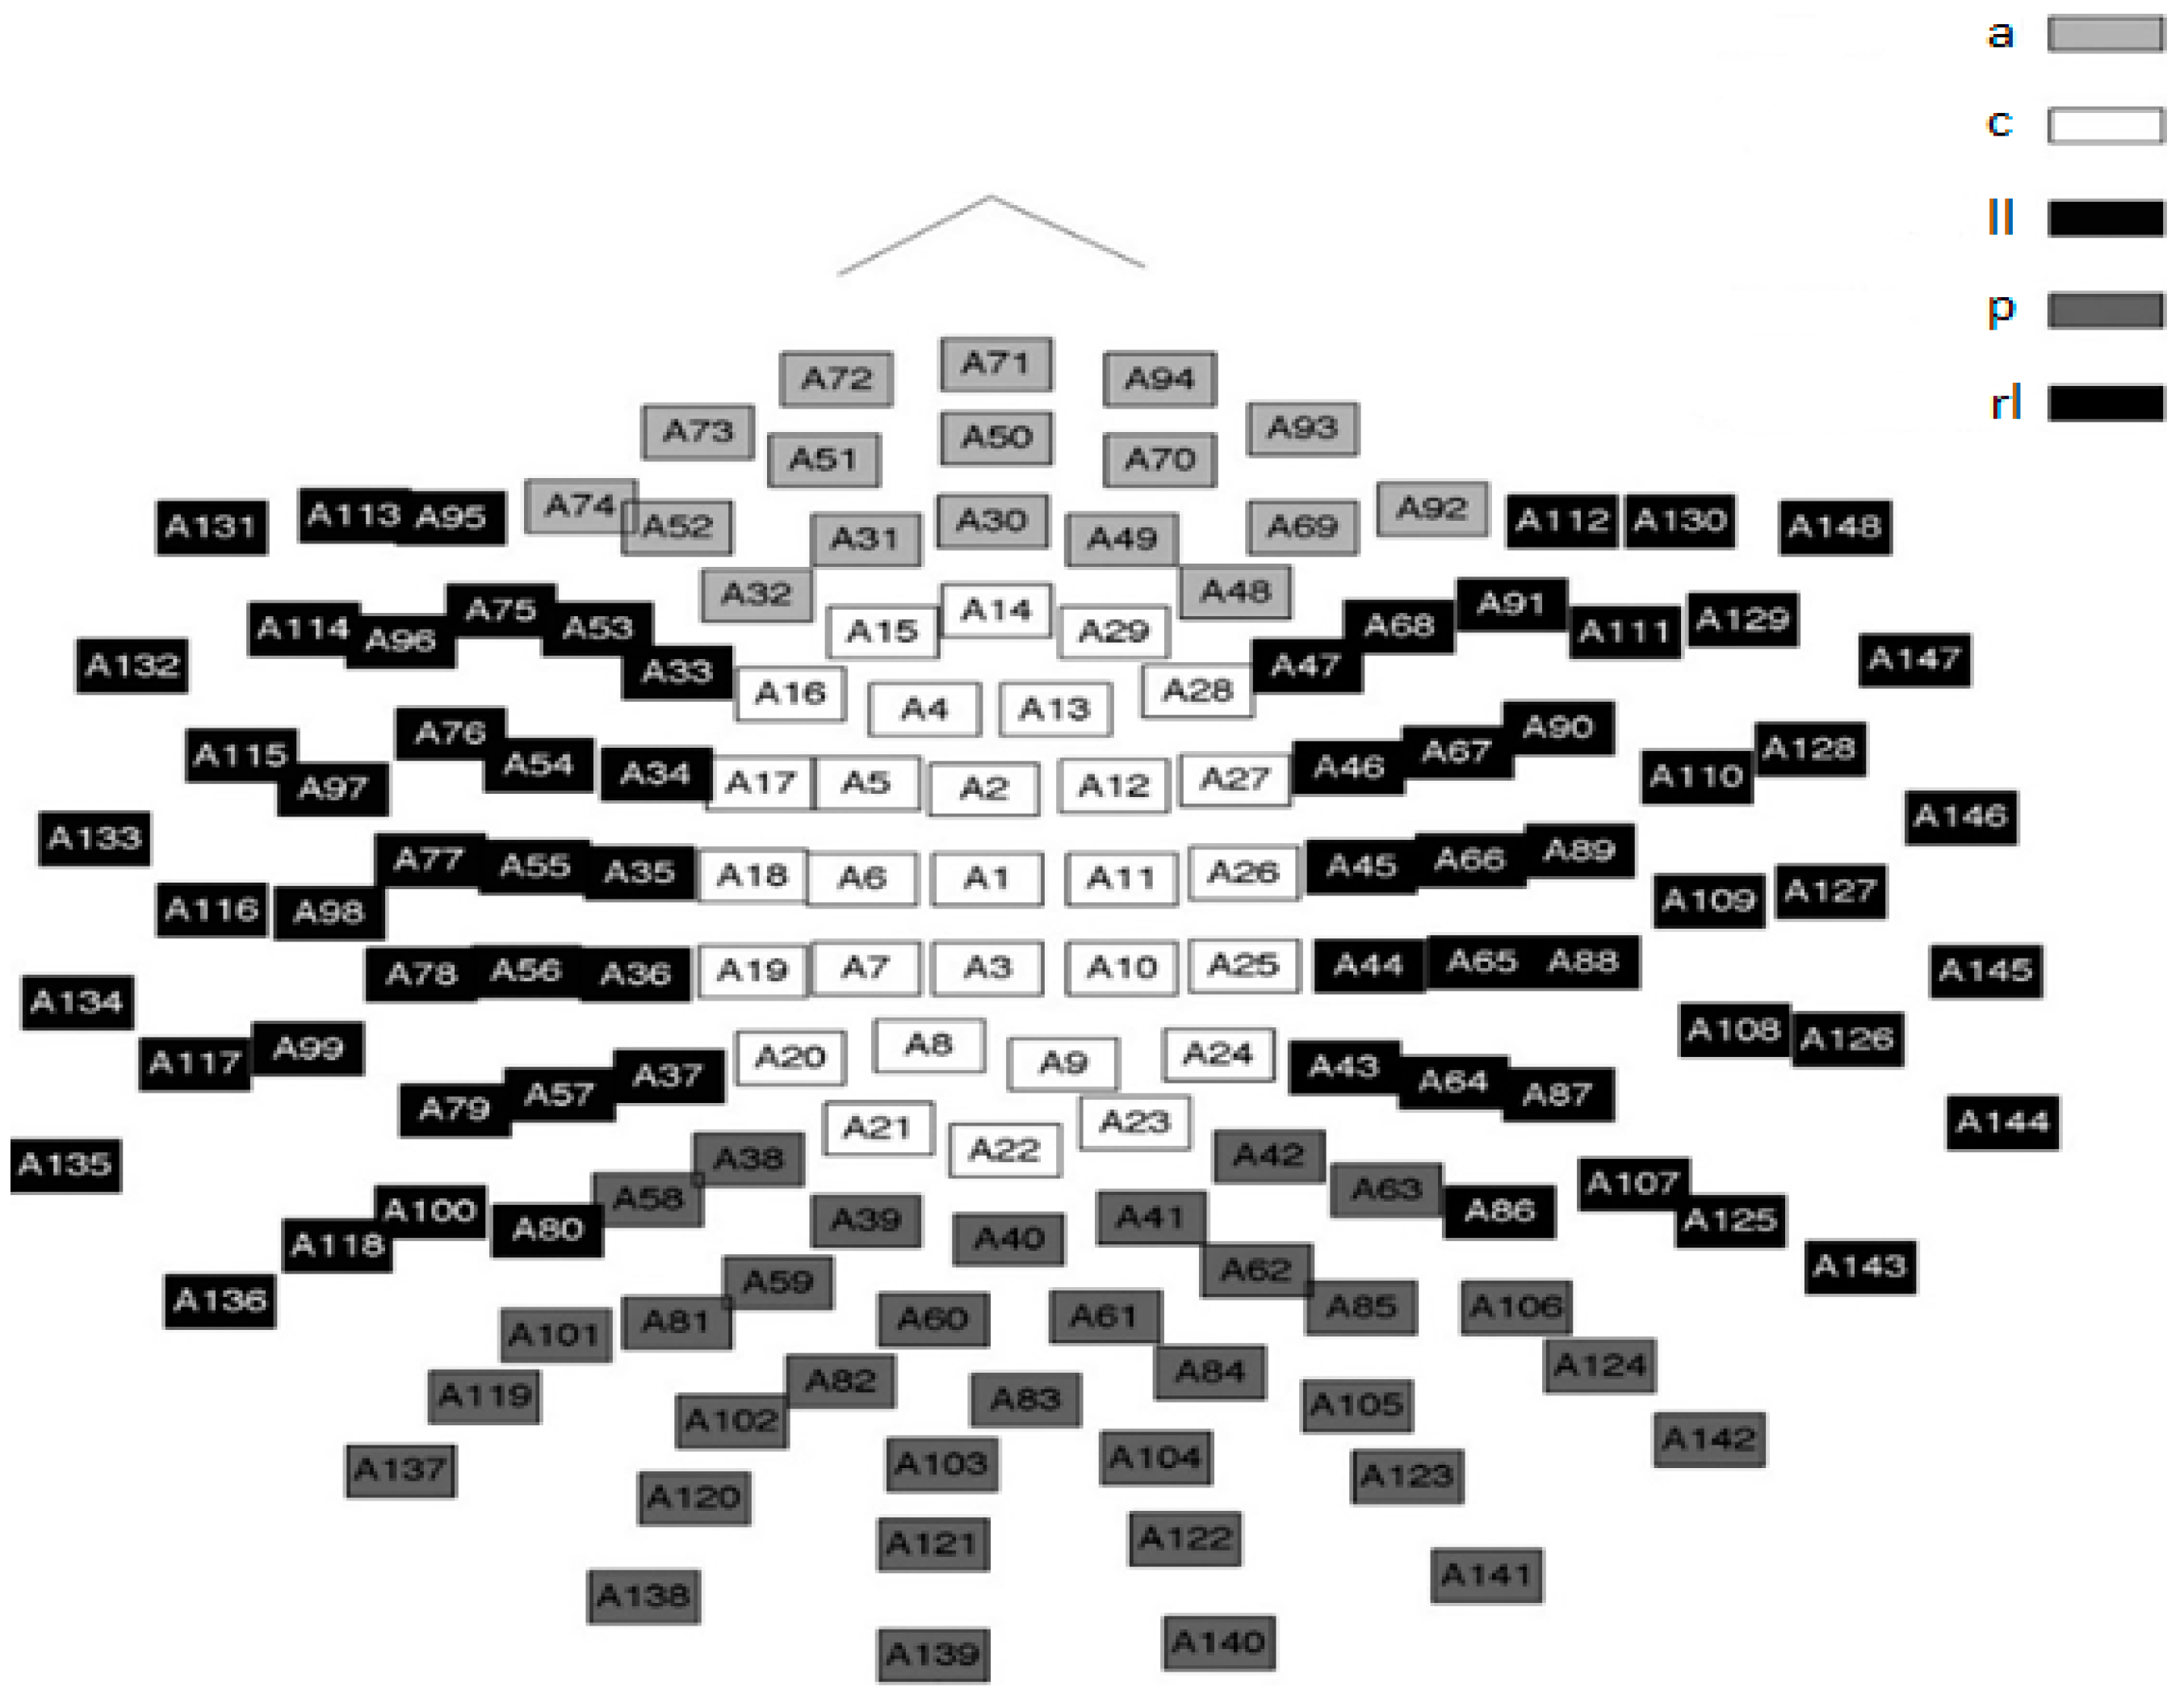
The values of nPE and nmPE were computed for each channel and participant (both males and females). Each algorithm was run for values of m ranging between 3 and 7 with the optimum embedded dimension for both methods of analysis, determined as m = 5. This study made use of time delay (lag) l = 1. Statistical analyses were performed with 148 nPE and nmPE scores per subject. The 148 nPE and nmPE values were averaged into five regions similar to work done by Fernández et al. [4] and Méndez et al. [46]: anterior (a), central (c), left lateral (ll), right lateral (rl) and posterior (p). Figure 1 illustrates the location of the sensors in the neuroimaging device as well as the brain regions to which they are nearest.
2.4. Statistical Analysis
The statistical analyses were performed using IBM Statistical Package for the Social Sciences (SPSS) Statistical Data Editor version 23, and probabilities were considered as significant. The differences between nPE and nmPE results were analysed using a two-tailed bivariate correlation analysis and pairwise sample t-test. For the bivariate correlation analysis the data was pre-analysed to ensure that it met the data requirements such as bivariate normality [47]. Likewise for the pairwise t-test the data used met all the requirements and there were no outliers in the difference between the groups [48]. The relationship between nmPE values and age was determined by means of linear and polynomial regression models. Furthermore, the effects of age and gender on nmPE variable was studied by means of two way analysis of variance (ANOVA), with Bonferroni correction used for multiple comparison tests.
3. Results
The first part of our study was an initial investigation to identify the ideal embedding dimension parameter to use for both the nPE and nmPE algorithms. The nPE and nmPE values were calculated for every individual for all 148 channels with m ranging from 3 to 7. Embedded dimension is an input parameter that is dependent on the sampling frequency and is used to define the length of the embedding vector used to analyse the MEG signals.
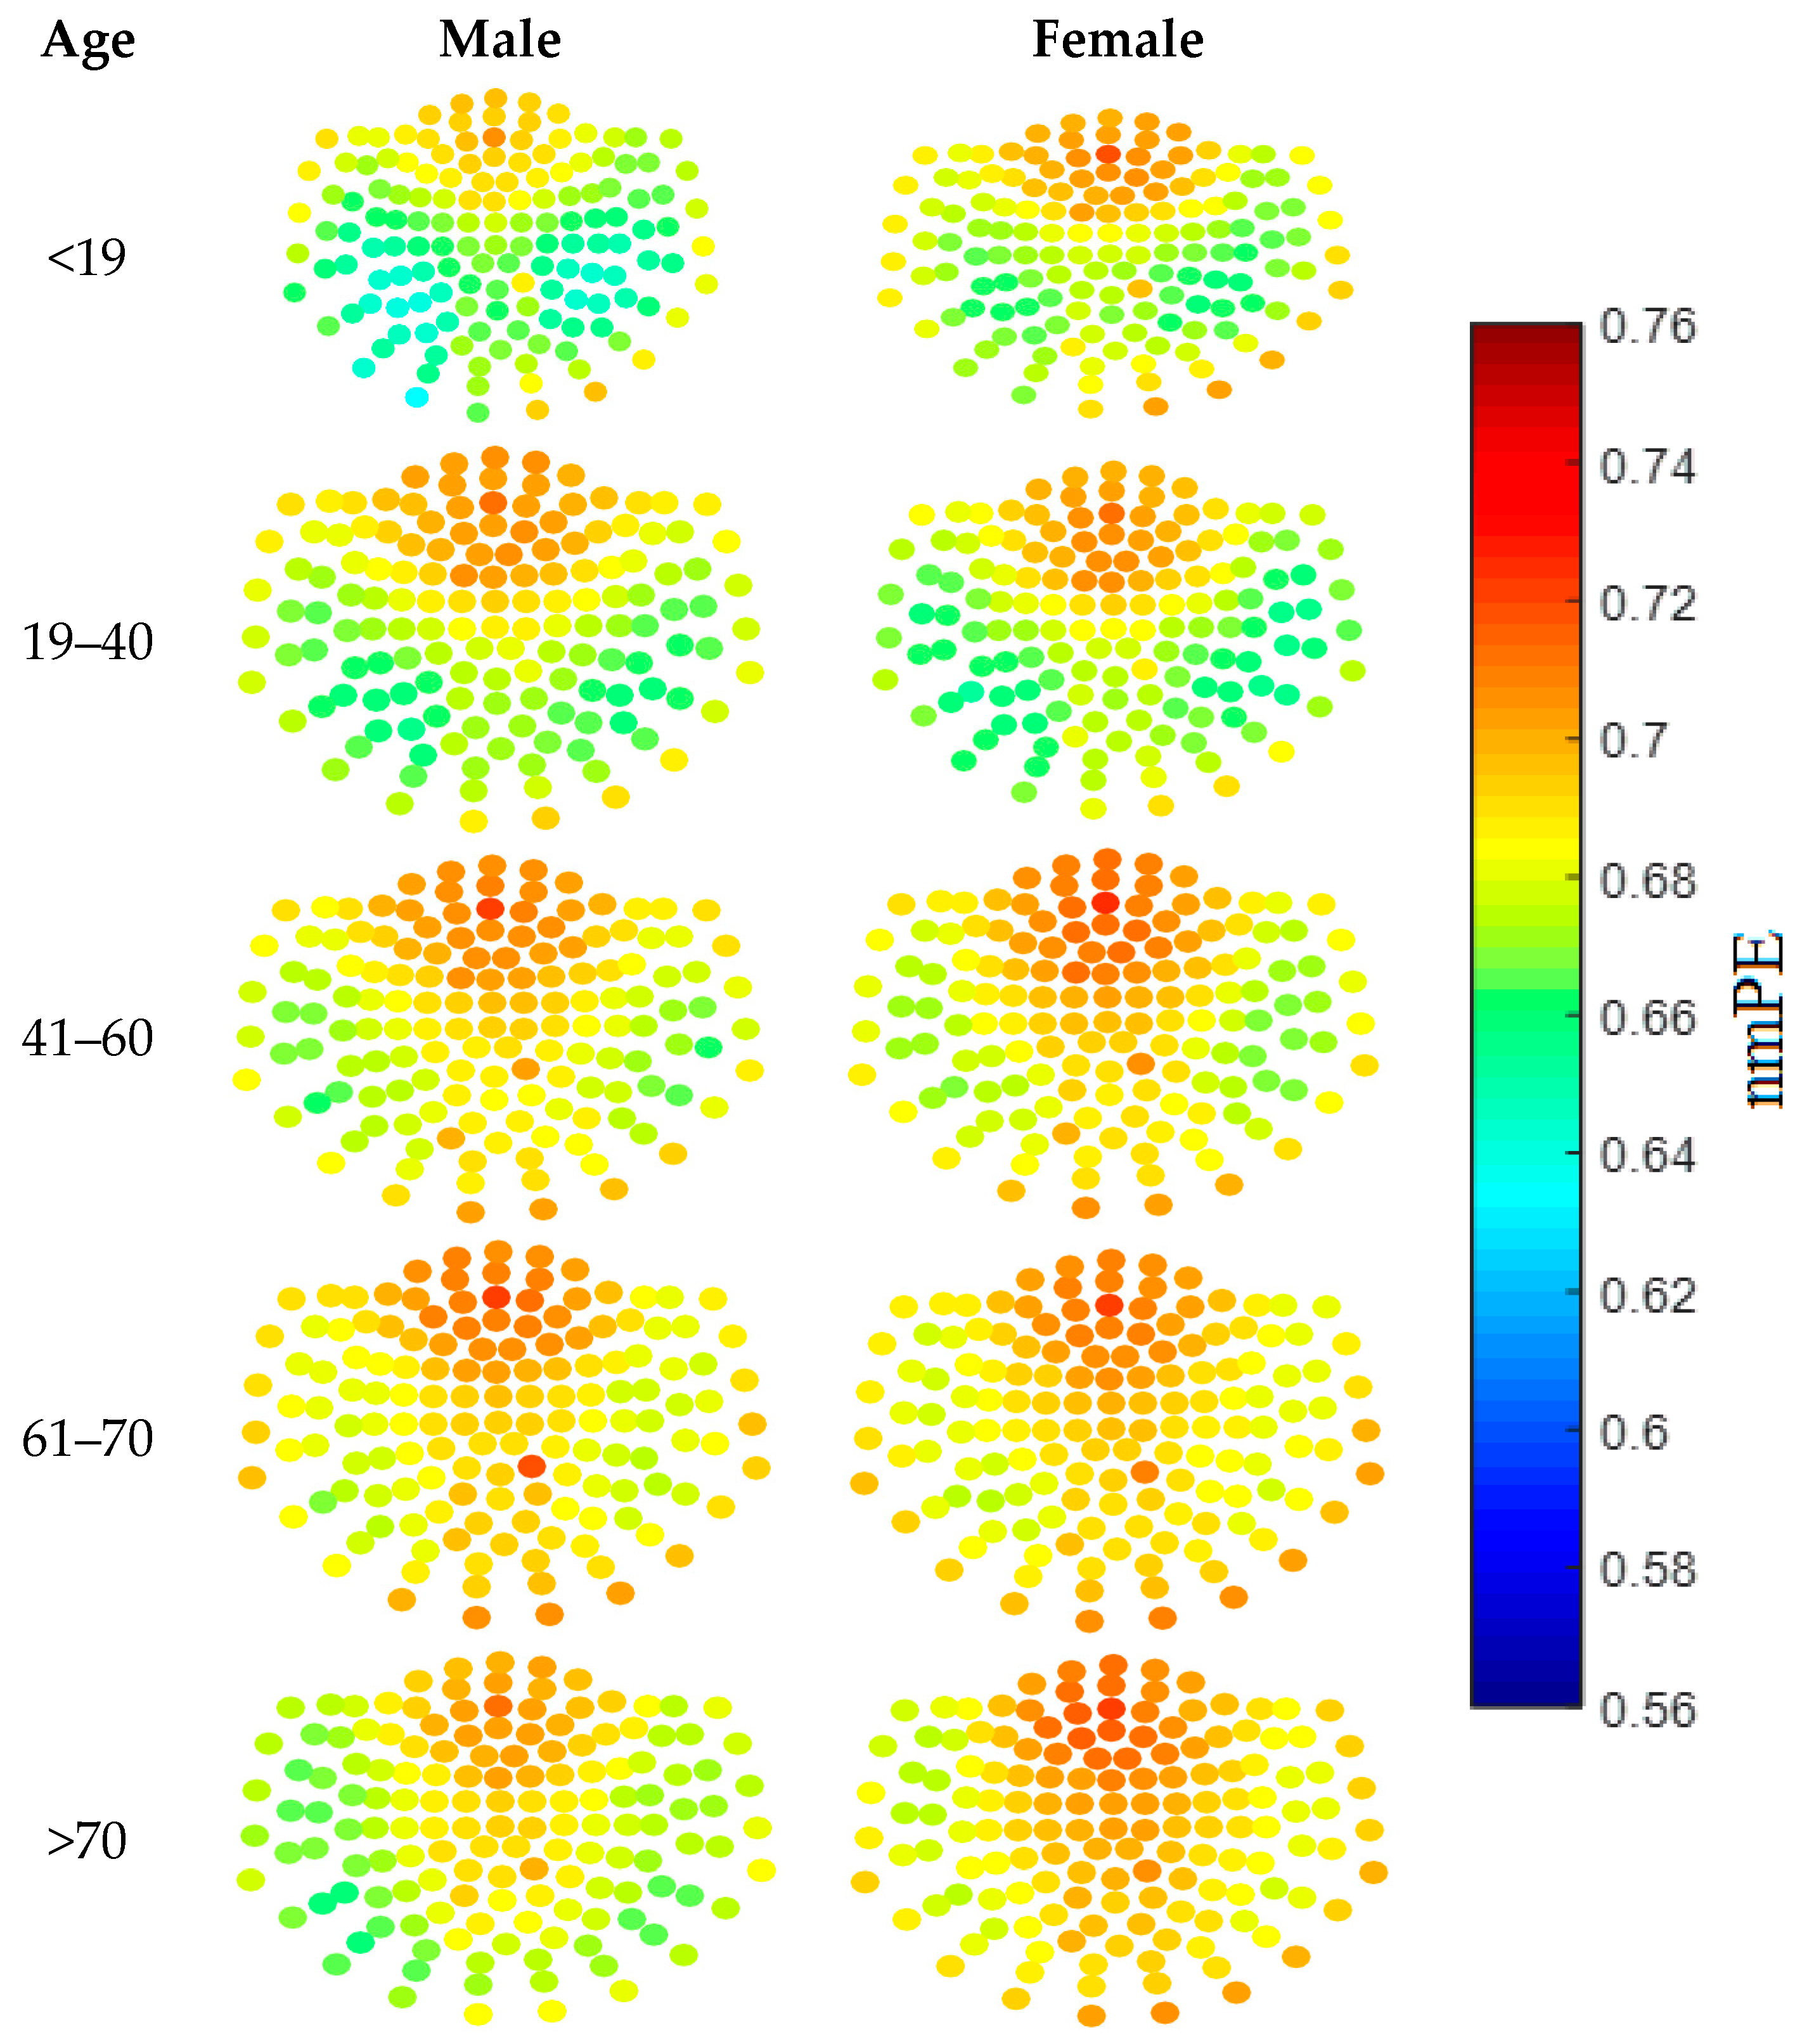
To assist in this selection process, a qualitative approach was taken, where visualisation of the results was done using both nmPE and nPE values. Results from this analysis showed that the ideal values for m ranged between 4 and 6 for nPE (with 5 showing the clearest visual differences), while for nmPE m = 4 and m = 5 yielded the best results. As m = 5 showed the clearest visual differences this value of m was used in the rest of the study. This qualitative stage provided a quick identification of the regions of the brain with higher PE than others. In addition to this, it acted as a visual tool to inspect how the values of each node sensor, and broadly each brain region, changed with age. For instance the sensor nodes with highest PE values for both genders are located over the anterior region of the brain. Moreover, females in group 5 (i.e., >70 years), have sensor nodes with higher nmPE values in the anterior and central regions of the brain when compared to their male counterparts. Though these qualitative analyses may not be used to determine significance, the use of colour maps as a visualisation tool can highlight areas of the brain with potentially interesting information between inter- and intra- gender and age groups.
Figure 2 shows the qualitative results obtained using m = 5. As can be observed in the figure, the colours represent the nmPE values for that channel, with lower nmPE values represented by colder colours on the maps and implying less irregularity in the time series, while higher values of nmPE are represented by warmer colours and imply the presence of higher irregularities in the time series. Figure 3 shows the average values of the nPE and nmPE results in the five regions of the brain. The results, from the bivariate Pearson’s correlation analysis, showed there was a strong correlation greater than 0.998 with p < 0.0001 between nPE and nmPE results for males and >0.901 with p < 0.0001 between nPE and nmPE results for females across all brain regions, thus indicating a high correlation between the results from nPE and nmPE. The pairwise t-test evaluation of the spread of the data obtained from PE and nmPE was then conducted and it was observed that for both males and females there were no significant differences in terms of the results obtained by both methods (p > 0.05).
To determine if the resting state MEG signals contained a significant amount of repeated information in the continuous series, an exploratory analysis describing data according to these two variables was conducted, after which the results from nPE and nmPE were compared. Subjects were divided into groups by age and gender as shown in Table 1. A two-tailed bivariate Pearson’s correlation analysis and pairwise t-test were done to establish if the results obtained from using PE were significantly different to those obtained using nmPE.
Figure 3 also summarises the evolution of nmPE and nPE values for both males and females with age. Slight differences between nPE and nmPE values for males were observed in the central region (nPE > nmPE) for the 41–60 years age range only. Additionally, very small differences for females were also observed in the following regions: 19–40 years (group 2)—central (nmPE < nPE) and left lateral region (nPE < nmPE), 61–70 years (group 4)—anterior region (nPE < nmPE) and >70 years (group 5)—anterior (nPE < nmPE), central (nmPE < nPE), posterior (nmPE < nPE) and right lateral (nPE < nmPE).
As can be seen in Figure 3, the values for nmPE and nPE were very similar. Therefore, once the initial analyses to observe the differences between the results from nPE and nmPE were concluded, the remaining analyses were done using just the nmPE results. The results from the nmPE algorithm were used because the algorithm can be viewed as being more robust than nPE due to its ability to account for repetitive activity in the resting brain [36].
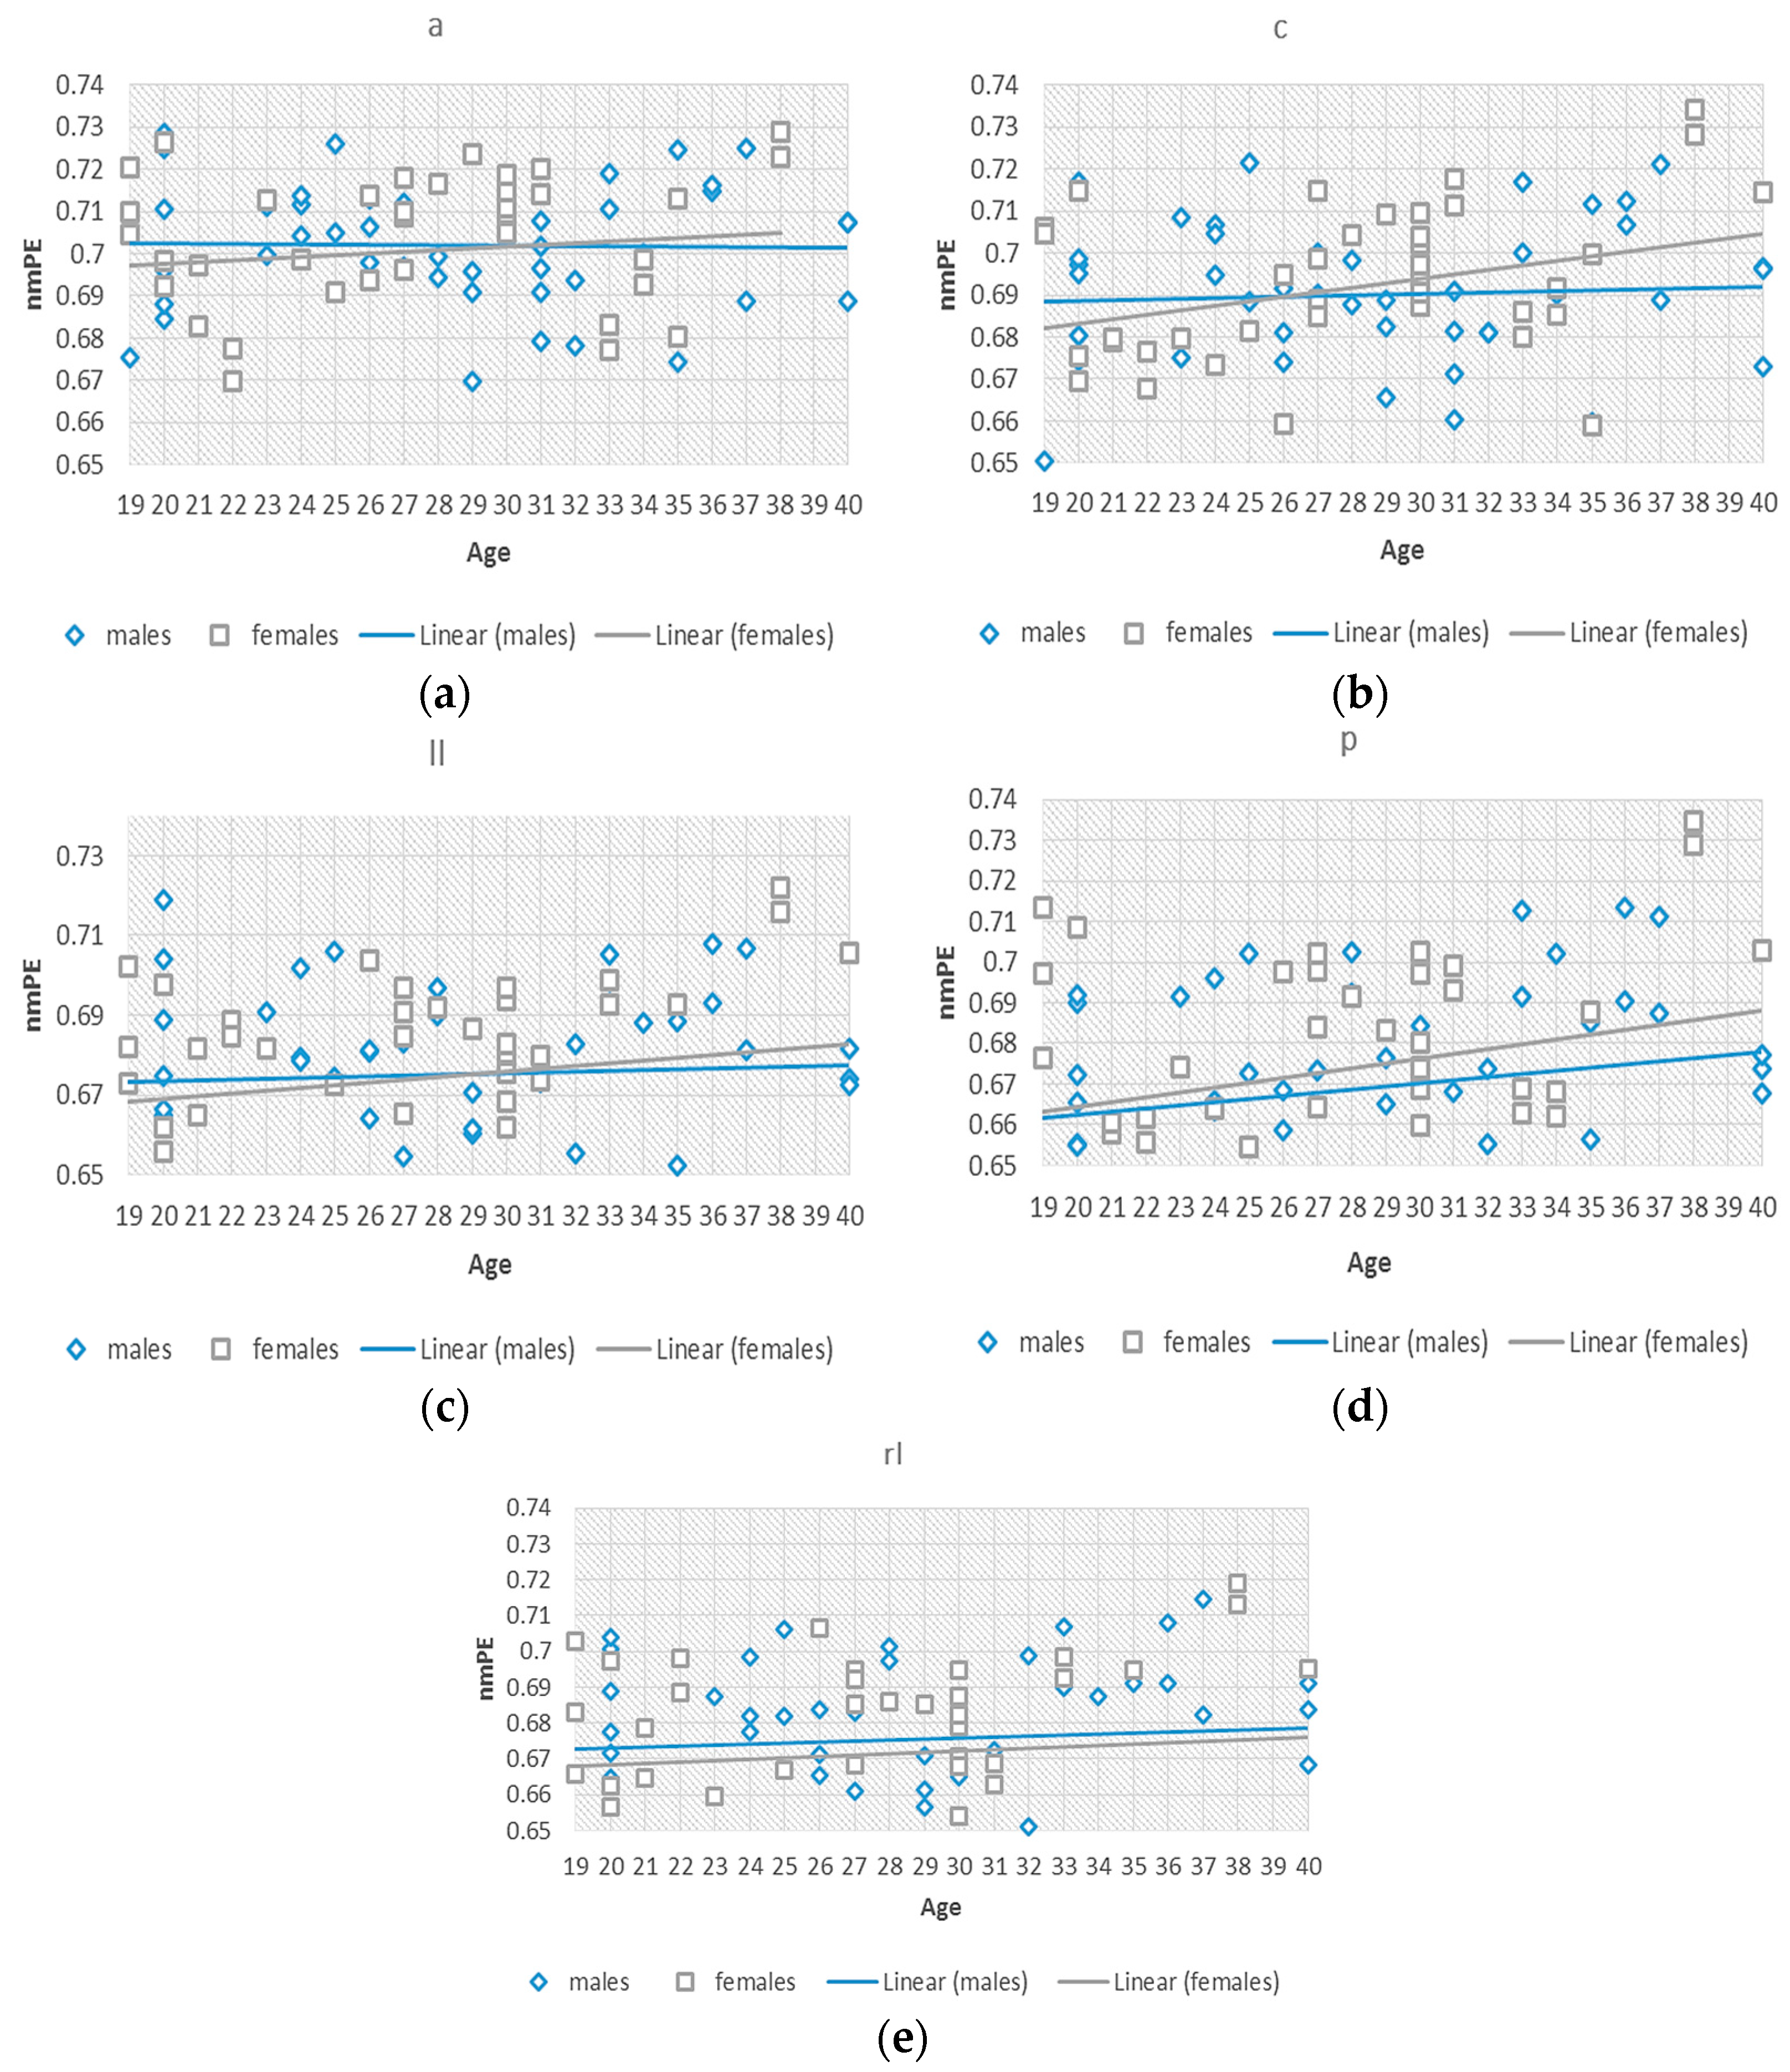
To better understand this effect of the significant differences observed in group 2, we investigated nmPE values within this 19–40 years group. Separate standard (non-significant) linear regression models were fitted to the data for males and females, to observe the differences between the rate of change of the data for both genders, considering age as an independent variable as seen in Figure 4. The slopes for both models indicated a positive tendency of nmPE values in both males and females and therefore indicating an increasing tendency for both genders. The slopes for females were greater than those for males signifying a steeper increase in females than in males within the 19–40 years group. In addition to this, significant differences were observed in the central region of the brain in group 5 (i.e., >70 years). A greater slope for the females was also observed indicating that nmPE values in this region were significantly higher in females than in males for this age group. However, due the use of non-significant linear regressions a two-way ANOVA was used to determine the significance of the observed results.
Results from the between-subjects effects of the two-way ANOVA showed that gender (on its own) did not show any significant effects with p > 0.05 (), indicating that neither males nor females had significantly higher nmPE in all brain regions. Age had a significant effect for both genders across all regions of the brain with p < 0.0001. The interactions were significant in the central, left lateral, posterior and right lateral regions of the brain with respectively. When this interaction was analysed further using pairwise comparisons with Bonferroni correction, it was observed this effect was only significant, in these four regions, for individuals in group 2 (i.e., between 19–40 years).
Once the exploratory analysis was concluded the next goal was to model the age influences on MEG signals. Looking at Figure 3 it might be assumed that the regional data follows some form of polynomial form, be it quadratic, cubic or quartic. Thus, a generalised model of was fitted to the data with separate fittings done for both genders. The results are displayed in the in Table 3. The results displayed in Table 3 display the coefficients of the fitted regression models. The selection criterion for the regression was a curve that best described the data evolution, had a high R2 and adjusted R2 value as well as having a p < 0.0001.
In this study, a 148 channel neuromagnetometer (neuromag) was used to collect the MEG data. Figure 1 shows both the location and orientation of the channels of this magnetometer. As the SQUID channels lie near well-defined anatomic brain regions, this simplified brain region model was used to loosely define the brain regions used in this study as well as to define the evolution of nmPE values in said regions.
The regression data displayed in Table 3 above were used to describe the data trends observed in Figure 3. The results displayed in Table 3 show that similar “levels” of changes with ageing are common to both males and females in the anterior, left lateral, posterior and right lateral regions of the brain. However, different rates of changes with ageing can be seen for the central region, with females having a more “complex” evolution than males. These regression data help in highlighting the following:
- The evolution of nmPE values for males and females by highlighting the manner in which permutation entropy changes with age in the brain for both genders.
- Differences in the “rates” of evolution for males and females.
- The estimated age when the highest nmPE values occur in the MEG signals.
4. Discussion
The interactions between neurons in the brain play a crucial role in the maintenance of the metastable state of the resting brain [49]. The MEG signal is a reasonable measure of the summed activity of approximately neurons lying in the vicinity of the recording sensors [50]. The entropy of the MEG may act as a reliable indicator of the changes in cortical neuronal interaction. This implies that the entropy within the MEG may relay a real change in cortical functional organisation of the brain. Therefore, the changes in entropy of the MEG may be expected to measure, indirectly and coarsely, the changes in the entropy occurring within the neuronal network itself [51].
In this study, two permutation entropy algorithms (nPE and nmPE) were applied to analysing the MEG data during resting state across the human lifespan. The advantages of using nPE include its simplicity, robustness, and low complexity in computation without further model assumptions [9], as well as its robustness in the presence of observational and dynamic noise [9]. The added advantage of using nmPE was that its symbolisation procedure takes into account repeated values of PE [36].
After determining the statistical differences between results obtained using nPE and nmPE, polynomial regressions were fitted to describe the age effects, for both males and females (). Further analysis, with age as an independent factor, showed linear increases in nmPE for both genders, however no significant gender differences were observed during this analysis.
4.1. Evaluation of Ideal Input Parameters
Both the nmPE and nPE algorithms as highlighted by Bandt and Pompe [9], Bai and Li [35] and Bain et al. [36] rely on the identification of the most ideal input parameters of embedded dimension and time delay (lag) i.e., m and l respectively.
The embedding dimension (m), also known as the order, defines the amount of information/pattern length that is analysed using the set PE algorithm. This, coupled with the lag/time delay, is what is used to extract useful knowledge about the dynamics of the MEG [52]. As embedded dimension can be associated with the different frequency characteristics of the MEG, analysing the effects of changing this input parameter can be used to obtain relevant information about the brain at resting state [53]. Therefore, from this it is evident that the smaller the value of m, the wider the spectral content that can be obtained and therefore, this enables more fast-changing signal components to be analysed [54].
With this in mind, an analysis to observe the impact of changing m for both nPE and nmPE was carried out. Altering m between 3 and 7 and then observing the effects using colour maps revealed that the clearest differences for m when using nPE were 4, 5, and 6, while for nmPE the ideal values of m were 4 and 5. With eyes closed at rest, there is an increase in the power of oscillations in the alpha band over the visual cortex, i.e., the posterior and central regions of the brain [55,56]. As the predominant brain oscillation when at rest with eyes closed lies in the alpha range (8–12.9 Hz), an ideal embedding factor of m = 5 can be viewed to correlate with this, i.e., the similar results observed for lower and higher values of m imply that there is little PE activity in the MEG that can be associated with activity in the low (delta) or high (gamma) frequency ranges [54]. Therefore, as the observed changes in the posterior region of the brain could be attributed to the changes in the alpha band frequencies, an investigation into the changes in PE over the alpha frequency range (8–12.9 Hz) could possibly reveal interesting information about the evolution of the alpha frequency [54].
Together with the embedding dimension, the time delay l is also associated with the dynamics of the signals under study and thus, if the time interval between data points is small, fast changes can be analysed. Additionally, if the time intervals between samples are large, then only slow changes can be taken into account. There is evidence [34,35,36,51,55] showing that most information can be extracted using a time delay value if l = 1. Therefore, this resulted in the use of l = 1 in this study [55].
4.2. Evaluation of Differences between nPE and nmPE
The results obtained using nPE and nmPE on the MEG recordings were compared using both two-tailed bivariate Pearson’s correlation and pairwise t-test for all five regions of the brain, and for both genders. The two-tailed bivariate analysis can be used to evaluate correlations between sets of variables and can indicate whether a statistically significant linear relationship exists between two variables as well as the strength of the relationship. Therefore if the resting MEG data containing significant repeated values in the patterns obtained with m = 3 to m = 7, it would be expected that the above analysis would reveal low correlation between the nPE and nmPE results in the regions where the activity reflected this. However, the results from the analysis showed that there was a correlation greater than 0.998 (p < 0.0001) for males, and greater than 0.901 (p < 0.0001) for females, between nPE and nmPE results. Furthermore, the results in Figure 2 and Figure 3 show that the anterior and central regions of the brain generally have higher nPE and nmPE values when compared to other regions of the brain. This was observed for all age groups, and is a result that is in accordance with that obtained by [4]. In the context of the characterisation of healthy ageing, this result suggests that these two brain regions have higher resting state activity than the other three brain regions, and thus have higher entropy than the other brain regions.
After observing the strong correlation between the nPE and nmPE results, a pairwise t-test was performed to compare the means and spread of data and see if they were statistically different from each other. The results from this analysis yielded significance values p > 0.05 for both males and females in all 5 brain regions, thus signifying that there were no significant differences in the nPE and nmPE means and spread of data. A two way ANOVA was used to study the effects of age and gender on the results obtained using nmPE. Results showed that age had a significant effect on the nmPE values (p < 0.000), while gender on its own did not show any significant effects on the nmPE values (p > 0.05) for all 5 brain regions. Regressions were fitted to the data for all brain regions with results from this analysis showing a polynomial relationship between brain region and age for both genders, with the anterior and central brain regions exhibiting the most complex regressions.
4.3. Evaluation of Age and Gender Effect
4.3.1. Age Effects
Age had a significant effect in all five regions of the brain, with regression models showing how nmPE values evolve with age for both males and females. The growth of the brain can be loosely classified into two stages, maturation and ageing. The brain reaches full maturity in the 3rd and 4th decade of life, with group 2 representing this stage [15]. The brain matures regionally, and at different rates, the results from the fitting of the regression models have been able to highlight this [14]. After maturation, the brain begins to age, and during this stage the brain experiences various changes such as decreases in volume and hormone levels, as well as synaptic pruning [15]. A delay in the peak nmPE for both males and females, of almost a decade after maturation of the brain, was observed in this study. Both genders reflected peak nmPE values in the ageing stage of the brain which could imply that effects of ageing affect the resting MEG in both gender groups in a similar manner. Nonetheless, these peak results seem to suggest that male brains adjust “quicker” than female brains to these dynamic conditions, as highlighted by the delay of almost a decade in the peak nmPE for females when compared to males.
Regression models also highlighted differences in the central region of the brain between the two genders. Males (model degree 2) had a significantly less complex evolution model than females (model degree 4). These differences could possibly be as a result of the sexually and regionally specific reductions in brain volume, as well as, the differences in grey matter (GM) and white matter (WM) between adult males and females [57,58,59,60]. Males have more GM that is made up of active neurons while females have more WM that is responsible for communication in the brain. Therefore, if MEG is associated more with WM activity, this could explain the differences in the observed regression models [24,25]. Moreover, as noted in [59] the neurons in female brains are more tightly packed in the layers of the cortex when compared to male brains, therefore the more complex evolutions of nmPE observed in the central region could be a reflection of these physiological differences.
4.3.2. Gender Effects
Various studies analysing healthy males and females [1,2,3,4,61,62,63,64,65] have successfully identified gender as an independent distinguishing characteristic between the gender groups. These studies have shown that significant differences exist between the genders from childhood, to adolescence and adulthood, i.e., throughout life. However, in this study, when investigation of the nmPE values was done to observe if gender alone could be used to distinguish male and female nmPE values, no significant differences were observed. Therefore, though there are identified differences between males and females in the structure if the brain, as well as in the evolution of nmPE values with age, there were no clear gender differences.
This lack of clear gender differences could suggest that at resting state, the permutation entropy values for both genders are very similar, and thus successfully distinguishing between males and females is challenging. Therefore, an analysis based on gender alone, using permutation entropy algorithms, may not be sufficient to highlight the differences between male and female resting state MEG activity.
4.3.3. Age and Gender
Every individual analysed in this study is a subject of both age, and, gender simultaneously and evaluation of the combined effects of both gender and age on the nmPE values revealed that gender and age had significant effects on nmPE values in four of five regions of the brain, (central, left lateral, posterior and right lateral) and that these were only significant in the 19–40 years age range i.e., group 2 [59]. Assuming that permutation entropy can be viewed as a complexity measure, as suggested by [9], then complementary to the results obtained using other complexity measures such as Lempel–Ziv Complexity (LZC), there are gender differences that can be observed using nmPE. Although in their analysis Fernández et al. [4] observed significant differences only in the anterior region of the >19 years group, results from the use of nmPE on MEG has highlighted additional information about the “normal” evolution of the brain. It is possible that the significant changes observed in the brain in the >19 years group using LZC have effects that manifest themselves in the 19–40 years group and can be detected using nmPE.
Linear regressions done in this age range (19–40 years) showed that the intercept for the males was generally higher than that of females. However, the slopes for females were greater. This result can be loosely connected to the different physiological and anatomical changes that occur in the brain due to maturation [52,59]. Nevertheless, some possible factors such as environment, intelligence quotient (IQ), changes in the internal hormone levels, as well as some possibly unknown factors may have an impact on these gender differences observed between the ages of 19 and 40 [58,61].
4.4. Significance and Clinical Implications of the Results
In this study we describe what can be viewed as an illustration of a physiological rhythm i.e., the evolution of permutation entropy in the brain across life. It has been shown that pathology not only causes an abnormality in the normal functioning of the brain but can also exert a discontinuation (break) in the normal pattern of brain evolution as a function of age. Therefore disease not only modifies the potential biological marker of interest but also modifies the pathological rhythm. It is necessary to create a fingerprint of healthy ageing that can be used when analysing MEG data especially that obtained from individuals with pathological conditions. Therefore, with this in mind, our results can be seen as a contribution to the generation of this fingerprint of healthy ageing and thus, can be used as a baseline for analysis.
Being a cross sectional study that generalises lifespan data across multiple cohorts was a limitation to this study as a longitudinal study would have been more situated to address the issue of evolution across life span. However, bearing this limitation in mind, we still believe that the results from this comprehensive study provide useful information that can be used to understand permutation entropy evolution.
4.5. Limitations and Future Work
The MEG data used in this study were collected using a MAGNES 2500WH neuromag with 148 channels for 5 min. Intuitively, due to the fixed hardware parameters of the device such as the analogue-to-digital converter (ADC), and sampling rate, the quality of the MEG signals and subsequently the nmPE values analysed in this study were subject to these said limitations. Furthermore, due to the existence of other data acquisition devices, with different sensor layouts, and number of sensors the exact observed regressions may vary. Nevertheless, due to anatomic regions in the brain remaining constant, despite the mode of data acquisition, it is arguable that the results obtained in this analysis are useful and provide relevant normative information about the brain at rest. However, future work into the use of MEG data acquired from different devices with different SQUID positioning and sampling rates, i.e., devices with different parameters, is required to define a more robust evolution of nmPE values with age that can be used in a more general setting.
The MEG data were filtered using a band-pass filter with corner frequencies at 1.5 Hz and 40 Hz. Although this ensures the removal of noise from the mains hum and any DC offset present in the data, there still might be some residual artefacts present in the signals, such as those from electromyograph signals, electrooculograph signals and electrocardiograph signals. Although the signals were visually inspected to ensure that the contamination from those signals was minimal, these contaminants might have had an impact on the results as they also lie in the same frequency band covered by the filter i.e., between 1.5 Hz and 40 Hz [6]. Therefore, with this in mind, future work involving the use of preprocessing methods, such as blind source separation, to remove artefacts from the MEG signal will be done so as to decrease the possible impact of these artefacts on our results [6].
A limitation to this study was that the effects of changing the lag value as an input parameter to both the nPE and nmPE algorithms were not investigated, but rather a default lag value of l = 1 was used. Although in [53] it was observed that changing the value of l can result in the identification of additional information associated with different frequency characteristics and related to the intrinsic time scale of the system, these effects were not evaluated in this study. Thus, future work will involve an investigation to analyse the effects of changing the lag value must be conducted in the future so as to identify any potentially useful additional frequency dependent information contained in the MEG recordings.
Another limitation to this study was that we only made use of two permutation entropy algorithms. Permutation LZC (PLZC) has been recently introduced [35] with claims that this method is arguably more computationally efficient than PE. Therefore, in light of this, future work analysing the resting brain MEG across the life span using this method may also reveal additional information about the brain at rest.
As our study covered the entire spectrum of brain oscillations, it is difficult to conclude that alpha oscillations were the main driver behind the changes observed in our results. Therefore, though it cannot be ruled out that this significant presence (of the alpha oscillations) could have influenced the results that we have presented in this study, we cannot comment on this conclusively. Thus, future work to analyse the effects of the alpha frequency on PE values should be done as it could possibly reveal interesting information that could aid in understanding the how these oscillations affect the brain at rest.
5. Conclusions
In this study, the use of nPE and nmPE to characterise the behaviour of the changes in permutation entropy of MEG signals according to both age and gender was investigated. Further investigation to determine ideal algorithm parameters led to the identification of the optimum embedding dimension that revealed the clearest visual results. Analysis of the 5 brain regions; anterior, central, left lateral, posterior and right lateral, indicated that significant age effects could be identified using the PE algorithms. Polynomial regressions fitted to describe these evolutions revealed that males hit a peak in nmPE a decade before females, with significant gender differences identified in the 19–40 years age range. Overall, our results show that permutation entropy algorithms can be used to highlight the changes imposed on the resting state MEG by age. Therefore, this methodology could provide an alternative characterisation of healthy ageing that might be used to obtain a fingerprint of this process using MEG recordings.
Author Contributions
Elizabeth Shumbayawonda and Daniel Abásolo conceived and designed the methodology. Elizabeth Shumbayawonda was responsible for analysis and writing the paper. Daniel Abásolo, Michael Pycraft Hughes and Alberto Fernández contributed critically to revise the results and discussion. All authors have read and approved the final manuscript.
Conflicts of Interest
The authors declare no conflict of interest.
References
- Anokhin, A.P.; Birbaumer, N.; Lutzenberger, W.; Nikolaev, A.; Vogel, F. Age increases brain complexity. Electroencephalogr. Clin. Neurophysiol. 1996, 99, 63–68. [Google Scholar] [CrossRef]
- Meyer-Lindenber, A. The evolution of complexity in human brain development: An EEG study. Electroencephalogr. Clin. Neurophysiol. 1996, 99, 405–411. [Google Scholar] [CrossRef]
- Clarke, A.R.; Barry, R.J.; McCarthy, R.; Selikowitz, M. Age and sex effects in the EEG: Development of the normal child. Clin. Neurophysiol. 2001, 112, 806–814. [Google Scholar] [CrossRef]
- Fernández, A.; Zuluaga, P.; Abásolo, D.; Gómez, C.; Serra, A.; Méndez, M.A.; Hornero, R. Brain oscillatory complexity across the life span. Clin. Neurophysiol. 2012, 123, 2154–2162. [Google Scholar] [CrossRef] [PubMed]
- Gómez, C.; Hornero, R.; Mediavilla, A.; Fernández, A.; Abásolo, D. Nonlinear forecasting measurement of magnetoencephalogram recordings from Alzheimer’s disease patients. In Proceedings of the 30th Annual International Conference of the IEEE of Engineering in Medicine and Biology Society (EMBS 2008), Vancouver, BC, Canada, 20–24 August 2008; pp. 2153–2156. [Google Scholar]
- Escudero, J.; Hornero, R.; Abásolo, D.; Fernández, A. Blind source separation to enhance spectral and non-linear features of magnetoencephalogram recordings. Application to Alzheimer’s disease. Med. Eng. Phys. 2009, 31, 872–879. [Google Scholar] [CrossRef] [PubMed]
- Jafarpour, A.; Barnes, G.; Fuentemilla, L.; Duzel, E.; Penny, W.D. Population Level Inference for Multivariate MEG Analysis. Public Libr. Sci. 2013, 8, 1–8. [Google Scholar] [CrossRef] [PubMed]
- Ahonen, A.; Hämäläinen, M.; Kajola, M.; Knuutila, J.; Laine, P.; Lounasmaa, O.; Parkkonen, L.; Simola, J.; Tesche, C. 122-channel squid instrument for investigating the magnetic signals from the human brain. Phys. Scr. 1993, T49A, 198–205. [Google Scholar] [CrossRef]
- Stam, C. Nonlinear dynamical analysis of EEG and MEG: Review of an emerging field. Clin. Neurophysiol. 2005, 116, 2266–2301. [Google Scholar] [CrossRef] [PubMed]
- Carlson, N.R.; Heth, C.D.; Miller, H.; Donahoe, J.W.; Buskist, W.; Martin, G.N. “Biology of Behavior” in Psychology: The Science of Behavior; Pearson: Boston, MA, USA, 2007; pp. 82–121. [Google Scholar]
- Fornito, A.; Zalesky, A.; Breakspear, M. The connectomics of brain disorders. Neuroscience 2015, 16, 159–172. [Google Scholar] [CrossRef] [PubMed]
- Rescorla, M. The Computational Theory of Mind, 7th ed.; The Stanford Encyclopedia of Philosophy: Stanford, CA, USA, 2015. [Google Scholar]
- Orrison, W.W. Atlas of Brain Function, 2nd ed.; Thieme: New York, NY, USA, 2008. [Google Scholar]
- Lebel, C.; Walker, L.; Leemans, A.; Phillips, L.; Beauli, C. Microstructural maturation of the human brain from childhood to adulthood. NeuroImage 2007, 40, 1044–1055. [Google Scholar] [CrossRef] [PubMed]
- Schafer, C.B.; Morgan, B.R.; Ye, A.X.; Taylor, M.; Doesburg, S.M. Oscillations, networks and their development: MEG connectivity changes with age. Hum. Brain. Mapp. 2014, 35, 5249–5261. [Google Scholar] [CrossRef] [PubMed]
- Matousek, M.; Petersen, I. Norms for the EEG. In Automation of Clinical Electroencephalography; Kellaway, P., Petersen, I., Eds.; Raven: New York, NY, USA, 1973; pp. 75–102. [Google Scholar]
- John, E.R.; Ahn, H.; Prichep, L. Developmental equations for the electroencephalogram. Science 1980, 210, 1255–1258. [Google Scholar] [CrossRef] [PubMed]
- Marshall, P.J.; Bar-Haim, Y.; Fox, N.A. Development of the EEG from 5 months to 4 years of life. Clin. Neurophysiol. 2002, 113, 1199–1208. [Google Scholar] [CrossRef]
- Dustman, R.E.; Shearer, D.E.; Emmerson, R.Y. Life-span changes in EEG spectral amplitude, amplitude variability and mean frequency. Clin. Neurophysiol. 1999, 110, 1399–1409. [Google Scholar] [CrossRef]
- Peters, R. Ageing and the brain. Postgrad. Med. J. 2005, 82, 84–88. [Google Scholar] [CrossRef] [PubMed]
- Dickstein, D.L.; Kabaso, D.; Rocher, A.B.; Luebke, J.I.; Wearne, S.L.; Hof, P.F. Changes in structural complexity of the aged brain. Aging Cell 2007, 6, 275–284. [Google Scholar] [CrossRef] [PubMed]
- John, E.R.; Prichep, L.S.; Fridman, J.; Easton, P. Neurometrics: Computer-assisted differential diagnosis of brain dysfunctions. Science 1988, 239, 162–169. [Google Scholar] [CrossRef] [PubMed]
- Rossini, P.M.; Rossi, S.; Babiloni, C.; Polich, J. Clinical neurophysiology of aging brain: From normal aging to neurodegeneration. Neurobiology 2007, 83, 375–400. [Google Scholar] [CrossRef] [PubMed]
- Zappasodi, F.; Marzetti, L.; Olejarczyk, E.; Tecchio, F.; Pizzella, V. Age related changes in electroencephalographic signal complexity. Public Libr. Sci. 2015, 10, 1–13. [Google Scholar] [CrossRef] [PubMed]
- Somel, M.; Liu, X.; Khaitovich, P. Human brain evolution: Transcripts, metabolites and their regulators. Nat. Rev. Neurosci. 2013, 14, 112–127. [Google Scholar] [CrossRef] [PubMed]
- Lindenberger, C. Human cognitive aging: Corriger la fortune? Science 2014, 346, 572–578. [Google Scholar] [CrossRef] [PubMed]
- Lutzenberger, W.; Preissl, H.; Pulvermuller, F. Fractal dimension of electroencephalographic time series and underlying brain processes. Biol. Cybern. 1995, 73, 477–482. [Google Scholar] [CrossRef] [PubMed]
- McIntosh, A.R.; Kovacevic, N.; Itier, R.J. Increased brain signal variability accompanies lower behavioral variability in development. PLoS Comp. Biol. 2008, 4, e1000106. [Google Scholar] [CrossRef] [PubMed]
- Kolmogorov, A.N. Entropy per unit time as a metric invariant of automorphisms. Dokl. Akad. Nauk SSSR 1959, 124, 754–755. [Google Scholar]
- Sinai, Y.G. On the concept of entropy of a dynamical system. Dokl. Akad. Nauk SSSR 1959, 128, 768–771. [Google Scholar]
- Pincus, S.M. Approximate entropy as a measure of system complexity. Proc. Natl. Acad. Sci. USA 1991, 88, 2297–2301. [Google Scholar] [CrossRef] [PubMed]
- Pincus, S.M.; Goldberger, A.L. Physiological time-series analysis: What does regularity quantify? Am. J. Physiol. Heart C 1994, 266, H1643–H1656. [Google Scholar]
- Hao, B. Symbolic dynamics and characterization of complexity. Physica D 1991, 51, 161–176. [Google Scholar] [CrossRef]
- Bandt, C.; Pompe, B. Permutation entropy: A natural complexity measure for time series. Phys. Rev. Lett. 2002, 88, 174102. [Google Scholar] [CrossRef] [PubMed]
- Bai, Y.; Liang, Z.; Li, X. A permutation Lempel–Ziv complexity measure for EEG analysis. Biomed. Signal Process. Control 2015, 19, 102–114. [Google Scholar] [CrossRef]
- Bian, C.; Qin, C.; Ma, Q.D.; Shen, Q. Modified permutation-entropy analysis of heartbeat dynamics. Phys. Rev. E 2012, 85, 021906. [Google Scholar] [CrossRef] [PubMed]
- Oppenheim, A.V.; Schafer, R.W. Discrete-Time Signal Processing; Pearson: Boston, MA, USA, 2013. [Google Scholar]
- Riedl, M.; Muller, A.; Wessel, N. Practical considerations of permutation entropy. Eur. Phys. J. Spec. Top. 2013, 222, 249–262. [Google Scholar] [CrossRef]
- Xiao-Feng, L.; Yue, W. Fine-grained permutation entropy as a measure of natural complexity for time series. Chin. Phys. B 2009, 18, 02690. [Google Scholar] [CrossRef]
- Costa, M.; Goldberger, A.L.; Peng, C.K. Multiscale entropy analysis of physiologic time series. Phys. Rev. Lett. 2002, 89, 062102. [Google Scholar] [CrossRef] [PubMed]
- Costa, M.; Goldberger, A.L.; Peng, C.K. Multiscale entropy analysis of biological signals. Phys. Rev. E 2005, 71, 021906. [Google Scholar] [CrossRef] [PubMed]
- Fadlallah, B.; Principe, J.; Chen, B.; Keil, A. Weighted-Permutation Entropy: An Improved Complexity Measure for Time Series. Phys. Rev. E 2013, 87, 022911. [Google Scholar] [CrossRef] [PubMed]
- Morabito, F.C.; Labate, D.; La Foresta, F.; Bramanti, A.; Morabito, G.; Palamara, I. Multivariate Multi-Scale Permutation Entropy for Complexity Analysis of Alzheimer’s Disease EEG. Entropy 2012, 14, 1186–1202. [Google Scholar] [CrossRef]
- Li, D.; Liang, Z.; Voss, L.J.; Sleigh, J.W. Multiscale permutation entropy analysis of EEG recordings during sevoflurane anesthesia. J. Neural Eng. 2010, 7, 1–14. [Google Scholar] [CrossRef] [PubMed]
- Cao, Y.; Tung, W.; Gao, J.B.; Protopopescu, V.A.; Hively, L.M. Detecting dynamical changes in time series using the permutation entropy. Phys. Rev. E 2004, 70, 046217. [Google Scholar] [CrossRef] [PubMed]
- Méndez, M.A.; Zuluaga, P.; Hornero, C.; Gómez, J.; Escudero, A.; Rodríguez-Palancas, A.; Oritz, T.; Fernandez, A. Complexity analysis of spontaneous brain activity: Effects of depression and antidepressant treatment. J. Psychopharmacol. 2011, 26, 636–643. [Google Scholar] [CrossRef] [PubMed]
- Meyers, L.S.; Gamst, G.; Guarino, A.J. Applied Multivariate Research: Design and Interpretation, 3rd ed.; SAGE Publications: Thousand Oaks, CA, USA, 2016. [Google Scholar]
- Yockey, R.D. SPSS Demystified: A Simple Guide and Reference, 2nd ed.; Routledge: Fresno, CA, USA, 2016. [Google Scholar]
- Stam, C.J.; van Straaten, E.C.; van Dellen, E.; Tewarie, P.; Gong, G.; Hillebrand, A.; Meier, J.; van Mieghem, P. The relation between structural and functional connectivity patterns in complex brain networks. Int. J. Psychophysiol. 2016, 103, 149–160. [Google Scholar] [CrossRef] [PubMed]
- Murakami, S.; Okada, Y. Contributions of principal neocortical neurons to magnetoencephalography and electroencephalography signals. J. Physiol. 2006, 575, 925–936. [Google Scholar] [CrossRef] [PubMed]
- Li, J.; Yan, J.; Liu, X.; Ouyang, G. Using Permutation Entropy to Measure the Changes in EEG Signals During Absence Seizures. Entropy 2014, 16, 3049–3061. [Google Scholar] [CrossRef]
- Zanin, M.; Zunino, L.; Rosso, O.A.; Pappo, D. Permutation Entropy and Its Main Biomedical and Econophysics Applications: A Review. Entropy 2012, 14, 1553–1577. [Google Scholar] [CrossRef]
- Olofsen, E.; Sleigh, J.W.; Dahan, A. Permutation entropy of the electroencephalogram: A measure of anaesthetic drug effect. Br. J. Anaesth. 2008, 101, 810–821. [Google Scholar] [CrossRef] [PubMed]
- Barry, R.J.; Clarke, A.R.; Johnstone, S.J.; Magee, C.A.; Rushby, J.A. EEG differences between eyes-closed and eyes-open resting conditions. Clin. Neurophysiol. 2007, 118, 2765–2773. [Google Scholar] [CrossRef] [PubMed]
- Popov, A.; Avilov, O.; Kanaykin, O. Permutation entropy of EEG signals for different sampling rate and time lag combinations. In Proceedings of the IEEE 2013 Signal Processing Symposium, Jachranka Village, Poland, 5–7 June 2013. [Google Scholar]
- Florin, E.; Baillet, S. The brain’s resting-state activity is shaped by synchronized cross-frequency coupling of neural oscillations. NeuroImage 2015, 111, 26–35. [Google Scholar] [CrossRef] [PubMed]
- Zaidi, Z.F. Gender Differences in Human Brain: A Review. Open Anat. J. 2010, 2, 37–55. [Google Scholar] [CrossRef]
- Sowell, E.R.; Thompson, P.M.; Toga, A.W. Mapping changes in the human cortex throughout the span of life. Neuroscientist 2004, 10, 372–392. [Google Scholar] [CrossRef] [PubMed]
- Witelson, S.F.; Glezer, I.I.; Kigar, D.L. Women have greater density of neurons in posterior temporal cortex. J. Neurosci. 1995, 15, 3418–3428. [Google Scholar] [PubMed]
- Gong, G.; He, Y.; Evans, A.C. Brain Connectivity: Gender Makes a Difference. Neuroscientist 2001, 17, 575–591. [Google Scholar] [CrossRef] [PubMed]
- Anokhin, A.P.; Lutzenberger, W.; Nikolaev, A.; Birbaumer, N. Complexity of electrocortical dynamics in children: Developmental aspects. Dev. Psychobiol. 2000, 36, 9–22. [Google Scholar] [CrossRef]
- Dekaban, A.S. Changes in brain weights during the span of human life: Relation of brain weights to body heights and body weights. Ann. Neurol. 1978, 4, 345–356. [Google Scholar] [CrossRef] [PubMed]
- Benes, F.M.; Turtle, M.; Khan, Y.; Farol, P. Myelination of a key relay zone in the hippocampal formation occurs in the human brain during childhood, adolescence, and adulthood. Arch. Gen. Psychiatry 1994, 51, 477–484. [Google Scholar] [CrossRef] [PubMed]
- Pfefferbaum, A.; Mathalon, D.H.; Sullivan, E.V.; Rawles, J.M.; Zipursky, R.B.; Lim, K.O. A quantitative magnetic resonance imaging study of changes in brain morphology from infancy to late adulthood. Arch. Neurol. 1994, 51, 874–887. [Google Scholar] [CrossRef] [PubMed]
- Marner, L.; Nyengaard, J.R.; Tang, Y.; Pakkenberg, B. Marked loss of myelinated nerve fibers in the human brain with age. J. Comp. Neurol. 2003, 462, 144–152. [Google Scholar] [CrossRef] [PubMed]
Figure 1.
Sensor-space representation of the layout of the location of the 148 SQUID channels in the neuromag used to record MEG signals. The five highlighted regions represent the sensor groupings used to define the different parts of the brain i.e., anterior (a), central (c), left lateral (ll), right lateral (rl) and posterior (p). These regions were also used for the statistical analyses [4].

Figure 2.
Colour maps showing the results from the nmPE analysis for each channel, for males (left) and females (right) for the 5 age groups used in this study. The layout of the channels is as described by [4] and Figure 1.

Figure 3.
The means and standard error values of the nPE (a,c) and nmPE (b,d) results in the 5 regions of the brain represented according to age and gender groups. Males are represented by graph the two graphs in (a,b) while females are represented by the graphs in (c,d).
Figure 3.
The means and standard error values of the nPE (a,c) and nmPE (b,d) results in the 5 regions of the brain represented according to age and gender groups. Males are represented by graph the two graphs in (a,b) while females are represented by the graphs in (c,d).
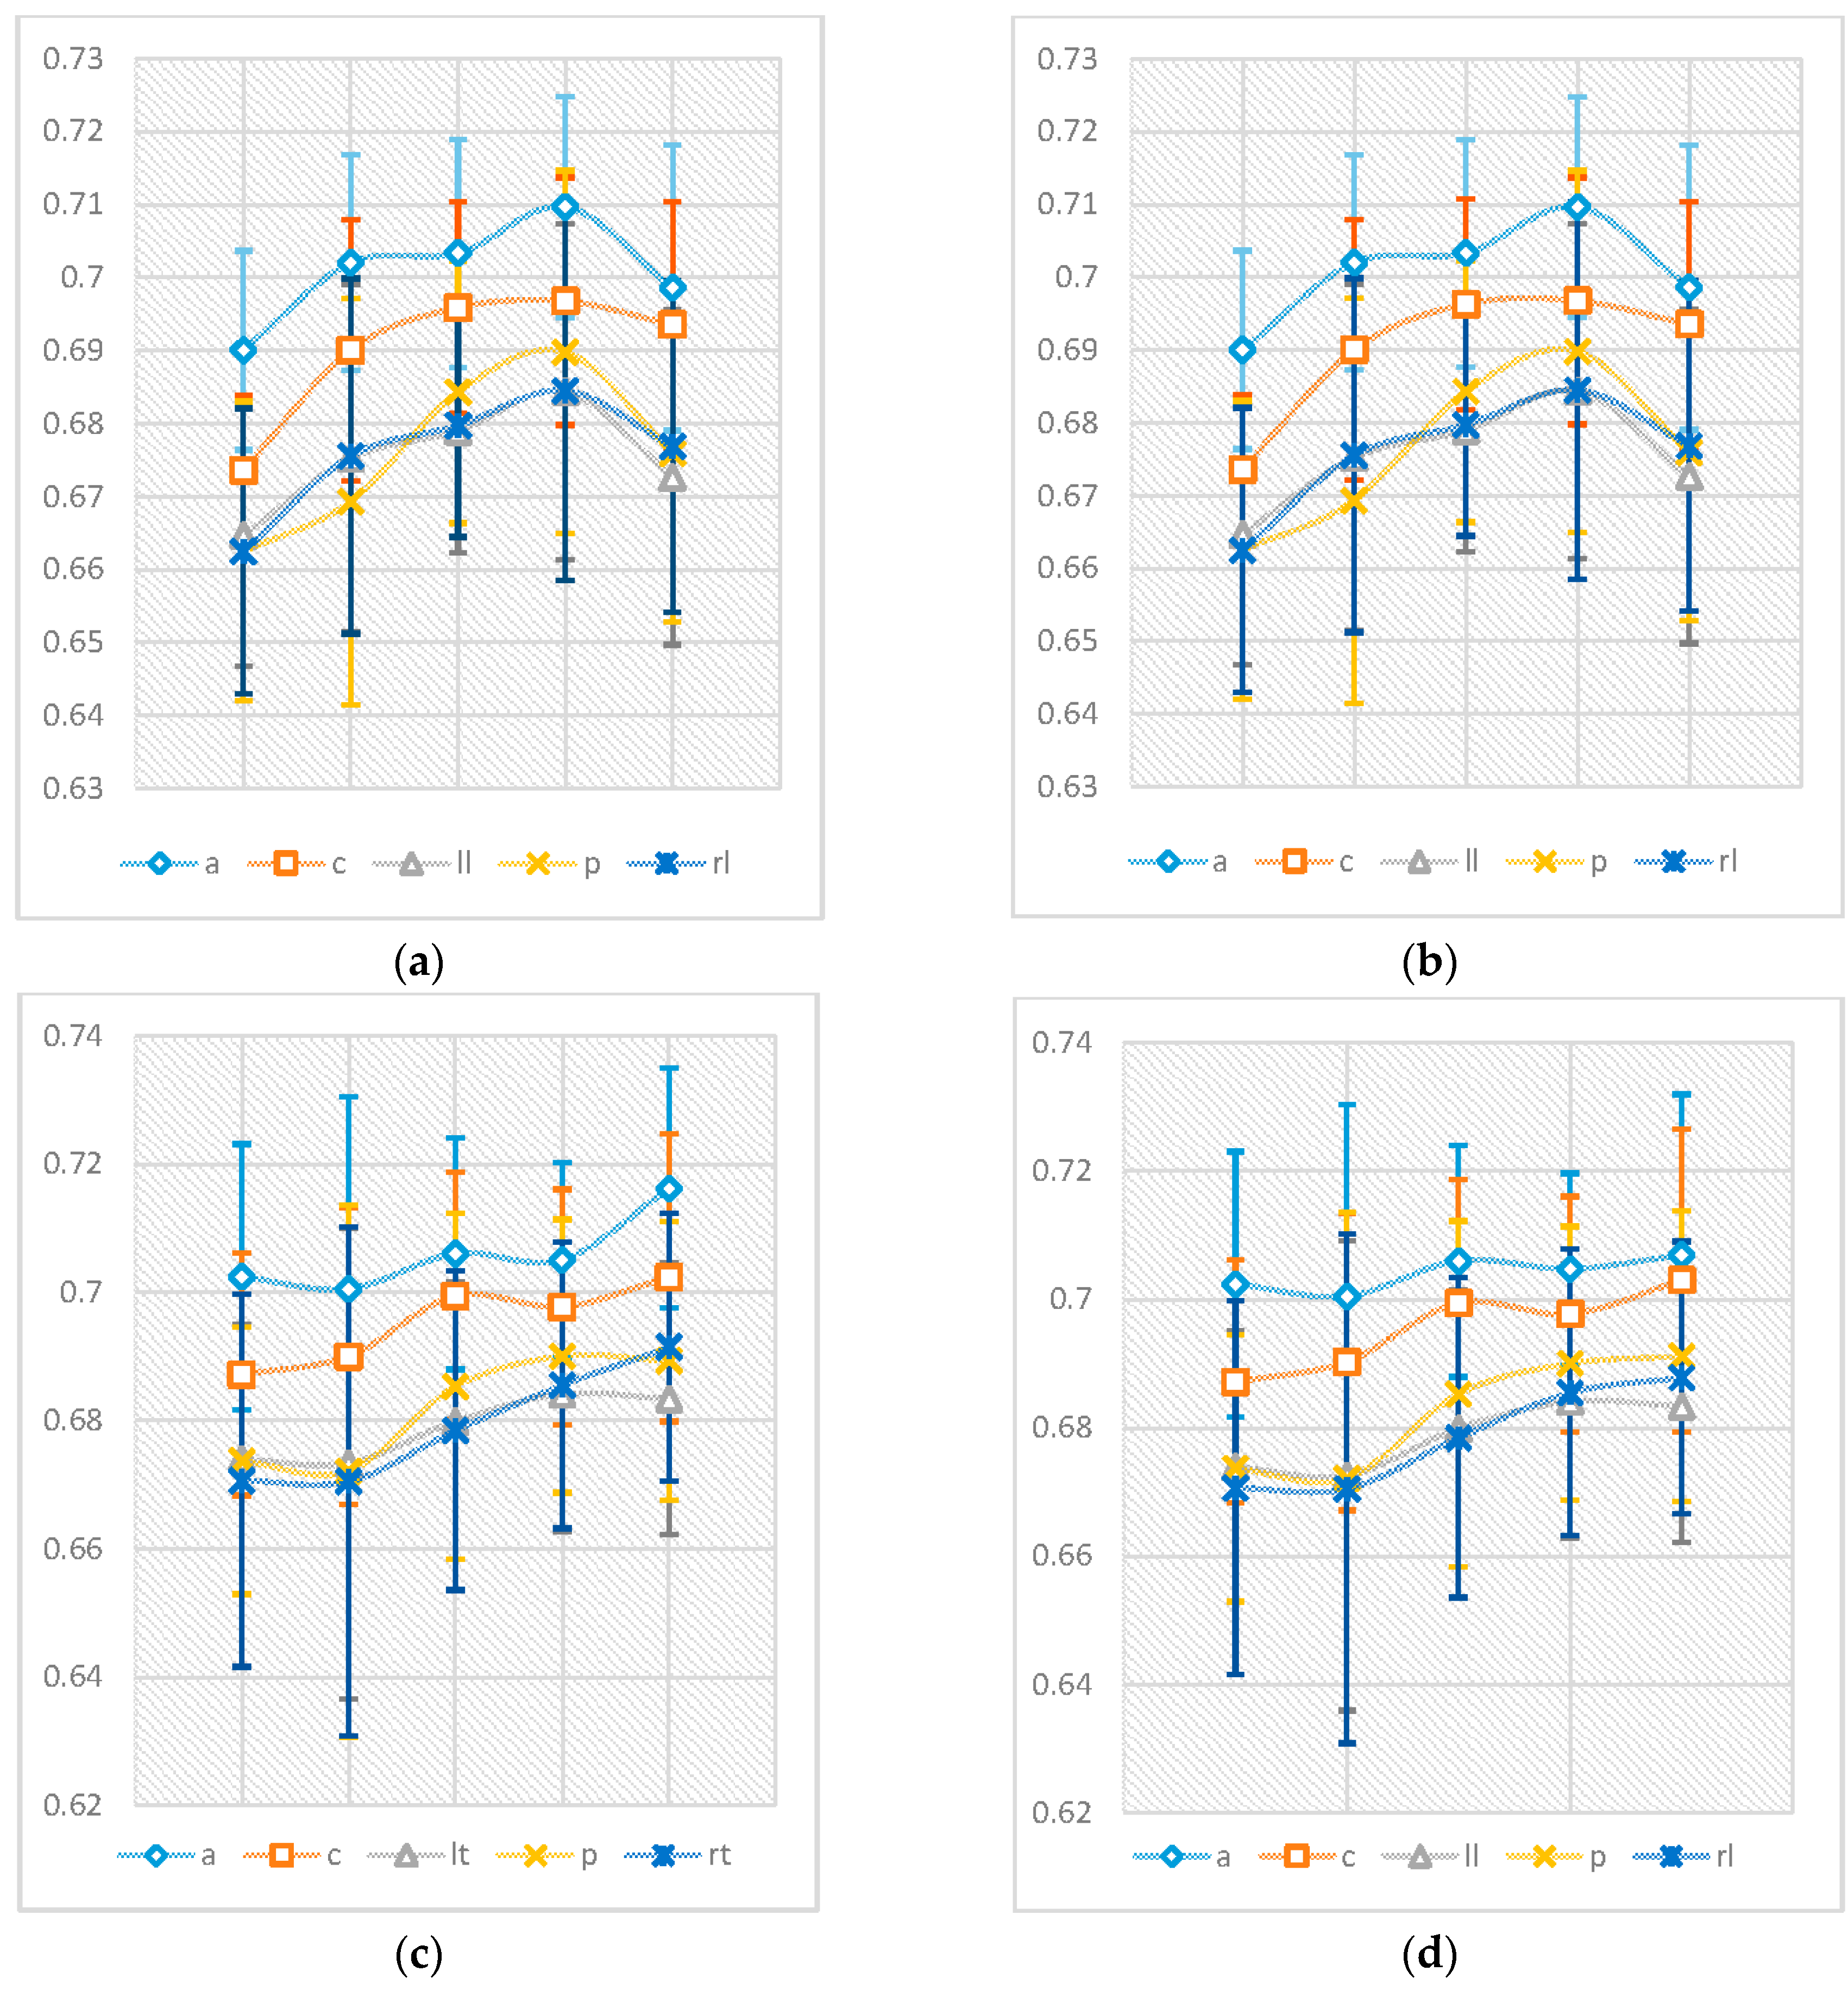
Figure 4.
The linear increase of the nmPE values, with age as an independent factor, for both genders is shown here, with males shown in blue and females in grey. The slopes for both models indicated a positive tendency of nmPE values in both gender groups. (a) anterior (a); (b) central (c); (c) left lateral (ll); (d) posterior (p); (e) right lateral (rl).


Table 1.
Age grouping of participants.
| Group | Age | Subjects | Males | Females |
|---|---|---|---|---|
| 1 | <19 | 22 | 11 | 11 |
| 2 | 19–40 | 84 | 44 | 40 |
| 3 | 41–60 | 39 | 20 | 19 |
| 4 | 61–70 | 48 | 11 | 37 |
| 5 | >70 | 27 | 12 | 15 |
Table 2.
Relationship between embedding dimension and Bell number.
| m | 2 | 3 | 4 | 5 | 6 | 7 |
| m! | 2 | 6 | 24 | 120 | 720 | 5040 |
| B(m) | 3 | 13 | 75 | 541 | 4683 | 47,293 |
| B(m)/m! | 1.5 | 2.16 | 3.125 | 4.50 | 6.50 | 9.38 |
Table 3.
The regional and gender polynomial regression fitting for the nmPE data, including the R2 values, All fitted regressions in each region of the brain (Reg.) with model polynomial degree (Poly Deg.) had significance p < 0.0001 and R2 > 0.85.
Table 3.
The regional and gender polynomial regression fitting for the nmPE data, including the R2 values, All fitted regressions in each region of the brain (Reg.) with model polynomial degree (Poly Deg.) had significance p < 0.0001 and R2 > 0.85.
| Reg. | Gender | Poly Deg. | Peak Age | ||||||
|---|---|---|---|---|---|---|---|---|---|
| a | Male | 4 | 0.6133 | 0.1367 | −0.077 | 0.0186 | −0.0016 | 1 | 63.15 |
| Female | 4 | 0.7449 | −0.09028 | 0.05838 | −0.01462 | 0.00127 | 1 | 83.00 | |
| c | Male | 2 | 0.6538 | 0.02364 | −0.003164 | 0 | 0 | 0.9873 | 54.98 |
| Female | 4 | 0.7027 | −0.04919 | 0.03855 | −0.01015 | 0.00088 | 1 | 83.00 | |
| ll | Male | 3 | 0.6607 | 0.0005792 | 0.00468 | −0.0008604 | 0 | 0.9503 | 54.05 |
| Female | 3 | 0.6849 | −0.01831 | 0.008348 | −0.0009491 | 0 | 0.9992 | 64.63 | |
| p | Male | 2 | 0.6754 | −0.02775 | 0.01707 | −0.0023 | 0 | 0.9982 | 58.53 |
| Female | 3 | 0.6841 | −0.02263 | 0.01169 | −0.001394 | 0 | 0.9883 | 64.11 | |
| rl | Male | 2 | 0.6493 | 0.0141 | −0.000193 | −0.0003022 | 0 | 0.973 | 55.00 |
| Female | 3 | 0.6836 | −0.01962 | 0.008502 | −0.0008528 | 0 | 0.9996 | 87.24 |
© 2017 by the authors. Licensee MDPI, Basel, Switzerland. This article is an open access article distributed under the terms and conditions of the Creative Commons Attribution (CC BY) license (http://creativecommons.org/licenses/by/4.0/).
Share and Cite
MDPI and ACS Style
Shumbayawonda, E.; Fernández, A.; Hughes, M.P.; Abásolo, D. Permutation Entropy for the Characterisation of Brain Activity Recorded with Magnetoencephalograms in Healthy Ageing. Entropy 2017, 19, 141. https://doi.org/10.3390/e19040141
AMA Style
Shumbayawonda E, Fernández A, Hughes MP, Abásolo D. Permutation Entropy for the Characterisation of Brain Activity Recorded with Magnetoencephalograms in Healthy Ageing. Entropy. 2017; 19(4):141. https://doi.org/10.3390/e19040141
Chicago/Turabian StyleShumbayawonda, Elizabeth, Alberto Fernández, Michael Pycraft Hughes, and Daniel Abásolo. 2017. "Permutation Entropy for the Characterisation of Brain Activity Recorded with Magnetoencephalograms in Healthy Ageing" Entropy 19, no. 4: 141. https://doi.org/10.3390/e19040141
Note that from the first issue of 2016, this journal uses article numbers instead of page numbers. See further details here.