
Use of Exergy Analysis to Quantify the Effect of Lithium Bromide Concentration in an Absorption Chiller


Applied Energy Research Laboratory (AERL), Department of Mechanical Engineering, College of Engineering, University of Idaho, 875 Perimeter Dr., Moscow, ID 83844-0902, USA
*
Author to whom correspondence should be addressed.
Entropy 2017, 19(4), 156; https://doi.org/10.3390/e19040156
Submission received: 24 February 2017
/
Revised: 27 March 2017
/
Accepted: 30 March 2017
/
Published: 1 April 2017
(This article belongs to the Special Issue Work Availability and Exergy Analysis)
Abstract
:Absorption chillers present opportunities to utilize sustainable fuels in the production of chilled water. An assessment of the steam driven absorption chiller at the University of Idaho, was performed to quantify the current exergy destruction rates. Measurements of external processes and flows were used to create a mathematical model. Using engineering equation solver to analyze and identify the major sources of exergy destruction within the chiller. It was determined that the absorber, generator and condenser are the largest contribution to the exergy destruction at 30%, 31% and 28% of the respectively. The exergetic efficiency is found to be 16% with a Coefficient of performance (COP) of 0.65. Impacts of weak solution concentration of lithium bromide on the exergy destruction rates were evaluated using parametric studies. The studies reveled an optimum concentration that could be obtained by increasing the weak solution concentration from 56% to 58.8% a net decrease in 0.4% of the exergy destruction caused by the absorption chiller can be obtained. The 2.8% increase in lithium-bromide concentration decreases the exergy destruction primarily within the absorber with a decrease of 5.1%. This increase in concentration is shown to also decrease the maximum cooling capacity by 3% and increase the exergy destruction of the generator by 4.9%. The study also shows that the increase in concentration will change the internal temperatures by 3 to 7 °C. Conversely, reducing the weak solution concentration results is also shown to increase the exergetic destruction rates while also potentially increasing the cooling capacity.
1. Introduction
For building a sustainable system, maximizing the use of resources with minimal environmental impacts is key [1]. A completely sustainable system would require a fully reversible process, a feat that the second law of thermodynamics proves is not possible; indicating that all real processes are irreversible and impact the environment. Approaching sustainability can yield benefits both the current and future environment [2].
Utilization of resources in a responsible fashion and with efficient methods is important when developing new technologies and analyzing current systems [3,4,5,6]. Conventional vapor compression systems and absorption chillers utilize different working fluids. Many of the vapor compression systems use the ozone depleting chlorofluorocarbon refrigerants (CFCs) because of the thermophysical properties offered by them. Many industrial processes often produce a significant amount of thermal energy; often by burning fossil fuels for heat or steam. Opportunities to convert waste or excess heat into useful cooling can be done by integration of absorption chilling into these systems [7].
Lake et al. reviewed district energy systems and showed trends and projections for the district energy systems. The policies, design and environmental considerations associated with heating and cooling technologies have been moving away from fossil fuels [8]. By burning fossil fuels such as coal, oil and natural gas for industrial thermal processes, the greenhouse gases (GHGs) created should be considered when the heat source is utilized by an absorption refrigeration cycle. In 2000, Hondeman performed a direct comparison of CO2 emissions showing that as long as the Coefficient of performance (COP) of an electric chiller was greater than 6.1 the compression based cooling produced less CO2 emissions and was more energy efficient than absorption cooling [9].
Chilled water systems are often apart of district energy (DE) systems, which have been shown to offer potential reductions in GHG emissions [10]. This can be accomplished through the use of biomass fuels, or non-carbon energy sources. Replacement of less efficient equipment with centralized heating and cooling systems will also provide reductions in GHG emissions [11]. District energy systems offer opportunities for production of hot water, low pressure steam, and chilled water for use in nearby buildings from a common central location. This is often done through the use of a production plant and underground piping systems [12].
Szargut et al. suggested that exergy methods should be considered to better realize increased efficiencies and environmental impacts [13]. Exergy is commonly considered to be the measure of work potential or maximum work that can be obtained from a system with respect to its environment or the quality of a heat source [14,15,16,17]. Exergy, unlike energy, is a non-conserved quantity, and exergy balances account for inputs, losses and wastes of a process [18]. Exergy input and destruction rates provide an accounting of the efficiency of resources used [19]. Dincer and Rosen have shown links between energy, exergy and sustainable development and have shown that exergy might allow for measuring impacts on the environment [20,21,22,23].
Lithium bromide (LiBr) absorption chillers have been evaluated based on their exergy; Gebreslassie et al. presented at detailed analysis of exergy for half to triple effect absorption chillers [15]. Bereche et al. analyzed single and double-effect LiBr systems using a thermoeconomic analysis and exergy. They were able to conclude that single-effect absorption refrigeration systems are suitable utilizing waste heat or operating in cogeneration systems because of their operation at lower temperatures compared to double-effect chillers [24]. LiBr chillers have also been internally analyzed, Morosuk and Tsatsaronis presented an exergy analysis of the internal components of absorption refrigeration machines. They were able to conclude that the absorber and generator destroy 40% of their exergy and are primary candidates for improvement [17].
The application of optimization has been applied to absorption chillers; Gebreslassie et al. assessed the relationship between heat exchange area and exergy. They used a structural method to obtain a simplified equation to estimate the optimum heat exchanger area for absorption chillers. Their analysis also concluded that in the optimum case the highest exergy destruction sources were in the solution heat exchanger and the condenser with all components decreasing their destruction rates as the heat exchange area increased [25]. Optimization of a double effect absorption chiller by Ghani et al. showed that there was a relationship between temperatures, COP and exergy. They were able to conclude that an increase in temperature in the generator yielded an increase in exergy efficiency [26].
A second law-based thermodynamic analysis of water and lithium bromide absorption refrigeration by Kilic and Kaynakli showed exergy loss rates for the major components of the chiller. They were able to conclude that the generator, absorber and evaporator were the largest sources of exergy destruction. They also showed good agreement with Ghani et al. in by increasing the heat source temperatures in the generator resulted in an increase in COP and exergy efficiency of the system [27].
Osta-Omar and Micallef created a mathematical model of a LiBr and water absorption refrigeration system. Their model incorporated an adiabatic absorber with the goal of identifying key parameters that influence LiBr mass concentrations for both strong and weak solutions. By plotting generator temperatures vs. COP, they showed that increasing temperatures in the generator resulted in a diminishing increase in COP [28].
The purpose of this paper is to develop a model to assess the University of Idaho (UI) chilled water system and determine the primary sources of exergy losses within the absorption chiller. By utilizing energy and exergy analysis models presented, methods for improving the exergy efficiency of an absorption chiller can be found by making adjustments to the LiBr concentration. Using this analysis also provides ways to evaluate efficiencies of an absorption driven chiller system.
2. Methodology
Using a thermodynamic approach in the case study considered here. To facilitate and insure accuracy in calculation, Engineering Equation Solver (EES) Version 9.911 was used throughout the study. State points were calculated using thermodynamic properties provided with the EES software package using measurements of temperatures, pressures and flow rates entering and leaving the absorption chiller. Aqueous lithium bromide property routines in EES are used to calculate properties internally [29,30,31]. From these values, specific enthalpy and specific entropy was evaluated. Specific exergy, exergy destruction rates and efficiencies were then calculated using those results for a steady state system. Quantification of the effect of LiBr on exergy efficiency is done by a parametric analysis on weak solution concentration.
2.1. Exergy
Exergy is always evaluated with respect to a dead state. This “dead” or reference state is defined at the beginning of the analyses. Useable work requires a difference between states of the system and the surrounding environment [32]. The reference state is often set by the ambient weather conditions at the time of the analysis. Exergy is always destroyed in real processes do to inherent irreversibilities, the exergy balance of a general system can be written as:
Equation (1) can be formulated on a rate basis for a steady state system; allowing for optimizing the thermodynamic system to be calculated:
The exergy rate () is associated with heat transfer () and work () in Equation (2) are defined in Equations (3) and (4) respectively. The mass flow rate () is multiplied by the specific exergy (Ψ) entering and leaving the system boundary and is denoted by the in and out subscripts. () is the exergy destruction term and is the internal change of exergy within the system and is equal to zero in steady state conditions. Tb is the system boundary absolute temperature where the heat transfer is occurring:
The exergy associated with work () is defined as:
The specific exergy for each flow state, the measure of the maximum work that can be generated from the flow associated with the dead state can be expressed as:
Equation (5) demonstrates one of the important attributes of exergy: the amount of useful work that can be extracted from a system is measured by the maximum work by bringing the system to a state of equilibrium with the reference state [33]. The subscript f represents flow and is associated with the enthalpy (h), entropy (s), velocity (V) height (Z) and gravity (g). T0, h0 and s0 are the dead state temperature, enthalpy and entropy respectively. The energy efficiency (ηen) of the chillers considered here is a measure of useful energy is produced from a given input and can be expressed in Equation (6); for cooling cycles this is often represented as the COP. For absorption chillers, the COP is defined based on the heat transfers associated with the evaporator and the generator [16].
The mass flow rate of the chilled water (cw) and steam (st) are defined as ṁcw and ṁst respectively. Δh is the enthalpy change associated with the chilled water and steam. Ẇp is the electrical work supplied to the solution pump. Exergetic efficiency (ηx) is defined in for an absorption chiller in general terms in Equation (7):
The exergetic efficiency evaluates the exergetic efficiency of the absorption chiller with ΔΨ equal to the change in exergy of the flow of steam and chilled water. is the work exergy applied to the pump.
2.2. Scope Definition
The scope of this assessment revolves around the absorption chiller at the UI energy plant. Evaluation of the exergy destruction rate that occurs within the chiller will be performed and the resulting impact on the utilization of steam. This chiller is steam driven using a biomass boiler. Exergy loss and life cycle irreversibility of the absorption chiller is the criterion applied and identifying exergy losses associated with using natural resources [34,35]. For simplicity of calculation, equipment and processes for delivering wood chips to the boiler as well as pumping costs associated with the chilled water system have been neglected. Wood chip fuel for the boiler is sourced from various locations in the inland northwest region of the US and would require separate assessment as their processes vary greatly. The scope and emphasis of this assessment is solely on the production of chilled water at the UI energy plant for use in the cooling of campus. The primary focus is on the steam driven absorption chiller. The absorption chiller is not the only use of steam; however as these component operate independent of the chillers they will be neglected.
3. Case Study: University of Idaho Energy Plant
The University of Idaho (UI) campus in Moscow, ID, USA uses a DE system for heating and cooling. This system is composed of a biomass boiler for steam production that is primarily used for heating. The district energy plant at UI provides 120 million kg of steam annually. The 10.4 MW biomass boiler was installed in 1986 as the later part of the Clean Air act of 1963 and joint contributions from local logging companies. An Enviro-exergy sustainability analysis of the boiler has been studied by Compton and Rezaie. They were able to conclude that the boiler has a thermal efficiency of 76% and an exergy efficiency of 24% [36]. The boiler is designed to produce steam by utilizing wood chips from the local forestry operations. This wood is primarily western red cedar and has a higher heating value of 19.92–22.56 MJ/kg on a dry basis [37]. The steam is split between the campus demands and the absorption chiller.
A portion of the cooling needs of the UI campus are provided by a system that utilizes a steam-driven lithium bromide (LiBr) absorption chiller. The absorption chiller is classified as indirect single-effect chiller; these chillers use low pressure steam or hot water as a heat source and contain only one condenser and generator and operate under partial vacuums. During the primary cooling season the absorption chiller utilizes 27% of this steam to produce chilled water. This chilled water is utilized on the UI campus primarily for cooling. In order to meet the necessary cooling demand the University of Idaho campus employs the use of additional electrical compression chillers as well as a thermal storage tank (TES).
The TES contains 7500 m3 of water. This tank is charged each night and discharged during the peak heating demands of the day to reduce the less efficient usage of the electric chillers. The electric chillers operate mostly during the cool night and early morning hours to assist the absorption chiller in charging the storage tank. The chillers are staged to allow the absorption chiller to run at a full and constant capacity throughout the cooling season. When the load is greater than what is able to be provided by the absorption chiller, additional electric chillers as well as the TES are used. When the campus cooling load is less than the full capacity of the absorption chiller, the TES is used and recharged with the absorption chiller to facilitate the fully loaded efficiencies of the chiller.
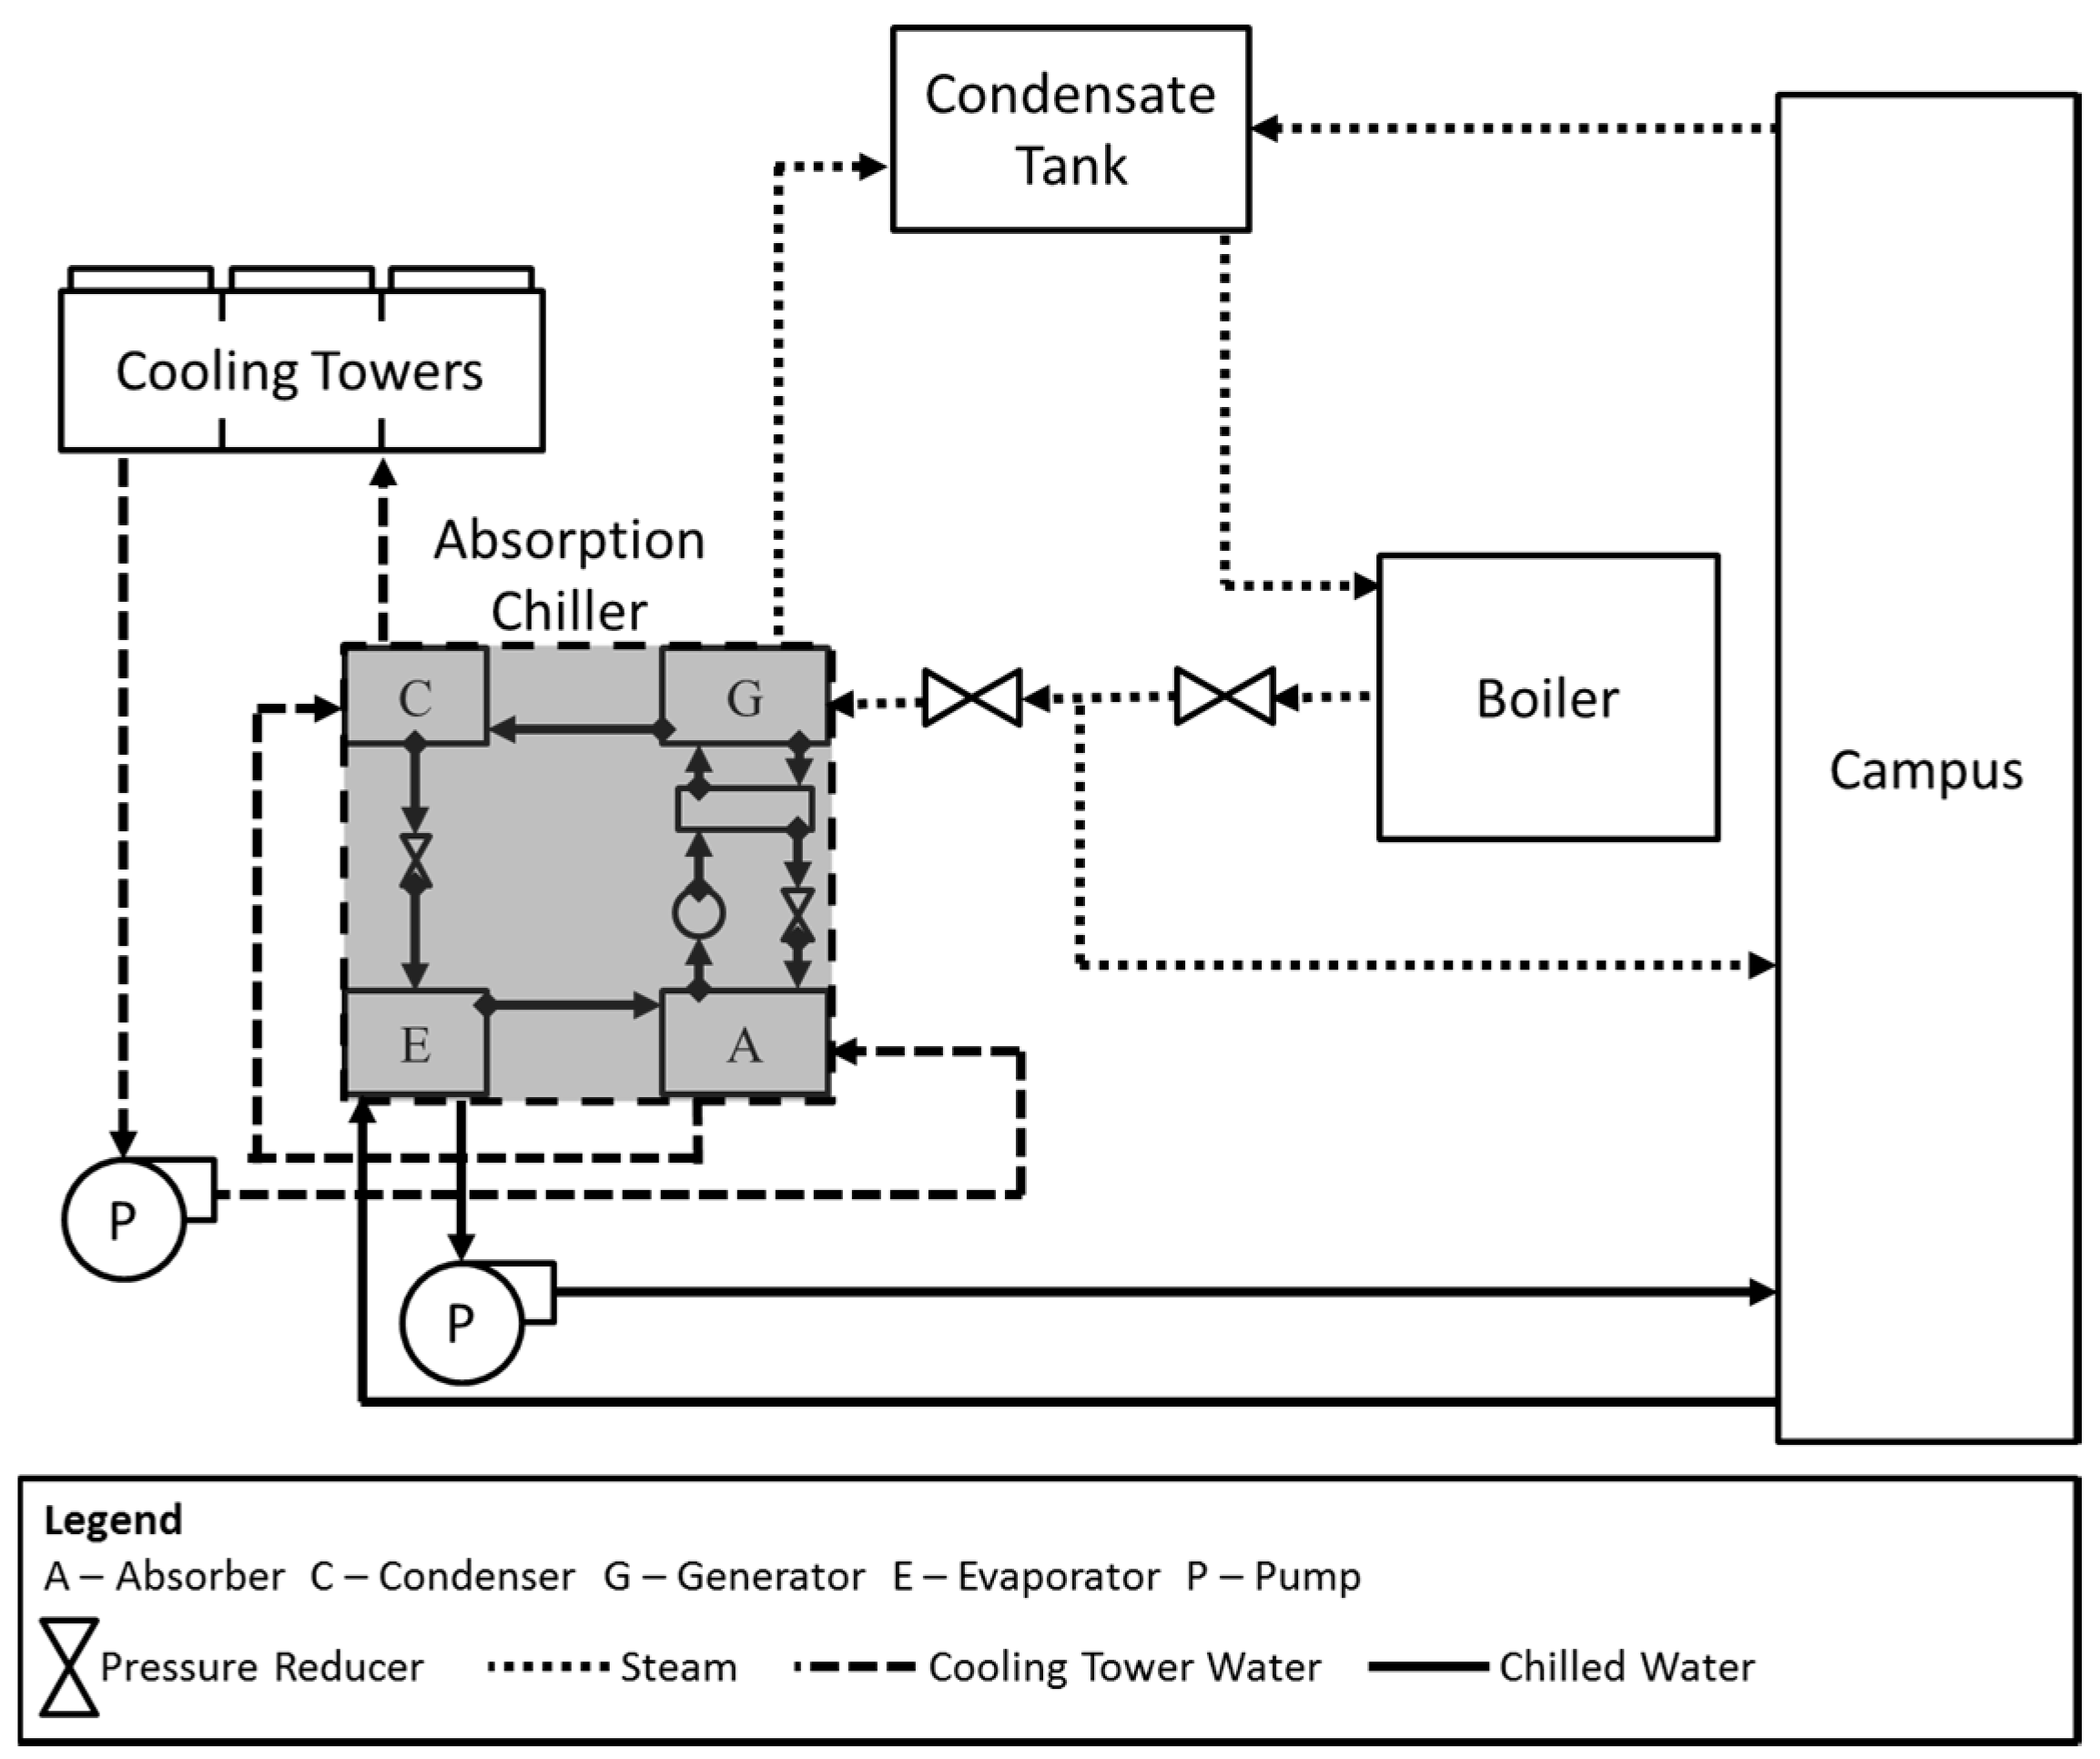
The UI energy plant contains a biomass boiler, an electric chiller and the absorption chiller. A second location on campus houses the other electric chillers and the TES. Figure 1 shows the boiler and absorption chiller located in the energy plant. Saturated steam exits the boiler at 998 kPa; where the pressure is reduced to 515 kPa before the flow splits. The steam that is utilized by the absorption chiller has its pressure reduced further to 194.8 kPa while the remaining steam is sent for use on campus. The steam enters the generator portion of the absorption chiller as a superheated vapor and exits as a subcooled liquid.
The cooling tower is designed to be capable of returning 31 °C water during the normal operating season. Water from the cooling towers in pumped through the absorber component of the chiller before it enters the condenser component at 36 °C. The exiting water from the condenser is measured at 42 °C before entering the cooling towers.
Chilled water production from the absorption chiller is done in the evaporator. Warm water at 12.7 °C enters at 81 kg/s and exits at 6.3 °C. This chilled water is combined with chilled water produced from the other chillers and transported for use on campus through pumps. Unused chilled water is delivered to the storage tank for later use. As a result of the electric chillers and storage tank setup, the absorption chiller is allowed to operate in a nearly steady state condition.
Data was collected from the absorption chiller; this consisted of external temperatures and flow rates for water and steam as they entered and exited each component. The dead state temperature and pressure were determined at the same time as recorded measurements were taken, this occurred on 15 September 2016 at 11 am. This day was used as it represented typical operating and load conditions. A list of those values in provided in Table 1. Solution concentration is documented during routine maintenance and when periodic testing is done. Concentration evaluation is done using a hydrometer specifically calibrated for the equipment to allow adjustments of 0.5% concentration by mass.
In order to fully evaluate the absorption chiller performance, internal operating conditions should be known. As the equipment was not designed with internal instrumentation, a model was constructed to closely meet each condition measured externally. Using EES energy and exergy balances were performed on each component to determine exergy destruction rates.
The absorption chiller is classified as single effect; a typical cycle schematic is shown in Figure 2. The steam the absorber uses is fully condensed and throttled to meet a chilled water temperature difference and set point. The absorption chiller operates continuously throughout the cooling season except during routine maintenance. The absorber and condenser components exhaust heat to an induced draft cooling tower which operates in a primarily dry environment. Additional chilled water loads are accomplished through the use of electric vapor compression chillers. The chilled water produced is utilized for cooling buildings and processes on campus.
A diagram of the absorption chiller is shown in Figure 2. This is typical of a single effect absorption chiller that using lithium bromide as the absorbent and water as the refrigerant. This equipment operates in vacuum pressures. As a result this provides limited access to internal operation conditions. By using data collected from flows that enter and exit the components, and modeling of internal components, evaluation of exergy can be accomplished. Conditions that were measured externally and used for the analysis are shown in Table 1. State 1 is defined by a measured temperature and pressure of the superheated steam entering the generator. State 2 is calculated by measurements at state 3 and state 1. State 3 is defined by the temperate and atmospheric pressure of the condensate return tank.
Currently the University of Idaho records data digitally at 5 min intervals for the equipment analyzed in this assessment. Steam flow rate is measured on the condensate return side of the absorption chiller. Both steam pressure and temperature are recorded just prior to entering the generator component of the chiller. Cooling tower flow rates are measured by the circulation pumps, and temperatures are recorded just outside of the absorber and condenser components. Chilled water flow rates are also measured at the pumps and temperatures are measured at the inlet and exits of the evaporator by the control system of the chiller. Solution concentration is measured and adjusted during routine maintenance cycles.
To assist in the evaluation of the absorption chiller a numerical model was created in EES. The model was designed to approximate the internal conditions that match external values. Using the model to study on the evaluation of the current state of exergy destruction could be assessed for each component as well as the overall system. As the primary focus of exergy associated of the absorption chiller is evaluated, the height component of the physical exergy in Equation (5) is assumed to be relatively small or negligible for this situation.
4. Analysis
Using Equation (2), the absorption chiller is analyzed with the environment conditions of the chiller: a dead state temperature of 300.0 K and a pressure of 101.7 kPa. Using the equations of state provided by the EES software package, energy balances and Equation (5) for exergy analysis, the thermodynamic properties of each state point have been summarized in Table 2. The points listed in Table 2 are referenced to those points labeled in Figure 2 where state points 1–8 are based on the external measured values and 9–18 are calculated using the model. Values of enthalpy, entropy and exergy presented in the table are referenced to a common datum or reference point within EES.
For modeling purposes it is assumed that the chiller operates in a steady state condition. Internally, states 9 through 12 are considered pure water with the assumption that the water leaving the condenser is a saturated liquid and leaving the evaporator as a saturated vapor. As the cooling tower is oversized for the equipment currently in place, excess heat is always removed from the flow. Each component is considered adiabatic with respect to the other internal components. States 13 through 15 contains a mixture of lithium-bromide and water at a weak solution and states 16 through 18 a strong solution. Pump work is considered constant and operates based upon manufacturing specs and operating conditions.
When developing a model of the absorption chiller several factors were taken into account. To insure accuracy of the model all state points were referenced to a common datum point. In EES many of the Lithium-Bromide equations of state have separate reference points from water and needed to be addressed before calculation of properties.
Evaluation of the exergy destruction within the absorption chiller was calculated using Equation (2). Each component was evaluated individually as well as the chiller as a whole. Then using the model, a prediction could be made of potential improvements to reduce exergy destruction within the chiller and improve the overall sustainability. Table 3 shows a list of the equations used for evaluation of the exergy destruction rates for each of the components.
Evaluation of the exergetic efficiency and exergy destruction of the absorption chiller and its components were done within the model. Shown in Equations (8) and (9) are the equations used to calculate the COP and exergy efficiency, respectively:
Using the model, additional analysis can be done; evaluation of energetic and exergetic efficiencies as well as performance predictions can also be made for each of the components. By using a model that approximates the internal system, changes to various components and concentrations can be made to gain potential insight. Predicting improvements made in exergy destruction rates present potential changes that warrant farther testing or experimentation.
5. Results and Discussion
Overall the absorption chiller on the University of Idaho campus is responsible for an exergy destruction rate of 870.1 kW. Using the model analysis the dominant sources of exergy destruction are the condenser (27.6%), absorber (30.5%) and generator (30.6%). The exergy efficiency is estimated to be 15.6% and a COP of 0.65. Improvement in these components is directly related to the internal processes as well as the physical heat exchanger design.
Changing the heat exchangers is often difficult and costly, especially when a chiller is already in operation; but adjustment to the internal composition of lithium-bromide and water may yield lower cost improvements. To provide potential improvements to the current system evaluation of the influence of various concentration percentages is needed. This is done by selecting an assessment range to cover from 52% to 62% lithium-bromide by mass. Higher concentrations beyond 62% yielded strong solution concentration percentages too close to the crystallization line and would result in potential damage to the equipment. The minimum solution concentration was chosen to explore the results lower than the suggested operation range for the chiller at the University of Idaho.
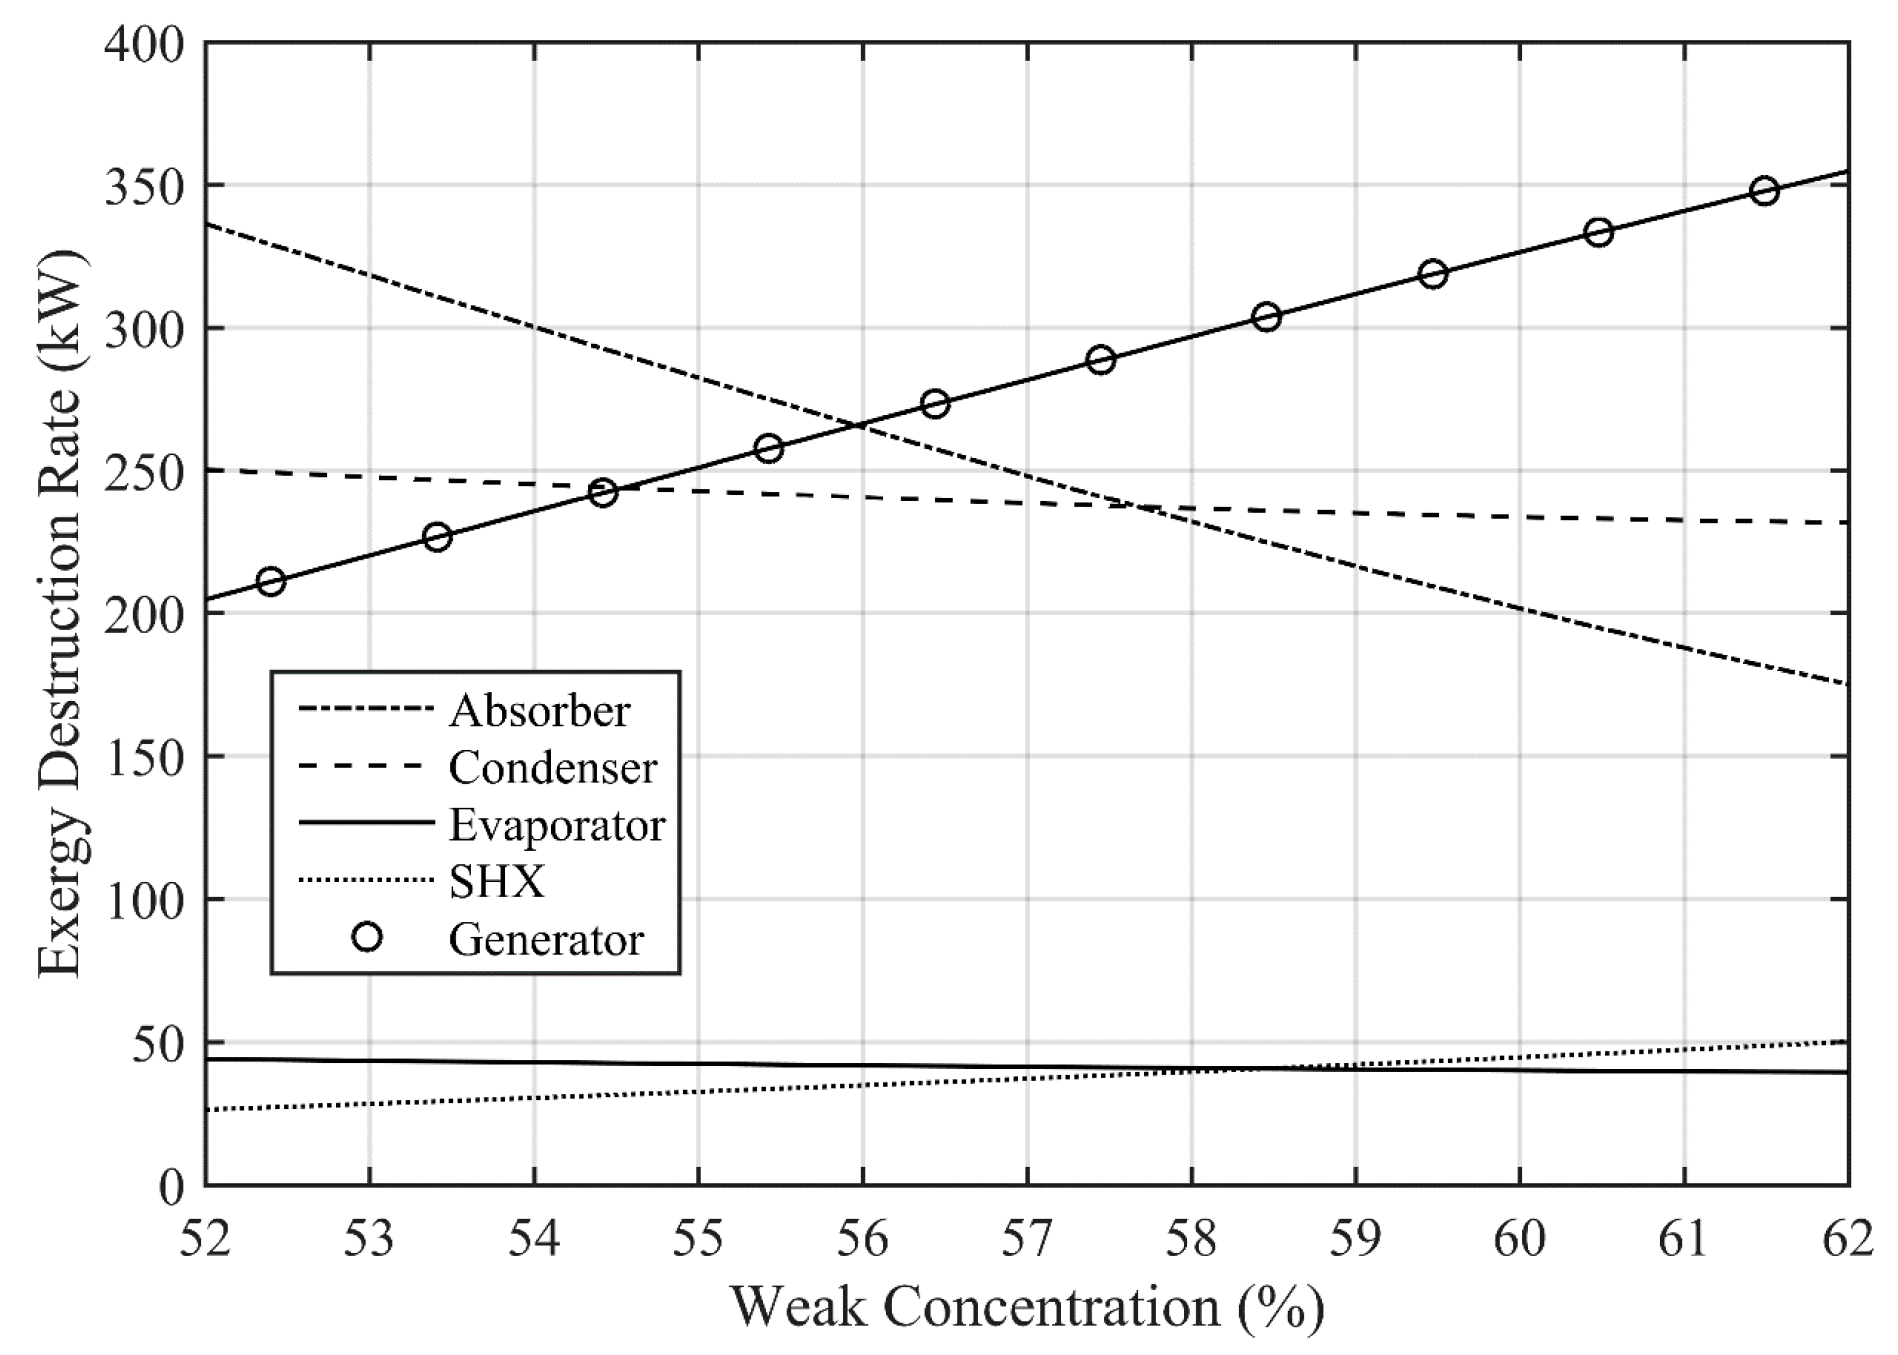
To evaluate the variations in the model it was assumed that the available heat from the steam could not change, this is because the current steam production and usage at the University of Idaho is not easily adjustable. It is also assumed that the temperature entering the absorber component is constant since the cooling tower is always able to meet the demands of the chiller and return the appropriate water temperature. Figure 3 shows the impact of concentration adjustment on the exergy destruction rates of the major components. As concentration increases the absorber, condenser and evaporator decrease their exergy destruction rates while the generator and the solution heat exchanger (SHX) increase their exergy destruction rates.
The solution pump and valves are not shown as their contribution to the overall exergy destruction is minimal. Comparison of individual components provides insight into the inner workings of the chiller. As the solution concentration increases more heat or higher temperature steam utilization is necessary to drive off the water into the refrigerant side. This increased heat gain by the remaining now strong solution causes a higher temperature differential in the solution heat exchanger yielding a greater destruction rate.
The generators exergy destruction rate is expected to increase proportional to the change in concentration as it requires more heat to drive an equivalent amount of water out of the LiBr solution. Likewise, the absorber benefits from these changes, as the strong solution is more efficiently able to return to a weak solution, this is shown by the decreasing exergy destruction rate.
The condenser is shown to decrease its exergy destruction rate as the concentration increases. As the higher temperature facilities better heat transfer to the cooling tower loop. Fluid conditions exiting the condenser are constant. This is a result of the cooling tower being oversized for the equipment using it. The influence of this causes the Evaporator to have minimal changes over the range of study.
The SHX increases its exergy destruction rate as a result of the larger temperature differential that occurs from the higher generator output temperatures.
Changing the solution concentration has an effect on cooling capacity, shown in Figure 4. The analysis shows that in increase in maximum cooling capacity is expected as the concentration is reduced from 56%. By increasing the concentration of lithium-bromide the maximum capacity decreases. This change is nearly proportional to the increase in concentration.
Total exergy destruction, shown in Figure 5, a minimum point is expected in the 57%–60% range; as the chiller is designed to operate in this area. Temperatures, heat sources, flow rates, and heat exchangers were designed for these operating ranges and adjustments significantly outside of this region would not typically be available. The total exergy destruction rate indicates a minimum at 58.8% lithium-bromide concentration; this would result in a decrease of exergy destruction rate of 0.4% and a decrease in the maximum cooling capacity by 3%.
At the optimum point the increase of 2.8% concentration results in an increase in the temperatures primarily at the generator as shown in Table 4. The increase in temperatures reflects trends seen in operation of the chiller.
By predicting increase in temperatures that will result of this change verification of the results can be done through measurement of the temperature rise associated with the generator and solution heat exchanger. It is expected that the generator should increase in temperature of 5 °C and the solution heat exchanger should increase by approximately 4 °C. These temperature increases result in an overall change in the exergy destruction rates of all the components, as shown in Table 5.
The increase in temperatures results in a decrease in exergy destruction in the condenser, absorber and evaporator. The generator, solution heat exchanger and solution valve increase in exergy destruction rates as a result of the higher temperature of the strong solution. The increase in temperatures also result in a higher temperature or flow rate provided to the cooling tower as additional heat must be extracted in the condenser. This increase should be considered when the cooling tower operates in conditions near its capacity.
6. Validation
Using the model analysis the dominant sources of exergy destruction are the condenser (27.6%), absorber (30.5%) and generator (30.6%). The model conclusion also compares well with the analysis of exergy destruction rates presented by Morosuk and Tsatsaronis. They indicated that the absorber and generator should be the primary focus for improvement [17]. Morosuk and Tsatsaronis were able to identify that the heat exchangers that contained both the highest temperature differences as well as the mixing and separation of LiBr and water should generate the most exergy destruction in the system. This is also identified by the model results. However, since the model is constructed for a specific system, the operating parameters and conditions will differ. In order to validate the model, the model was setup to predict flow rates and temperatures at several points to compare to the given data, shown in Table 6.
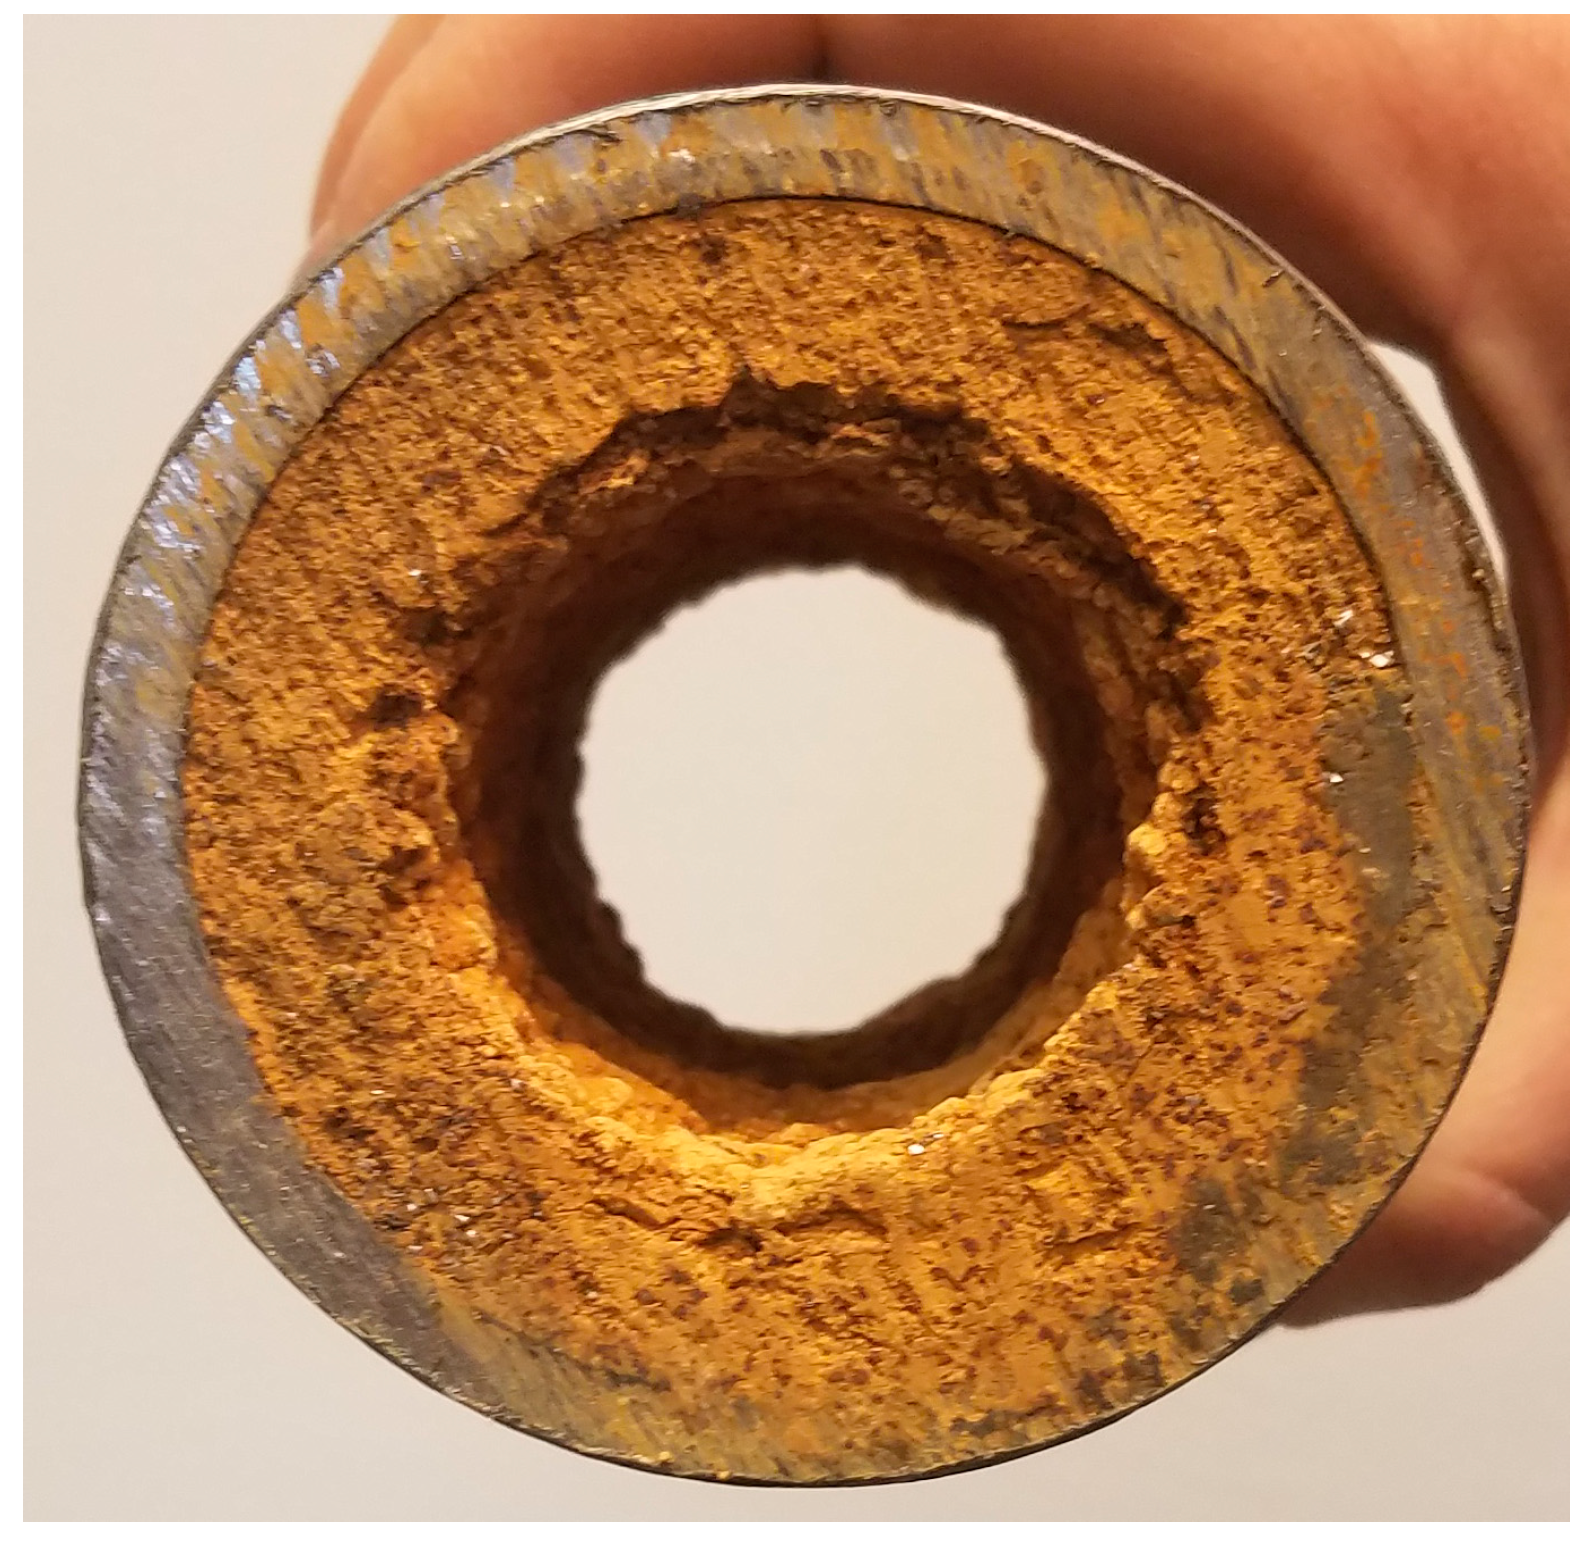
It is shown that the largest error in the model relates to the flow rates of the boiler steam and the cooling tower water. This is expected as the model assumptions do not account for fouling within the chiller. Shown in Figure 6, the fouling within the absorption chiller can significantly influence temperatures and flow rates. The chilled water remains the most accurate as the fluid properties on both sides of the heat exchanger are water.
7. Cost Savings
By reducing the exergy destruction of equipment, less exergy is needed to accomplish the same task. As a result of the staging of the chillers and TES on the UI campus the absorption chiller is able to run constantly at full capacity. By relating the exergy destruction improvements to a steam cost, savings can be found in biomass fuel used by the boiler. The internal cost of operation for the steam production is estimated to $8.95 per thousand kg of steam. The exergy destruction rate of the absorption chiller is shown to be 0.4%. With the generator using an annual 40 million kg of steam the reduction in equipment operation, fuel and electric costs associated with this change is estimated to yield $1798 of annual savings.
8. Conclusions
This study demonstrates the value in analyzing current systems to evaluate for potential improvements. Understanding an absorption chiller even under current operating conditions can yield insight into the components that yield the greatest exergy destruction. In order to drastically improve the exergy destruction rates of the absorption chiller in use by the University of Idaho, changes to the heat exchangers must be made. Improvements to the performance of the heat exchangers can be accomplished by changing the frequency of the maintenance schedule or by replacing the current equipment. Replacement can be a costly solution. Many studies have presented that heat source temperature for the generator can be a driving influence in the performance of the chiller. This solution is difficult as the UI boiler system and steam usage on campus requires specified temperatures and pressures for operation. By optimizing the concentration of lithium-bromide, a potential low cost option, improvements can be made in the exergy destruction rates.
Using measurements taken from a steam driven absorption chiller a mathematical model was used to analyze and identify the major sources of exergy destruction within the chiller. It was shown that the absorber, generator and condenser contribute the most to the exergy destruction at 30%, 31% and 28% respectively. The Parametric studies of the model revealed a minimum exergy destruction rate with an optimum concentration of 58.8%. This 2.8% concentration increase resulted in a net decrease of 0.4% of the exergy destruction caused by the absorption chiller. This change also decreased the exergy destruction within the absorber by 5.1%. The increased concentration was also shown to decrease the maximum cooling capacity by 3% (65 kW) and increase the exergy destruction of the generator by 4.9%. When the cooling capacity is decreased the COP is decreased. When the steam flow rate is decreased the COP is increased. The net change to the COP remains unchanged while the overall exergy efficiency increases.
While the model is unique to the UI campus absorption chiller, the significance of obtaining the optimal range of any absorption chiller would yield insight unique to that chiller. Each model would be useful for monitoring and predicting practical operating parameters. Expanding the scope of this assessment to include the impact on the boiler system as well as the chilled water production would provide the full impact of this change in concentration. Each absorption chiller and energy plant is different and this configuration and exergy assessment show the impacts of the change in lithium bromide on the absorption chiller but a full accounting of all the systems is necessary for a comprehensive picture of the impacts of this analysis.
By reducing the exergy destruction rate, sustainability improves. While small, the improvement require little to no additional hardware adjustments to the current system and the increased temperatures caused by this adjustment will utilize the more of the available cooling tower capacity. Changing the concentration of a lithium bromide absorption chiller should be done in small increments. Adjustments to concentrations will result in impacts on the whole chilled water and steam system and additional consideration should be given to the changes on the pumping costs associated with these results.
Acknowledgments
Financial support provided by College of Engineering, University of Idaho (Richard B Stewart Thermal Science Scholarship Endowment) is gratefully acknowledged. The authors also wish to thank Scott Smith who provided insight and expertise that greatly assisted the research.
Author Contributions
Andrew Lake collected data, also modeling and simulation was with him; Behnaz Rezaie designed and supervised the study; Steven Beyerlein reviewed the experiments and edited the paper. All authors have read and approved the final manuscript.
Conflicts of Interest
The authors declare no conflict of interest.
Nomenclature
| CFCs | Chlorofluorocarbon refrigerants |
| COP | Coefficient of performance |
| DE | District energy |
| EES | Engineering Equation Solver |
| GHGs | Greenhouse gases |
| LiBr | Lithium Bromide |
| TES | Thermal energy storage |
| UI | University of Idaho |
| Ψ | Specific exergy (kJ/kg) |
| h | Specific enthalpy (kJ/kg) |
| Mass flow rate (kg/s) | |
| P | Pressure (kPa) |
| Heat transfer rate (kW) | |
| s | Specific entropy (kJ/kg·K) |
| SHX | Solution Heat Exchanger |
| T | Temperature (°C or K) |
| V | Velocity (m/s) |
| Exergy rate (kJ/kg) | |
| Z | Height (m) |
| ƞ | Efficiency |
Subscripts
| 0 | Reference Property |
| abs | absorber |
| b | boundary |
| cond | Condenser |
| cw | Chilled Water |
| des | Destroyed |
| en | Energy |
| evap | Evaporator |
| g | gravity |
| gen | Generator |
| f | Flow |
| p | Pump |
| Q | heat transfer |
| st | Steam |
| sys | system |
| w | work |
| x | Exergy |
References
- Dincer, I.; Rosen, M.A. Energy, environment and sustainable development. Appl. Energy 1999, 64, 427–440. [Google Scholar] [CrossRef]
- Graedel, T.E.; Allenby, R.B. Industrial Ecology and Sustainable Engineering; Prentice Hall: Upper Saddle River, NJ, USA, 2010. [Google Scholar]
- Rosen, M.A. Assessing energy technologies and environmental impacts with the principles of thermodynamics. Appl. Energy 2002, 72, 427–441. [Google Scholar] [CrossRef]
- Omer, A.M. Energy, environment and sustainable development. Renew. Sustain. Energy Rev. 2008, 12, 2265–2300. [Google Scholar] [CrossRef]
- Sciubba, E.; Wall, G. A brief commented history of exergy from the beginnings to 2004. Int. J. Thermodyn. 2007, 10, 1–26. [Google Scholar]
- Rosen, M.A. Energy sustainability: A pragmatic approach and illustrations. Sustainability 2009, 1, 55–80. [Google Scholar] [CrossRef]
- Srikhirin, P.; Aphornratana, S.; Chungpaibulpatana, S. A review of absorption refrigeration technologies. Renew. Sustain. Energy Rev. 2000, 5, 343–372. [Google Scholar] [CrossRef]
- Lake, A.; Rezaie, B.; Beyerlein, S. Review of district heating and cooling systems for a sustainable future. Renew. Sustain. Energy Rev. 2017, 67, 417–425. [Google Scholar] [CrossRef]
- Hondeman, H. Electrical compression cooling versus absorption cooling—A comparison. IEA Heat Pump Cent. Newsl. 2000, 18, 23–25. [Google Scholar]
- Nijjar, J.S.; Fung, A.S.; Hughes, L.; Taherian, H. District Heating System Design for Rural Nova Scotian Communities Using Building Simulation and Energy Usage Databases. Trans. Can. Soc. Mech. Eng. 2009, 33, 51–63. [Google Scholar]
- Rezaie, B.; Rosen, M.A. District heating and cooling: Review of technology and potential enhancements. Appl. Energy 2012, 93, 2–10. [Google Scholar] [CrossRef]
- Rosen, M.A.; Le, M.N.; Dincer, I. Efficiency analysis of a cogeneration and district energy system. Appl. Therm. Eng. 2005, 25, 147–159. [Google Scholar] [CrossRef]
- Szargut, J.; Morris, D.R.; Steward, F.R. Exergy Analysis of Thermal, Chemical, and Metallurgical Processes; Hemisphere Publishing: New York, NY, USA, 1987. [Google Scholar]
- Şencan, A.; Yakut, K.A.; Kalogirou, S.A. Exergy analysis of lithium bromide/water absorption systems. Renew. Energy 2005, 30, 645–657. [Google Scholar] [CrossRef]
- Gebreslassie, B.H.; Medrano, M.; Boer, D. Exergy analysis of multi-effect water-LiBr absorption systems: From half to triple effect. Renew. Energy 2010, 35, 1773–1782. [Google Scholar] [CrossRef]
- Talbi, M.M.; Agnew, B. Exergy analysis: An absorption refrigerator using lithium bromide and water as the working fluids. Appl. Therm. Eng. 2000, 20, 619–630. [Google Scholar] [CrossRef]
- Morosuk, T.; Tsatsaronis, G. A new approach to the exergy analysis of absorption refrigeration machines. Energy 2008, 33, 890–907. [Google Scholar] [CrossRef]
- Ayres, R.U.; Ayres, L.; Martinas, K. Eco-Thermodynamics: Exergy and Life Cycle Analysis; INSEAD: Fontainebleau, France, 1996; pp. 1–22. [Google Scholar]
- Talens, L.; Lombardi, L.; Villalba, G.; Gabarrell, X. Life cycle assessment (LCA) and exergetic life cycle assessment (ELCA) of the production of biodiesel from used cooking oil (UCO). Energy 2010, 35, 889–893. [Google Scholar] [CrossRef]
- Dincer, I.; Rosen, M.A. Thermodynamic aspects of renewables and sustainable development. Renew. Sustain. Energy Rev. 2005, 9, 169–189. [Google Scholar] [CrossRef]
- Dincer, I.; Rosen, M.A. A worldwide perspective on energy, environment, and sustainable development. Int. J. Energy Res. 1998, 22, 1305–1321. [Google Scholar] [CrossRef]
- Dincer, I. The role of exergy in energy policy making. Energy Policy 2002, 30, 137–149. [Google Scholar] [CrossRef]
- Rosen, M.A.; Dincer, I. Exergy as the confluence of energy, environment and sustainable development. Exergy Int. J. 2001, 1, 3–13. [Google Scholar] [CrossRef]
- Bereche, R.P.; Palomino, R.G.; Nebra, S.A. Thermoeconomic analysis of a single and double-effect LiBr/H2O absorption refrigeration system. Int. J. Thermodyn. 2009, 12, 89–96. [Google Scholar]
- Gebreslassie, B.H.; Medrano, M.; Mendes, F.; Boer, D. Optimum heat exchanger area estimation using coefficients of structural bonds: Application to an absorption chiller. Int. J. Refrig. 2010, 33, 529–537. [Google Scholar] [CrossRef]
- Ghani, M.U.; Zaman, M.; Khan, I. Thermodynamic modeling and optimization of double effect series flow LiBr-H2O vapor absorption chiller. In Proceedings of the ICET 2016 International Conference on Emerging Technologies, Singapore, 7–8 January 2016. [Google Scholar]
- Kilic, M.; Kaynakli, O. Second law-based thermodynamic analysis of water-lithium bromide absorption refrigeration system. Energy 2007, 32, 1505–1512. [Google Scholar] [CrossRef]
- Osta-Omar, S.; Micallef, C. Mathematical Model of a Lithium-Bromide/Water Absorption Refrigeration System Equipped with an Adiabatic Absorber. Computation 2016, 4, 44. [Google Scholar] [CrossRef]
- Boryta, D.A. Solubility of lithium bromide in water between –50.deg. and +100.deg. (45 to 70% lithium bromide). J. Chem. Eng. Data 1970, 15, 142–144. [Google Scholar] [CrossRef]
- Yuan, Z.; Herold, K.E. Specific Heat Measurements on Aqueous Lithium Bromide. HVAC R Res. 2005, 11, 361–375. [Google Scholar] [CrossRef]
- Yuan, Z.; Herold, K.E. Thermodynamic properties of aqueous lithium bromide using a multiproperty free energy correlation. HVAC R Res. 2005, 11, 377–393. [Google Scholar] [CrossRef]
- Gaggioli, R.A. The dead state. Int. J. Thermodyn. 2012, 15, 191–199. [Google Scholar] [CrossRef]
- Sciubba, E.; Bastianoni, S.; Tiezzi, E. Exergy and extended exergy accounting of very large complex systems with an application to the province of Siena, Italy. J. Environ. Manag. 2008, 86, 372–382. [Google Scholar] [CrossRef] [PubMed]
- Finnveden, G.; Ostlund, P. Exergies of natural resources in life-cycle assessment and other applications. Energy 1997, 22, 923–931. [Google Scholar] [CrossRef]
- Cornelissen, R.L.; Hirs, G.G. The value of the exergetic life cycle assessment besides the LCA. Energy Convers. Manag. 2002, 43, 1417–1424. [Google Scholar] [CrossRef]
- Compton, M.; Rezaie, B. Enviro-exergy sustainability analysis of boiler evolution in district energy system. Energy 2017, 119, 257–265. [Google Scholar] [CrossRef]
- Wilson, P.L.; Funck, J.W.; Avery, R.B. Fuelwood Characteristics of Northwestern Conifers and Hardwoods (Updated). Available online: http://www.biomasseastportmaine.com/pnw_gtr810.pdf (accessed on 31 March 2017).
Figure 1.
Simplified diagram of University of Idaho energy plant.

Figure 2.
Single effect absorption chiller diagram (gray area from Figure 1).
Figure 2.
Single effect absorption chiller diagram (gray area from Figure 1).
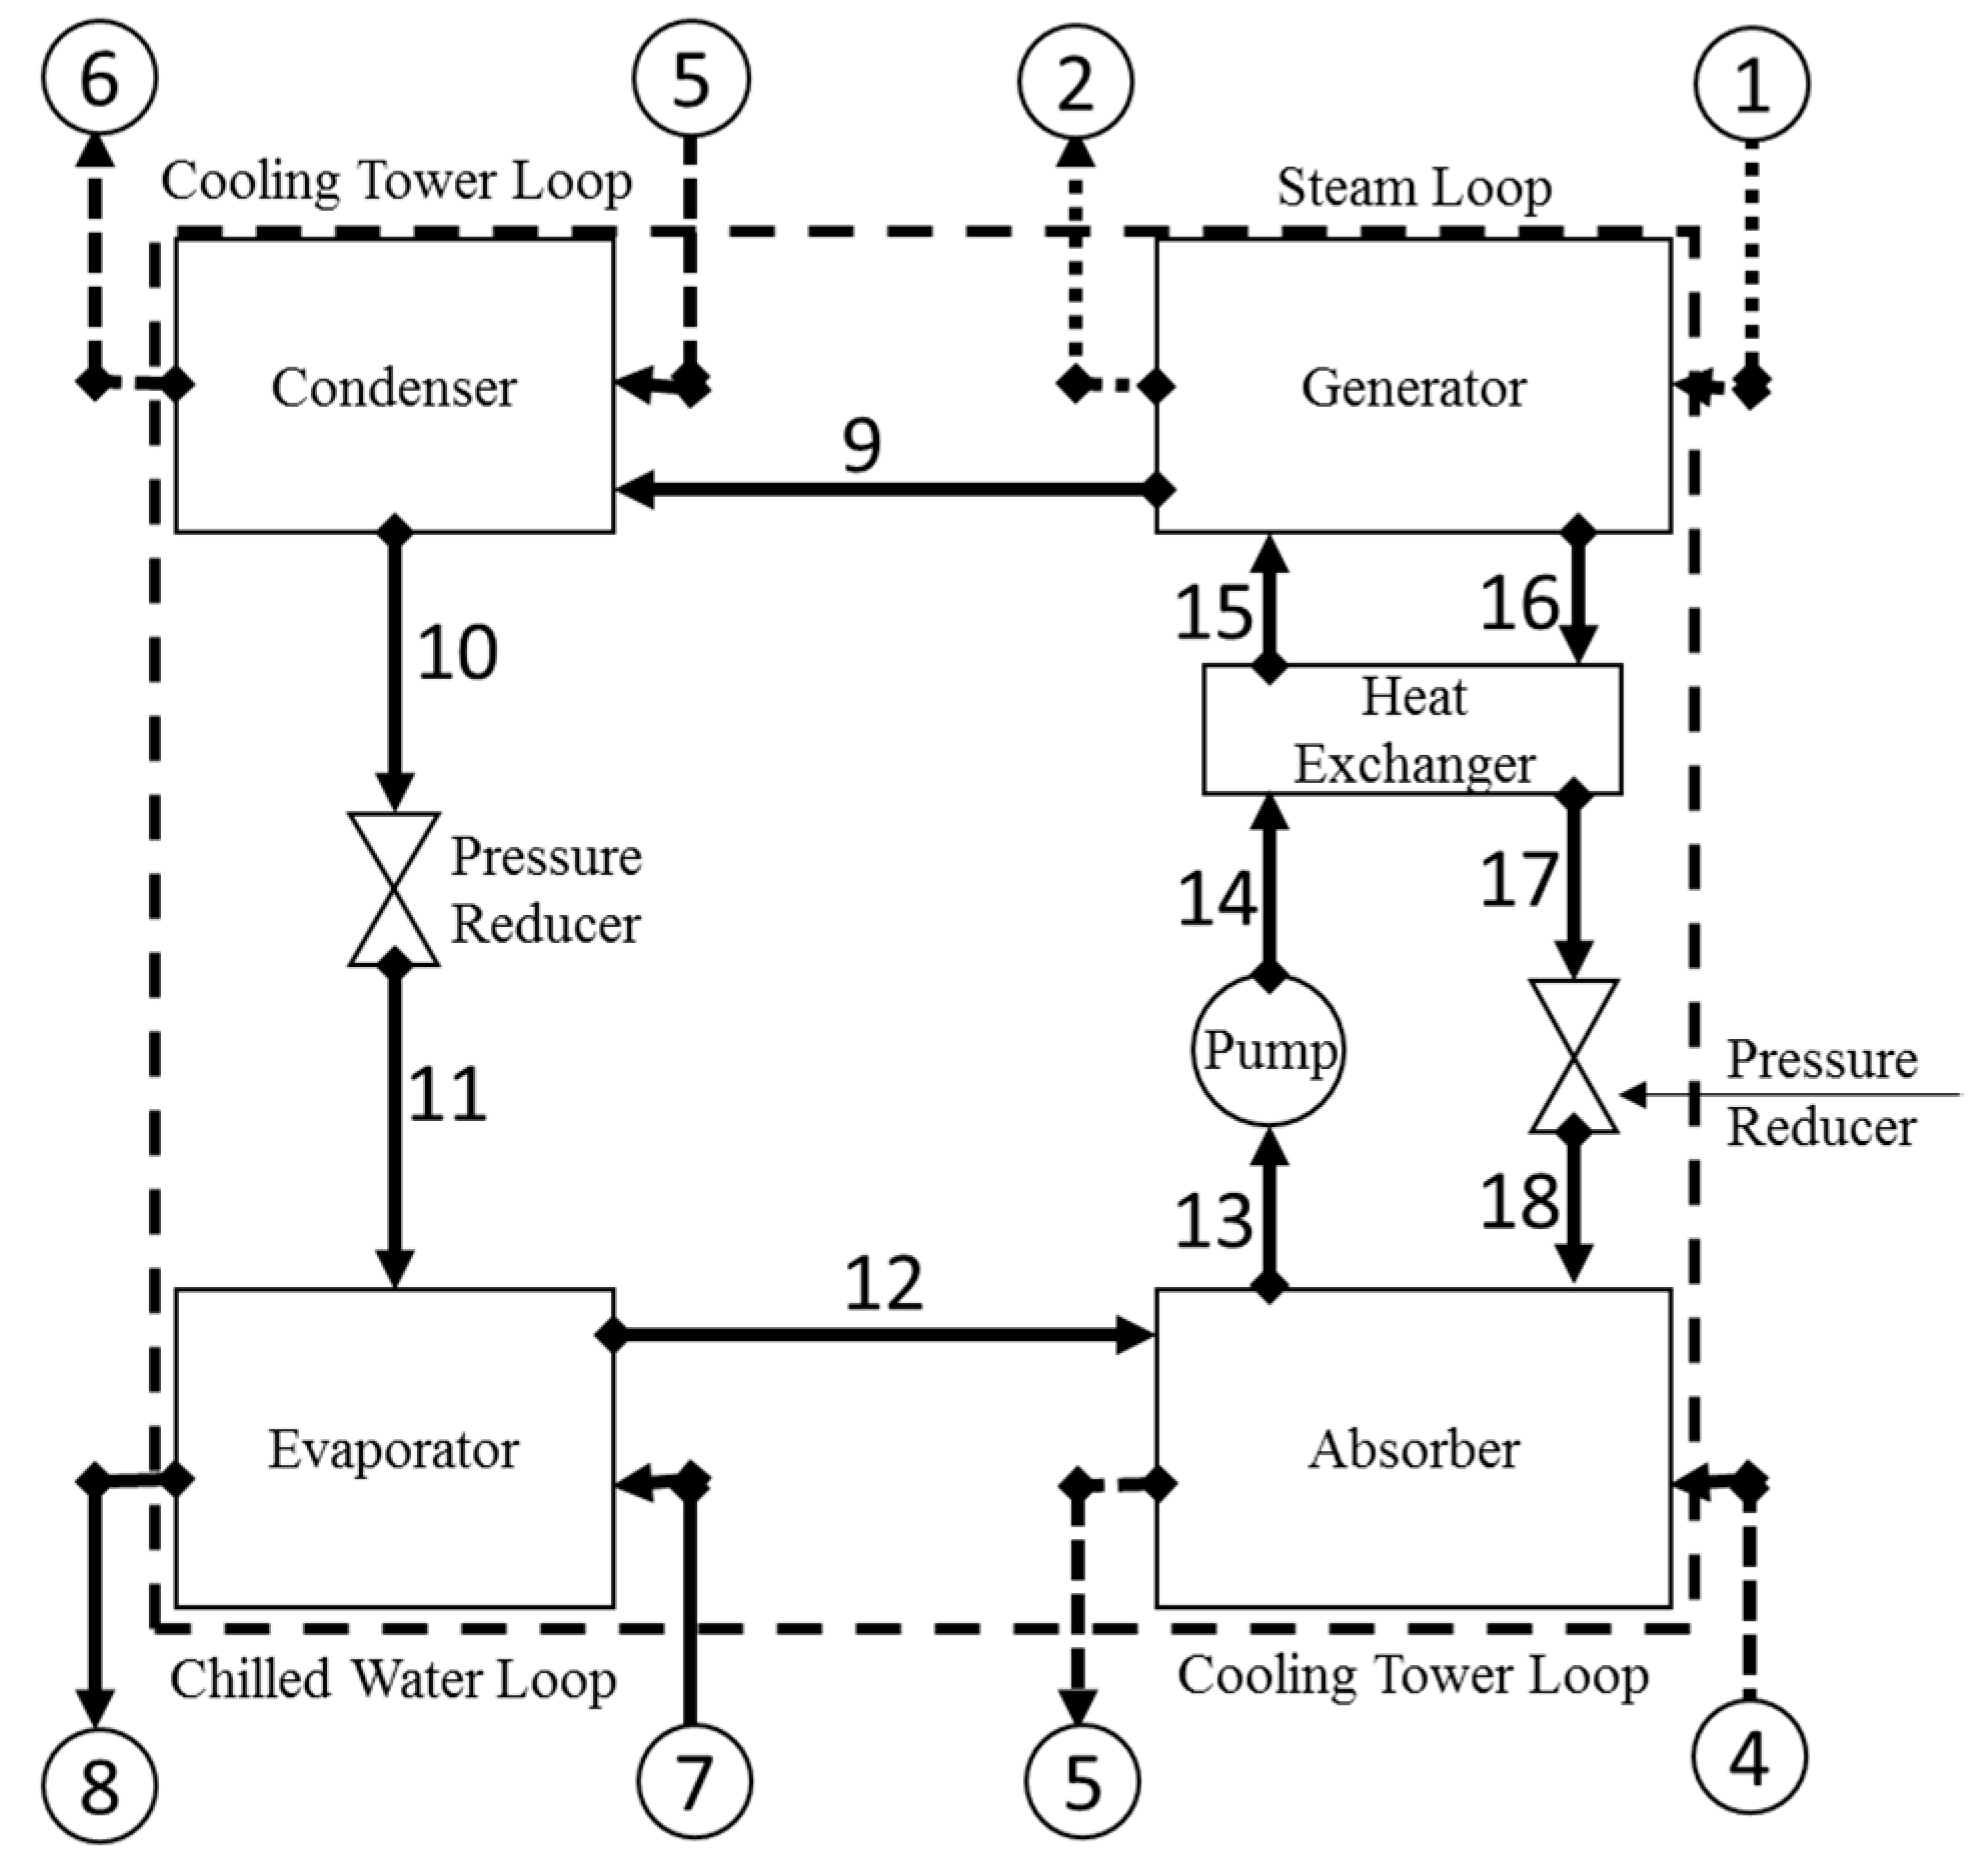
Figure 3.
Exergy destruction rate as a function of weak solution concentration.

Figure 4.
Percent change in cooling capacity as a function of weak concentration.
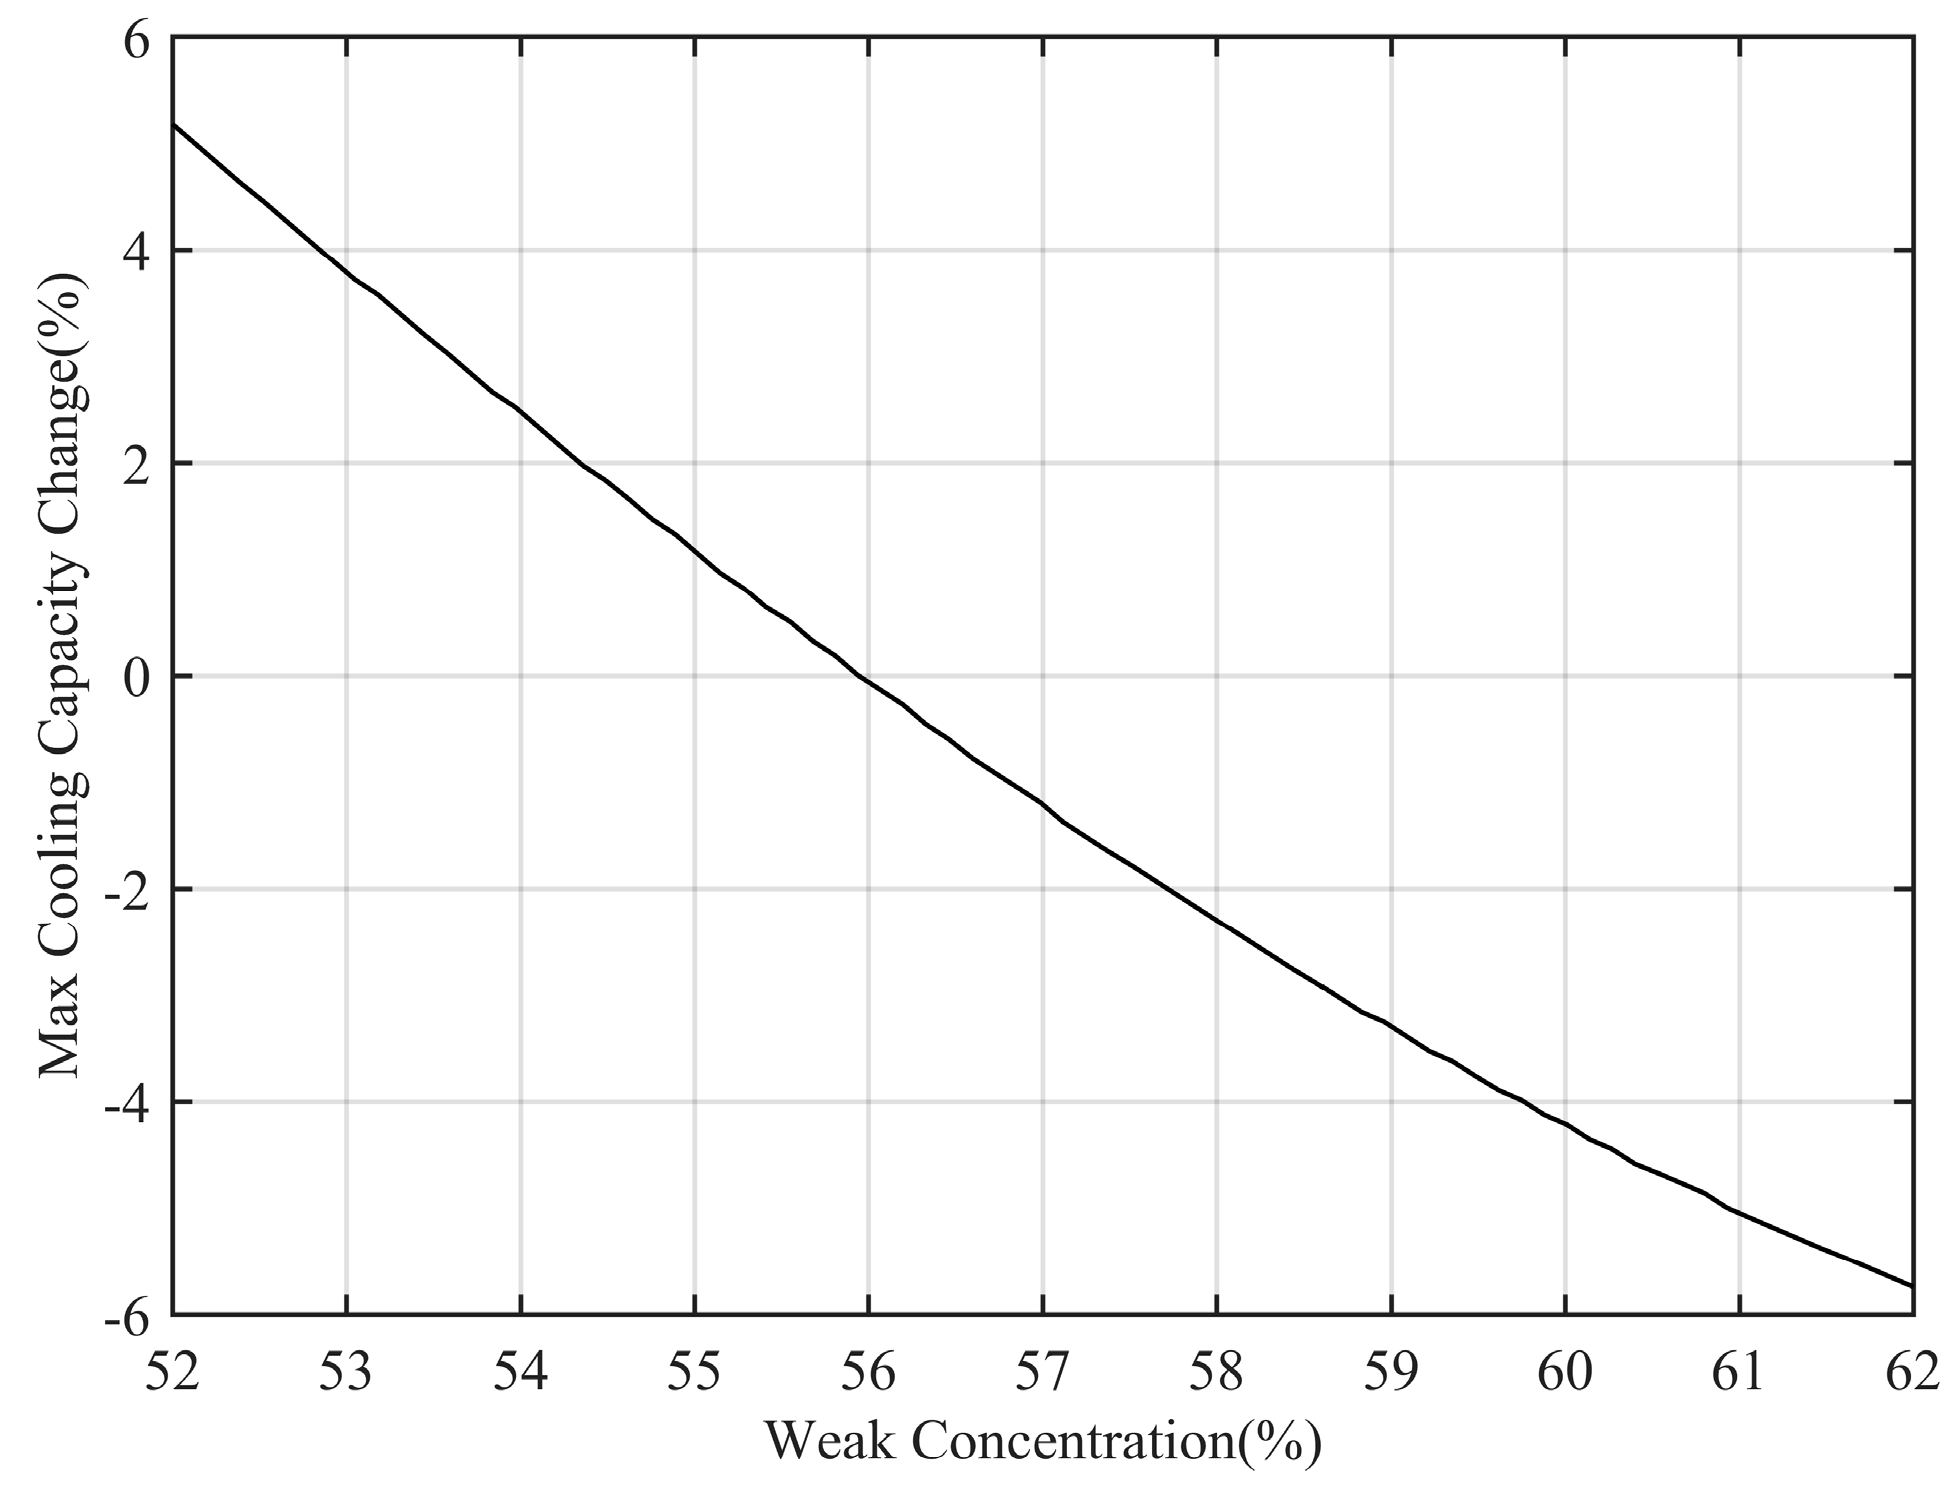
Figure 5.
Total exergy destruction rate as a function of weak concentration.
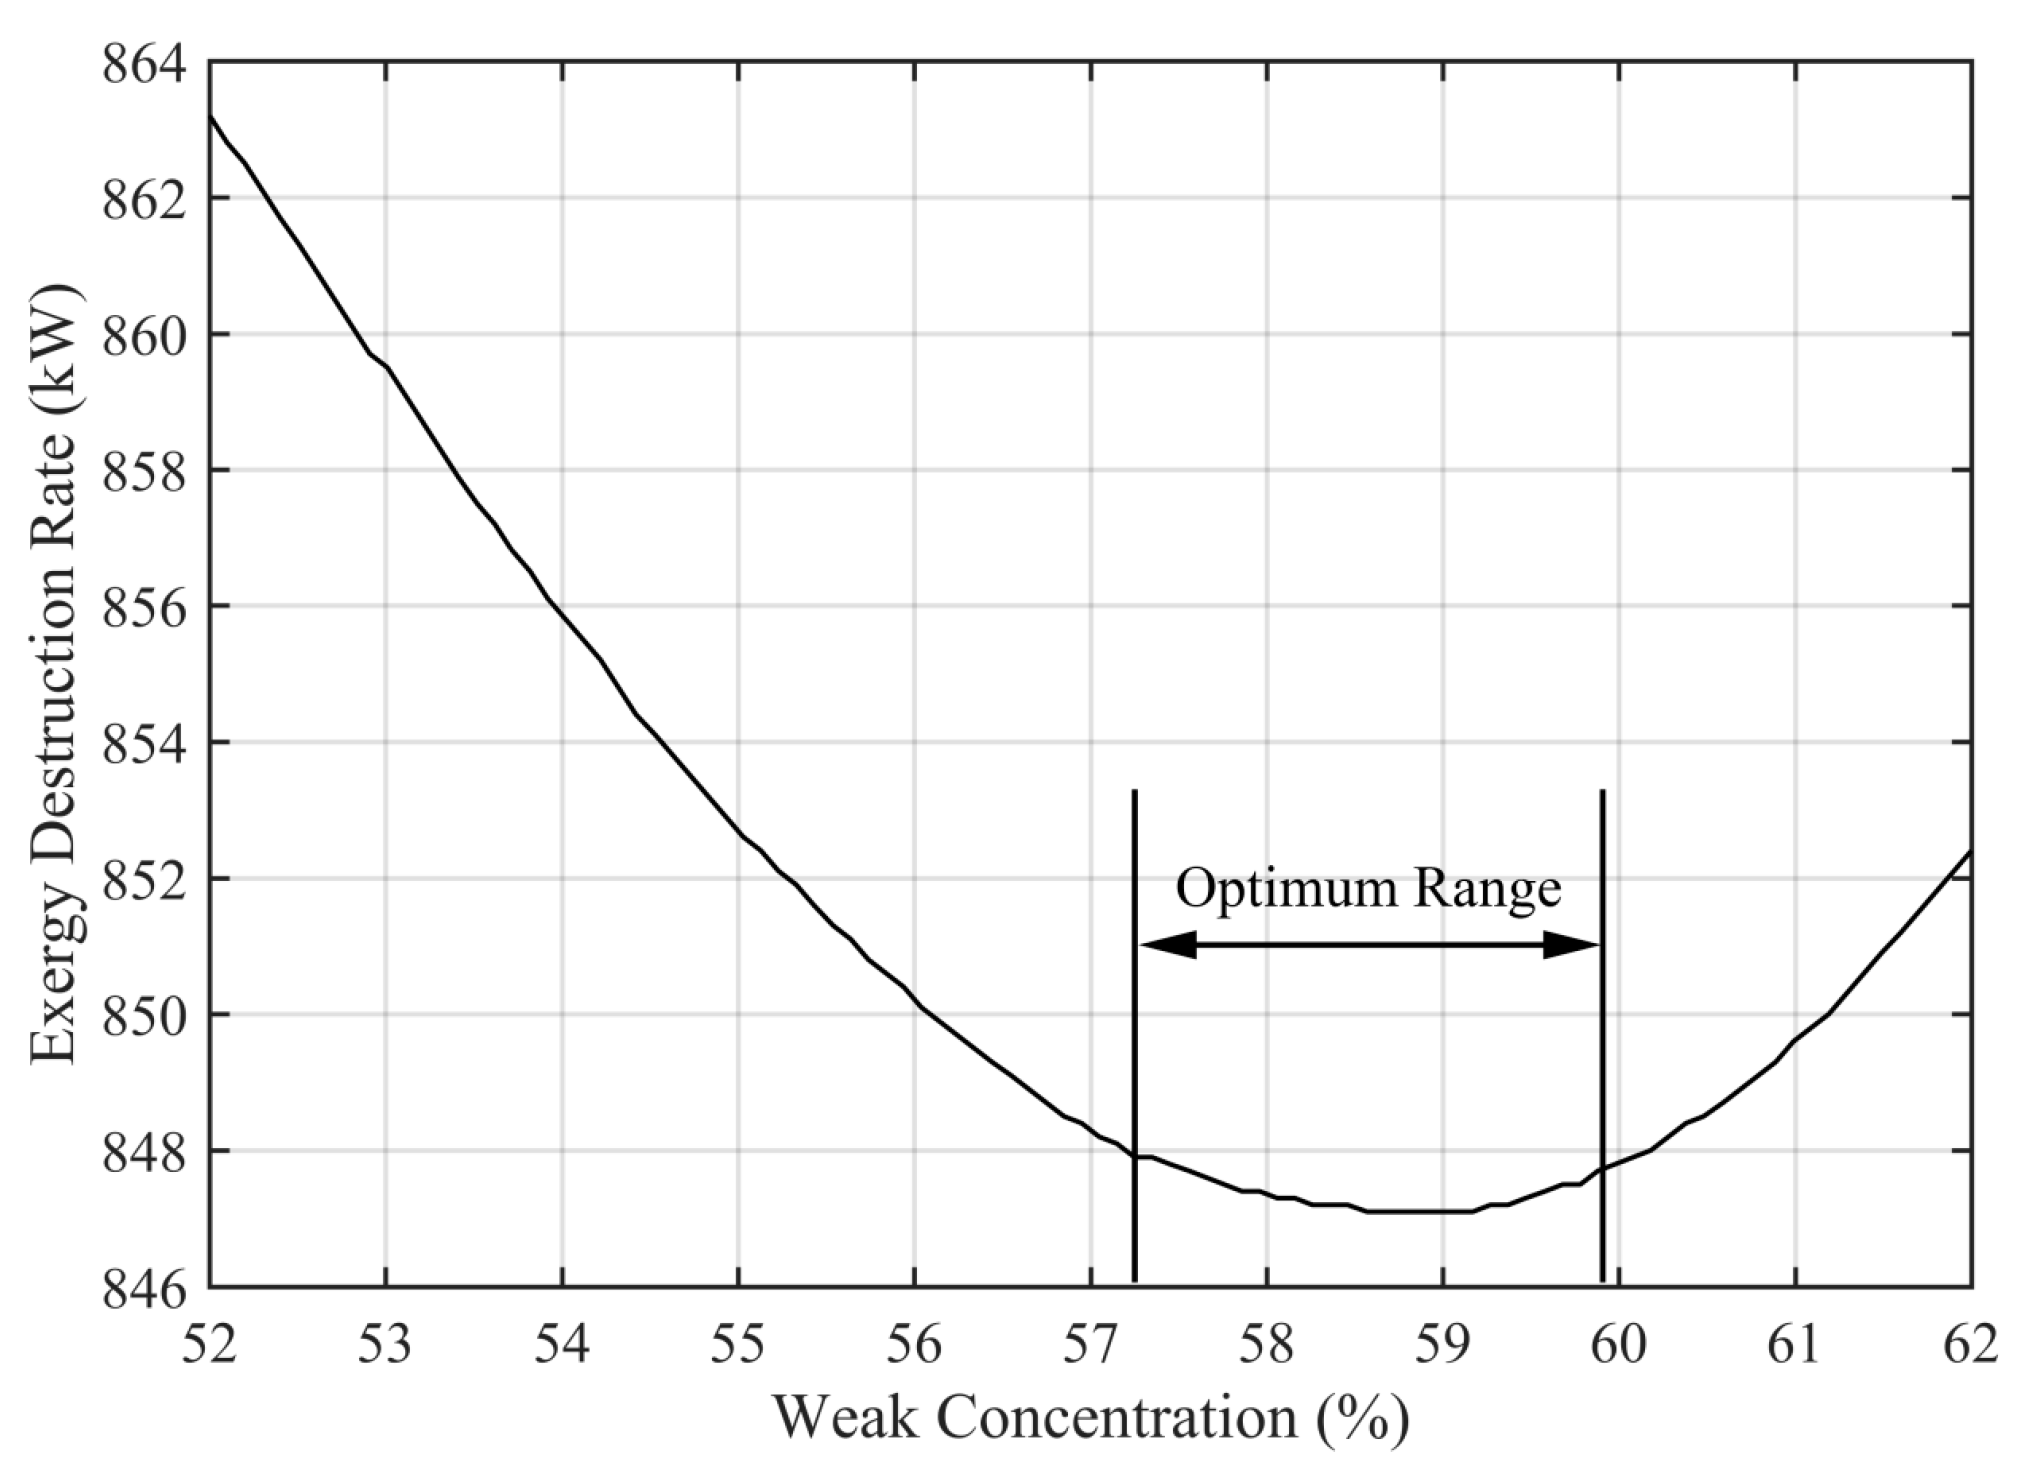
Figure 6.
Fouling on replaced piping in absorption chiller.

Table 1.
Measured conditions of absorption chiller on 15 September at 11 am.
| Parameter | Value |
|---|---|
| Boiler (10.43 MW) | |
| Steam flow rate | 1.3 kg/s |
| Steam Pressure | 194.8 kPa |
| Steam Temperature | 408.7 K |
| Cooling Tower (2391 kW) | |
| Cooling tower water flow rate | 116.6 kg/s |
| Temperature from condenser to cooling tower | 314.8 K |
| Temperature from cooling tower to absorber | 304.3 K |
| Absorption Chiller (2208 kW) | |
| Temperature from absorber to condenser | 310.1 K |
| Chilled water flow rate | 81.0 kg/s |
| Chilled water entering temperature | 285.9 K |
| Chilled water exiting temperature | 279.4 K |
| Weak Solution Concentration | 56% |
Table 2.
Data for flows and conditions for the absorption chiller when T0 = 300.0 K, P0 = 101.7 kPa. State points refer to Figure 2.
Table 2.
Data for flows and conditions for the absorption chiller when T0 = 300.0 K, P0 = 101.7 kPa. State points refer to Figure 2.
| Point | ṁ (kg/s) | T (K) | P (kPa) | h (kJ/kg) | s (kJ/kg·K) | ψ (kJ/kg) |
|---|---|---|---|---|---|---|
| 0 | - | 300.0 | 101.7 | 112.7 | 0.39 | - |
| 1 | 1.3 | 408.7 | 194.8 | 2739.0 | 7.22 | 598.5 |
| 2 | 1.3 | 362.9 | 194.8 | 376.1 | 1.19 | 26.8 |
| 3 | 1.3 | 362.9 | 101.7 | 376.1 | 1.19 | 26.7 |
| 4 | 116.6 | 304.3 | 101.7 | 130.4 | 0.10 | 104.7 |
| 5 | 116.6 | 310.1 | 101.7 | 154.7 | 0.18 | 105.5 |
| 6 | 116.6 | 314.8 | 101.7 | 174.5 | 0.24 | 106.5 |
| 7 | 81.1 | 285.9 | 101.7 | 46.5 | −0.19 | 105.5 |
| 8 | 81.1 | 279.4 | 101.7 | 26.4 | −0.26 | 106.6 |
| 9 | 0.9 | 348.6 | 7.4 | 2641.0 | 8.11 | 236.7 |
| 10 | 0.9 | 313.2 | 7.4 | 167.5 | 0.22 | 106.1 |
| 11 | 0.9 | 275.9 | 0.8 | 167.5 | 0.26 | 95.7 |
| 12 | 0.9 | 275.9 | 0.8 | 2506.0 | 8.73 | −83.4 |
| 13 | 8.8 | 305.9 | 0.8 | 82.4 | 0.06 | 0.2 |
| 14 | 8.9 | 305.9 | 7.4 | 82.37 | 0.06 | 0.2 |
| 15 | 8.9 | 335.7 | 7.4 | 143.3 | 0.25 | 4.7 |
| 16 | 7.9 | 363.2 | 7.4 | 223.3 | 0.37 | 11.8 |
| 17 | 7.9 | 326.5 | 7.4 | 155.2 | 0.18 | 2.5 |
| 18 | 7.9 | 308.8 | 0.8 | 155.2 | 0.18 | 1.2 |
Table 3.
Exergy destruction rate expressions and values for the system and its components.
| Component | Equation | Exergy Destruction Rate (kW) |
|---|---|---|
| Condenser | 240.5 | |
| Refrigerant Valve | 9.7 | |
| Evaporator | 41.7 | |
| Absorber | 265.1 | |
| Pump | 1.6 | |
| Solution Heat Exchanger | 34.8 | |
| Generator | 266.4 | |
| Solution Valve | 10.4 |
Table 4.
Temperature changes associated with increasing the solution concentration by 2.8%.
| Point | Location | Temperature Increase (°C) |
|---|---|---|
| 9 | Leaving the generator (Refrigerant) | 5.9 |
| 15 | Entering the SHX (Weak Solution) | 3.7 |
| 16 | Entering the generator (Weak Solution | 7.0 |
| 17 | Leaving the generator (Strong Solution) | 2.5 |
| 18 | Leaving the SHX (Strong Solution) | 5.5 |
Table 5.
Exergy destruction rates for minimum.
| Component | Exergy Destruction Rate (kW) | Percent Difference (%) |
|---|---|---|
| Condenser | 235.3 | −0.48 |
| Refrigerant Valve | 9.4 | −0.03 |
| Evaporator | 40.4 | −0.13 |
| Absorber | 219.8 | −5.13 |
| Pump | 1.6 | 0.00 |
| Solution Heat Exchanger | 41.5 | +0.78 |
| Generator | 308.4 | +4.94 |
| Solution Valve | 10.8 | +0.06 |
Table 6.
Comparison of model for validation.
| Quantity | Measured | Model | Error |
|---|---|---|---|
| Boiler | |||
| Steam flow rate | 1.3 kg/s | 1.26 kg/s | 3.46% |
| Cooling Tower | |||
| Cooling tower water flow rate | 116.6 kg/s | 113.2 kg/s | 2.92% |
| Absorption Chiller | |||
| Temperature from absorber to condenser | 310.1 K | 310 K | 0.03% |
| Chilled water flow rate | 81 kg/s | 81.1 kg/s | 0.12% |
| Chilled water entering temperature | 285.9 K | 285 K | 0.31% |
| Chilled water exiting temperature | 279.4 K | 279 K | 0.14% |
© 2017 by the authors. Licensee MDPI, Basel, Switzerland. This article is an open access article distributed under the terms and conditions of the Creative Commons Attribution (CC BY) license (http://creativecommons.org/licenses/by/4.0/).
Share and Cite
MDPI and ACS Style
Lake, A.; Rezaie, B.; Beyerlein, S. Use of Exergy Analysis to Quantify the Effect of Lithium Bromide Concentration in an Absorption Chiller. Entropy 2017, 19, 156. https://doi.org/10.3390/e19040156
AMA Style
Lake A, Rezaie B, Beyerlein S. Use of Exergy Analysis to Quantify the Effect of Lithium Bromide Concentration in an Absorption Chiller. Entropy. 2017; 19(4):156. https://doi.org/10.3390/e19040156
Chicago/Turabian StyleLake, Andrew, Behanz Rezaie, and Steven Beyerlein. 2017. "Use of Exergy Analysis to Quantify the Effect of Lithium Bromide Concentration in an Absorption Chiller" Entropy 19, no. 4: 156. https://doi.org/10.3390/e19040156
Note that from the first issue of 2016, this journal uses article numbers instead of page numbers. See further details here.