
Slow Dynamics and Structure of Supercooled Water in Confinement

Dipartimento di Matematica e Fisica, Università Roma Tre, Roma 00146, Italy
*
Author to whom correspondence should be addressed.
Entropy 2017, 19(4), 185; https://doi.org/10.3390/e19040185
Submission received: 22 November 2016
/
Revised: 14 April 2017
/
Accepted: 17 April 2017
/
Published: 24 April 2017
(This article belongs to the Special Issue Nonequilibrium Phenomena in Confined Systems)
Abstract
:We review our simulation results on properties of supercooled confined water. We consider two situations: water confined in a hydrophilic pore that mimics an MCM-41 environment and water at interface with a protein. The behavior upon cooling of the relaxation of water in both environments is well interpreted in terms of the Mode Coupling Theory of glassy dynamics. Moreover, we find a crossover from a fragile to a strong regime. We relate this crossover to the crossing of the Widom line emanating from the liquid-liquid critical point, and in confinement we connect this crossover also to a crossover of the two body excess entropy of water upon cooling. Hydration water exhibits a second, distinctly slower relaxation caused by its dynamical coupling with the protein. The crossover upon cooling of this long relaxation is related to the protein dynamics.
1. Introduction
The properties of water affect almost every phenomena occurring in nature. Water in all its states, ice, liquid and vapor, influences many chemical and biological processes [1,2]. A huge number of technological, agricultural and medical research activities are based on the use of water, water solutions or water embedded in different environments [3,4,5]. Water shows a number of anomalies in all its thermodynamic space [6], the most well-known among them is the presence of a temperature of maximum density (TMD), corresponding to 4 C at ambient pressure. Water expands its volume upon cooling below TMD. How the anomalies of water affect its properties in solution or in confinement is still not well understood. The anomalous behavior becomes more relevant in metastable supercooled liquid state [6,7,8]. With special techniques it is possible to avoid crystallization and keep water in a liquid metastable condition. There is however an experimental limit to supercooling determined by the homogeneous nucleation temperature . At ambient pressure C. Only very recently, new experimental techniques using nanodroplets, nanoconfinement and association with biomolecules have successfully shifted this limit down to C [9].
Thermodynamic response functions, like the isobaric specific heat and the isothermal compressibility, were found to anomalously increase in supercooled liquid water. An apparent universal divergence at around 228 K has been extrapolated [10,11].
Although water cannot be supercooled below it is possible to obtain amorphous ice by fast cooling from high temperatures. It was found that glassy water exhibits polyamorphism with a low density amorphous (LDA) ice that coexists with an high density amorphous (HDA) ice [12]. LDA and HDA have different short range order and a first order phase transition is observed between the two states [13,14,15,16,17]. Both LDA and HDA can be heated up to a pressure dependent temperature where a spontaneous crystallization takes place. The region between the -line and the -line is called “no man’s land” [12,18,19], since it is extremely difficult to perform experiments on supercooled water in this region.
The apparent divergence of the thermodynamic response functions, mentioned above, takes place in the no man’s land. This makes difficult the interpretation of the phenomenon. After the pioneering work of Speedy who hypothesized that the increase of the response functions was due to an approach to a liquid retracing spinodal [20], later it was formulated the hypothesis of a second critical point. According to this point of view the line of the first order transition between the two amorphous ice states would enter in the region of supercooled liquid water and terminate at a critical point. The LDA and HDA would evolve respectively in a low density liquid (LDL) and an high density liquid (HDL) phases. The second critical point is interpreted as a liquid-liquid critical point (LLCP) [21]. The experimentally observed increases in liquid thermodynamic response functions would be determined by the presence of this critical point. The scenario of a LLCP in supercooled water opened a line of research to confirm this hypothesis [6]. The presence of a LLCP would provide a systematic explanation for phenomena in supercooled liquid water [22,23]. The existence of two distinct forms of liquid water would also account for the polyamorphism of glassy water [23]. Due to the difficulty in performing experiments in that region, only computer simulation studies of different models of water have observed the LLCP and the liquid-liquid coexistence [21,24,25,26,27,28,29,30,31,32,33]. There are however a number of indirect experimental results that are compatible with the LLCP scenario. In particular extrapolations of data outside the no man’s land locate the LLCP at the temperature K and pressure MPa [19].
The divergence of quantities like the specific heat and the isothermal compressibility at a critical point implies that these functions show maxima in the one phase region above the LLCP [34]. The loci of these maxima are expected to collapse on the Widom line [35,36], the line of the maxima of the correlation length, in approaching the LLCP from the one phase region. The Widom line is the prolongation of the coexistence curve above the critical temperature and plays an important role in the location of the phase transition.
The presence of the LLCP profoundly affects also the dynamics of water in the supercooled regime. It has been shown both experimentally and computationally that supercooled water dynamics is well described by the Mode Coupling Theory (MCT) of glassy dynamics [37,38,39]. This theory [40,41] in its basic formulation predicts that upon supercooling a liquid undergoes a crossover from an ergodic regime to a structurally arrested state, this crossover would take place at a temperature called the Mode Coupling Temperature.
According to MCT, water in the supercooled regime structurally relaxes by means of Brownian diffusion of particles within the liquid after a transient “cage regime”. In particular the structural relaxation time is predicted to increase by decreasing temperature with a fragile power law behavior , where is a universal exponent.
Experiments and simulations have found that water exhibits a fragile character in the mild supercooled region [39,42]. The temperature dependence of can be fitted with the MCT power law or with an alternative formula, the Vogel-Fulcher-Tammann (VFT) equation , where B is the fragility parameter and is an ideal glass transition temperature.
Experiments on water confined in a silica pore medium, called MCM-41 in a deeply supercooling region found a crossover from the fragile regime to a strong regime [43,44,45,46,47,48], where the relaxation time is fitted with an Arrhenius formula , indicating the appearance of activated processes with an average activation energy . Computer simulations on pure water and confined water confirmed the experimental findings [35,49,50,51].
It is of particular interest that, in simulations, the fragile to strong crossover (FSC) was found to occur along the isobaric path in coincidence with the crossing of Widom line emanating from the LLCP [43,50,52]. Results of experiments on water in MCM-41 give support to this result [43,46].
As said above, the LLCP is expected to reside in a region that is very hard to directly investigate by experiments. In this respect it is possible that the no man’s land can be accessed in water in solution or confined. The FSC indeed was really observed in water confined in MCM-41 [48].
In this framework we here devote special interest to confined water. Both the behavior of water inside hydrophilic pores and hydration water around molecules of biological interest like proteins is analyzed. We want to address the issues discussed above of supercooled bulk water and see how much they are preserved in different kinds of confinement. In the case of bioconfinement we also want to see if water’s peculiar behavior can influence the substrate.
Confined water gives experimentally the possibility to explore the no man’s land by allowing to cool water down to lowest temperatures with respect to the bulk phase. It has been shown that water confined in a hydrophilic silica pore has bulk-like properties apart the molecules in a layer close to the substrate [51]. Moreover these studies are of great importance for numerous applications.
The role and properties of interfacial water in contact with hydrophilic surfaces is central in many biological systems, such as living cells, biopolymers, membrane and a wide variety of gel-forming substances. Hydration water is also most important from the biological point of view [1,53]. The first layers of water that hydrate macro-biomolecules, seem to play actually the leading role in the biochemical activity. For proteins and polynucleotides hydrated above 30% by weight a change in flexibility, characterized by a rapid increase in the mean square atomic displacement, happens upon increasing temperature and this occurs at an approximately universal temperature of 220 K–240 K, in the supercooled region of water. This universal temperature is called protein dynamical transition (PDT).
Both confined and hydration water show the FSC of the relaxation time at the Widom line, therefore keeping unchanged peculiar dynamical and thermodynamical features of the bulk water [43,51,54,55].
Here, without the aim of giving an exhaustive overview on this topics, we review our recent molecular dynamics (MD) results on these two systems concerning the structure and translational dynamics of water molecules upon cooling, configurational entropy of the confined water and protein coupled structural relaxation of hydration water. Special attention is paid on the occurrence of dynamic crossovers of these quantities and their reciprocal connections.
2. Results and Discussion
2.1. Confined Water
A very accurate study of confined water has been performed in a series of computer simulation of water in a silica pore that mimics the properties of MCM-41 [51,58,59]. Water is represented with a three-site rigid model, the SPC/E potential, other simulation details are in Section 3. A snapshot of the system is shown in Figure 1.
An important issue in this research is to understand how the confinement changes the properties of bulk water. In the case of water embedded in MCM-41 the substrate shows a strong hydrophilic character. This is the cause of the layering effects with the formation of a double layer of water molecules close to the interface, as shown in the inset of Figure 2 [51,58,59].
Due to the strong hydrophilicity of the material, a double layer of water extending circa nm from the inner surface of the pore is evident in the density profile. Water in this layer is referred as bound water and it exhibits a dynamics almost completely arrested as a result of the hydrogen bonds between water molecules and silica molecules. Water residing within a distance of nm from the center of the pore, called free water, presents instead features similar to bulk water. Calculations of the Self Intermediate Scattering Functions (SISF) of the inner core molecules [51] have shown that the dynamics of free water follows the Mode Coupling Theory in the mild supercooled temperature region. The dynamics deviates from the MCT behavior in approaching the deep supercooled region where it was found a FSC of the structural relaxation time. The FSC temperature lies around in agreement with experiments [51,59]. The relaxation times as a function of temperature and the FSC is shown in Figure 2.
It was found that the FSC happens in correspondence with the temperature of maximum of the isochoric specific heat [51]. This maximum can be considered as a proxy of the Widom line and this result shows an important relation between the dynamics and thermodynamics in supercooled confined water.
Further analysis on the structure of free water have shown similarities with bulk water. The oxygen-oxygen radial distribution functions (RDF) computed for free water and SPC/E bulk water at g/cm at different temperatures are displayed in Figure 3. The RDF are obtained with a procedure that takes into account the cylindrical geometry, the periodic boundary conditions along the central axis and the irregularity of the surface of the pore [60].
The behavior of the OO-RDF upon decreasing temperature (left panel of Figure 3) is similar to bulk water. The position of the peaks remains unaltered. The first minimum shifts towards smaller distances by cooling. Overall, both the maxima and the minima become sharper at lower temperatures, evidencing that the liquid is more structured and ordered with respect to higher temperatures. Comparisons between the OO-RDF of confined free water in MCM-41 and the OO-RDF of SPC/E bulk water at 300 K and 200 K are shown respectively in the central and right panel of Figure 3. In both the temperatures, the first minimum of the RDF of free water is shallower than bulk water and fills in upon confinement. Therefore, confinement induces major penetration of water molecules between the first and second shell. This effect has been reported also in water confined in Vycor [61]. The positions of the peaks are equal to the bulk and the differences between the RDF of free water and bulk water tend asymptotically to disappear at larger distances.
Through the study of the radial distribution functions of free water in MCM-41 we have further found a relation between the FSC found in [51] and the thermodynamic properties of the system.
From the oxygen-oxygen RDF the two body excess entropy can be calculated as
based on the idea that the excess entropy is related to the number of the phase space configurations available to the system at a specific thermodynamic state [62]. It was proposed a relation between the two body entropy and the diffusion with the empirical equation
This equation was tested by computer simulation in different liquid systems [62,63,64,65,66,67,68,69,70].
We considered in our work an equation similar to Equation (2) for the relaxation time in connection with the MCT. This relation in the dynamics of supercooled liquids was recently discussed [71] in the framework of MCT and compared with a different formulation where the Adam and Gibbs formula is considered with the use of the configurational entropy instead of the excess entropy.
We assume here that the structural relaxation time can be expressed in terms of through the empirical formula:
Equation (3) implies that the temperature dependence of the relaxation time and the two body excess entropy are directly related. This shows that thermodynamics and dynamics are two interconnected aspects of the system. By inverting Equation (3), the two body excess entropy is expected to follow the equation:
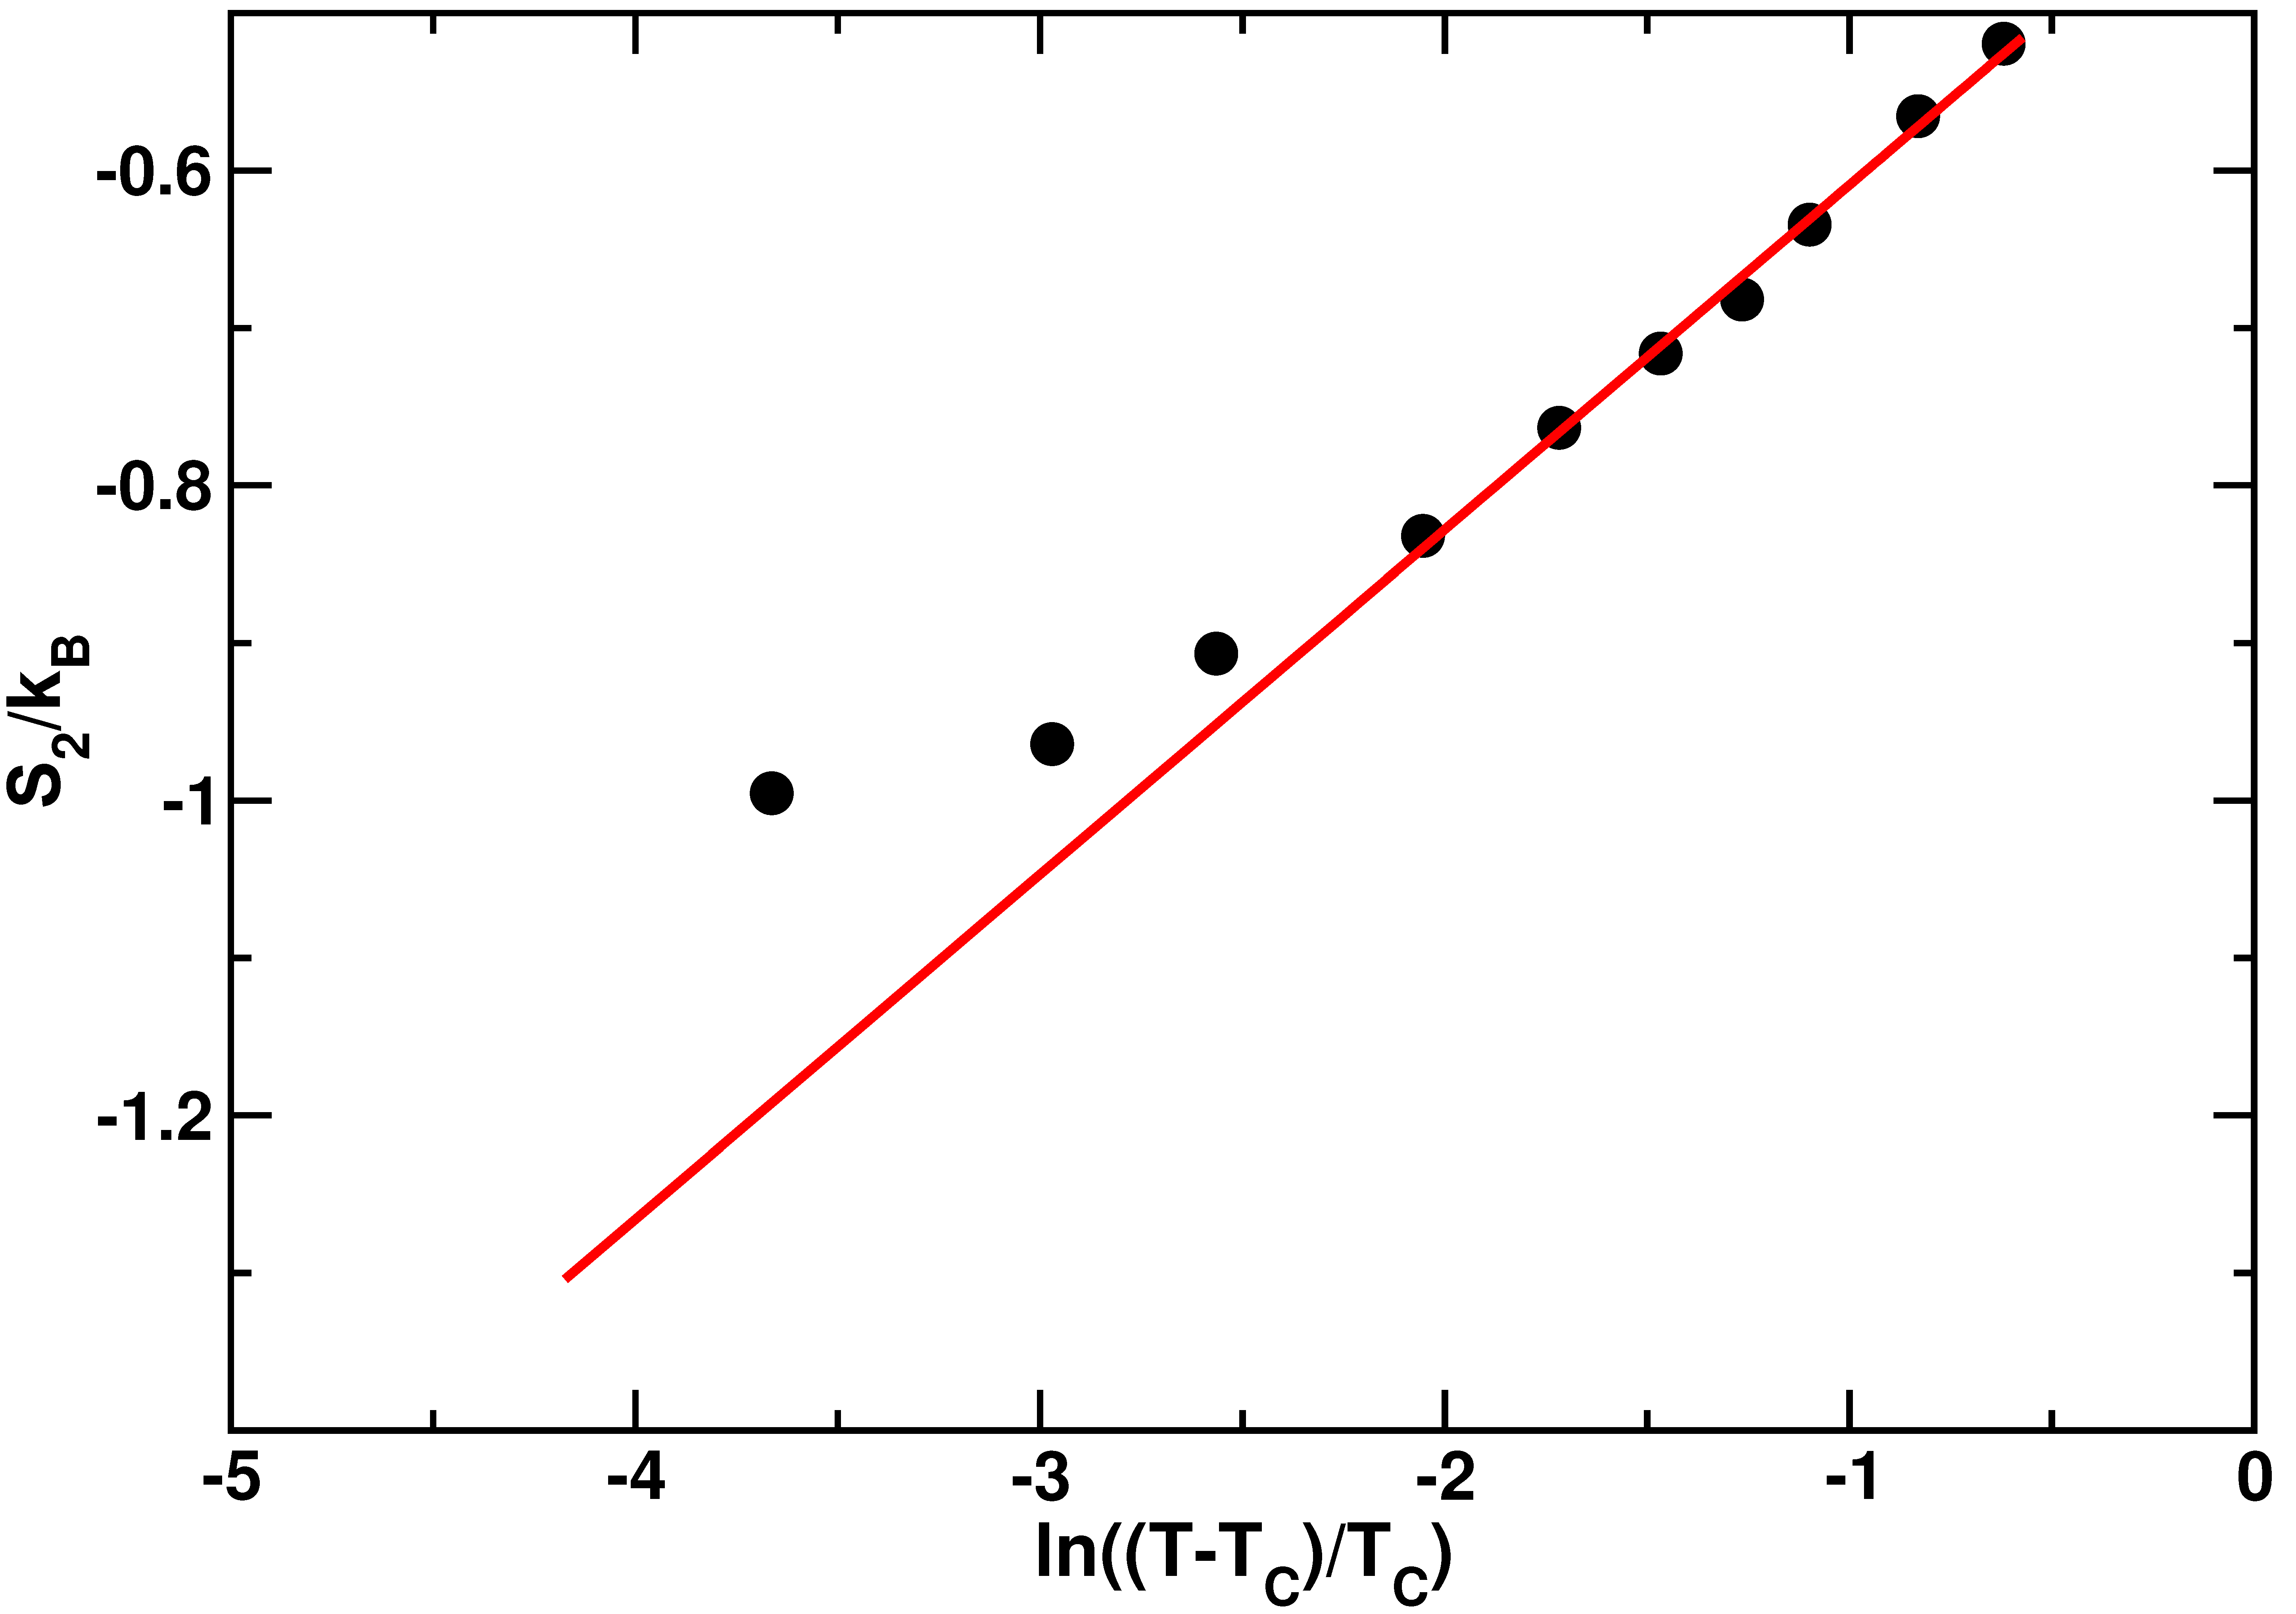
where is the Mode Coupling Temperature. This relation between the two body excess entropy and the structural relaxation time was already verified in bulk TIP4P water [72]. In [60] we have computed from the radial distribution functions at different temperatures as discussed above. The results of this calculation are displayed in Figure 4.
The behavior of is well fitted by Equation (4) in the high temperature range, as clear from the agreement between the data and the red line generated from the fit. Nevertheless, in the low temperature regime, exhibits a deviation from the logarithmic dependence of Equation (4). The temperature at which this deviation occurs coincides roughly with the FSC temperature found in [51].
This result shows the existence of a strong connection between the thermodynamic and dynamical properties of confined water.
2.2. Protein Hydration Water
We review now results obtained from molecular dynamics simulation of one fully-hydrated lysozyme protein immersed in water [73,74] (see Section 3 for simulation details). We focused on the lysozyme hydration water, defined as the 6 Å thick shell of water around the protein. In Figure 5, a slice of the cubic simulation box shows the lysozyme, the shell of hydration water and the remaining water molecules in distinct colors.
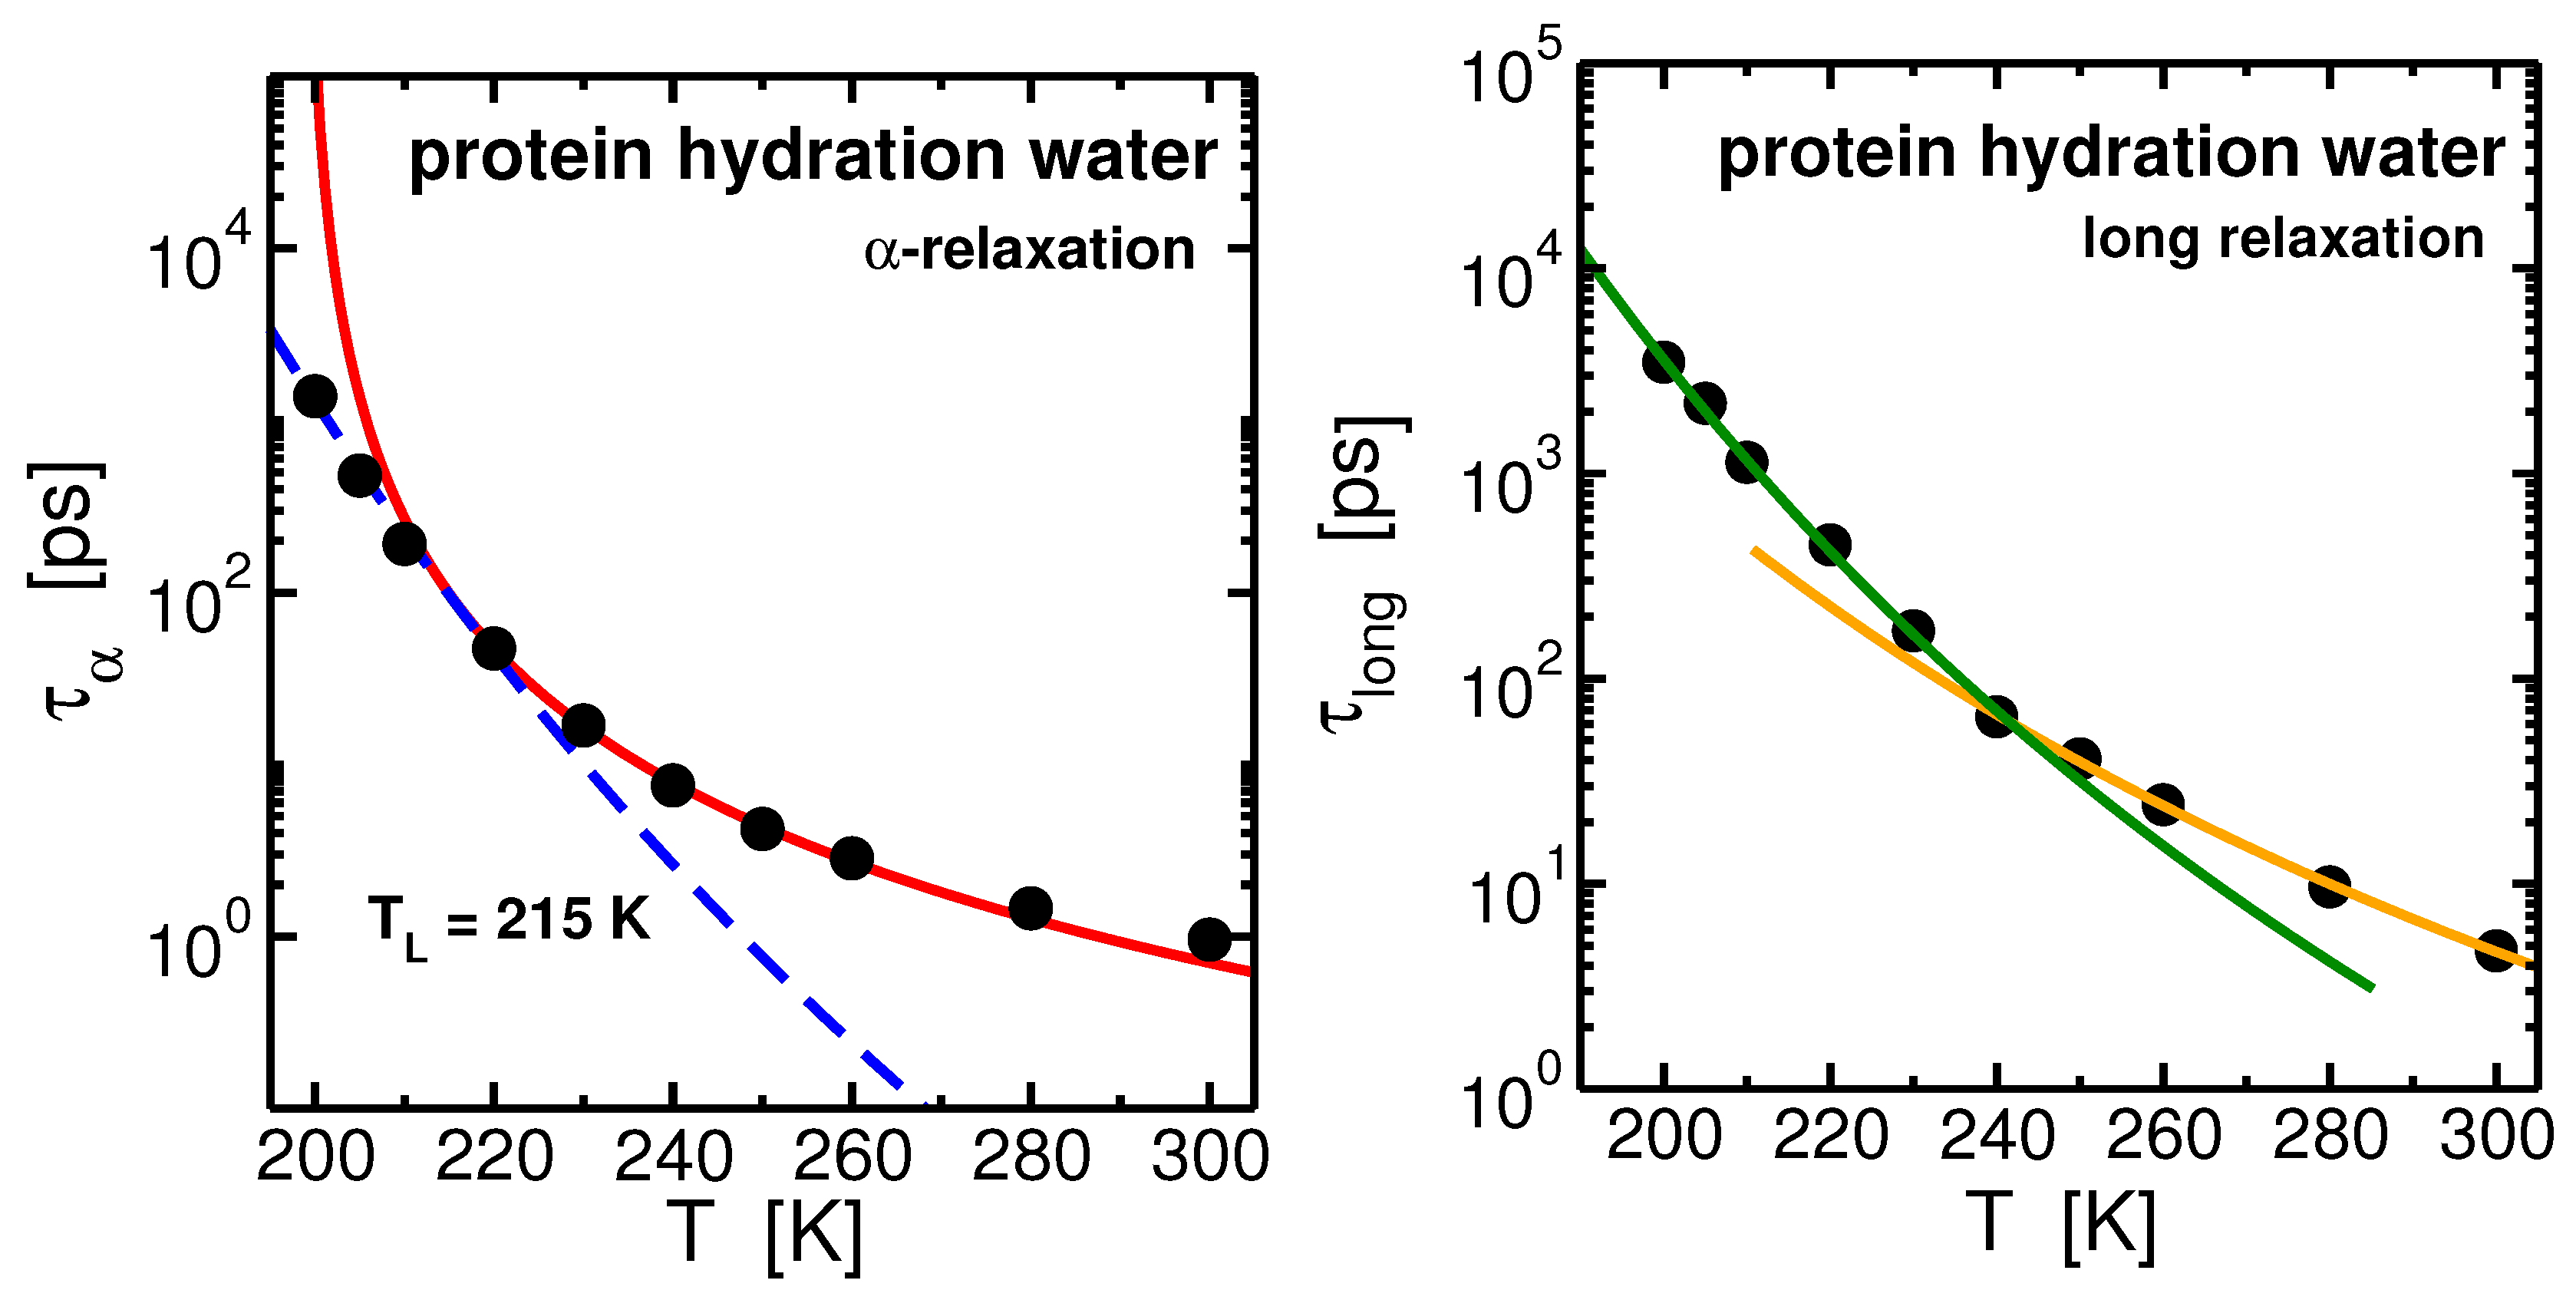
The translational dynamics of hydration water, as characterized by calculating the SISF upon cooling, reveals the onset of new relaxational phenomena of supercooled water at the protein interface. At a given temperature the long temporal evolution of the SISF, differently from the free-water confined in MCM-41 pore, can not be reliably described by one relaxational process, but two different structural processes are needed to reproduce the long time behavior of such curves [73]. Consequently two structural relaxation times can be extracted from the SISFs. The time-scale of the two processes remains well separated upon cooling [74]. One relaxation is the analogous of the typical -relaxation of bulk and confined water and other glass-forming liquids. The other one, that we named long, corresponds to a much slower process respect to the , and arises only in hydration water because it is the effect of the coupling of the protein internal dynamics and the motion of its hydration water. Two relaxation processes have been observed computationally [75] and experimentally [76,77] also in total correlators of the water contained in biological solutions, i.e., when both hydration water and bulk-like water of the solution are analyzed as a whole. In these cases, while it was possible to uniquely assign to hydration water the long relaxation because of the absence of the long process in bulk water, it was not possible to exclusively assign the -relaxation to only those water molecules not in direct contact with the biomolecule (bulk-like water) or to the hydration layer or to both of them. Here we excluded from the analysis bulk-like water showing that hydration water itself relaxes trough two different processes, the -relaxation reminiscent of the bulk phase and the long relaxation, and that thus the dynamics is most complex and can not be seen by a single bulk-like relaxation happening on a longer time scale. The extracted - and long- relaxation times are shown in Figure 6. They behave differently upon cooling.
The temperature behavior of the relaxation time, , of hydration water (see Figure 6-left panel) can be well interpreted within the MCT. Analogously to what found in bulk and in confinement, the MCT power law, , describes the behavior of from high temperatures upon cooling and it deviates toward the low-temperature Arrhenius regime. The FSC occurs in protein hydration water at K, about 5 degree above the FSC occurring along the 1 bar isobar of bulk SPC/E water [74,78]. The occurring of the FSC in hydration water in coincidence of the crossing of the WL has been confirmed for the monolayer coverage of water both in experiments and in simulations [54,55,79,80]. We note that the net effect of considering water in different environment is characterized by the shift of the dynamics in temperature: in both confinement and protein interface the shift is toward high temperature.
The behavior of the relaxation time of the long process, , differs from the relaxation temperature behavior. See Figure 6-right panel. It can be described already at higher temperature by an Arrhenius law with activation enrgy , and by another Arrhenius law with activation energy at low temperature. The crossing between the two regimes occurs at K. This is found to occur in our system in coincidence with the PDT of the lysozyme [74]. At low temperatures the protein is stiffened, the activation energy of the long process increases following the suppression of conformational motion of lysozyme and reduced softness of the protein below the PDT.
3. Methods
Confined water. A cylindrical pore of diameter nm was carved from a cubic silica cell of length nm. 380 water molecules were placed inside the pore to get an average density of 1.0 g/cm in its inner part. The water was simulated with the SPC/E potential. The interactions of water molecules with the substrate atoms are described using the empirical potential model of [81]. Simulated temperatures range from K to K. See [51,60] for further details on simulations and [51] for details of the construction of the glassy silica matrix. Equation of motion were integrated with a time step of 1 fs within the GROMACS 4.5.5 [82] simulation package.
Hydration water. The system contains 1 lysozyme protein, 13982 water molecules and 8 Cl counterions neutralizing the lysozyme charged residues. The system occupies at K and bar a cubic simulation box with linear dimension Å. MD simulations were run using the GROMACS 4.5.5 [82] package. Protein interaction are described by the CHARMM [83,84] force field and water is modeled with the SPC/E [85] potential. Equation of motion were integrated with a time step set to 1 fs. The bar isobar has been simulated on the 300 K–200 K temperature range. Further computational details can be found in [73,74]. Hydration water has been defined by the following criterio: each water molecules lying at a distance minor than or equal to 6 Å from any protein atoms.
4. Conclusions
Here we reviewed our recent work about the dynamical and structural properties of SPC/E supercooled water in confined environment and at protein interface. We focused on the -relaxation of these types of water and we highlighted the analogies of the temperature dependence of the -relaxation with respect to its analogous in bulk water. A fragile-to-strong crossover of is found in the deep supercooled region in both the systems. This crossover can be related to the crossing of the Widom line and consequently to the LLCP of water. Upon cooling, the two body entropy of confined water changes its behavior in correspondence of the FSC of its relaxation time , meaning that structural, dynamical and thermodynamical properties are strictly related. Hydration water has the -relaxation and a second relaxation process happening on a longer time scale and absent in bulk water. This arises from the dynamic coupling between hydration water and the protein and it exhibits a change in the temperature trend in coincidence with the PDT. We have shown that the phenomenology of water when it is confined or close to the surface of a protein retains many of the features of the bulk phase.
Conflicts of Interest
The authors declare no conflict of interest.
Abbreviations
The following abbreviations are used in this manuscript:
| LLCP | Liquid-Liquid Critical Point |
| LDA | Low Density Amorphous |
| HDA | High Density Amorphous |
| LDL | Low Density Liquid |
| HDL | High Density Liquid |
| MCT | Mode Coupling Theory |
| VFT | Vogel-Fulcher-Tammann |
| FSC | Fragile to Strong Crossover |
| PDT | Protein Dynamical Transition |
| MD | Molecular Dynamics |
| SISF | Self Intermediate Scattering Function |
| RDF | Radial Distribution Functions |
References
- Franks, F. Water: A Matrix of Life, 2nd ed.; RSC Paperbacks, The Royal Society of Chemistry: Cambridge, UK, 2000. [Google Scholar]
- Ball, P. Water: Water-An enduring mystery. Nature 2008, 452, 291–292. [Google Scholar] [CrossRef] [PubMed]
- Rasaiah, J.C.; Garde, S.; Hummer, G. Water in nonpolar confinement: From nanotubes to proteins and beyond. Annu. Rev. Phys. Chem. 2008, 59, 713–740. [Google Scholar] [CrossRef] [PubMed]
- Sakai, A.; Matsumoto, T.; Hirai, D.; Niino, T. Newly developed encapsulation-dehydration protocol for plantcryopreservation. Cryoletters 1999, 21, 53–62. [Google Scholar]
- Kauzmann, W. Some factors in the interpretation of protein denaturation. Adv. Protein Chem. 1959, 14, 1–63. [Google Scholar] [PubMed]
- Gallo, P.; Amann-Winkel, K.; Angell, C.A.; Anisimov, M.A.; Caupin, F.; Chakravarty, C.; Lascaris, E.; Loerting, T.; Panagiotopoulos, A.Z.; Russo, J.; et al. Water: A Tale of Two Liquids. Chem. Rev. 2016, 116, 7463–7500. [Google Scholar] [CrossRef] [PubMed]
- Stanley, H.; Kumar, P.; Xu, L.; Yan, Z.; Mazza, M.; Buldyrev, S.; Chen, S.H.; Mallamace, F. The puzzling unsolved mysteries of liquid water: Some recent progress. Phys. A Stat. Mech. Its Appl. 2007, 386, 729–743. [Google Scholar] [CrossRef]
- Debenedetti, P.G. Supercooled and glassy water. J. Phys. Condens. Matter 2003, 15, R1669–R1726. [Google Scholar] [CrossRef]
- Sellberg, J.A.; Huang, C.; McQueen, T.A.; Loh, N.D.; Laksmono, H.; Schlesinger, D.; Sierra, R.G.; Nordlund, D.; Hampton, C.Y.; Starodub, D.; et al. Ultrafast X-ray probing of water structure below the homogeneous ice nucleation temperature. Nature 2014, 510, 381–384. [Google Scholar] [CrossRef] [PubMed]
- Holten, V.; Bertrand, C.E.; Anisimov, M.A.; Sengers, J.V. Thermodynamics of supercooled water. J. Chem. Phys. 2012, 136, 094507. [Google Scholar] [CrossRef] [PubMed]
- Speedy, R.J.; Angell, C.A. Isothermal compressibility of supercooled water and evidence for a thermodynamic singularity at 45 ∘C. J. Chem. Phys. 1976, 65, 851. [Google Scholar] [CrossRef]
- Mishima, O.; Stanley, H.E. The relationship between liquid, supercooled and glassy water. Nature 1998, 396, 329–335. [Google Scholar]
- Mishima, O.; Calvert, L.D.; Whalley, E. An apparently first-order transition between two amorphous phases of ice induced by pressure. Nature 1985, 314, 76–78. [Google Scholar] [CrossRef]
- Winkel, K.; Elsaesser, M.; Mayer, E.; Loerting, T. Water polyamorphism: Reversibility and (dis)continuity. J. Chem. Phys. 2008, 128, 044510. [Google Scholar] [CrossRef] [PubMed]
- Kim, C.U.; Barstow, B.; Tate, M.V.; Gruner, S.M. Evidence for liquid water during the high-density to low-density amorphous ice transition. Proc. Natl. Acad. Sci. USA 2009, 106, 4596–4600. [Google Scholar] [CrossRef] [PubMed]
- Winkel, K.; Mayer, E.; Loerting, T. Equilibrated High-Density Amorphous Ice and Its First-Order Transition to the Low-Density Form. J. Phys. Chem. B 2011, 115, 14141–14148. [Google Scholar] [CrossRef] [PubMed]
- Klotz, S.; Strässle, T.; Nelmes, R.; Loveday, J.; Hamel, G.; Rousse, G.; Canny, B.; Chervin, J.; Saitta, A. Nature of the polyamorphic transition in ice under pressure. Phys. Rev. Lett. 2005, 94, 025506. [Google Scholar] [CrossRef] [PubMed]
- Stanley, H.E. Unsolved Mysteries of Water in Its Liquid and Glass States. MRS Bull. 1999, 24, 22–30. [Google Scholar] [CrossRef]
- Mishima, O.; Stanley, H.E. Decompression-induced melting of ice IV and the liquid-liquid transition in water. Nature 1998, 392, 164–168. [Google Scholar] [CrossRef]
- Speedy, R.J. Stability-limit conjecture. An interpretation of the properties of water. J. Chem. Phys. 1982, 86, 982–991. [Google Scholar] [CrossRef]
- Poole, P.H.; Sciortino, F.; Essmann, U.; Stanley, H.E. Phase behaviour of metastable water. Nature 1992, 360, 324–328. [Google Scholar] [CrossRef]
- Holten, V.; Anisimov, M. Entropy-driven liquid-liquid separation in supercooled water. Sci. Rep. 2012, 2, 713. [Google Scholar] [CrossRef] [PubMed]
- Nilsson, A.; Pettersson, L.G.M. Perspective on the structure of liquid water. Chem. Phys. 2011, 389, 1–34. [Google Scholar] [CrossRef]
- Harrington, S.; Poole, P.H.; Sciortino, F.; Stanley, H.E. Equation of state of supercooled water simulated using the extended simple point charge intermolecular potential. J. Chem. Phys. 1997, 107, 7443–7450. [Google Scholar] [CrossRef]
- Yamada, M.; Mossa, S.; Stanley, H.; Sciortino, F. Interplay between Time-Temperature Transformation and the Liquid-Liquid Phase Transition in Water. Phys. Rev. Lett. 2002, 88, 195701. [Google Scholar] [CrossRef] [PubMed]
- Poole, P.H.; Saika-Voivod, I.; Sciortino, F. Density minimum and liquid-liquid phase transition. J. Phys. Condens. Matter 2005, 17, L431. [Google Scholar] [CrossRef]
- Paschek, D. How the liquid-liquid transition affects hydrophobic hydration in deeply supercooled water. Phys. Rev. Lett. 2005, 94, 217802. [Google Scholar] [CrossRef] [PubMed]
- Corradini, D.; Rovere, M.; Gallo, P. A route to explain water anomalies from results on an aqueous solution of salt. J. Chem. Phys. 2010, 132, 134508. [Google Scholar] [CrossRef] [PubMed]
- Abascal, J.L.F.; Vega, C. Widom line and the liquid-liquid critical point for the TIP4P/2005 water model. J. Chem. Phys. 2010, 133, 234502. [Google Scholar] [CrossRef] [PubMed]
- Palmer, J.; Car, R.; Debenedetti, P. The liquid-liquid transition in supercooled ST2 water: A comparison between umbrella sampling and well-tempered metadynamics. Faraday Discuss. 2013, 167, 77. [Google Scholar] [CrossRef] [PubMed]
- Palmer, J.; Martelli, F.; Liu, Y.; Car, R.; Panagiotopoulos, A.Z.; Debenedetti, P.G. Metastable liquid-liquid transition in a molecular model of water. Nature 2014, 510, 385. [Google Scholar] [CrossRef] [PubMed]
- Poole, P.H.; Bowles, R.K.; Saika-Voivod, I.; Sciortino, F. Free energy surface of ST2 water near the liquid-liquid phase transition. J. Chem. Phys. 2013, 138, 034505. [Google Scholar] [CrossRef] [PubMed]
- Gallo, P.; Sciortino, F. Ising Universality Class for the Liquid-Liquid Critical Point of a One Component Fluid: A Finite-Size Scaling Test. Phys. Rev. Lett. 2012, 109, 177801. [Google Scholar] [CrossRef] [PubMed]
- McMillan, P.F.; Stanley, E.H. Fluid phases: Going supercritical. Nat. Phys. 2010, 6, 479–480. [Google Scholar] [CrossRef]
- Xu, L.; Kumar, P.; Buldyrev, S.V.; Chen, S.H.; Poole, P.H.; Sciortino, F.; Stanley, H.E. Relation between the Widom line and the dynamic crossover in systems with a liquid-liquid phase transition. Proc. Natl. Acad. Sci. USA 2005, 102, 16558–16562. [Google Scholar] [CrossRef] [PubMed]
- Franzese, G.; Stanley, H.E. The Widom line of supercooled water. J. Phys. Condens. Matter 2007, 19, 205126. [Google Scholar] [CrossRef]
- Gallo, P.; Sciortino, F.; Tartaglia, P.; Chen, S.H. Slow Dynamics of Water Molecules in Supercooled States. Phys. Rev. Lett. 1996, 76, 2730–2733. [Google Scholar] [CrossRef] [PubMed]
- Sciortino, F.; Gallo, P.; Tartaglia, P.; Chen, S.H. Supercooled water and the kinetic glass transition. Phys. Rev. E 1996, 54, 6331. [Google Scholar] [CrossRef]
- Torre, R.; Bartolini, P.; Righini, R. Structural relaxation in supercooled water by time-resolved spectroscopy. Nature 2004, 428, 296–299. [Google Scholar] [CrossRef] [PubMed]
- Götze, W.; Sjogren, L. Relaxation processes in supercooled liquids. Rep. Prog. Phys. 1992, 55, 241–376. [Google Scholar] [CrossRef]
- Götze, W. Complex Dynamics of Glass-Forming Liquids; Oxford University Press: New York, NY, USA, 2009; pp. 1–656. [Google Scholar]
- Dehaoui, A.; Issenmann, B.; Caupin, F. Viscosity of deeply supercooled water and its coupling to molecular diffusion. Proc. Natl. Acad. Sci. USA 2015, 112, 12020–12025. [Google Scholar] [CrossRef] [PubMed]
- Liu, L.; Chen, S.H.; Faraone, A.; Yen, C.W.; Mou, C.Y. Pressure dependence of fragile-to-strong transition and a possible second critical point in supercooled confined water. Phys. Rev. Lett. 2005, 95, 117802. [Google Scholar] [CrossRef] [PubMed]
- Liu, L.; Chen, S.H.; Faraone, A.; Yen, C.W.; Mou, C.Y.; Kolesnikov, A.I.; Mamontov, E.; Leao, J. Quasielastic and inelastic neutron scattering investigation of fragile-to-strong crossover in deeply supercooled water confined in nanoporous silica matrices. J. Phys. Condens. Matter 2006, 18, S2261. [Google Scholar] [CrossRef]
- Mallamace, F.; Broccio, M.; Corsaro, C.; Faraone, A.; Wanderlingh, U.; Liu, L.; Mou, C.; Chen, S.H. The fragile-to-strong dynamic crossover transition in confined water: Nuclear magnetic resonance results. J. Chem. Phys. 2006, 124, 161102. [Google Scholar] [CrossRef] [PubMed]
- Faraone, A.; Liu, L.; Mou, C.Y.; Yen, C.W.; Chen, S.H. Fragile-to- strong liquid transition in deeply supercooled confined water. J. Chem. Phys. 2004, 121, 10843–10846. [Google Scholar] [CrossRef] [PubMed]
- Zhang, Y.; Lagi, M.; Fratini, E.; Baglioni, P.; Mamontov, E.; Chen, S.H. Dynamic susceptibility of supercooled water and its relation to the dynamic crossover phenomenon. Phys. Rev. E 2009, 79, 040201. [Google Scholar] [CrossRef] [PubMed]
- Wang, Z.; Le, P.; Ito, K.; Leão, J.B.; Tyagi, M.; Chen, S.H. Dynamic crossover in deeply cooled water confined in MCM-41 at 4 kbar and its relation to the liquid-liquid transition hypothesis. J. Chem. Phys. 2015, 143, 114508. [Google Scholar] [CrossRef] [PubMed]
- Starr, F.W.; Sciortino, F.; Stanley, H.E. Dynamics of simulated water under pressure. Phys. Rev. E 1999, 60, 6757–6768. [Google Scholar] [CrossRef]
- Gallo, P.; Rovere, M. Mode coupling and fragile to strong transition in supercooled TIP4P water. J. Chem. Phys. 2012, 137, 164503. [Google Scholar] [CrossRef] [PubMed]
- Gallo, P.; Rovere, M.; Chen, S.H. Dynamic Crossover in Supercooled Confined Water: Understanding Bulk Properties through Confinement. J. Phys. Chem. Lett. 2010, 1, 729–733. [Google Scholar] [CrossRef]
- De Marzio, M.; Camisasca, G.; Rovere, M.; Gallo, P. Mode Coupling Theory And Fragile To Strong Transition in Supercooled TIP4P/2005 Water. J. Chem. Phys. 2016, 144, 074503. [Google Scholar] [CrossRef] [PubMed]
- Franzese, G.; Bianco, V. Water at Biological and Inorganic Interfaces. Food Biophys. 2013, 8, 153–169. [Google Scholar] [CrossRef]
- Chen, S.H.; Liu, L.; Fratini, E.; Baglioni, P.; Faraone, A.; Mamontov, E.; Fomina, M. Observation of fragile-to-strong dynamic crossover in protein hydration water. Proc. Natl. Acad. Sci. USA 2006, 103, 9012–9016. [Google Scholar] [CrossRef] [PubMed]
- Kumar, P.; Yan, Z.; Xu, L.; Mazza, M.G.; Buldyrev, S.V.; Chen, S.H.; Sastry, S.; Stanley, H.E. Glass transition in biomolecules and the liquid-liquid critical point of water. Phys. Rev. Lett. 2006, 97, 177802. [Google Scholar] [CrossRef] [PubMed]
- Amann-Winkel, K.; Boehmer, R.; Fujara, F.; Gainaru, C.; Geil, B.; Loerting, T. Colloquium: Water’s controversial glass transitions. Rev. Mod. Phys. 2016, 88, 011002. [Google Scholar] [CrossRef]
- Laage, D.; Elsaesser, T.; Hynes, J.T. Water Dynamics in the Hydration Shells of Biomolecules. Chem. Rev. 2017. [Google Scholar] [CrossRef] [PubMed]
- Gallo, P.; Rovere, M.; Chen, S.H. Anomalous dynamics of water confined in MCM-41 at different hydrations. J. Phys. Condens. Matter 2010, 22, 284102. [Google Scholar] [CrossRef] [PubMed]
- Gallo, P.; Rovere, M.; Chen, S.H. Water confined in MCM-41: A mode coupling theory analysis. J. Phys. Condens. Matter 2012, 24, 064109. [Google Scholar] [CrossRef] [PubMed]
- De Marzio, M.; Camisasca, G.; Conde, M.M.; Rovere, M.; Gallo, P. Structural properties and fragile to strong transition in confined water. J. Chem. Phys 2016, 146, 084505. [Google Scholar] [CrossRef] [PubMed]
- Gallo, P.; Ricci, M.; Rovere, M. Layer analysis of the structure of water confined in vycor glass. J. Chem. Phys. 2002, 116, 342–346. [Google Scholar] [CrossRef]
- Rosenfeld, Y. A quasi-universal scaling law for atomic transport in simple fluids. J. Phys. Condens. Matter 1999, 11, 5415–5427. [Google Scholar] [CrossRef]
- Jabes, B.S.; Agarwal, M.; Chakravarty, C. Tetrahedral order, pair correlation entropy, and waterlike liquid state anomalies: Comparison of GeO2 with BeF2, SiO2, and H2O. J. Chem. Phys. 2010, 132, 234507. [Google Scholar] [CrossRef] [PubMed]
- Agarwal, M.; Singh, M.; Sharma, R.; Alam, M.P.; Chakravarty, C. Relationship between Structure, Entropy, and Diffusivity in Water and Water-Like Liquids. J. Phys. Chem. B 2010, 114, 6995–7001. [Google Scholar] [CrossRef] [PubMed]
- Sharma, R.; Agarwal, M.; Chakravarty, C. Estimating the entropy of liquids from atom–atom radial distribution functions: Silica, beryllium fluoride and water. Mol. Phys. 2008, 106, 1925–1938. [Google Scholar] [CrossRef]
- Mittal, J.; Errington, J.R.; Truskett, T.M. Relationship between thermodynamics and dynamics of supercooled liquids. J. Chem. Phys. 2006, 125, 076102. [Google Scholar] [CrossRef] [PubMed]
- Errington, J.R.; Truskett, T.M.; Mittal, J. Excess-entropy-based anomalies for a waterlike fluid. J. Chem. Phys. 2006, 125, 244502. [Google Scholar] [CrossRef] [PubMed]
- Scala, A.; Starr, F.W.; Nave, E.L.; Sciortino, F.; Stanley, H.E. Configurational entropy and diffusivity of supercooled water. Nature 2000, 406, 166–169. [Google Scholar] [PubMed]
- Fomin, Y.D.; Ryzhov, V.N.; Gribova, N.V. Breakdown of excess entropy scaling for systems with thermodynamic anomalies. Phys. Rev. E 2010, 81, 061201. [Google Scholar] [CrossRef] [PubMed]
- Johnson, M.E.; Head-Gordon, T. Assessing thermodynamic-dynamic relationships for waterlike liquids. J. Chem. Phys. 2009, 130, 214510. [Google Scholar] [CrossRef] [PubMed]
- Nandi, M.K.; Banerjee, A.; Sengupta, S.; Sastry, S.; Bhattacharyya, S.M. Unraveling the success and failure of mode coupling theory from consideration of entropy. J. Chem. Phys. 2015, 143, 174504. [Google Scholar] [CrossRef] [PubMed]
- Gallo, P.; Rovere, M. Relation between the two-body entropy and the relaxation time in supercooled water. Phys. Rev. E 2015, 91, 012107. [Google Scholar] [CrossRef] [PubMed]
- Corradini, D.; Strekalova, E.G.; Stanley, H.E.; Gallo, P. Microscopic mechanism of protein cryopreservation in an aqueous solution with trehalose. Sci. Rep. 2013, 3, 1218. [Google Scholar] [CrossRef] [PubMed]
- Camisasca, G.; De Marzio, M.; Corradini, D.; Gallo, P. Two structural relaxations in protein hydration water and their dynamic crossovers. J. Chem. Phys. 2016, 145, 044503. [Google Scholar] [CrossRef] [PubMed]
- Magno, A.; Gallo, P. Understanding the Mechanisms of Bioprotection: A Comparative Study of Aqueous Solutions of Trehalose and Maltose upon Supercooling. J. Phys. Chem. Lett. 2011, 2, 977–982. [Google Scholar] [CrossRef]
- Comez, L.; Lupi, L.; Morresi, A.; Paolantoni, M.; Sassi, P.; Fioretto, D. More Is Different: Experimental Results on the Effect of Biomolecules on the Dynamics of Hydration Water. J. Phys. Chem. Lett. 2013, 4, 1188–1192. [Google Scholar] [CrossRef] [PubMed]
- Paolantoni, M.; Comez, L.; Gallina, M.E.; Sassi, P.; Scarponi, F.; Fioretto, D.; Morresi, A. Light scattering spectra of water in trehalose aqueous solutions: Evidence for two different solvent relaxation processes. J. Phys. Chem. B 2009, 113, 7874–7878. [Google Scholar] [CrossRef] [PubMed]
- Starr, F.W.; Harrington, S.; Sciortino, F.; Stanley, H.E. Slow Dynamics of Water under Pressure. Phys. Rev. Lett. 1999, 82, 3629–3632. [Google Scholar] [CrossRef]
- Mallamace, F.; Chen, S.H.; Broccio, M.; Corsaro, C.; Crupi, V.; Majolino, D.; Venuti, V.; Baglioni, P.; Fratini, E.; Vannucci, C.; et al. Role of the solvent in the dynamical transitions of proteins: the case of the lysozyme-water system. J. Chem. Phys. 2007, 127, 045104. [Google Scholar] [CrossRef] [PubMed]
- Lagi, M.; Chu, X.; Kim, C.; Mallamace, F.; Baglioni, P.; Chen, S.H. The low-temperature dynamic crossover phenomenon in protein hydration water: Simulations vs. experiments. J. Phys. Chem. B 2008, 112, 1571–1575. [Google Scholar] [CrossRef] [PubMed]
- Spohr, E.; Hartnig, C.; Gallo, P.; Rovere, M. Water in porous glasses. A computer simulation study. J. Mol. Liq. 1999, 80, 165–178. [Google Scholar] [CrossRef]
- Pronk, S.; Páll, S.; Schulz, R.; Larsson, P.; Bjelkmar, P.; Apostolov, R.; Shirts, M.R.; Smith, J.C.; Kasson, P.M.; van der Spoel, D.; et al. GROMACS 4.5: A high-throughput and highly parallel open source molecular simulation toolkit. Bioinformatics 2013, 29, 845–854. [Google Scholar] [CrossRef] [PubMed]
- MacKerell, A.D.; Banavali, N.K. All-atom empirical force field for nucleic acids: II. Application to molecular dynamics simulations of DNA and RNA in solution. J. Comput. Chem. 2000, 21, 105–120. [Google Scholar] [CrossRef]
- MacKerell, A.D.; Feig, M.; Brooks, C.L. Extending the treatment of backbone energetics in protein force fields: limitations of gas-phase quantum mechanics in reproducing protein conformational distributions in molecular dynamics simulations. J. Comput. Chem. 2004, 25, 1400–1415. [Google Scholar] [CrossRef] [PubMed]
- Berendsen, H.J.C.; Grigera, J.R.; Straatsma, T.P. The missing term in effective pair potentials. J. Phys. Chem. 1987, 91, 6269–6271. [Google Scholar] [CrossRef]
Figure 1.
Snapshot of the silica confining pore simulated in this work. Red, yellow and blue points are respectively the oxygen, the silicon and the acidic hydrogen atoms. Water molecules are red (oxygen atoms) and light grey (hydrogen atoms).
Figure 1.
Snapshot of the silica confining pore simulated in this work. Red, yellow and blue points are respectively the oxygen, the silicon and the acidic hydrogen atoms. Water molecules are red (oxygen atoms) and light grey (hydrogen atoms).
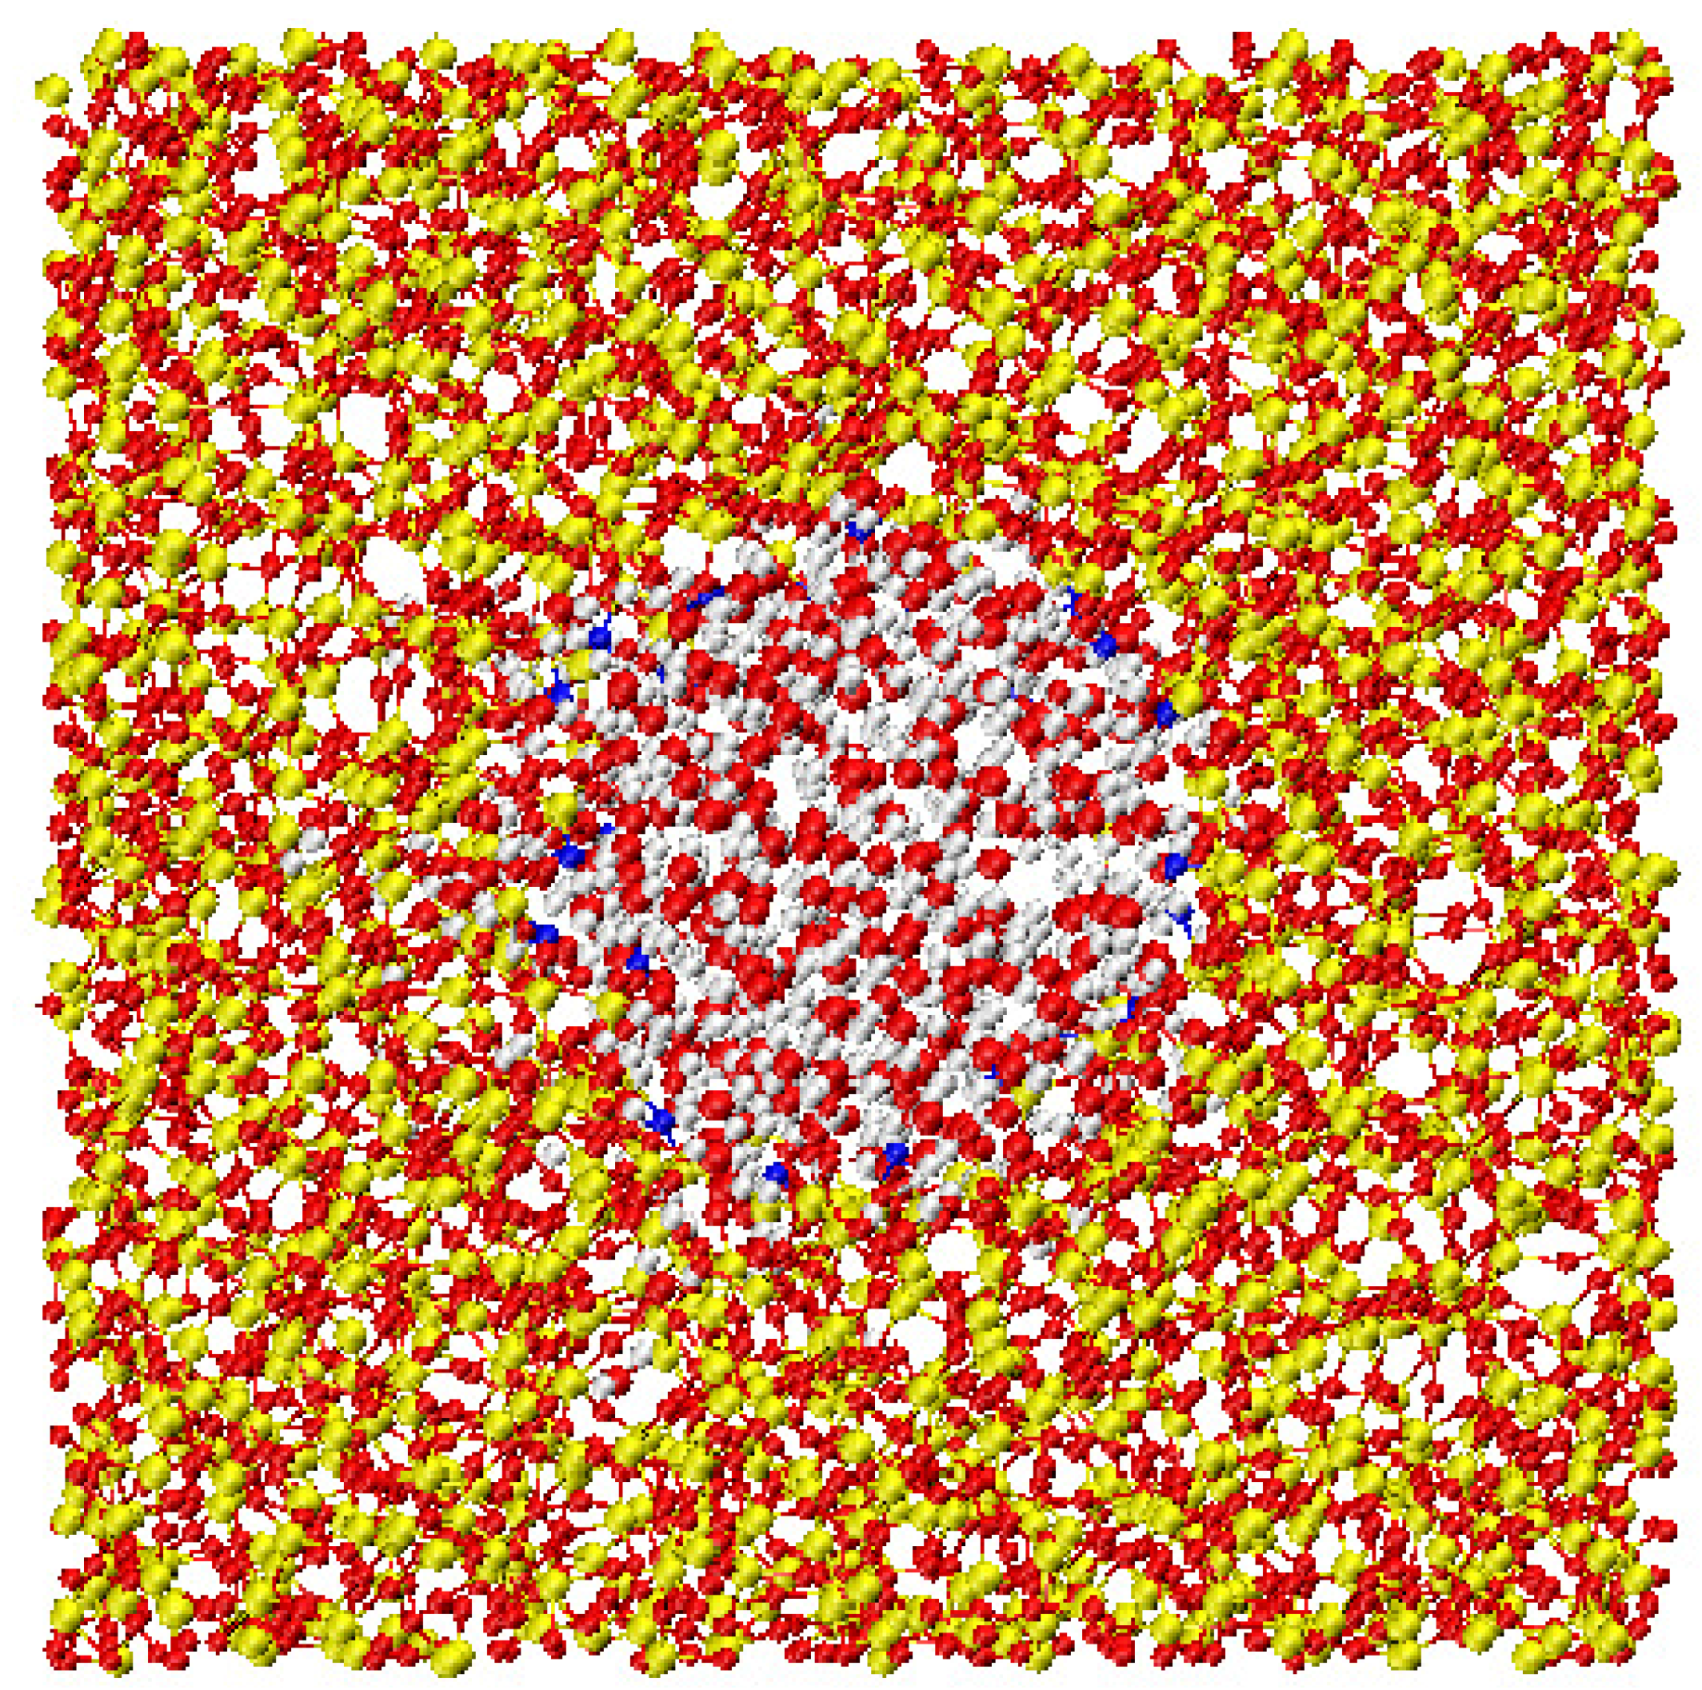
Figure 2.
Temperature dependence of the relaxation times extracted from the Self Intermediate Scattering Functions of the free water. The red solid line is the fit with the Vogel-Fulcher-Tammann formula where B is the fragility parameter and is an ideal glass transition temperature. The blue dashed line is the fit with the Arrhenius formula with the activation energy. In the inset the density profile along the pore radius is shown. Data from [51].
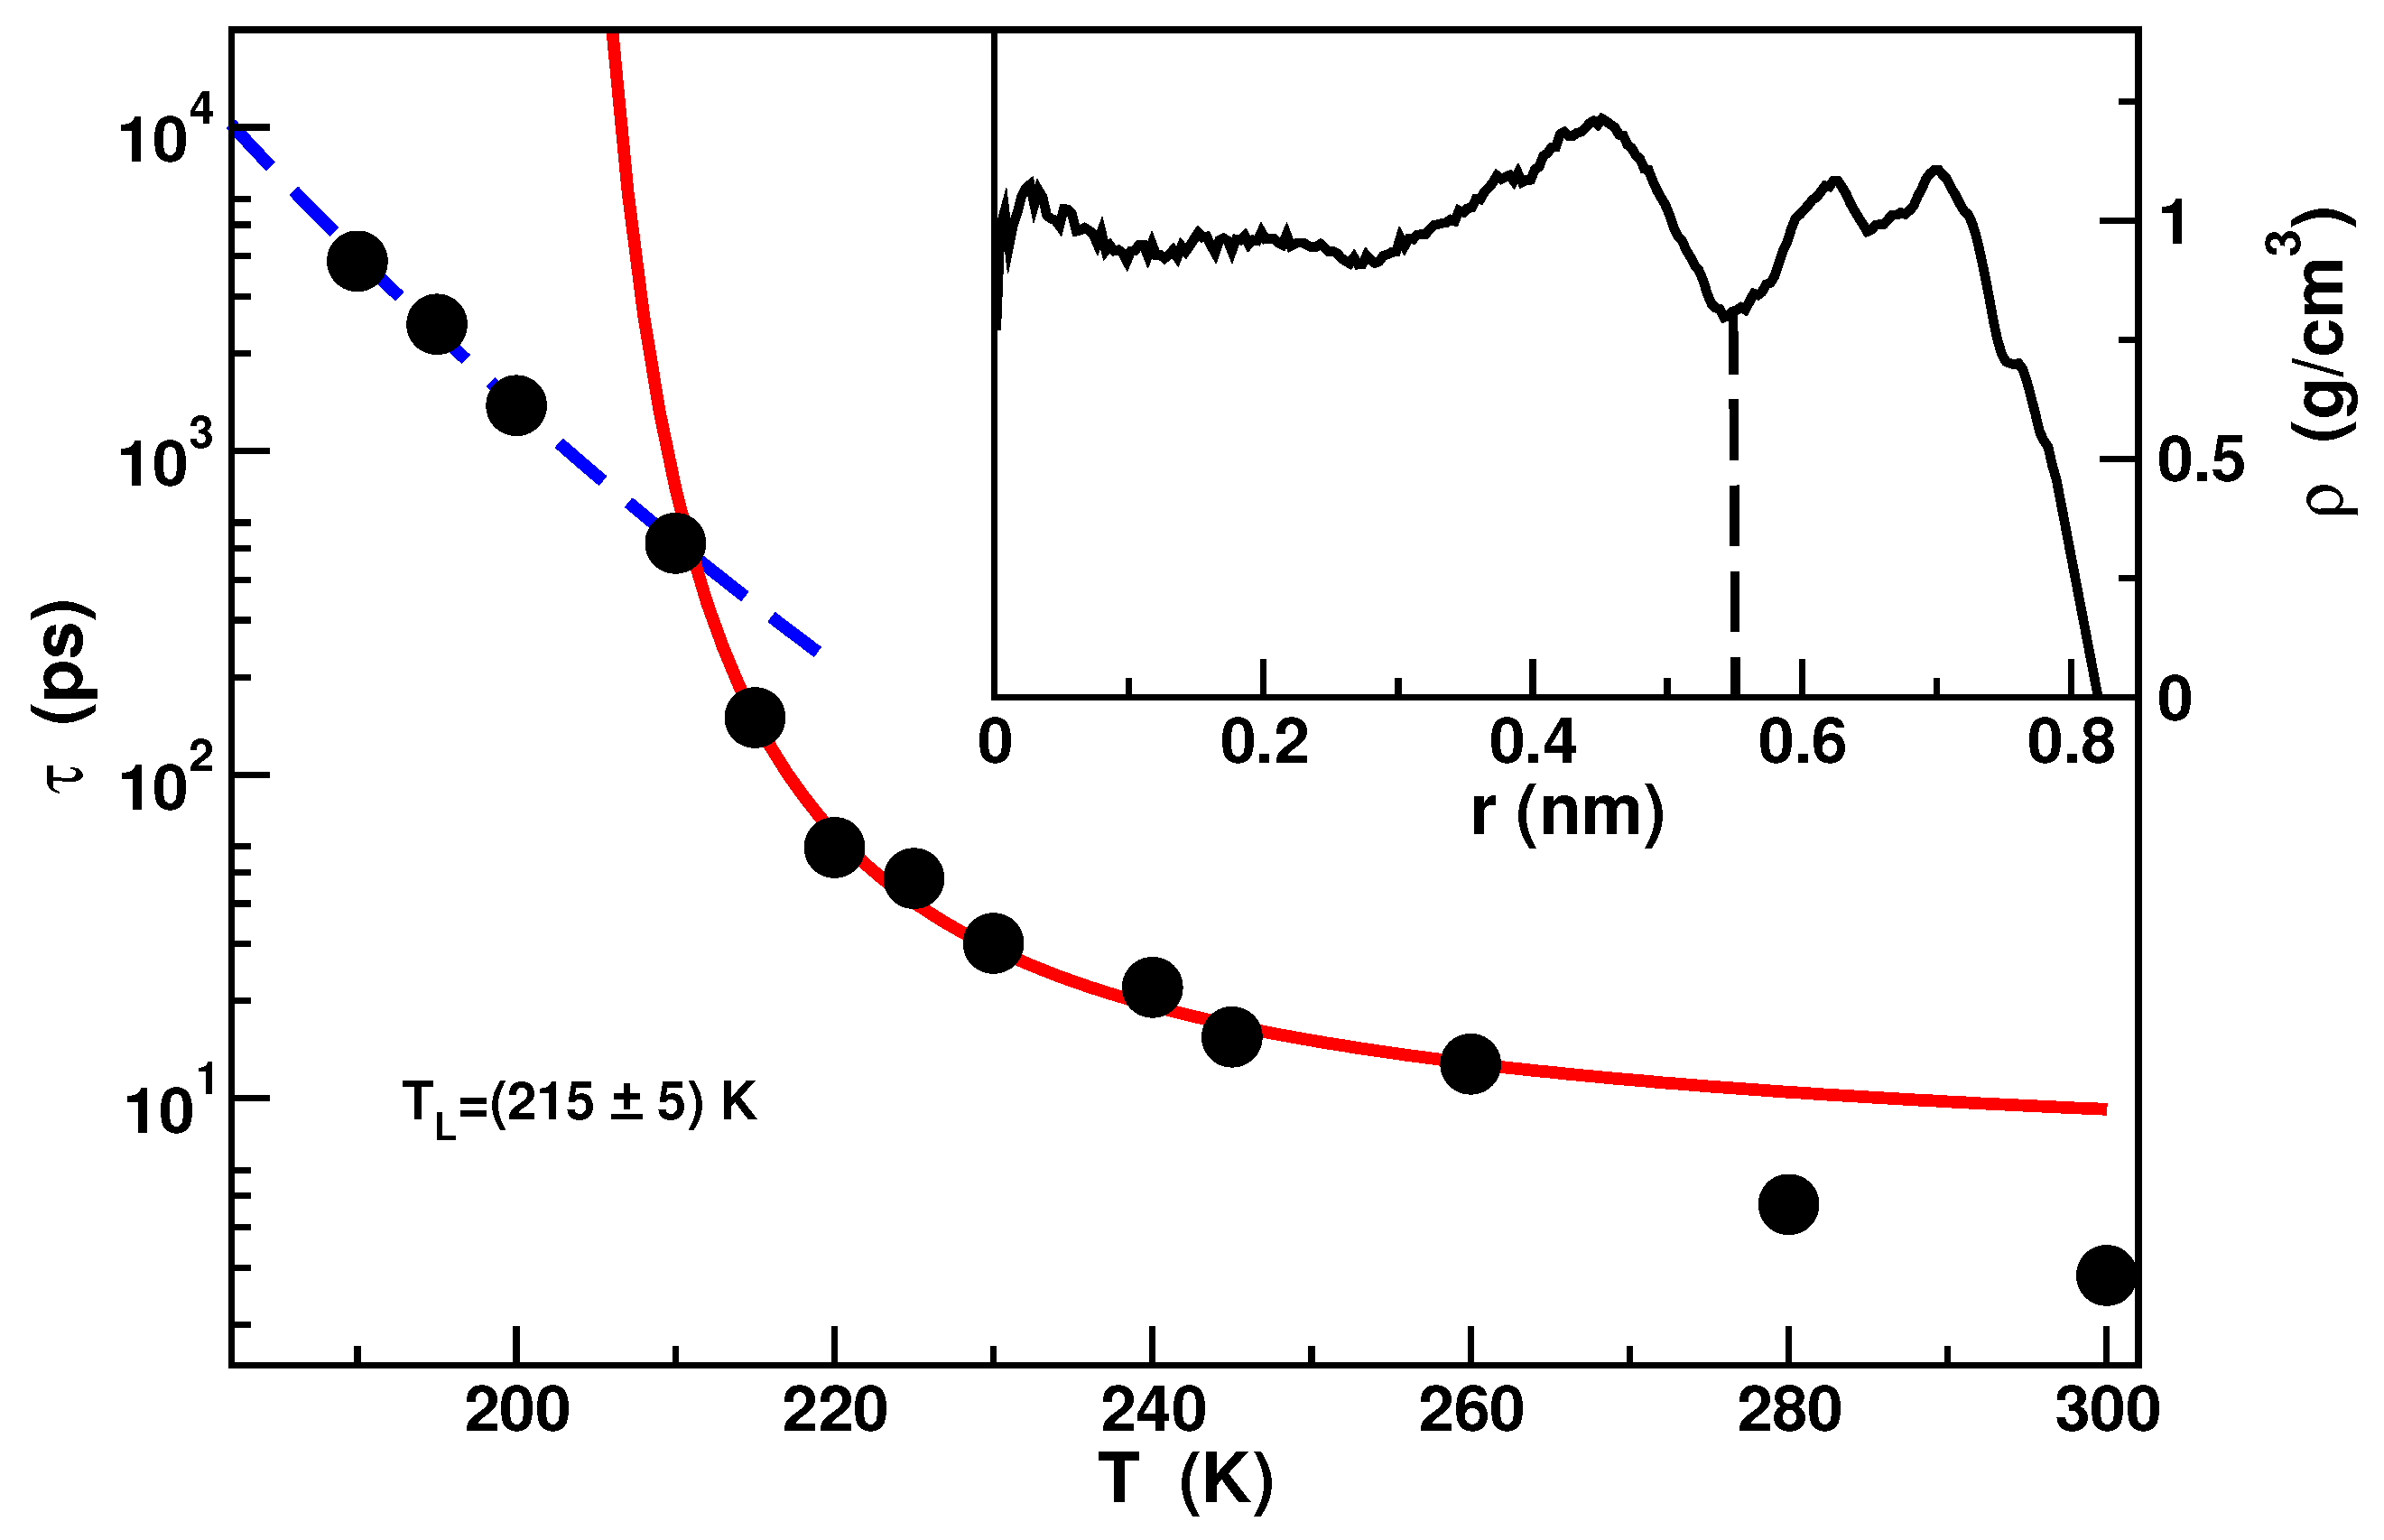
Figure 3.
Left panel: Normalized oxygen-oxygen radial distribution functions at different temperatures of free water in MCM-41. Central panel: Comparison between the normalized oxygen-oxygen radial distribution functions (OO-RDF) of free water and bulk water at K. Right panel: Comparison between the normalized OO-RDF of free water and bulk water at K. Data reprinted from [60], with the permission of AIP Publishing.
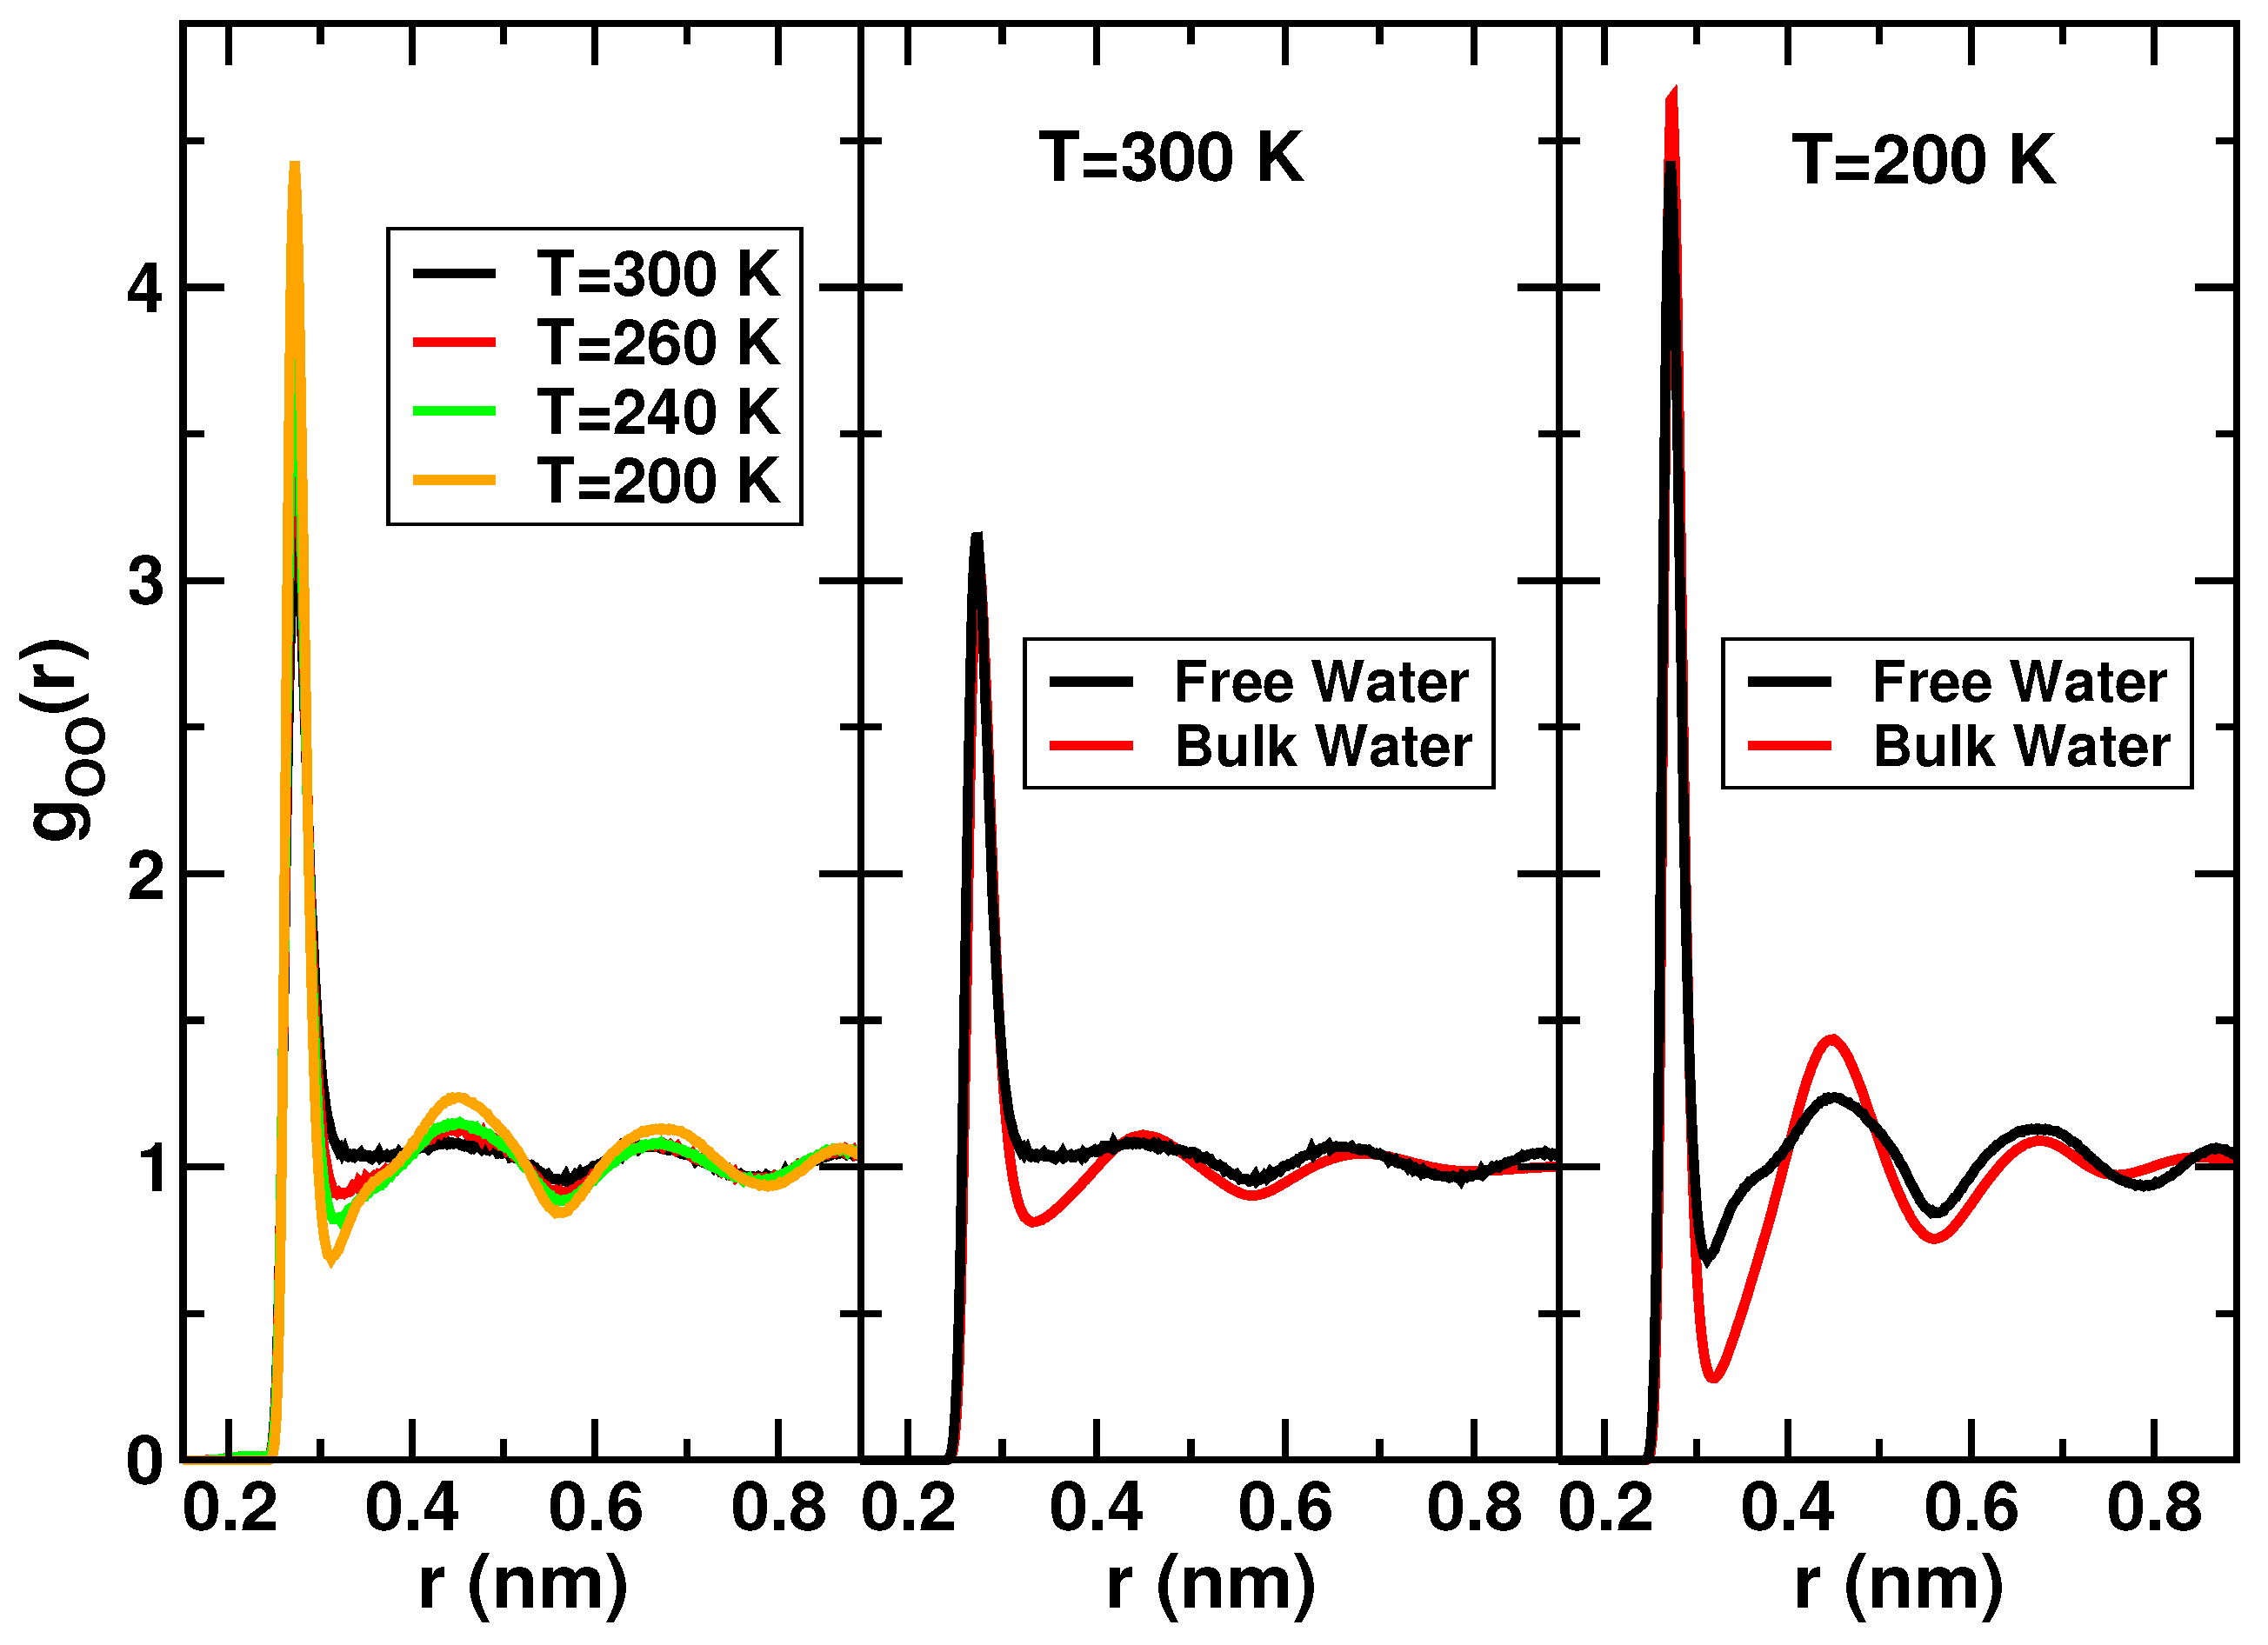
Figure 4.
Two body excess entropyas a function of the logarithm of temperature. The red solid line is the fit to Equation (4). The temperatures investigated are K. The value of the Mode Coupling Temperature is K. Figure reprinted from [60], with the permission of AIP Publishing.

Figure 5.
Snapshot of the protein immersed in water. The image corresponds to a 10 Å slice of the simulation box centered on the protein, which is shown entirely. Lysozyme is colored according to its tertiary structure. Water molecules are depicted as spheres. Red spheres correspond to hydration water. Water molecules at distance longer than 6 Å from the lysozyme are shown in blue. In this paper we focused on the dynamical behavior of the red colored water molecules only.
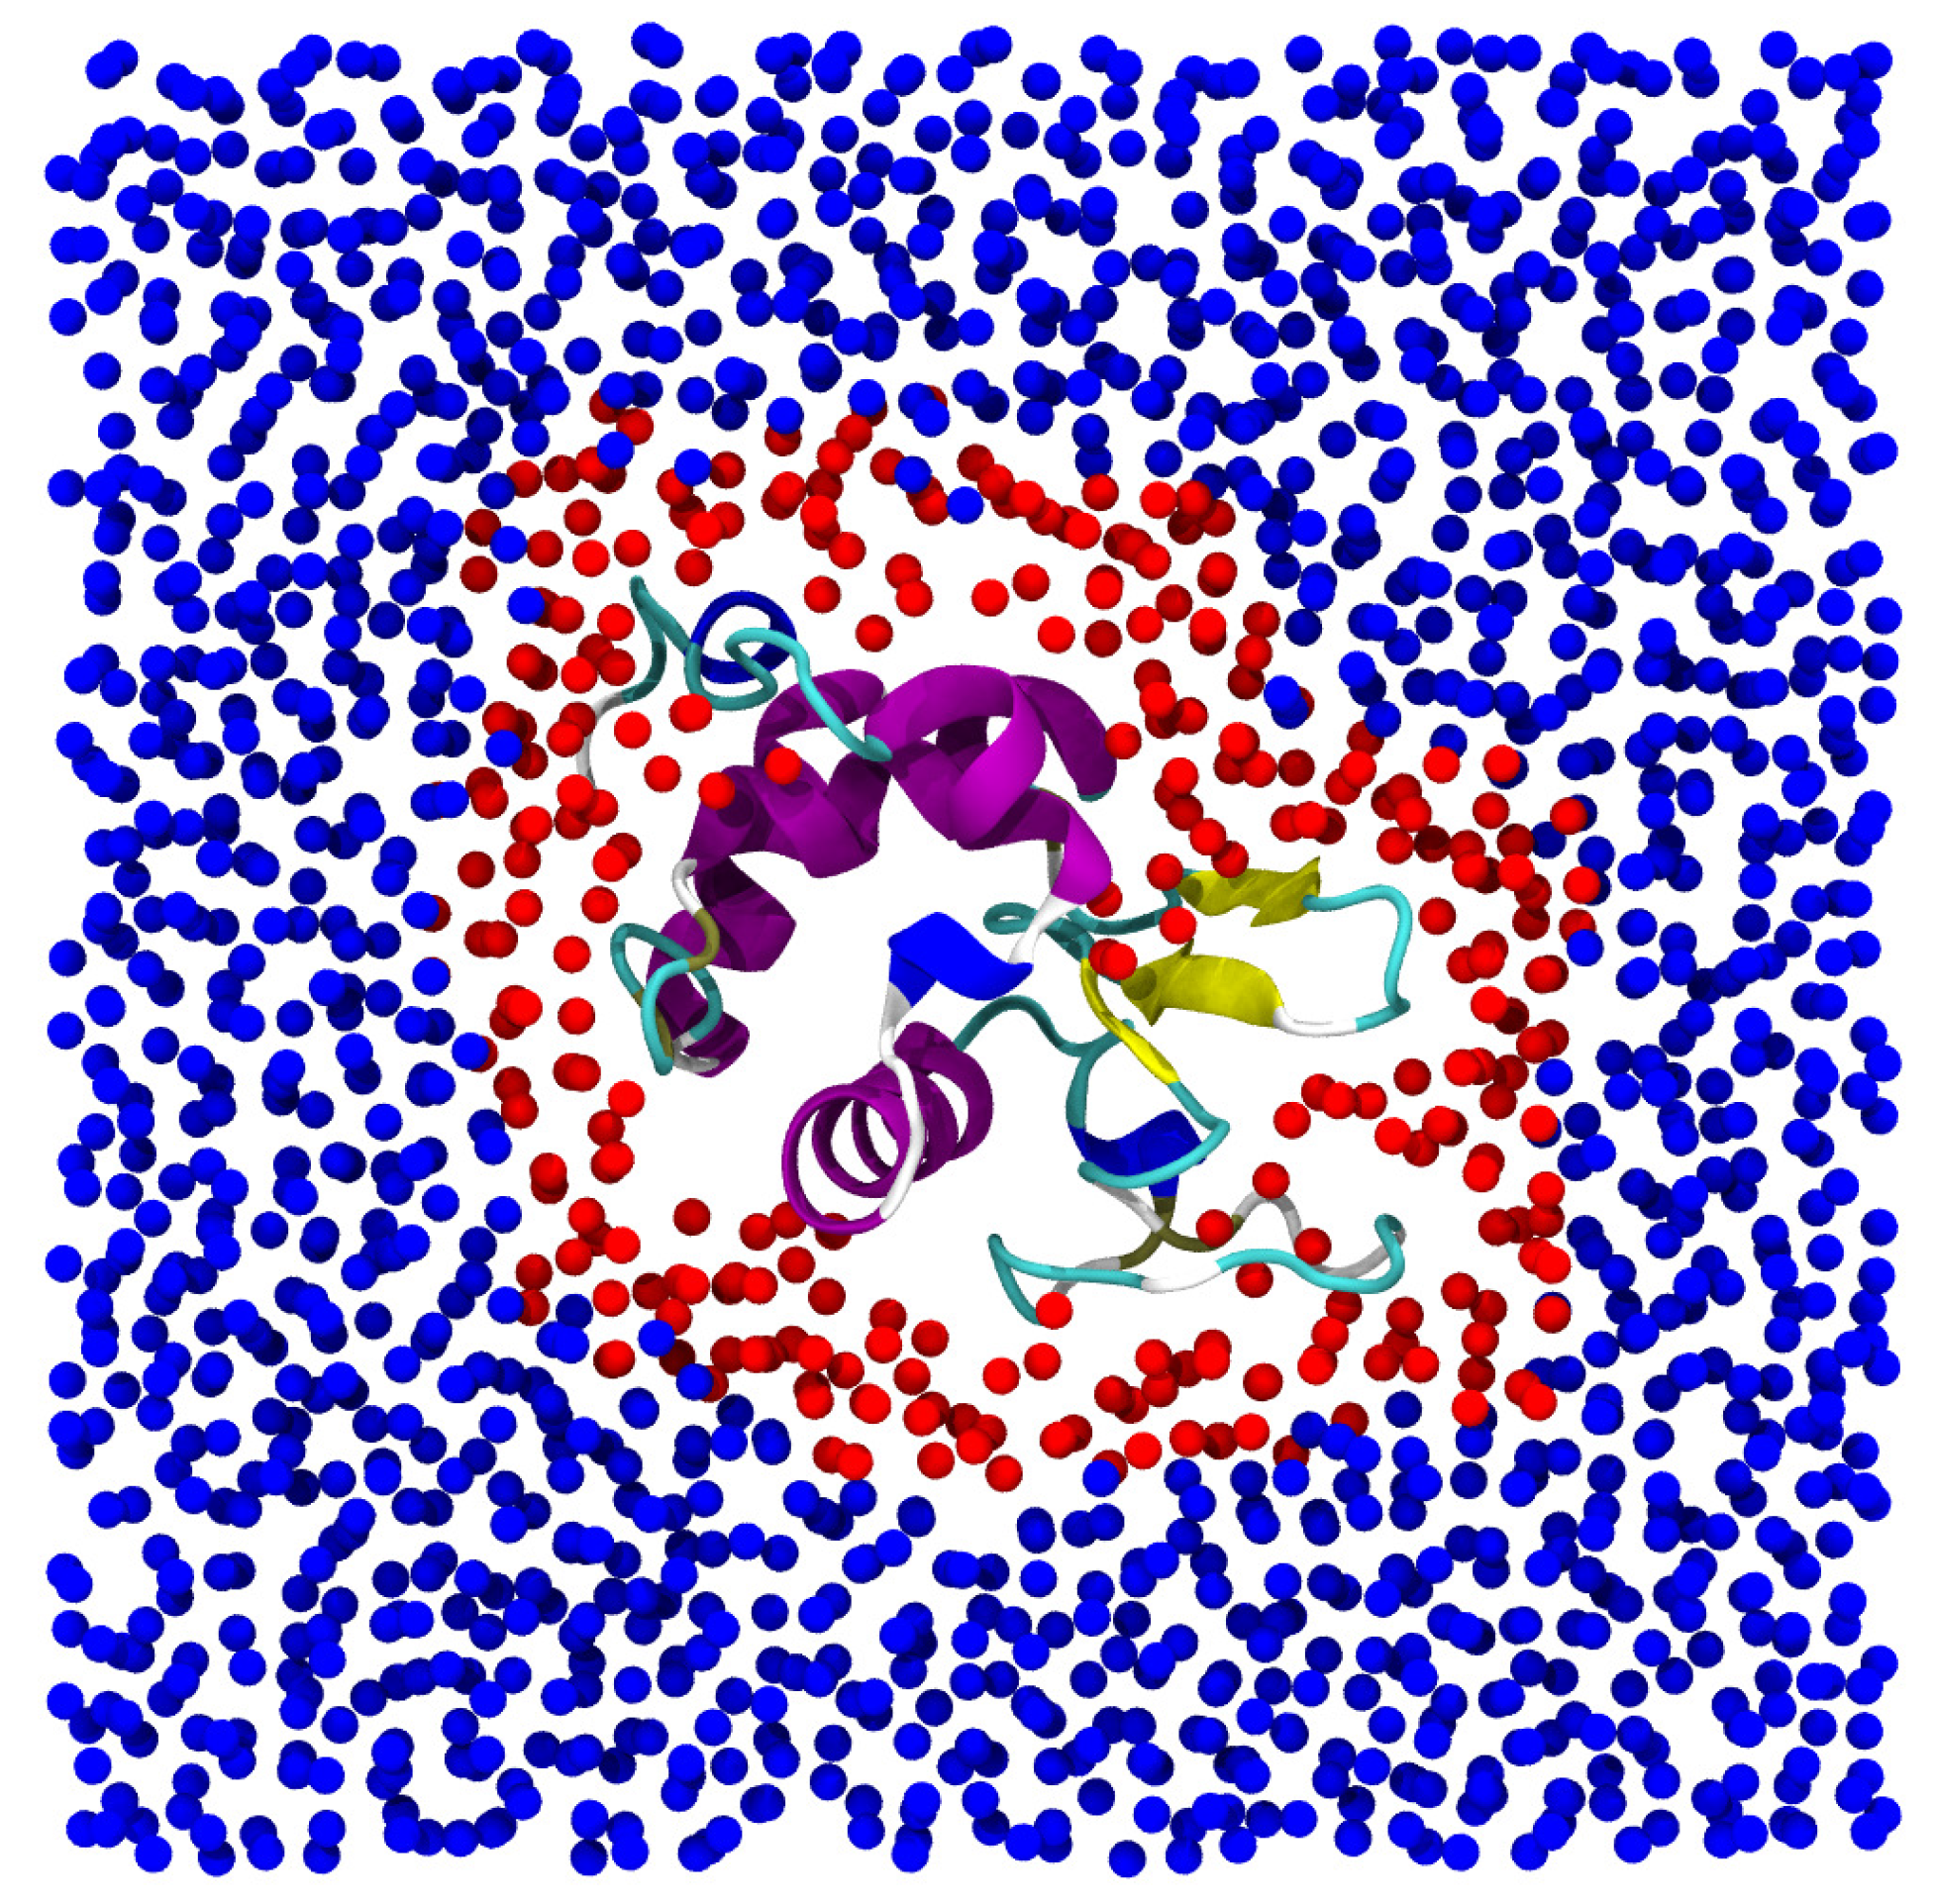
Figure 6.
Left panel: Arrhenius plot of the -relaxation times of lysozyme hydration water. The points fit the Mode Coupling Theory (MCT) power law at high temperatures and the Arrhenius law at low temperatures. These two regimes cross at K. Right panel: Arrhenius plot of the long-relaxation time of hydration water. The points fit two Arrhenius laws with different activation energies at high and low temperatures. These two regimes cross at K, in coincidence with the protein dynamical transition (PDT) that we found for the lysozyme (not shown). Data from [74].

© 2017 by the authors. Licensee MDPI, Basel, Switzerland. This article is an open access article distributed under the terms and conditions of the Creative Commons Attribution (CC BY) license (http://creativecommons.org/licenses/by/4.0/).
Share and Cite
MDPI and ACS Style
Camisasca, G.; De Marzio, M.; Rovere, M.; Gallo, P. Slow Dynamics and Structure of Supercooled Water in Confinement. Entropy 2017, 19, 185. https://doi.org/10.3390/e19040185
AMA Style
Camisasca G, De Marzio M, Rovere M, Gallo P. Slow Dynamics and Structure of Supercooled Water in Confinement. Entropy. 2017; 19(4):185. https://doi.org/10.3390/e19040185
Chicago/Turabian StyleCamisasca, Gaia, Margherita De Marzio, Mauro Rovere, and Paola Gallo. 2017. "Slow Dynamics and Structure of Supercooled Water in Confinement" Entropy 19, no. 4: 185. https://doi.org/10.3390/e19040185
Note that from the first issue of 2016, this journal uses article numbers instead of page numbers. See further details here.