
Recognition of Traveling Surges in HVDC with Wavelet Entropy

School of Electrical Engineering, Beijing Jiaotong University, Beijing 100044, China
*
Author to whom correspondence should be addressed.
Entropy 2017, 19(5), 184; https://doi.org/10.3390/e19050184
Submission received: 4 February 2017
/
Revised: 5 April 2017
/
Accepted: 21 April 2017
/
Published: 26 April 2017
(This article belongs to the Special Issue Entropy in Signal Analysis)
Abstract
:Traveling surges are commonly adopted in protection devices of high-voltage direct current (HVDC) transmission systems. Lightning strikes also can produce large-amplitude traveling surges which lead to the malfunction of relays. To ensure the reliable operation of protection devices, recognition of traveling surges must be considered. Wavelet entropy, which can reveal time-frequency distribution features, is a potential tool for traveling surge recognition. In this paper, the effectiveness of wavelet entropy in characterizing traveling surges is demonstrated by comparing its representations of different kinds of surges and discussing its stability with the effects of propagation distance and fault resistance. A wavelet entropy-based recognition method is proposed and tested by simulated traveling surges. The results show wavelet entropy can discriminate fault traveling surges with a good recognition rate.
1. Introduction
Traveling surges or traveling waves on power transmission lines are often used for protection or location purposes, especially in HVDC (high-voltage direct current) systems [1]. Traveling surges have many advantages, such as high speed, good accuracy, and so on [2]. Once a fault occurs in a HVDC system, the fault current increases quickly. It is crucial for protection devices to have a fast response to prevent serious damage to the whole system. The traveling surges propagate along the transmission lines with the speed of light. The protection device communication with traveling surges is faster than those with optic fiber, and is regarded as the fastest communication path in power transmission. Therefore, protection devices based on traveling surges are commonly applied in HVDC systems. A traveling surge is actually produced by a fault or a sudden interference. In DC systems, where no zero-crossing point exists, traveling surges are always detectable at line terminals. No matter what kind of fault and what the ground impedance is, a surge will be produced and rush towards the terminals of transmission lines. Compared with impedance-based fault identification methods, the traveling surge-based method is more reliable and a better choice in HVDC systems. Although the high frequency components of the traveling surge will attenuate during propagation due to the skin effect losses, for example, and the rise time increases, and the amplitude decreases, it is still possible to pick them up with high sampling rates and advanced signal processing tools.
All of the traveling surge-based methods must face one barrier: interference [3]. On power transmission lines, besides fault traveling surges, interferences which also produce traveling surges could originate from external or undesired causes. Every effort must be made to withstand these surges. The commonly-encountered interferences are lightning surges, switching surges, external faults, and so on. In order to prevent harmonic currents from entering the DC line, smooth reactors and filters are installed at the terminals. These devices work as a boundary of traveling surges and block the high frequencies of external interferences, such as switching surges and external faults outside the protected zone. A lot of research has discussed the discrimination of internal and external fault judgment with traveling surges. Various criteria are proposed and proved to be effective, for example, voltage/current differences (Δu and Δi), the voltage/current change ratio (Δu/Δt and Δi/Δt), or energy comparisons with different representations [1,4,5,6,7]. However, for the recognition of internal faults, the major interference is a lightning surge. As the traveling surges caused by lightning strikes change quite similarly with those produced by short faults, these rules cannot distinguish faults from lightning interference effectively [8,9,10,11,12]. Therefore, an additional function, or fault recognition unit, should be adopted to recognize interference surges from fault ones.
Although discrimination of traveling surges in AC transmission systems has been studied for quite a long time, the traveling surges in DC systems have different features. In HVDC systems, the commonly-used lightning recognition methods can be classified into two types: time domain ones and frequency domain ones. In the time domain, the fault traveling surges can be regarded as the representation of the transient process between a steady state (normal operation) and another (fault state). The variation of transients is approximately monotone at a large time scale. On the other hand, the lightning disturbances do not change the operation state of HVDC after flash discharges, but induce oscillations. According to this feature, some criteria are proposed, for instance, integration of voltage (|∑Δu|) of a single pole [4], comparing the integrations of voltages of two poles [3], and so on. These methods were proved to be useful, but the integration-based methods usually need a long time window to wait for the repeated appearance of oscillations or even the disappearance of disturbances. Tens of milliseconds are usually needed for fault recognition with time domain methods. It is possible when AC breakers are employed and the power shutdown of a whole DC area is allowable. With the development of fast DC breakers and the emergence of multi-terminal DC grids, faults need to be isolated as soon as possible to avoid large-scale damage. Frequency domain methods, which require shorter data windows, but higher sampling rates, are, thus, popular in recent years. These methods usually compare the energy spectra, especially wavelet energy spectra, of different traveling surges [5]. However, energy spectra heavily depend on the energy variations in different scenarios, for example, attenuations during propagations or waveform changes due to various system parameters. Therefore, it is crucial to find a characterization of frequency spectra which can withstand the variations of energy distributions.
Entropy only characterizes the disorder of distributions [13,14,15,16,17,18]. Once the energy of some frequency bands is attenuated, the amplitude decreases, but the distribution usually changes slightly. Therefore, adopting entropy to capture the features of traveling surges is a potential method. In this paper, entropy is combined with wavelet to characterize the features of different traveling surges, and a HVDC system is modeled to test the proposed methods. The rest of the paper is organized as follows: Section 2 shows the fundamentals and the analysis of different traveling surges; Section 3 introduces the definition of wavelet entropy and its advantages are proved by discussing the effect of different factors; Section 4 describes the procedure of the proposed method; Section 5 gives the simulation results and demonstrates the effectiveness of wavelet entropy by comparing with the energy representation; and Section 6 offers the conclusion.
2. Traveling Surges in HVDCs
2.1. Fundamentals of HVDC
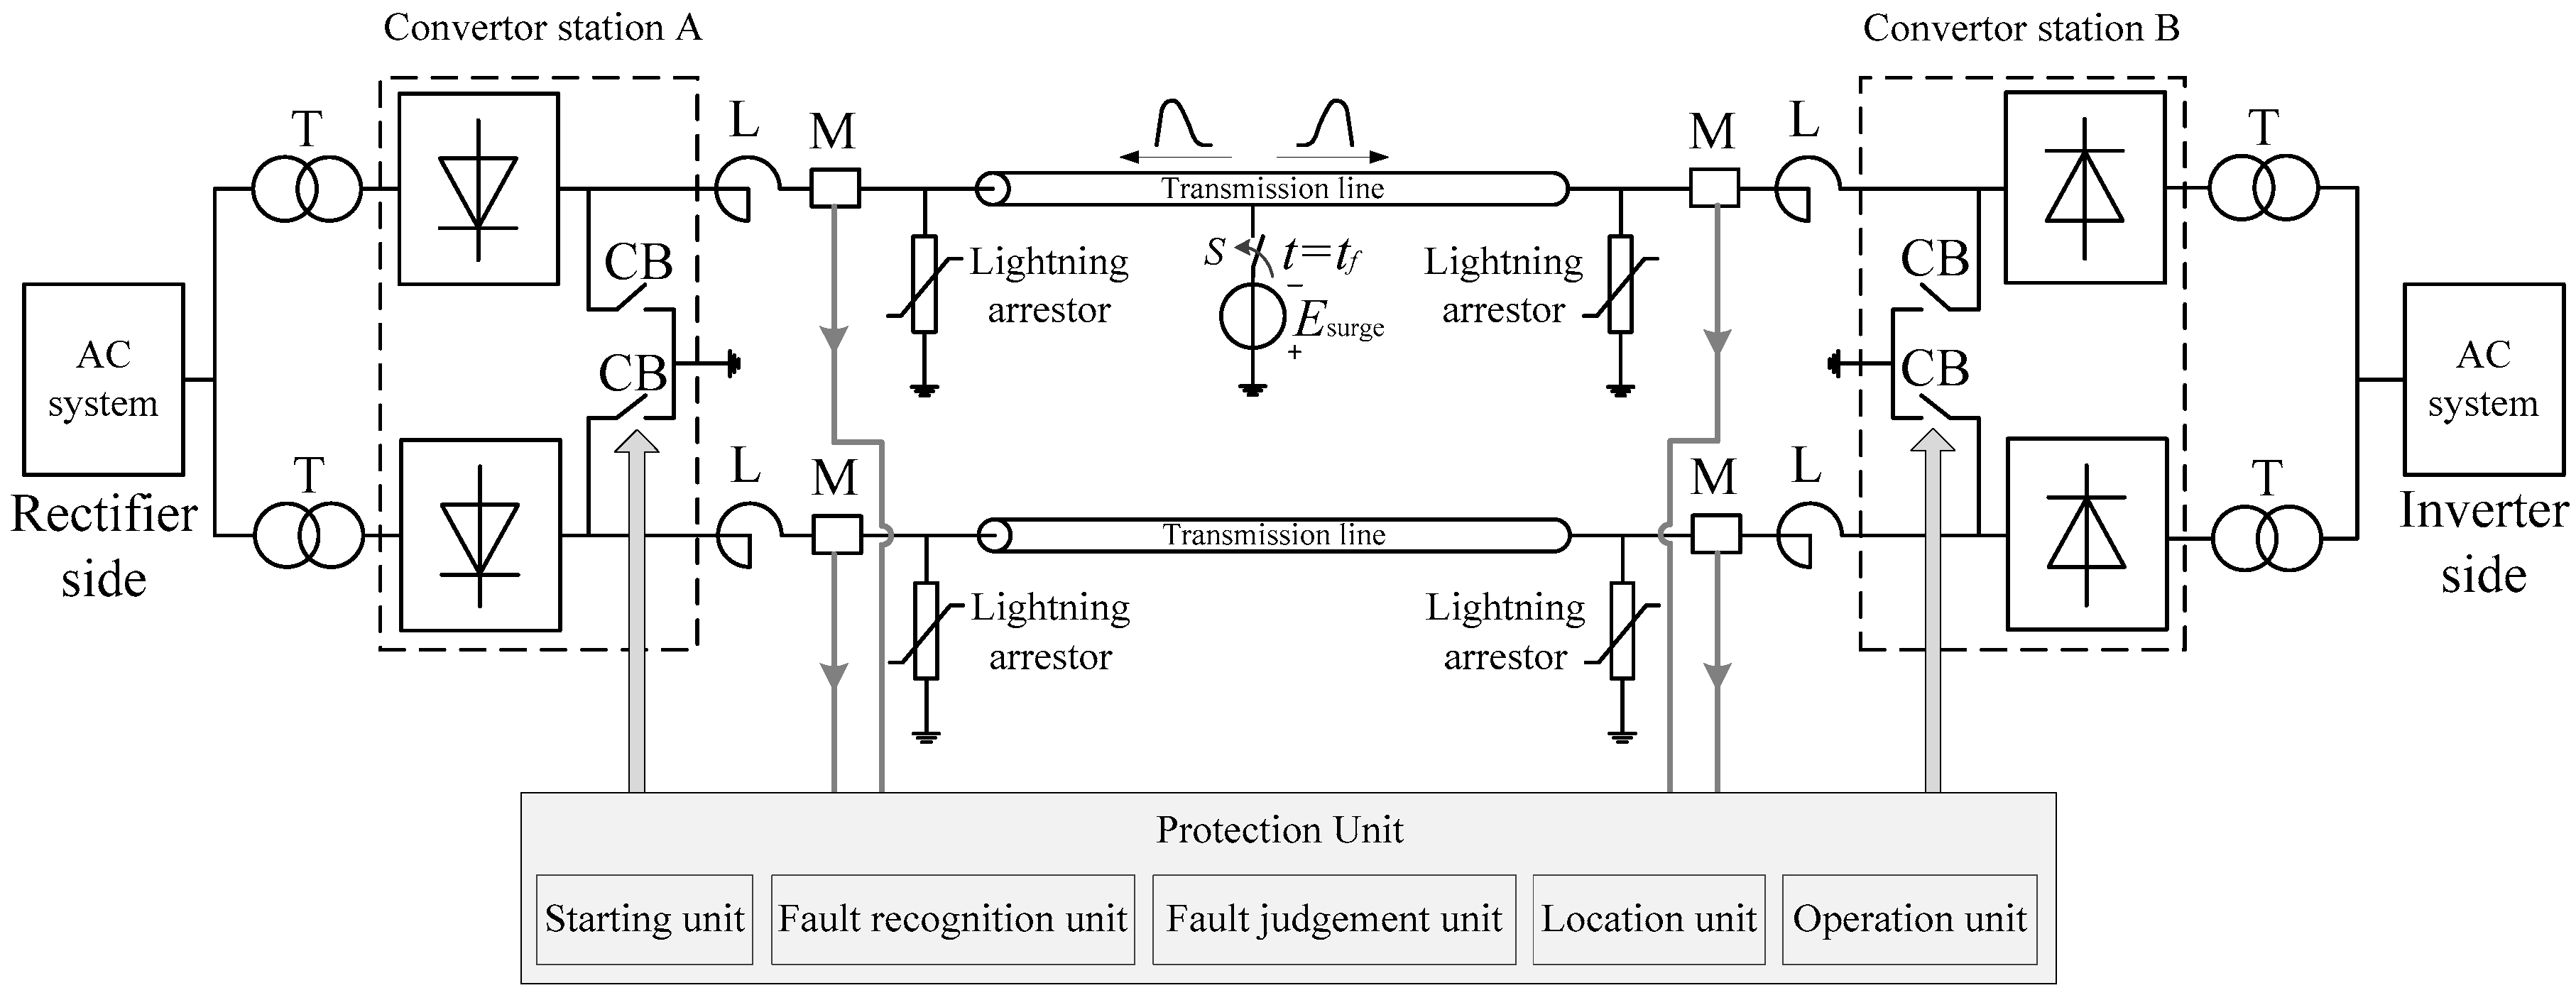
In HVDC systems, convertor stations connect DC and AC systems. A typical two-terminal point-to-point VSC-based HVDC transmission line is illustrated in Figure 1. It is a symmetric structure. The two transmission lines have voltages with the same amplitude, but opposite polarities. Once a surge is generated on a transmission line, for example, the positive pole, it will rush towards the terminals, or convertor stations A and B, with the speed of light. Due to the existence of smoothing reactor L, the high-frequency components cannot pass through and harm the apparatus and devices connected after the smoothing reactor, for example, a convertor station or the other pole. Thus, only the traveling surges within the protection zone, the transmission line, need to be discriminated. Although the magnitude of traveling surges will be reduced due to the attenuation during propagation and the diverting of lightning arrestors, they can be captured by the measurement units M if the magnitude of the traveling surge is still large enough. Usually, either the transient voltage signals or the transient current signals can be recorded for traveling surge-based transmission line protections. All of the traveling surges captured by measurement units M are delivered to protection units which are equipped in convertor stations. As shown in Figure 1, five units are basically included in the protection unit: the starting unit starts the protection unit if a possible surge is detected; the fault recognition unit recognizes fault surges from interferences, such as lightning surges; the fault judgment unit determines how serious the fault is and whether the fault is within the protected zone; the location unit measures the distance of the faulted point; and the operation unit controls the operation of breakers. Once the surges are judged to originate from faults and have the potential to harm the HVDC system, operation messages will be sent via the operation unit to circuit breakers (CBs) to isolate the faulted line.
For high-voltage systems, practical data is usually difficult to obtain for research purposes, mathematical modeling is a principle method and widely adopted in analyzing HVDC power systems [19]. Both the short faults and lightning surges can be modeled with the equivalent circuit in Figure 1. When a fault or disturbance occurs, the switch S in Figure 1 would be closed and the source Esurge is connected to the fault point or the contacting point of strikes on the transmission line. Under different conditions, the expression of the source will be different.
2.2. Traveling Surges Caused by Ground Faults
For HVDC system, the most common short fault is a pole-to-ground fault. When the fault occurs, the voltage at the fault point drops greatly, even around zero if the transition resistance is very small. Since HVDC transmission lines have a length that varies from tens of kilometers to thousands of kilometers, they can be considered as “electric long lines” for traveling surges [20]. Viewing the traveling surges at the point of measurement unit M, they can be regarded as a result of switching an additional voltage source at the fault point. Once the first surge reaches the convertor stations, the capacitors which support the DC bus voltage will start to discharge and feed the fault current to the fault point. The additional voltage Esurge can be modeled by a step function with the opposite polarity of the faulted transmission line. Equation (1) shows the expression of the equivalent voltage source:
Esurge(t) = −ES (t ≥ 0),
Here, ES is the voltage drop at the fault point when it is shorted. The magnitude of ES depends on the value of the ground resistance. A smaller ground resistance suggests a larger ES, and vice versa.
2.3. Traveling Surges Caused by Lightning Strikes
There are two kinds of lightning discharges: intra-cloud and extra-cloud [21]. The intra-cloud discharges account for around 80% of all lightning and thunder. This kind of lightning does not reach the ground and will not affect the operation of power systems. The remaining 20% of lightning, which discharges from cloud to ground, is very important for power systems.
The lightning strikes can cause a lightning surge in two ways: a direct strike and an indirect strike. The indirect strikes usually strike towers, ground wires, or some other parts of the HVDC transmission system, and cause induced surges in transmission lines. This kind of surge is much lower in amplitude, and it is not considered in traveling surge-based protection. Thus, only the traveling surges caused by direct strikes are discussed in this paper. Direct strikes make contact with the transmission line and cause an overvoltage surge in DC lines. This kind of surge is very dangerous. They rush along the transmission lines and produce high potentials over the conductors. Flashovers, or even insulation breakdown (short fault), can be generated. The lightning surge which does not result in a short fault can be called a lightning disturbance, while those lead to short faults are called lightning faults.
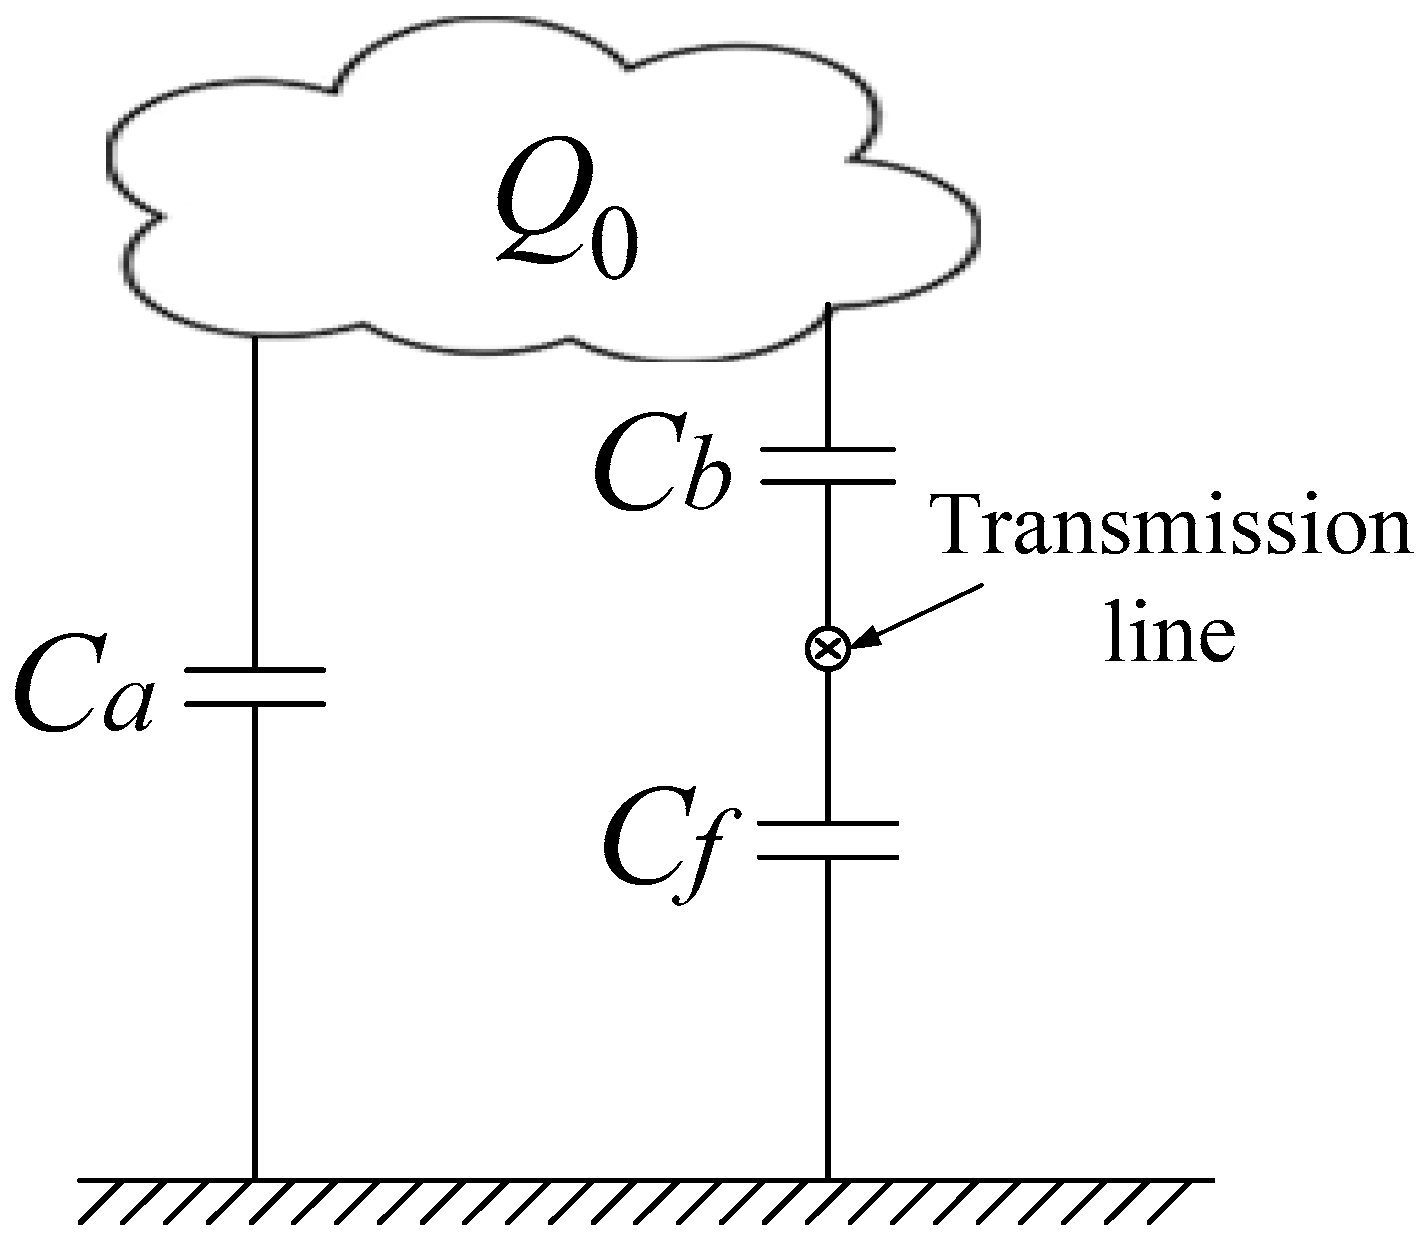
Figure 2 illustrates the equivalent model of lightning discharges. Originally, the cloud includes electric charges with an amount of Q0. The equivalent capacitance of environment can be denoted by Ca, Cb, and Cf, respectively. Before lightning discharges, 1/Ca = 1/Cb + 1/Cf and no charges flow in both paths. Once lightning discharge occurs, the capacitances between the transmission line and cloud (lightning disturbances), or even the ground (lightning faults), break down and these charges pass through the path of Cb and Cf. The generation of traveling surges can be equivalent by a superposition of an additional current source. Thus, the lightning strikes, whose waveforms are usually impulses with ultra-short rise and fall times, can be modeled by an impulsive current source, as shown in Equation (2):
Esurge(t) = I0(e−t/τ1 − e−t/τ2) (t ≥ 0),
Here, I0 is the maximum amplitude of lightning strike, τ1 and τ2 are the durations of the wavefront and wavelength of the lightning surge, which usually vary from several microseconds to tens of microseconds.
The lightning fault is actually the grounded fault caused by overvoltage lightning surges. The insulation breakdown does not happen at the beginning of lightning strikes, but at an instant when the induced voltage exceeds a certain level. Generally, the additional source Esurge can be modeled mathematically by the piecewise function in Equation (3):
Esurge(t) = −ES (0 ≤ t ≤ t0), and Esurge(t) = I0(e−t/τ1 − e−t/τ2) (t0 ≤ t ≤ ∞),
Here, t0 is the instant short fault occurs, after which the insulation breaks down and the additional current source can be replaced by a DC source with opposite polarity. The value of t0 varies under different conditions.
Figure 3 shows the current waveforms of the aforementioned three kinds of traveling surges. Obviously, more oscillations, or high-frequency components, are included in surges caused by lightning strikes.
3. Wavelet Entropy Representation of Traveling Surges
3.1. Definition of Wavelet Entropy
Wavelet transform is a very popular tool in the analysis of singularities, for example, the impulsive transient signals in power systems, and its effective performances were commonly reported [22,23]. Wavelet analysis is a multi-resolution method to explore the energy distribution in the time-frequency spectrum. For signals with singularities or sudden variations, wavelet transformation can extract the features that hide in different frequency bands.
Entropy is a popular measure of uncertainty and disorder and has been successfully applied in adaptive signal processing [24,25,26]. It also has been applied in power systems for quite a long time [27,28,29]. Since a more chaotic signal generates greater entropy, the energy distribution of a certain frequency band, which is represented by a set of wavelet details, can be regarded as a dynamic system. This system can be defined as ordered when all coefficients are of similar amplitudes, and disordered if singularities or coefficients with various amplitudes are included. As defined in the author’s previous research work [30], all of the wavelet coefficients of the ith detail level form a set Xi. The entropy Hi of set Xi with possible values {xi1, xi2, …, xin} is defined as follows:
where p(xij) is the probability of xij. The entire range of Xi is divided into a number of n intervals which have equal size. The number of coefficients in each interval is divided by the total number of coefficients in set Xi to generate a ratio p(xij). According to Equation (4), the value of entropy only depends on the distribution or probability rather than amplitude of the coefficients. In order to compare all of the wavelet entropy vectors with a same standard, normalization, which is shown in Equation (5), is employed:
Hi = −∑p(xij)logb(xij) (j = 1, 2, ..., n),
ρEi = Hi/‖H‖,
Here, Hi is the entropy of ith detail level, and H is the norm of the entropy vector which is formed by entropies of all detail levels.
3.2. Wavelet Entropies of Different Surges
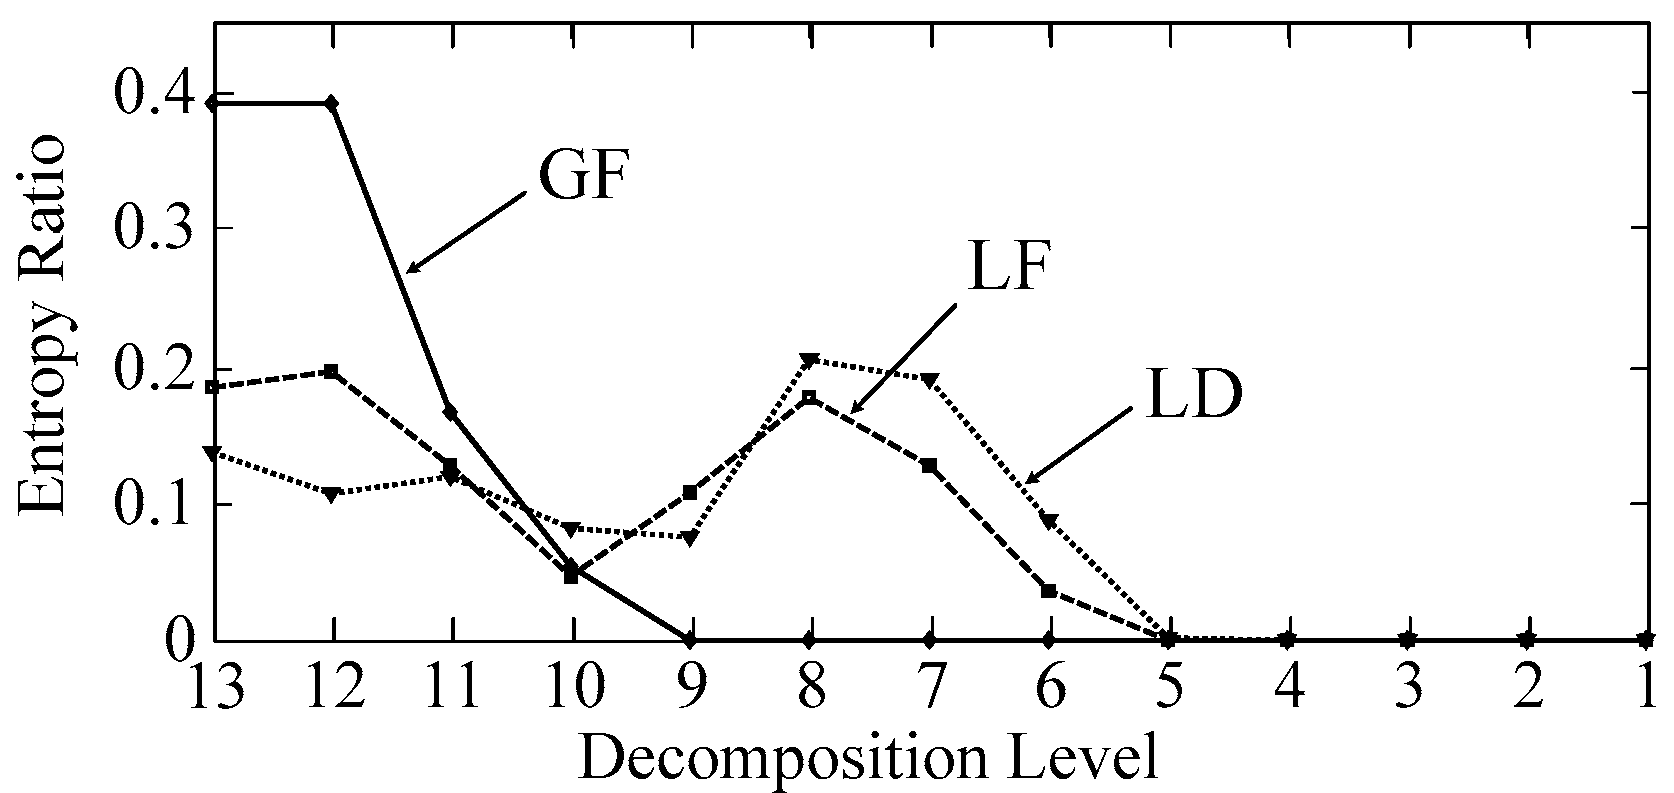
In traveling surge based protection devices, the capture and analysis of transient surges must be swift. For example, the operation of protection devices must be less than tens of milliseconds. Thus, only the first surge front of 3 ms is studied. Figure 4 demonstrates the wavelet entropies of different transient surges. In this figure, “GF”, “LF”, and “LD” represent a single pole-to-ground short fault, lightning fault, and lightning disturbance, respectively. Since the sampling frequency of these surges is 5 MHz/s, wavelet decomposition level is chosen to be 13 to ensure most frequency ranges are analyzed. Daubechies wavelet “db3” is used in the wavelet decomposition.
The entropy ratio of each wavelet decomposition level suggests the disorder of detailed wavelet coefficients in that frequency band. As shown in Figure 4, the largest entropy ratio of LD resides in levels 7 and 8, whose frequency band ranges from 9.765 kHz (5 MHz/28+1) to 39.06 kHz (5 MHz/27). This means the lightning strikes cause oscillations of the transmission system in such a frequency band. According to Equation (1), the transients produced by a grounding fault can be regarded as the response of step excitations whose energy is mostly in the lower frequency bands. In Figure 4, the largest entropy ratios of a grounding fault gather in the lower frequency bands, or in other words, higher wavelet decomposition levels. These large entropy values exist in the frequency band ranges from 305 Hz (5 MHz/213+1) to 2.44 kHz (5 MHz/211). Since the surge of a lightning fault is the response of the lightning strike before breakdown and a pole-to-ground fault after breakdown, its frequency spectrum is actually the combination of these two. The entropy ratio of a lightning fault in Figure 4 has the largest values in both oscillation frequency bands and lower frequency bands. The order of levels with largest entropy ratios are listed in Table 1.
Although the entropy distribution of each decomposition level will change slightly under different conditions, the frequency bands with the most disorder distributions will be similar when parameters of the system are unchanged. Therefore, according to entropy features of these three surges, the three frequency bands with the largest entropy ratios are selected to discriminate between different surges.
3.3. Effect of Distance and Ground Resistance
The advantage of entropy is its stability in describing the distribution of a signal. When adopting wavelet entropy to analyze surges, the attenuation of traveling surges on transmission lines and the ground resistance of faults must be considered since they are commonly encountered in practical systems.
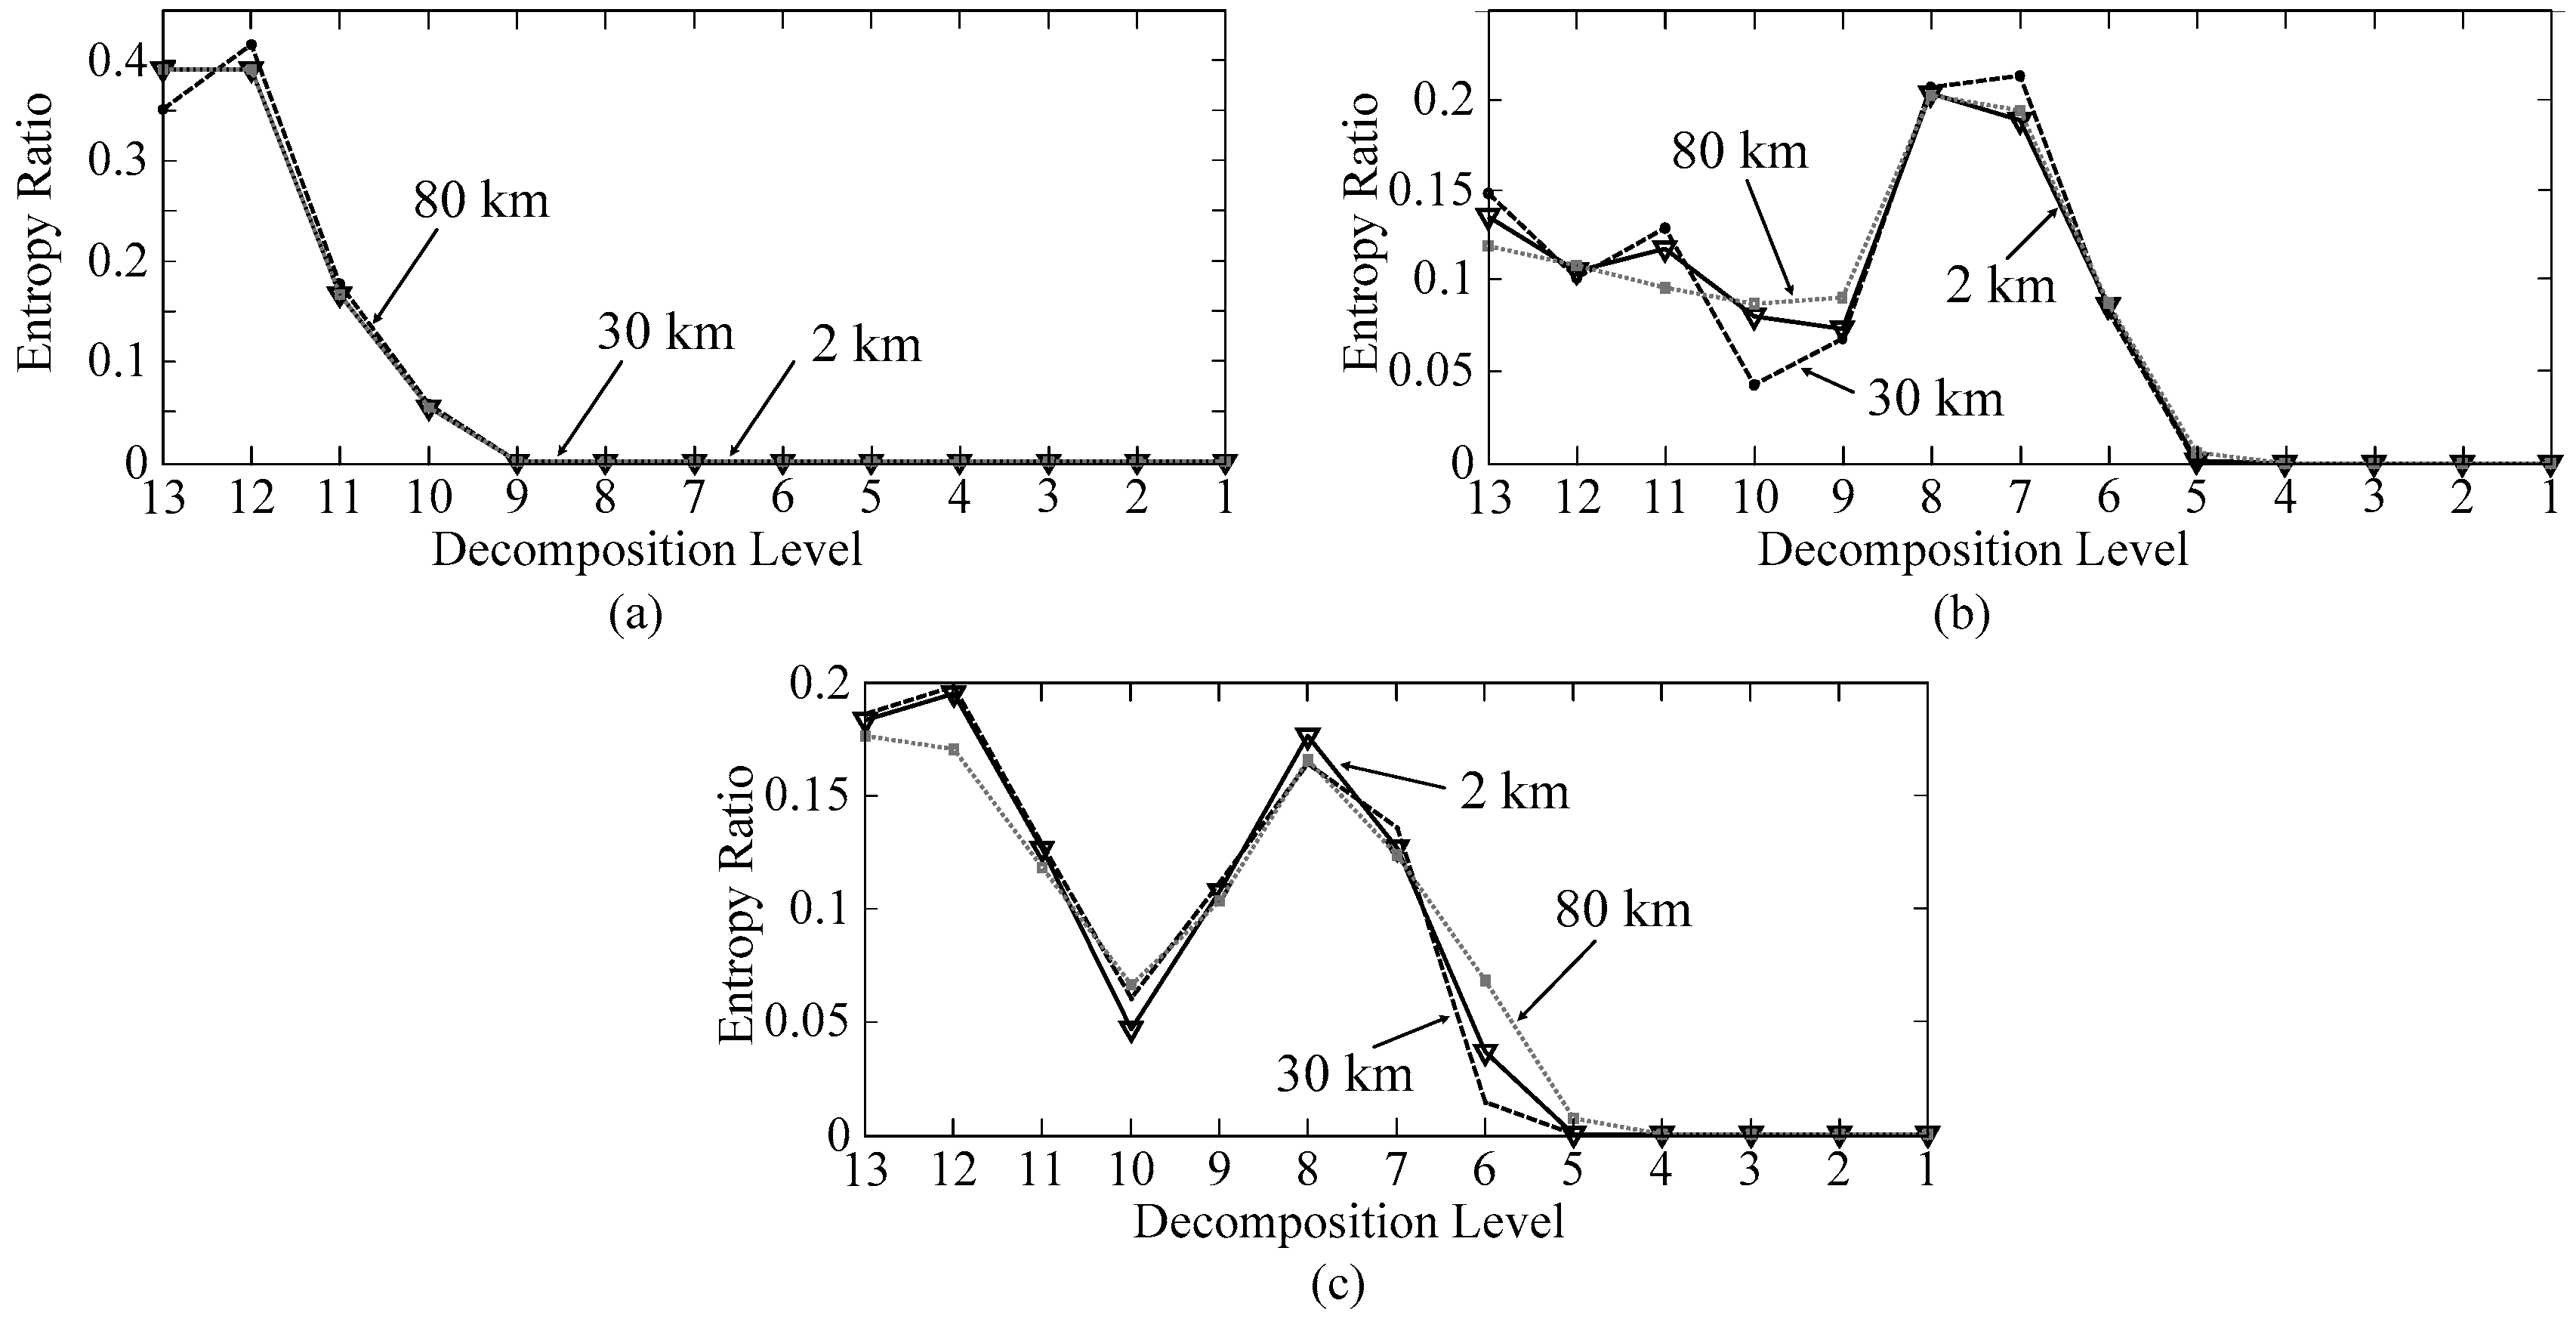
Figure 5 illustrates the wavelet entropies of different surges when they occur at different locations: 2 km, 20 km, and 40 km from the measurement unit. As demonstrated in this figure, the distributions of wavelet entropies are similar after propagating different distances. The values of entropy ratio change in some decomposition levels, but the whole distribution of all of the entropy ratios varies only slightly.
The effect of grounding resistance is also studied and shown in Figure 6. A pole-to-ground short fault is simulated with different ground resistances, from 0 Ω to 5 Ω. The fault is 2 km away from the measurement unit. As the ground resistance increases, the response of the transient current varies from under-damping to over-damping, and the distribution of entropy ratios becomes more greater. However, the decomposition levels of the largest three values remains the same.
Concluded from the above discussions, wavelet entropy can withstand the change of attenuation and ground resistance. The decomposition levels of first three largest entropy ratios almost remain the same for different surges under various conditions. For instance, entropy ratios of levels 11, 12, and 13 for ground faults are always the largest. This phenomenon can be used for distinguishing traveling surges.
4. Recognition Method of Traveling Surges
According to the discussion in Section 3, a wavelet entropy-based recognition method of traveling surges is proposed. Four steps are included.
Step One: Capture of traveling surges
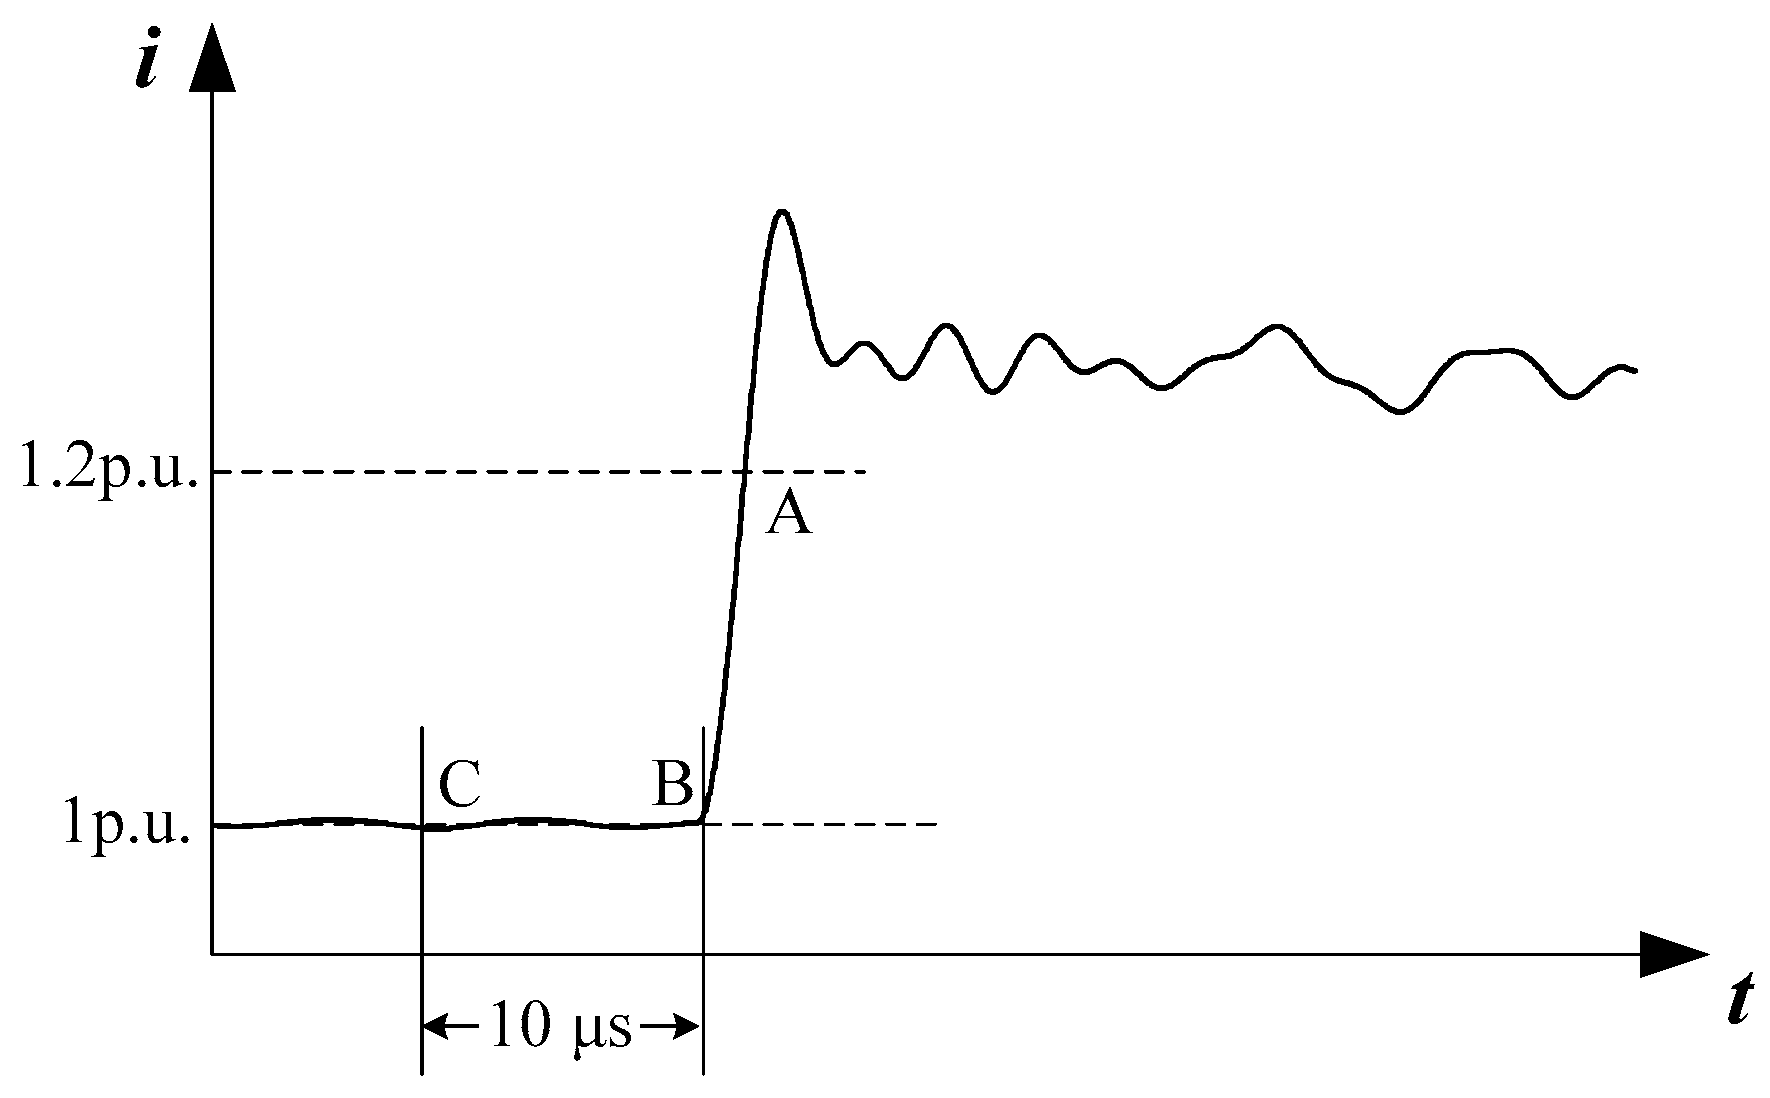
To ensure the whole frequency spectrum is analyzed, the sampling frequency should be higher than 1 MHz/s. The frequency range of traveling surges depends on the length, size, and material of the transmission lines. In order to obtain traveling waves on different transmission lines and cover the oscillation components of traveling surges, the bandwidth of traveling wave sensors should be from at least 100 Hz to greater than 2 MHz. The current traveling surges are recorded for recognition. When current increases to 1.2 p.u., a traveling surge is assumed to arrive. As shown in Figure 7, once a current exceeds 1.2 p.u., or point A, the recorder will trace back to find the last 1 p.u. current value, or point B, and then point C, which is 10 μs before point B. Point C is, thus, chosen to be the starting point of the data window whose length is 3 ms.
Step Two: Wavelet decomposition
In wavelet decomposition, two factors should be considered: the wavelet function and the number of decomposition levels. Daubechies wavelets, which are asymmetric wavelets, are proved to be effective in extracting impulsive singularities and large amplitude step responses [31]. In this paper, the third Daubechies wavelet ‘db3’ is applied to reduce the calculation.
When selecting the number of decomposition levels, two aspects should be taken into consideration: the frequency spectrum and the calculation complexity. The lowest frequency detail should cover the frequency spectrum below 1 kHz (the upper frequency limit of Nth level f/2N < 1 kHz) to ensure that almost the whole high-frequency spectrum is analyzed and avoids 100 Hz (the lower limit of Nth level f/2N+1 > 100 Hz) which contains second harmonics caused by external faults. At the same time, to produce as few calculation burdens as possible, the smallest N that satisfies the frequency requirement should be adopted. Therefore, the number of decomposition levels N is calculated according to Equation (6):
N = min[round(log2(f/1000) + 1), round(log2(f/100) − 1)],
Here, f is the sampling frequency of traveling surges. N is the smallest integer that satisfies Equation (6). For instance, if the sampling frequency is 5 MHz/s, N is calculated to be 13.
Step Three: Calculation of entropy ratios
According to Equations (4) and (5), the entropy ratios of the captured signal are calculated. One entropy value is generated by one level of detail coefficients.
Step Four: Recognition of faults and disturbances
Comparing the frequency bands with large entropy ratios can discriminate lightning disturbances from faults. As discussed in Figure 4, most disorder singularities of lightning transients are in the frequency band from around 9 kHz to around 40 kHz. Since the sampling frequency varies in different cases, the decomposition levels with large oscillations will change accordingly. However, these decomposition levels must cover the frequency band of lightning oscillations. For example, the 7th and 8th decomposition levels cover the frequency band of lightning oscillations with a sampling frequency of 5 MHz/s, while the 5th and 6th levels do so with a sampling frequency of 1 MHz/s. In order to analyze both the lightning oscillating component and low-frequency component, the largest three entropy ratios are selected to recognize the types of traveling surges. If a lightning disturbance is detected, at least two levels containing oscillating components will produce larger entropies. For a lightning fault, due to the large entropy at the low-frequency band, the largest three entropy ratios will distribute in both the low-frequency band and the oscillating frequency band. Therefore, the judgment of surge types can be performed, as shown in Table 2.
5. Simulation Results
To demonstrate the effectiveness of wavelet entropy, the proposed method is performed with simulated transient surges and compared with the energy-based method. A VSC HVDC system is modeled on the PSCAD platform (Manitoba HVDC Research Centre, Winnipeg, MB, Canada), and its construction is the same as the model in Figure 1. The AC voltage is 220 kV, the DC bus voltage is ±320 kV, and the length of the transmission line is 40 km. The value of the smoothing reactor is selected to be 60 mH. The transmission line model in PSCAD is applied.
5.1. Recognition Results of Proposed Method
Three groups of traveling surges are simulated with different parameters and recorded by different sampling frequencies. To demonstrate the effectiveness of the proposed method under various conditions, the parameters change in different ranges: the ground resistance varies from 0.01 Ω to 5 Ω; the amplitude of lightning strikes changes from 5 kA to 40 KA when simulating lightning disturbances, and from 30 kA to 80 kA when simulating lightning faults. For each group, 20 surges are recorded and sampled by different frequencies: 1 MHz/s, 2 MHz/s, and 5 MHz/s. To illustrate the effect of white noise, which is commonly encountered in the practical environment, Gaussian white noise with different powers are added. Table 3 shows the recognition results with proposed method. With a signal-to-noise ratio (SNR) of 60 dB, all of the single-pole-to-ground faults can be recognized correctly. Only one lightning disturbance surge is misjudged to be a lightning fault. The lowest recognition rate (65%) is produced when lightning fault surges are sampled at 5 MHz/s, but only three surges are judged to be disturbances. Thus, the fault recognition rate of a lightning fault is much higher, around 80%, when both lightning faults and ground faults are considered together. As the power of added noises increase, the recognition rates of surges remain almost the same, except a slight decrease when classifying lightning disturbances from lightning faults. One more misjudgment is reported when the SNR decreases, but the overall recognition rates are still no less than 90%. These results demonstrate the proposed wavelet entropy-based method can recognize faults from interferences with a high recognition rate and reduce the misjudgments of protection units.
5.2. Comparison with the Energy-Based Method
As the most popular method of frequency domain analysis, wavelet energy distribution has many merits, for example, easy calculation and straightforward representation [32]. However, when analyzing traveling surges, whose spectrum in some frequency bands contains a large amount of information, but has a small amplitude, the wavelet energy representations cannot reveal the differences. In this paper, the energy ratio is adopted for comparisons. Its definition is shown in Equation (7) [30]:
ρengi = Ei/‖E‖,
Similar with the definition of entropy ratio, the energy ratio also treats the coefficients of each wavelet decomposition level as a set. The energy of ith set equals the Euclidean norm of the wavelet coefficients, which means Ei = ‖ci‖ = √(∑ci,j2) (j = 1, 2,..., n) where ci,j is the jth coefficient on the ith level. Here, E is the vector formed by energy values of all detail levels, and ‖E‖ is the norm of vector E. The same traveling surges are characterized by the energy ratio and analyzed by comparing the largest three energy ratios. The recognition results are shown in Table 4. It is easy to see that the energy-based method cannot discriminate lightning disturbances from lightning faults, since the energy of oscillation-containing levels is much larger than those from low-frequency levels. When only the amplitude of the wavelet coefficients is considered, the distribution features in some frequency bands, for instance, the lower-frequency bands of lightning faults, cannot be noticed. When compared with the wavelet entropy-based method, the wavelet energy-based protection unit is more likely to operate during lightning disturbances.
6. Conclusions
In this paper, the wavelet entropy is proposed to recognize different kinds of traveling surges in HVDC systems. Based on the analysis of the properties of different surges and their wavelet entropies under various conditions, wavelet entropy is proved to be effective in characterizing traveling surges. Furthermore, by comparing the distribution of wavelet entropies, traveling surge recognition rules are established, and the selection of parameters, such as decomposition levels, are discussed. The simulation results demonstrate the proposed wavelet entropy-based method can effectively distinguish different kinds of traveling surges in HVDC systems, and shows a better performance than the most commonly-used representation: wavelet energy.
Acknowledgments
This research is funded by the National Natural Science Foundation of China (Foundation No. 51507008), the State High-Tech Development Plan (863 program, 2015AA050101), and the Fundamental Research Funds for the Central Universities of China (2015JBM089).
Author Contributions
Guomin Luo developed the method and wrote the paper; Qizhi Lin performed the comparisons; Lin Zhou performed the experiments; and Jinghan He provided some suggestions in improving this paper. All authors have read and approved the final manuscript.
Conflicts of Interest
The authors declare no conflict of interest.
References
- Song, G.; Chu, X.; Gao, S.; Kang, X.; Jiao, Z. A new whole-line quick-action protection principle for hvdc transmission lines using one-end current. IEEE Trans. Power Deliv. 2015, 30, 599–607. [Google Scholar] [CrossRef]
- Liu, X.; Osman, A.H.; Malik, O.P. Hybrid traveling wave/boundary protection for monopolar HVDC line. IEEE Trans. Power Deliv. 2009, 24, 569–578. [Google Scholar] [CrossRef]
- Liang, Z.; Zhu, Y.; Dai, L.; Wen, Q. Identification of lightning strikes on transmission lines based on mathematical morphology and integral method. In Proceedings of the 2nd IET Renewable Power Generation Conference (RPG 2013), Beijing, China, 9–11 September 2013; pp. 1–4. [Google Scholar]
- Kong, F.; Hao, Z.; Zhang, S.; Zhang, B. Development of a novel protection device for bipolar HVDC transmission lines. IEEE Trans. Power Deliv. 2014, 29, 2270–2278. [Google Scholar] [CrossRef]
- Xing, L.; Yang, D.; Zhang, D.; Li, W.; Chen, Q. Fault transient simulation analysis for HVDC transmission lines. In Proceedings of the 2015 5th International Conference on Electric Utility Deregulation and Restructuring and Power Technologies (DRPT), Changsha, China, 26–29 November 2015; pp. 312–317. [Google Scholar]
- Nanayakkara, O.M.K.K.; Rajapakse, A.D.; Wachal, R. Location of dc line faults in conventional HVDC systems with segments of cables and overhead lines using terminal measurements. IEEE Trans. Power Deliv. 2012, 27, 279–288. [Google Scholar] [CrossRef]
- Lin, S.; Gao, S.; He, Z.; Deng, Y. A pilot directional protection for HVDC transmission line based on relative entropy of wavelet energy. Entropy 2015, 17, 5257–5273. [Google Scholar] [CrossRef]
- Jafarian, P.; Sanaye-Pasand, M. A traveling-wave-based protection technique using wavelet/pca analysis. IEEE Trans. Power Deliv. 2010, 25, 588–599. [Google Scholar] [CrossRef]
- Dong, X.Z.; Kong, W.; Cui, T. Fault classification and faulted-phase selection based on the initial current traveling wave. IEEE Trans. Power Deliv. 2009, 24, 552–559. [Google Scholar] [CrossRef]
- Aguilera, C.; Orduna, E.; Ratta, G. Directional traveling-wave protection based on slope change analysis. IEEE Trans. Power Deliv. 2007, 22, 2025–2033. [Google Scholar] [CrossRef]
- Vazquez, E.; Castruita, J.; Chacon, O.L.; Conde, A. A new approach traveling-wave distance protection—Part I: Algorithm. IEEE Trans. Power Deliv. 2007, 22, 795–800. [Google Scholar] [CrossRef]
- Evrenosoglu, C.Y.; Abur, A. Travelling wave based fault location for teed circuits. IEEE Trans. Power Deliv. 2005, 20, 1115–1121. [Google Scholar] [CrossRef]
- Haykin, S.S. Introduction. Neural Networks: A Comprehensive Foundation, 2nd ed.; Prentice Hall: Upper Saddle River, NJ, USA, 1999; pp. 1–44. [Google Scholar]
- Fadlallah, B.; Chen, B.; Keil, A.; Principe, J. Weighted-permutation entropy: A complexity measure for time series incorporating amplitude information. Phys. Rev. E 2013, 87, 022911. [Google Scholar] [CrossRef] [PubMed]
- Ning, S.; Han, Z.; Wang, Z.; Wu, X. Application of sample entropy based lmd-tfpf de-noising algorithm for the gear transmission system. Entropy 2016, 18, 414. [Google Scholar] [CrossRef]
- Yang, Q.; Wang, J. Multi-level wavelet shannon entropy-based method for single-sensor fault location. Entropy 2015, 17, 7101–7117. [Google Scholar] [CrossRef]
- Zhang, L.L.; Li, M.S.; Ji, T.Y.; Wu, Q.H.; Jiang, L.; Zhan, J.P. Morphology singular entropy-based phase selector using short data window for transmission lines. IEEE Trans. Power Deliv. 2014, 29, 2162–2171. [Google Scholar] [CrossRef]
- Chen, B.; Xing, L.; Xu, B.; Zhao, H.; Príncipe, J.C. Insights into the robustness of minimum error entropy estimation. IEEE Trans. Neural Netw. Learn. Syst. 2016. [Google Scholar] [CrossRef] [PubMed]
- Liu, X.; Osman, A.H.; Malik, O.P. Real-time implementation of a hybrid protection scheme for bipolar HVDC line using fpga. IEEE Trans. Power Deliv. 2011, 26, 101–108. [Google Scholar] [CrossRef]
- Bewley, L.V. Traveling waves on electric power systems. Bull. Am. Math. Soc. 1942, 48, 527–538. [Google Scholar] [CrossRef]
- You, M.; Zhang, B.H.; Cheng, L.Y.; Bo, Z.Q.; Klimek, A. Lightning model for HVDC transmission lines. In Proceedings of the 10th IET International Conference on Developments in Power System Protection (DPSP 2010), Managing the Change, Manchester, UK, 29 March–1 April 2010; pp. 1–5. [Google Scholar]
- Gaouda, A.M.; El-Saadany, E.F.; Salama, M.M.A.; Sood, V.K.; Chikhani, A.Y. Monitoring HVDC systems using wavelet multi-resolution analysis. IEEE Trans. Power Syst. 2001, 16, 662–670. [Google Scholar] [CrossRef]
- Kerf, K.D.; Srivastava, K.; Reza, M.; Bekaert, D.; Cole, S.; Hertem, D.V.; Belmans, R. Wavelet-based protection strategy for DC faults in multi-terminal VSC HVDC systems. IET Gener. Transm. Distrib. 2011, 5, 496–503. [Google Scholar] [CrossRef]
- Chen, B.; Wang, J.; Zhao, H.; Principe, J.C. Insights into entropy as a measure of multivariate variability. Entropy 2016, 18, 196. [Google Scholar] [CrossRef]
- Chen, B.; Zhu, Y.; Hu, J. Mean-square convergence analysis of adaline training with minimum error entropy criterion. IEEE Trans. Neural Netw. 2010, 21, 1168–1179. [Google Scholar] [CrossRef] [PubMed]
- Chen, B.D.; Yuan, Z.J.; Zheng, N.N.; Principe, J.C. Kernel minimum error entropy algorithm. Neurocomputing 2013, 121, 160–169. [Google Scholar] [CrossRef]
- Liu, R.; Sun, X.; Li, Z. On the application of entropy in excitation control. In Proceedings of the 2004 International Conference on Power System Technology (PowerCon 2004), Singapore, 21–24 November 2004; Volume 951, pp. 952–956. [Google Scholar]
- Chen, J.K.; Li, G.Q. Tsallis wavelet entropy and its application in power signal analysis. Entropy 2014, 16, 3009–3025. [Google Scholar] [CrossRef]
- Luo, G.; Zhang, D.; Koh, Y.; Ng, K.; Leong, W. Time-frequency entropy-based partial-discharge extraction for nonintrusive measurement. IEEE Trans. Power Deliv. 2012, 27, 1919–1927. [Google Scholar] [CrossRef]
- Luo, G.; Zhang, D.; Tseng, K.J.; He, J. Impulsive noise reduction for transient earth voltage-based partial discharge using wavelet-entropy. IET Sci. Meas. Technol. 2016, 10, 69–76. [Google Scholar] [CrossRef]
- Mallat, S.G. Wavelet basis. In A Wavelet Tour of Signal Processing: The Sparse Way, 3rd ed.; Elsevier/Academic Press: Burlington, MA, USA, 2009; pp. 263–376. [Google Scholar]
- Jin, J. Protection of HVDC transmission lines based on wavelet transformation and analysis of energy spectrum. In Proceedings of the 2013 2nd International Symposium on Instrumentation and Measurement, Sensor Network and Automation (Imsna), Toronto, ON, Canada, 23–24 December 2013; pp. 180–185. [Google Scholar]
Figure 1.
Diagram of a VSC HVDC transmission line.

Figure 2.
Equivalent model of lightning discharge.

Figure 3.
Traveling current surges of on a positive pole: (a) pole-to-ground short fault; (b) lightning disturbance; and (c) lightning fault.
Figure 3.
Traveling current surges of on a positive pole: (a) pole-to-ground short fault; (b) lightning disturbance; and (c) lightning fault.
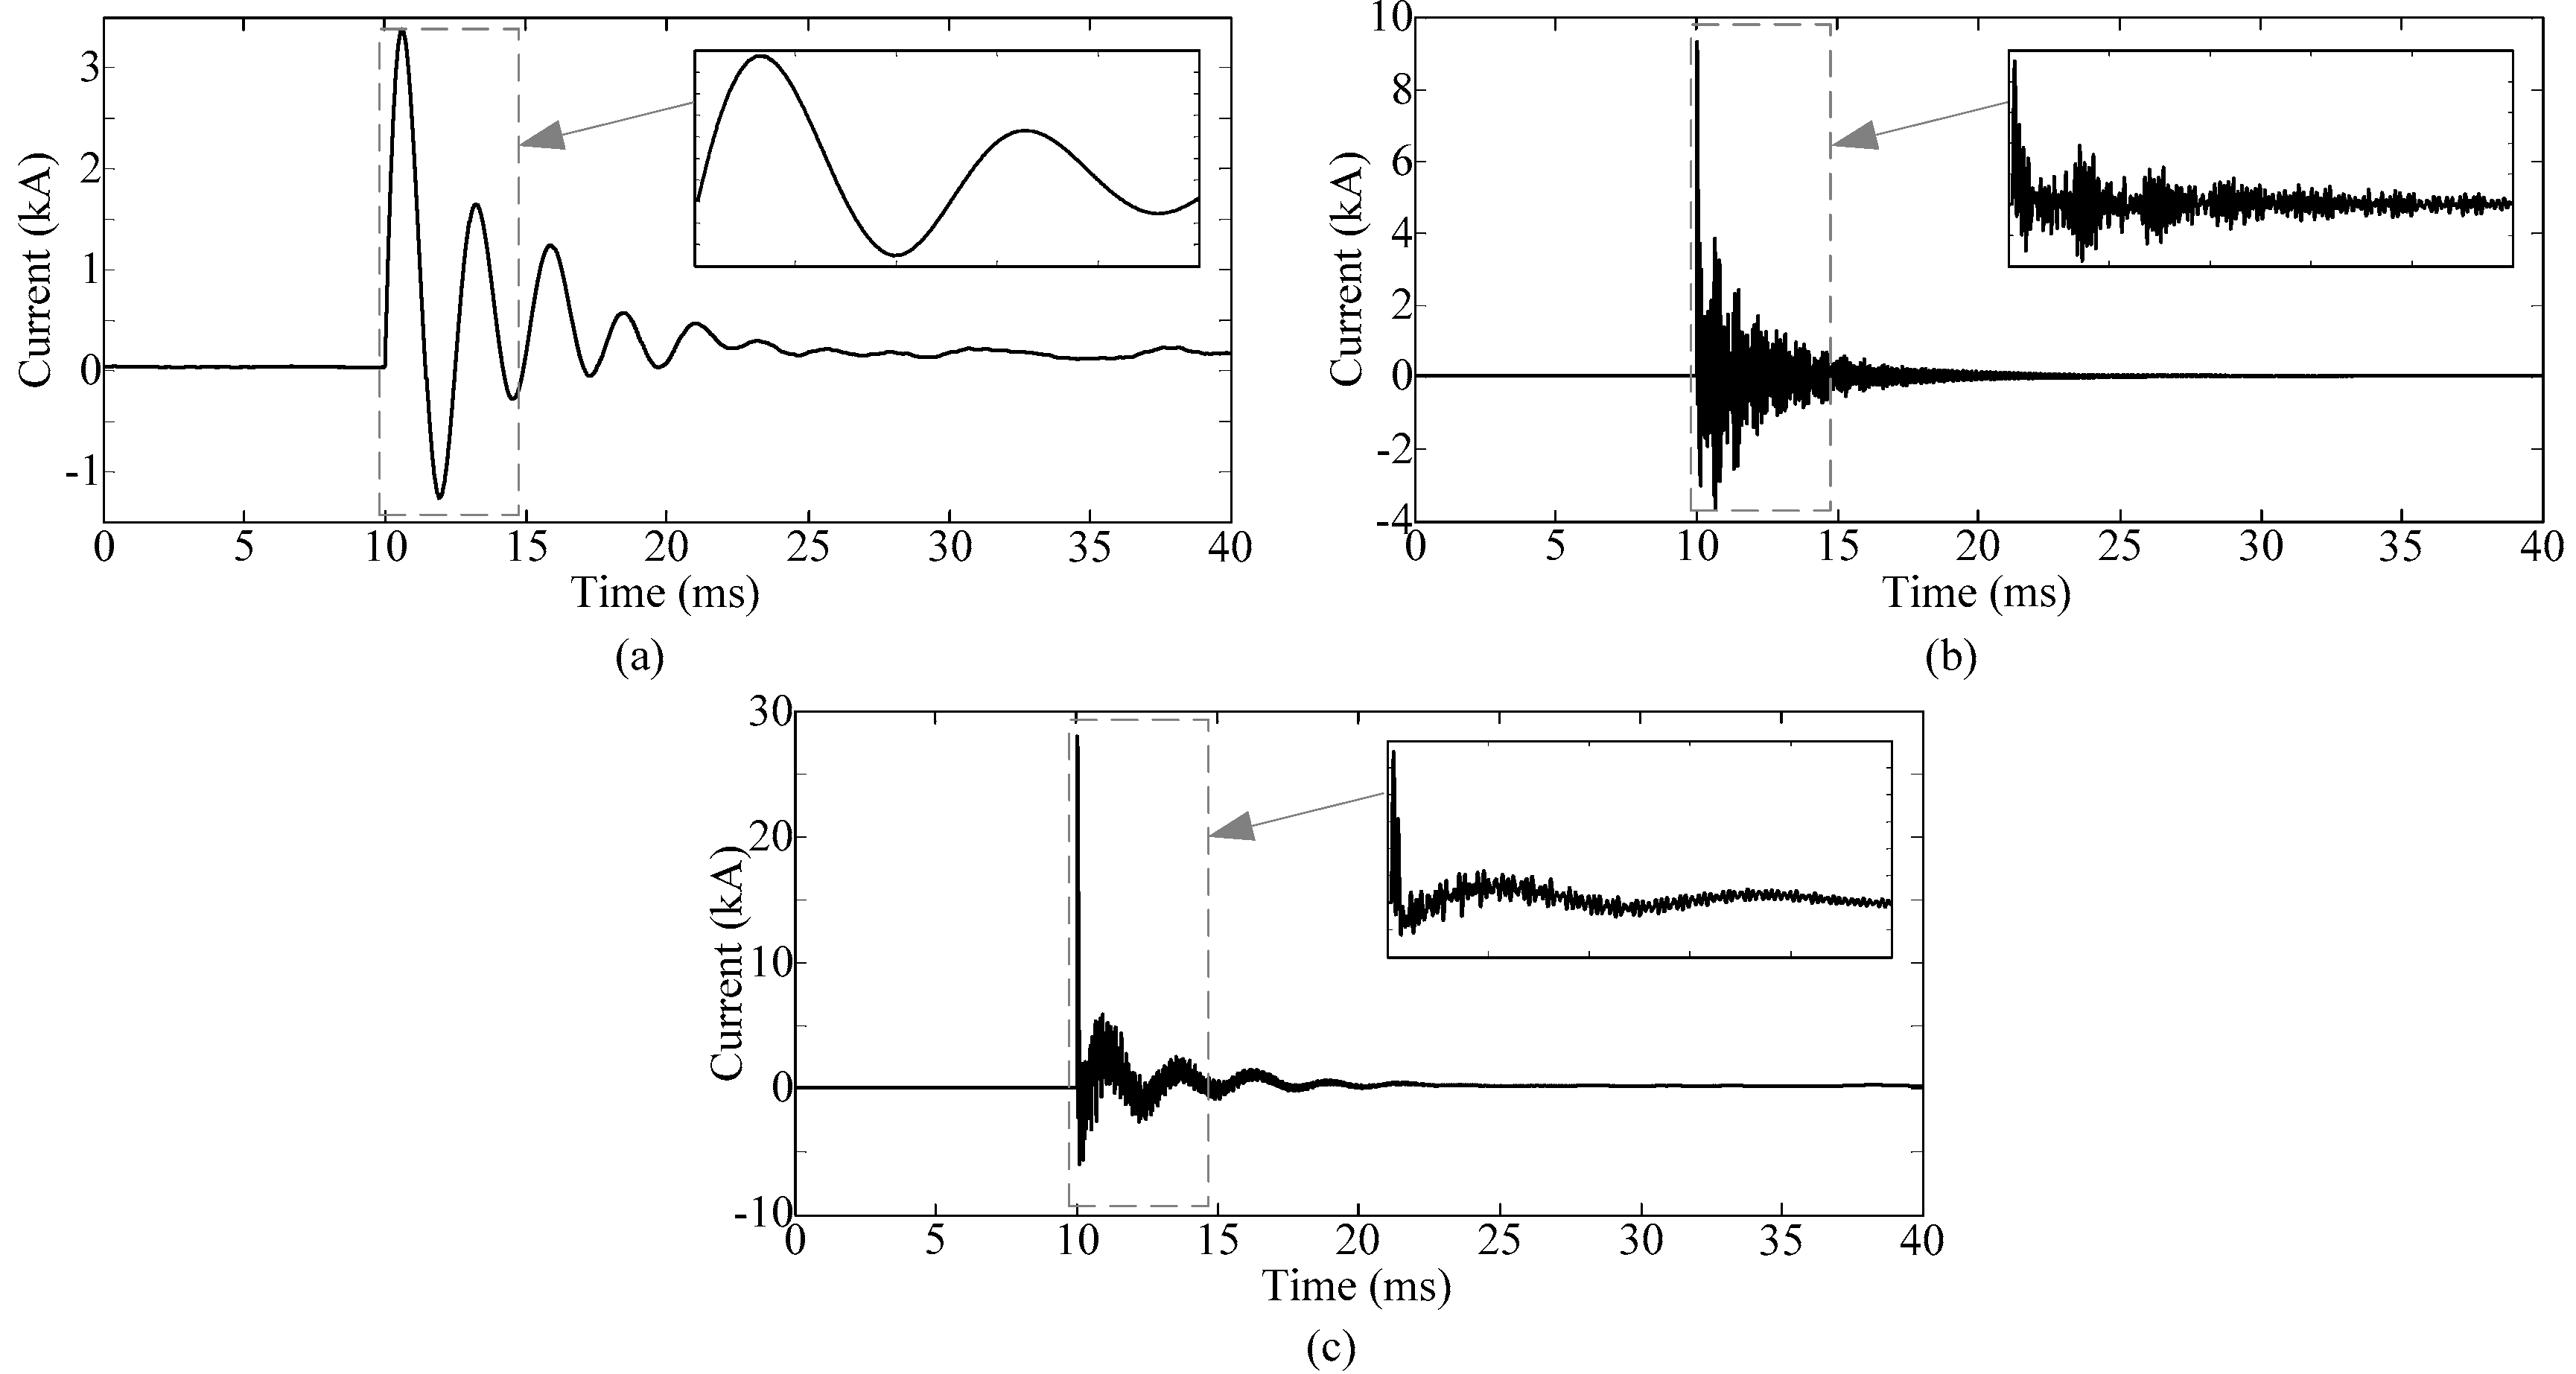
Figure 4.
Wavelet entropies of different surges.

Figure 5.
Effect of distance: (a) pole-to-ground fault; (b) lightning disturbance; and (c) lightning fault.
Figure 5.
Effect of distance: (a) pole-to-ground fault; (b) lightning disturbance; and (c) lightning fault.

Figure 6.
Effect of ground resistance.
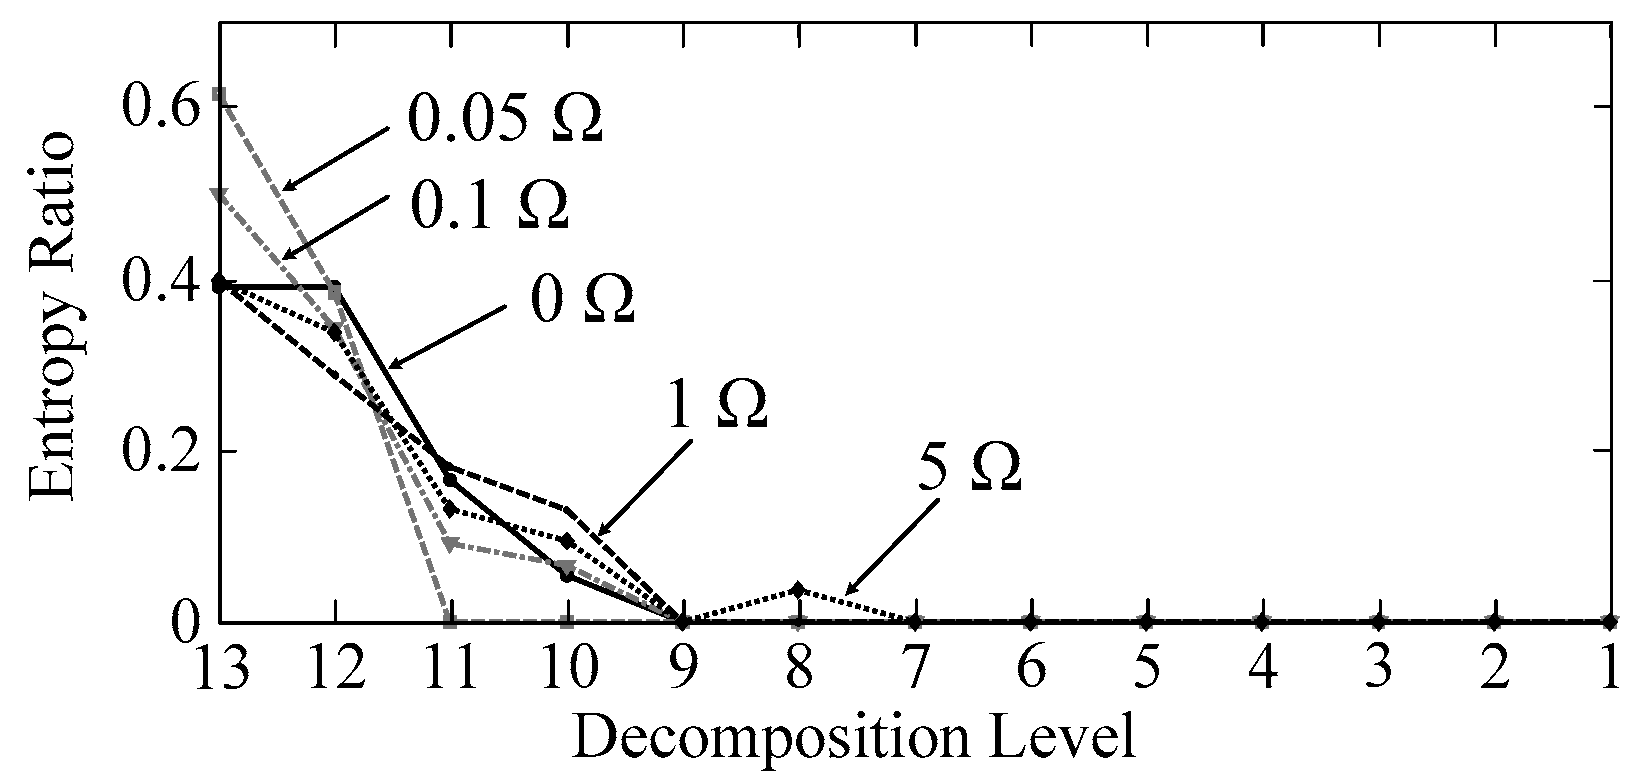
Figure 7.
Demonstration of the capture of traveling surges.


Table 1.
Order of largest entropy ratios of different transient surges.
| Type of Surges | Order of Entropy Ratios from Largest to Smallest |
|---|---|
| Pole-to-Ground Fault (GF) | 12, 13, 11, 10, 1, 2, 3, 4, 5, 6, 7, 8, 9 |
| Lightning Disturbance (LD) | 8, 7, 13, 11, 12, 6, 10, 9, 5, 1, 2, 3, 4 |
| Lightning Fault (LF) | 12, 13, 8, 7, 11, 9, 10, 6, 1, 2, 3, 4, 5 |
Table 2.
Judgment rules of wavelet entropy-based traveling surges recognition.
| Type of Traveling Surges | GF | LD | LF |
|---|---|---|---|
| Rules | Three largest entropy ratios are all in low-frequency levels | At least two of the largest entropy ratios are in oscillation-containing levels | Two of the three largest entropy ratios are in low-frequency levels and the other is in an oscillation-containing level |
Table 3.
Recognition results of traveling surges with entropy representations in different scenarios.
Table 3.
Recognition results of traveling surges with entropy representations in different scenarios.
| Type | Sampling Frequency | Ground Resistance | Amplitude of Lightning Stroke | No. of Surges | SNR | Recognition | Misjudgment |
|---|---|---|---|---|---|---|---|
| GF | 1 MHz/s | 0.01 Ω–5 Ω | N/A | 20 | 60 dB | 20 (100%) | 0 |
| 45 dB | 20 (100%) | 0 | |||||
| 30 dB | 20 (100%) | 0 | |||||
| 2 MHz/s | 20 | 60 dB | 20 (100%) | 0 | |||
| 45 dB | 20 (100%) | 0 | |||||
| 30 dB | 20 (100%) | 0 | |||||
| 5 MHz/s | 20 | 60 dB | 20 (100%) | 0 | |||
| 45 dB | 20 (100%) | 0 | |||||
| 30 dB | 20 (100%) | 0 | |||||
| LD | 1 MHz/s | N/A | 5 kA–40 kA | 20 | 60 dB | 20 (100%) | 0 |
| 45 dB | 20 (100%) | 0 | |||||
| 30 dB | 20 (100%) | 0 | |||||
| 2 MHz/s | 20 | 60 dB | 19 (95%) | 1 (1 LF) | |||
| 45 dB | 18 (90%) | 2 (LF) | |||||
| 30 dB | 18 (90%) | 2 (LF) | |||||
| 5 MHz/s | 20 | 60 dB | 20 (100%) | 0 | |||
| 45 dB | 20 (100%) | 0 | |||||
| 30 dB | 20 (100%) | 0 | |||||
| LF | 1 MHz/s | 0.01 Ω–5 Ω | 30 kA–80 kA | 20 | 60 dB | 15 (75%) | 5 (4 LD, 1 LF) |
| 45 dB | 15 (75%) | 5 (4 LD, 1 LF) | |||||
| 30 dB | 15 (75%) | 5 (4 LD, 1 LF) | |||||
| 2 MHz/s | 20 | 60 dB | 19 (95%) | 1 (1 LD) | |||
| 45 dB | 19 (95%) | 1 (1 LD) | |||||
| 30 dB | 19 (95%) | 1 (1 LD) | |||||
| 5 MHz/s | 20 | 60 dB | 13 (65%) | 7 (3 LD, 4 LF) | |||
| 45 dB | 13 (65%) | 7 (3 LD, 4 LF) | |||||
| 30 dB | 13 (65%) | 7 (3 LD, 4 LF) |
Table 4.
Recognition results of traveling surges with energy representations in different scenarios.
Table 4.
Recognition results of traveling surges with energy representations in different scenarios.
| Type | Sampling Frequency | Ground Resistance | Amplitude of Lightning Stroke | No. of Surges | Recognition | Misjudgment |
|---|---|---|---|---|---|---|
| GF | 1 MHz/s | 0.01 Ω–5 Ω | N/A | 20 | 20 (100%) | 0 |
| 2 MHz/s | 20 | 20 (100%) | 0 | |||
| 5 MHz/s | 20 | 12 (60%) | 8 (4 LF, 4 LD) | |||
| LD | 1 MHz/s | N/A | 5 kA–40 kA | 20 | 20 (100%) | 0 |
| 2 MHz/s | 20 | 20 (100%) | 0 | |||
| 5 MHz/s | 20 | 20 (100%) | 0 | |||
| LF | 1 MHz/s | 0.01 Ω–5 Ω | 30 kA–80 kA | 20 | 0 (0%) | 20 (20 LD) |
| 2 MHz/s | 20 | 0 (0%) | 20 (20 LD) | |||
| 5 MHz/s | 20 | 0 (0%) | 20 (20 LD) |
© 2017 by the authors. Licensee MDPI, Basel, Switzerland. This article is an open access article distributed under the terms and conditions of the Creative Commons Attribution (CC BY) license (http://creativecommons.org/licenses/by/4.0/).
Share and Cite
MDPI and ACS Style
Luo, G.; Lin, Q.; Zhou, L.; He, J. Recognition of Traveling Surges in HVDC with Wavelet Entropy. Entropy 2017, 19, 184. https://doi.org/10.3390/e19050184
AMA Style
Luo G, Lin Q, Zhou L, He J. Recognition of Traveling Surges in HVDC with Wavelet Entropy. Entropy. 2017; 19(5):184. https://doi.org/10.3390/e19050184
Chicago/Turabian StyleLuo, Guomin, Qizhi Lin, Lin Zhou, and Jinghan He. 2017. "Recognition of Traveling Surges in HVDC with Wavelet Entropy" Entropy 19, no. 5: 184. https://doi.org/10.3390/e19050184
Note that from the first issue of 2016, this journal uses article numbers instead of page numbers. See further details here.