
Symbolic Analysis of Brain Dynamics Detects Negative Stress
by
 , , and
Beatriz García-Martínez
, 
Arturo Martínez-Rodrigo
*,
Roberto Zangróniz
,
José Manuel Pastor
and
Raúl Alcaraz
Research Group in Electronic, Biomedical and Telecommunication Engineering, University of Castilla-La Mancha, 16071 Cuenca, Spain
*
Author to whom correspondence should be addressed.
Entropy 2017, 19(5), 196; https://doi.org/10.3390/e19050196
Submission received: 3 March 2017
/
Revised: 23 April 2017
/
Accepted: 26 April 2017
/
Published: 28 April 2017
(This article belongs to the Special Issue Symbolic Entropy Analysis and Its Applications)
Abstract
:The electroencephalogram (EEG) is the most common tool used to study mental disorders. In the last years, the use of this recording for recognition of negative stress has been receiving growing attention. However, precise identification of this emotional state is still an interesting unsolved challenge. Nowadays, stress presents a high prevalence in developed countries and, moreover, its chronic condition often leads to concomitant physical and mental health problems. Recently, a measure of time series irregularity, such as quadratic sample entropy (QSEn), has been suggested as a promising single index for discerning between emotions of calm and stress. Unfortunately, this index only considers repetitiveness of similar patterns and, hence, it is unable to quantify successfully dynamics associated with the data temporal structure. With the aim of extending QSEn ability for identification of stress from the EEG signal, permutation entropy (PEn) and its modification to be amplitude-aware (AAPEn) have been analyzed in the present work. These metrics assess repetitiveness of ordinal patterns, thus considering causal information within each one of them and obtaining improved estimates of predictability. Results have shown that PEn and AAPEn present a discriminant power between emotional states of calm and stress similar to QSEn, i.e., around 65%. Additionally, they have also revealed complementary dynamics to those quantified by QSEn, thus suggesting a synchronized behavior between frontal and parietal counterparts from both hemispheres of the brain. More precisely, increased stress levels have resulted in activation of the left frontal and right parietal regions and, simultaneously, in relaxing of the right frontal and left parietal areas. Taking advantage of this brain behavior, a discriminant model only based on AAPEn and QSEn computed from the EEG channels P3 and P4 has reached a diagnostic accuracy greater than 80%, which improves slightly the current state of the art. Moreover, because this classification system is notably easier than others previously proposed, it could be used for continuous monitoring of negative stress, as well as for its regulation towards more positive moods in controlled environments.
1. Introduction
Nowadays, the electroencephalogram (EEG) plays a key role in research concerning dozens of psychological processes and mental disorders [1]. By simple visual inspection, experts are able to obtain useful information to manage diagnosis and therapy for many brain diseases [2]. Moreover, application of signal processing tools to this recording has also proven an interesting ability to reveal hidden insights related to the underlying brain behavior under a variety of scenarios [3]. Indeed, the EEG has been characterized both from linear and nonlinear points of view. Most linear techniques proposed for the EEG processing are mainly based on the computation of its power spectral density (PSD), as well as the symmetry among different frequency bands [4,5,6,7,8]. However, these tools have only reported limited information with regards to the EEG nonlinear analysis in numerous mental disorders, such as epilepsy [9], Alzheimer’s [10], depression [11,12], schizophrenia [13] and alcoholism [14]. This outcome is not surprising because individual neurons, as well as interactions among them, present highly heterogeneous conducts, which are far from being linear [15,16]. Indeed, neurons are governed by threshold and saturation phenomena. Additionally, large networks of interconnected neurons are likely candidates for self-organized criticality, which refers to large systems with local nonlinear interactions where a slow build-up of some energy value is altered with brief bursts of energy redistribution [17].
The interest in automatic recognition of emotions from the EEG has also grown notably in the last years [18]. Indeed, nonlinear analysis of this signal has provided a better ability to discern among many emotional states than other physiological recordings, including the electromyogram (EMG), the electrocardiogram (ECG) or the electro-dermal activity (EDA) signal [19,20]. Nonetheless, further research in this field is still necessary, since the proposed systems are not completely effective [20]. Moreover, they also require advanced combinations of a large number of features [21], thus making it difficult to improve current knowledge about the brain behavior under different emotions. In this respect, clinical meaning of each variable is fully blurred within complex classifiers. However, accurate understanding of how the brain works in response to different affective stimuli is essential to enhance efficiency and flexibility of human–computer interfaces [21]. In fact, these systems need self-adaptation capability, which can only be reached by considering the human agent emotional state [22].
Some issues hampering automatic identification of emotions are the high intercorrelation among them, as well as the lack of a standardized model for their definition [20]. Indeed, single emotions are weirdly described in affective arousal studies [23]. Moreover, a stimulus can elicit different emotional states in different subjects [23]. Indeed, it is well-known that emotional response of every individual is highly dependent on their personality and previous experiences, as well as on other social and cultural aspects [23,24]. Nonetheless, several theories and classification models of emotions can be found in the literature. For instance, Ekman [25] has defined six basic emotions, i.e., happiness, sadness, anger, disgust, surprise and fear, which can be combined to describe more complex affective states. On the other hand, Russell [26] has proposed a model based on two dimensions, which is currently the most used one. In this case, every emotion is classified according to its levels of valence and arousal. The dimension of valence refers to how pleasant or unpleasant a stimulus is, whereas the level of arousal is related to the excitement or calmness that it provokes.
Among all emotions, negative stress (also named distress) deserves special attention due to its current prevalence in developed countries [27,28]. Continuous atmosphere of competitiveness, job pressure, economic status and social judgement in modern societies leads many people to a frenetic life rhythm, thus favoring the appearance of stress [29]. As an example, according to the American Institute of Stress (AIS), about 75% of the U.S. population suffers from psychological or physical consequences of this emotional state [30]. Although short-term distress is not today considered as a risk factor for health, a chronic condition of this emotion often causes or aggravates physical problems, such as hypertension and coronary artery disease [31], irritable bowel syndrome, gastroesophageal reflux disease or back pain [32,33]. Additionally, some mental disorders, like depression or anxiety, also appear frequently associated with long periods of negative stress [34]. On the other hand, this emotional state has also been identified as a relevant risk factor in particular situations, e.g., driving tasks, clinical interventions, military operations, etc. [35]. To avoid these concomitant issues to the negative stress, its automatic identification is highly interesting. However, it is still an unsolved challenge [36].
To the best of our knowledge, a few nonlinear indices, including correlation dimension (CD), fractal dimension (FD) and high order crossings (HOC) have been mainly applied to the EEG recording for discerning between emotional states of calm and distress [37,38,39]. Unfortunately, they have presented poor single discriminant powers, thus requiring their combination with advanced algorithms to reach classification results between 65% and 80% [37,38,39]. More recently, the well-known sample entropy (SEn) and two modifications, i.e., quadratic SEn (QSEn) and distribution entropy (DEn), have been examined in a systematic and thorough study [40]. In this case, QSEn has shown an ability to discriminate between emotional states of calm and distress about 70%, moreover highlighting clear differences in regularity of time series obtained from different brain areas. In view of these outcomes, QSEn could be considered as one of the most promising single indices presented to date for automatic identification of distress [40]. However, this metric has only been defined to estimate regularity of time series [41], thus discarding other information contained by the data [42]. Precisely, since QSEn only considers the absolute distance between patterns to compute their similarity and repetitiveness, this index ignores temporal relationships among values of the time series. Hence, it is unable to quantify structure and possible temporal patterns in the data [43].
In contrast to QSEn, some symbolic entropies have proven ability to assess order relation and time scales from the analyzed dynamics, thus revealing information about the data time structure [43]. These metrics are based on the original time series transformation into a sequence of symbols, whose distribution is mainly characterized through common measures of entropy, such as the Shannon approach [44]. Interestingly, the information collected from the EEG signal with these indices has resulted in being complementary to the one obtained by SEn and QSEn in a variety of clinical contexts [42]. Hence, the main goal of the present work is to complement the previous QSEn analysis for automatic identification of distress by exploring the popular permutation entropy (PEn) and its most recent modification to consider data amplitude [45,46]. PEn is a simple and fast method that transforms the original time series into a symbolized sequence without any prior knowledge [45]. Basically, it compares the order of neighboring relative values, thus providing entropy estimates robust to observational and dynamic noises [45].
The remainder of manuscript is organized as follows. Section 2 describes the database analyzed in the study, as well as the processing applied to the EEG recordings and the algorithms used to compute the permutation entropies. The main results are next introduced in Section 3 and then discussed in Section 4. Finally, the most remarkable conclusions are depicted in Section 5.
2. Methods
2.1. Study Population
To ensure reproducibility of this work, a publicly available dataset was used. Indeed, EEG recordings from the Database for Emotion Analysis using Physiological Signals (DEAP) [47] were analyzed. These signals, together with other peripheral recordings such as the EMG, blood volume pressure and galvanic skin response, were acquired by means of a Biosemi ActiveTwo system during an experiment of emotional elicitation with audiovisual stimuli. Precisely, a set of 32 healthy volunteers (between 19 and 37 years, mean of 26.9 years, 50% men) visualized forty 1 min-length music videos with emotional content. The procedure was divided into two parts, such that the volunteers first visualized 20 videos and, after a brief break, displayed the other 20 ones. Hence, a total of 1280 samples from a broad variety of affective states were recorded. After each video, levels of valence, arousal and dominance subjectively perceived by each participant were also collected through self-assessment manikins (SAM). These graphical tests allow for expressing up to nine levels of pleasure (valence), excitation (arousal) and dominance [48]. Furthermore, individuals also rated their level of liking and familiarity after the visualization of each video. More detailed information about the DEAP database can be found in [47].
In this experiment, audiovisual stimuli were chosen to cover the whole valence-arousal space. However, only the samples corresponding to emotional states of calm and negative stress were considered in the present study. They were selected according to previous works also dealing with automatic identification of distress [37,39,40,49]. Thus, the group of negatively stressed subjects was formed by 133 samples rated with levels of valence lower than 3 and arousal higher than 5. Regarding the group of calm individuals, 146 samples with levels of valence between 4 and 6 and arousal lower than 4 were collected. A total of 279 samples were finally analyzed.
2.2. Preprocessing Applied to the EEG Recording
A sampling rate of 512 Hz was used to acquire the EEG signal from 32 electrodes distributed on the scalp, according to the standardized 10–20 system [50]. As in previous works [40,47], the last 30 second-length interval from each recording was selected for its analysis. It was first preprocessed to remove typical noise and nuisance interferences. Thus, the signal was initially referenced to the mean of all electrodes [47]. Thereafter, forward/backward high-pass (3 Hz cut-off frequency) and low-pass (45 Hz cut-off frequency) filtering approaches were used to remove baseline and power-line interferences [47], respectively. Note that this preprocessing preserves the frequency band of most interest in the EEG [1]. Next, the contamination from the electrical activity of other physiological systems (e.g., eyes, heart, etc.), as well as some technical artifacts, like electrode-pops, were reduced making use of independent component analysis (ICA) [51,52]. Thus, independent components were obtained from the EEG signal by means of a extended ICA algorithm and, then, visually revised to remove those containing noise and interferences. Some interferences causing a high-amplitude noise were unsuccessfully removed in this way and, then, the clean signal was estimated by interpolation from adjacent electrodes [53].
2.3. Permutation Entropy
PEn was initially introduced by Bandt and Pompe [45]. Assuming a time series of N samples in length, i.e., , the first step to compute this entropy is to form vectors of size m samples, such that , for . Next, an ordinal pattern is associated with each vector , which is defined as the permutation of that fulfills . Thus, different ordinal patterns, referred to as , can be obtained from vectors . For instance, six different ordinal patterns can be considered for , such as , , , , and . The appearance probability of each pattern can then be estimated by its relative frequency, such that
where is the Kronecker delta function modified to work with patterns, i.e.,
Finally, PEn is obtained by computing Shannon entropy from the probability distribution for all the symbols, and, then, it is normalized by its highest value, i.e., , such that
This index is able to provide well-interpretable estimates of time series predictability [42]. Indeed, when only a pattern can be found in a completely predictable time series, PEn provides a value of 0. Contrarily, if all symbols present the same occurrence probability, the largest value of 1 is obtained.
Although PEn has been able to reveal interesting information from real-world time series, including physiological signals and data from time course of stock markets [43], it presents a major limitation. Thus, given that PEn only considers ordinal structure of patterns, the amplitude of each sample is discarded. As an example, vectors and produce the same ordinal pattern , thus contributing equally to the final value of PEn [46]. Different alternatives to overcome this problem have been proposed [46,54,55], but they make use of a very similar mathematical basis. Hence, the most recently proposed amplitude-aware PEn (AAPEn) has been considered in this study [46]. Briefly, the repetition probability of each pattern is estimated by considering its relative frequency, as well as the average absolute (AA) and relative amplitudes (RA) associated with the vectors . For a specific vector , that amplitudes can be obtained as
respectively. Then, the occurrence probability of can be computed as
where K is an adjusting coefficient, ranging from 0 to 1, to weight properly the terms AA and RA. According to the authors, this parameter makes AAPEn flexible for its application to a broad variety of time series [46]. Nonetheless, for AAPEn computation from EEG signals, a value of has been recommended [46] and, therefore, used in this work. Finally, Shannon Entropy is again used to compute AAPEn, such that
A proper selection of m is key to obtaining robust entropy estimates from both PEn and AAPEn. To this respect, higher values of m allow for considering a greater number of different patterns, thus normally yielding more reliable outcomes. In this line, some previous works have proven that to discern properly between stochastic and deterministic dynamics [43]. Nonetheless, if m is too large, entropy estimation requires long computation times and, therefore, a trade-off between these aspects has to be considered [46]. In fact, only values of m between 3 and 7 have been previously recommended [42,43,45].
2.4. Performance Assessment
As previously commented, QSEn could be considered as one of the most promising single indices to identify automatically distress from the EEG recording [40]. Hence, this metric is here computed as a reference. In brief, repetitiveness of vectors is obtained by computing the maximum absolute distance between scalar components, i.e.,
such that and are considered similar if this distance is lower than a tolerance r. Next, the number of vectors similar to , i.e., , has to be computed by excluding self-matches. Then, the average share for all vectors of length m can be estimated as
Repeating the process for vectors of length , QSEn can be computed as [56]
As for PEn and AAPEn, optimal selection of m and r is also essential in QSEn computation. To this respect, García-Martínez et al. [40] have already studied the effect of these parameters on the recognition of negative stress, and, therefore, the values recommended by these authors were used in this study. Thus, QSEn was computed with values of and times the standard deviation of the original data [40].
On the other hand, note that the statistical differences between the entropy values obtained from emotional states of calm and distress were evaluated making use of a one-way analysis of variance (ANOVA) test. The selection of this parametric test was based on the verification of normal and homoscedastic distributions for PEn, AAPEn and QSEn through Shapiro–Wilks and Levene analyses, respectively. A value of statistical significance was considered significant. Moreover, to estimate the discriminant power of each index between emotional states of calm and stress, a stratified 10-fold cross-validation approach was used. It is a robust way to train and test a classifier with all the available samples and minimizing every bias in classification [57]. Briefly, the database is first divided into 10 sets, which have to contain a balanced representation from all the classes. Then, a classifier is trained and tested 10 times, such that, for each iteration, a fold is used for testing and the remaining ones for training. Finally, global classification is obtained by averaging results from the 10 iterations. In this study, a receiver operating characteristic (ROC) curve was used as classifier. It is a graphical representation of sensitivity (i.e., the true positive rate) versus specificity (i.e., true negative rate) for several thresholds or cut-off points. The percentage of distressed subjects properly identified was considered as sensitivity, whereas the rate of calm individuals correctly detected was defined as specificity. The total number of samples rightly recognized was taken as diagnostic accuracy, such that the cut-off point maximizing this share was chosen as the optimal threshold for classification.
Finally, a forward stepwise variable selection (FSVS) approach was used to analyze the relevance in distress recognition of the spatial information contained by the values of PEn, AAPEn and QSEn obtained from the different brain regions. Thus, the first selected variable was the one providing the lowest statistical significance at univariate analysis. Next, for each step, a variable with a value of at univariate analysis was included in the model, but it only remained when the Wald static was minimized. Finally, since the variables chosen in this way are characterized by only containing complementary information, a support vector machine (SVM) classifier, with Gaussian kernel and a scaling factor of 0.35, was used for exploring the discriminant ability of their combination.
3. Results
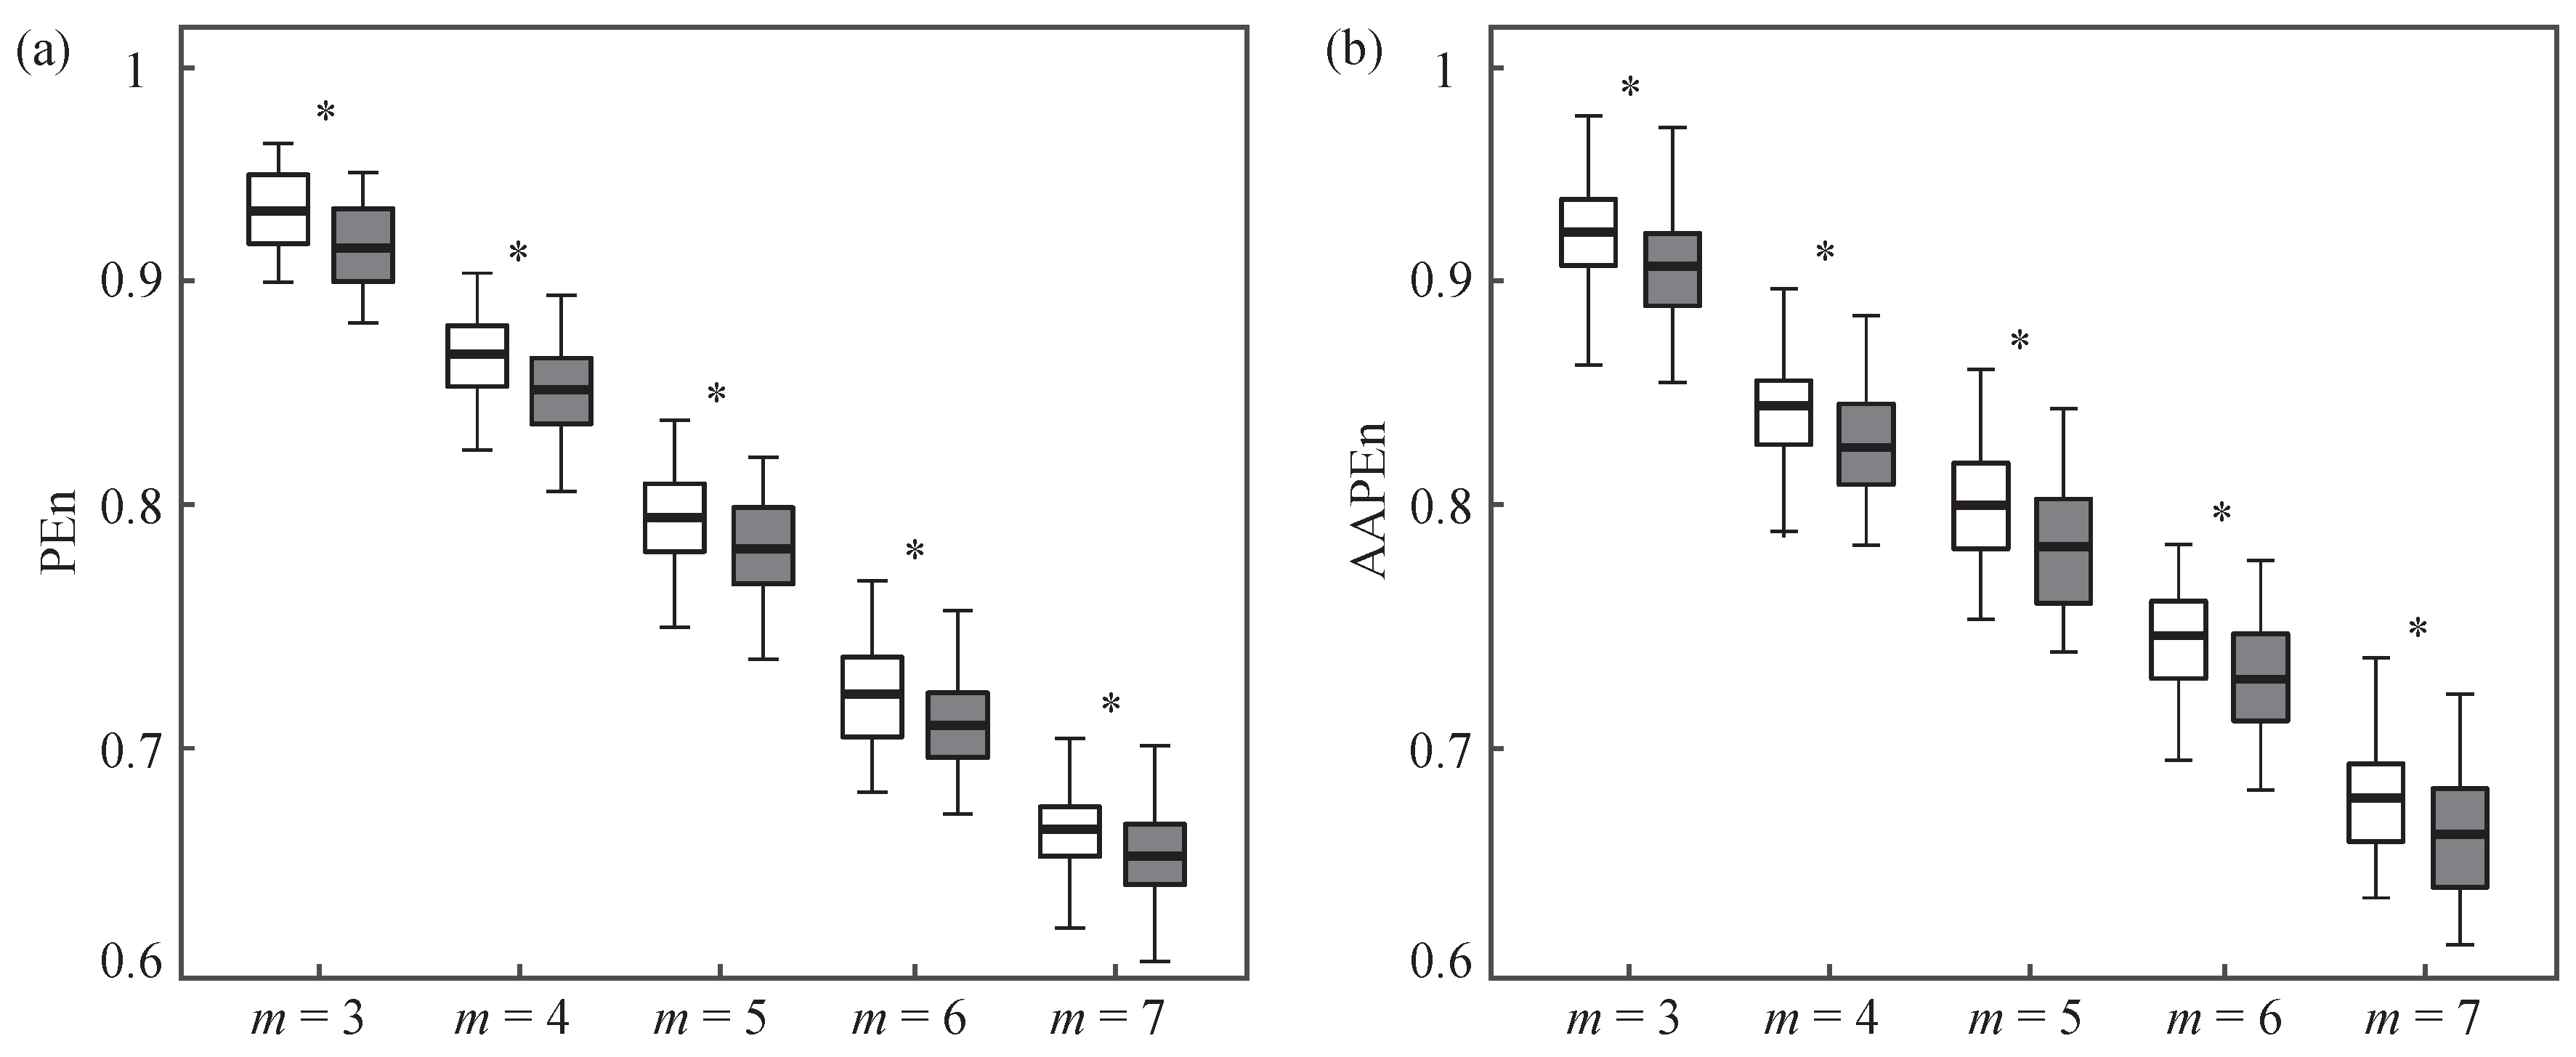
To analyze EEG epochs as stationary as possible and, moreover, to provide time-invariant estimates of entropy, PEn, AAPEn and QSEn were computed and averaged from six non-overlapped five-second-length intervals for each EEG channel. It should be noted that non-overlapped intervals of 7.5, 10 and 30 s in length were also analyzed, but no significant differences among the entropy values were noticed for any index. Thus, very similar results were observed in all cases. Furthermore, given the importance of m to compute PEn and AAPEn, values ranging from 3 to 7 were considered [43]. Indeed, Figure 1 shows boxplots of the entropy values obtained as a function of m for emotional states of calm and stress. Note that the EEG channel P3 provided the highest statistical differences between groups of emotions and, therefore, only information from this signal is shown in the figure. Anyway, consistent entropy values can be observed for every m. Indeed, regardless of this parameter, calm subjects provided higher values of PEn and AAPEn than distressed individuals. Additionally, the decreasing trend in entropy values as a function of m could be considered as expected. Indeed, although the repetition likelihood of a specific pattern decreases when m increases (because there are more potential patterns) and the entropy should increase, this rising is counterbalanced by the increasing normalization factor of [55]. Anyway, it is worth noting that the highest statistical differences between both emotional states were noticed for and, therefore, the remaining results are only presented for this parameter.
On the other hand, the distributions of the average values of PEn and AAPEn computed from the 32 EEG channels are presented in Figure 2. As can be seen, very similar layouts are noticed for both metrics from emotional states of calm and distress. Indeed, notable differences are only observed in the central brain region, where AAPEn is able to define more clearly areas with more predictable activity for distressed subjects. Beyond this finding, the most remarkable result is that both indices present higher entropy values from every EEG channel for the emotional state of calm than distress. Nonetheless, two clear zones are identified for both emotions, such that the circle covering central, fronto-central and parietal areas shows a notably more predictable activity than the remaining ones.
In agreement with these observations, statistically significant differences between calm and distressed subjects were reported for most of the EEG channels (21 out of 32). As aforementioned, the highest statistical differences were provided by the channel P3 both for PEn () and AAPEn (). This channel also showed the best classification outcomes between both emotional states, thus yielding values of sensitivity, specificity and accuracy of 78.17%, 48.46% and 64.11% for PEn and 78.83%, 50.05% and 65.39% for AAPEn, respectively. As can also be seen in Table 1, other EEG channels both from PEn and AAPEn only provided a diagnostic accuracy slightly lower than P3, ranging from 60% to 65%. The remaining EEG recordings reported discriminant abilities lower than 60%.
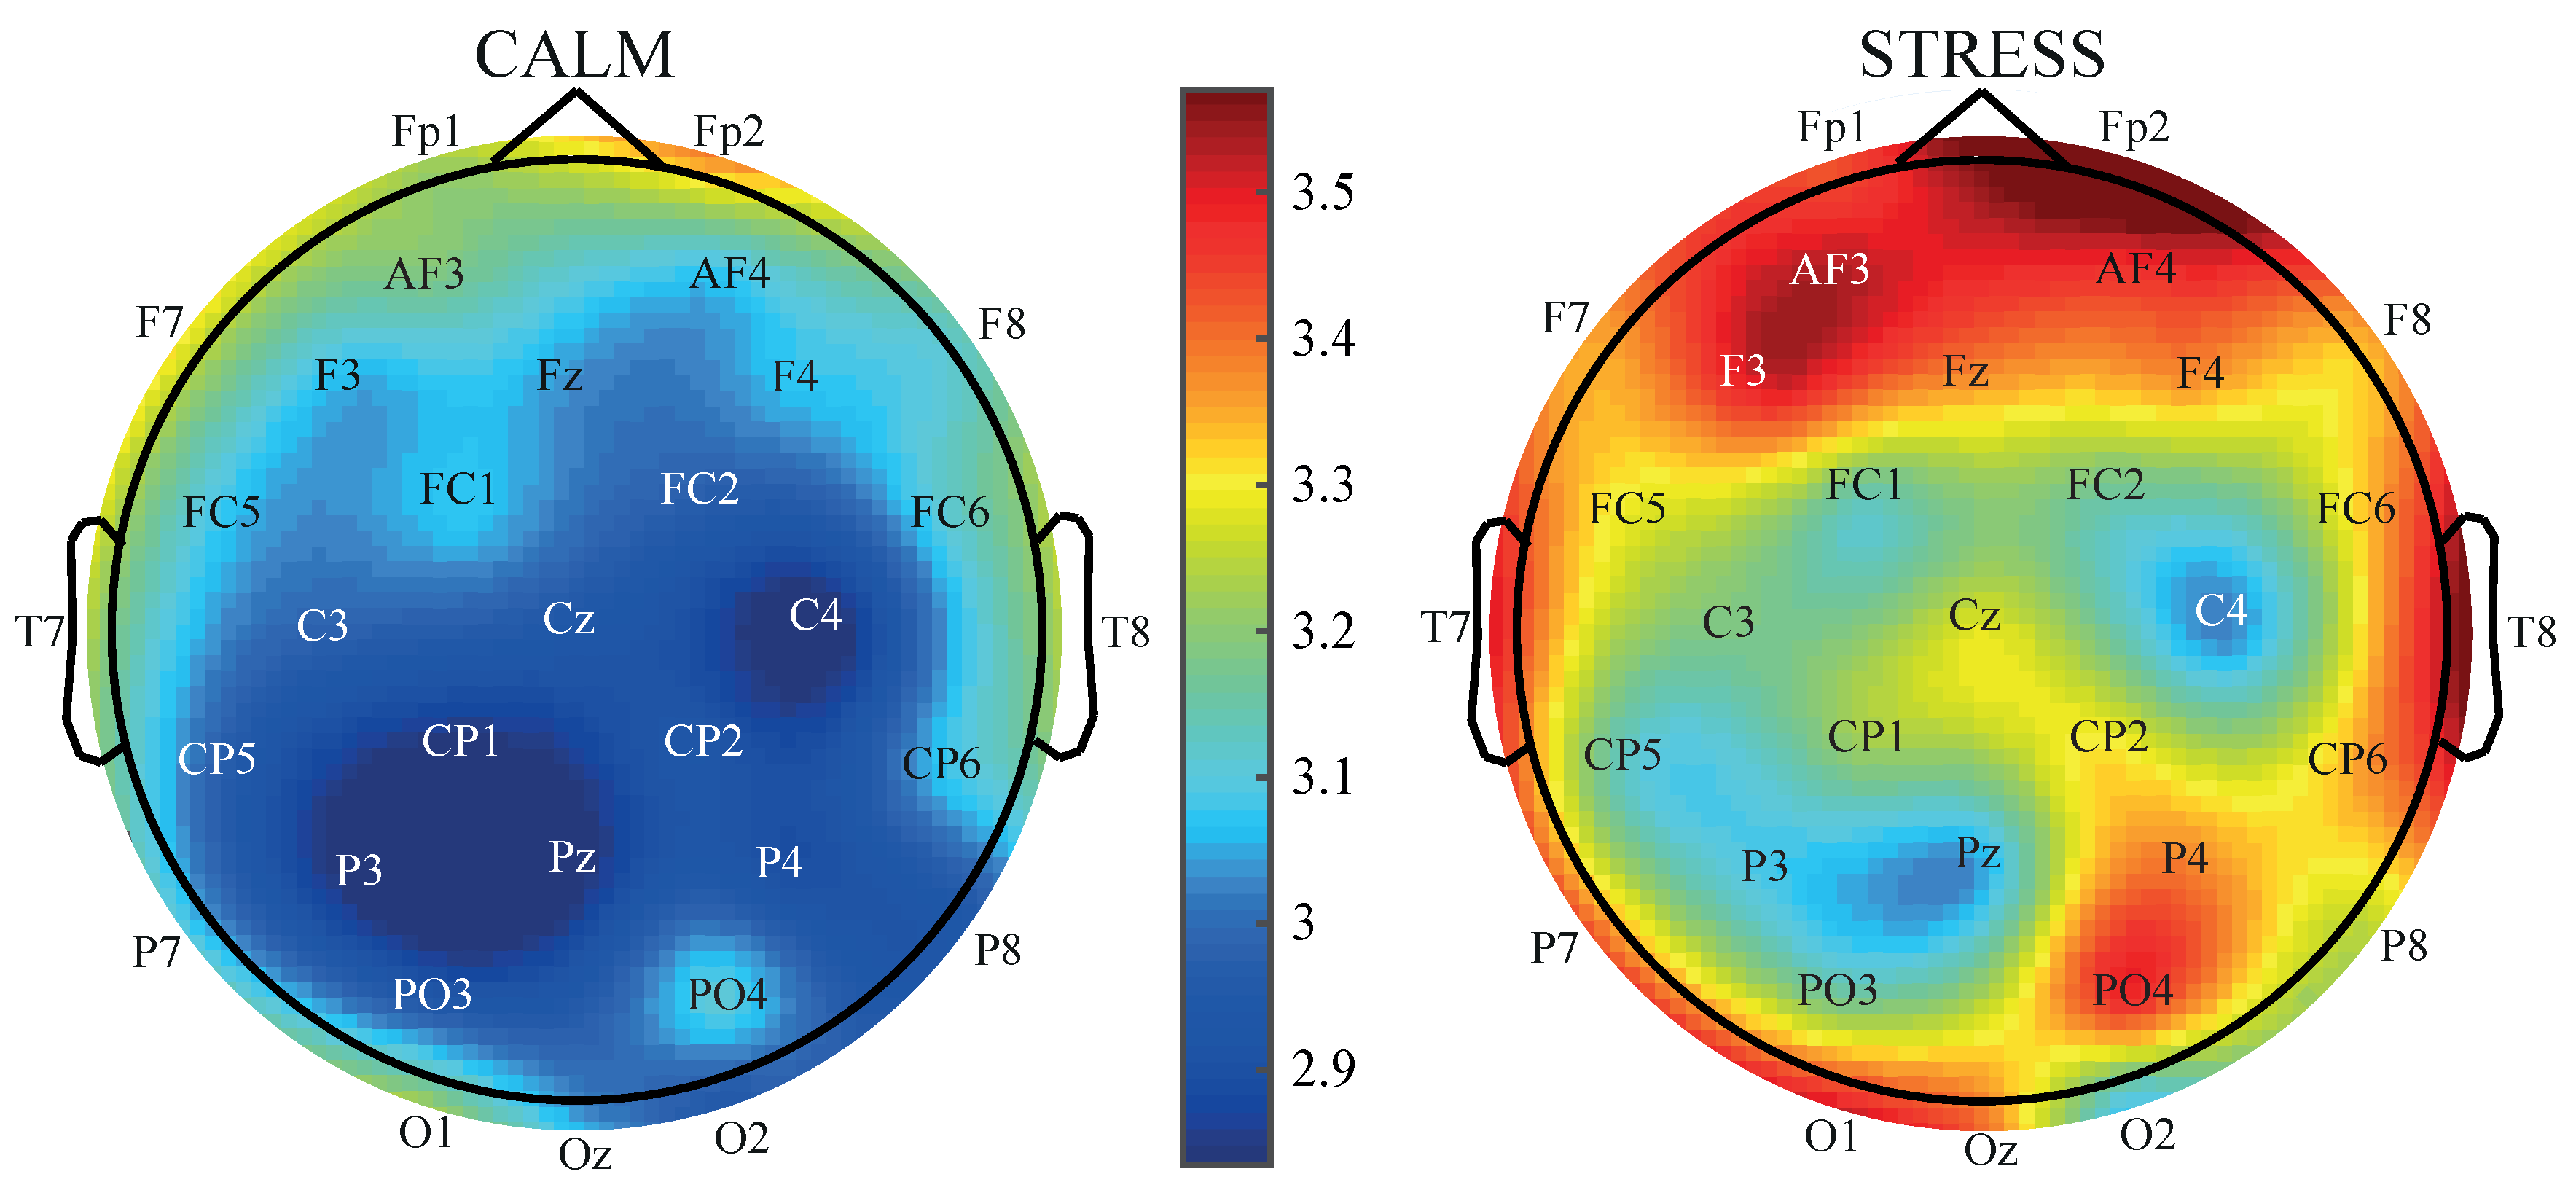
Regarding QSEn, 27 out of 32 EEG channels reported values of . According to García-Martínez et al.’s work [40], the most statistically significant differences were found for the right parietal channel P4 ( = 8.87) and the left frontal channel F3 ( = 4.78). These EEG signals also yielded the best classification outcomes between emotions of calm and negative stress, thus providing values of sensitivity, specificity and accuracy of 55.32%, 81.35% and 67.24% for P4 and 57.92%, 66.71% and 62.94% for F3, respectively. Note that these results were remarkably different from those reported by PEn and AAPEn. In the same line, the mean values of QSEn also displayed a distribution on the brain completely contrary to the permutation entropies, such as Figure 3 shows. Although two different areas are still clearly identified, the previous circular zone now presents a elliptical shape because the right parietal region shows a considerably high irregular activity. More notably, QSEn values were higher in emotional state of distress than calm for every EEG channel.
The described results suggest that QSEn and the permutation entropies may contain complementary information and, thus, AAPEn and QSEn computed from all the EEG channels were introduced in a FSVS approach. Given that PEn reported a high similarity with AAPEn, presenting cross-correlation coefficients higher than 95% for every EEG signal, this index was not considered in this analysis. At the end, only two variables were identified as independent indicators of distress, i.e., AAPEn computed from the channel P3 and QSEn obtained from the recording P4. Then, their combination by means of a SVM classifier improved notably the classification results of each single index, thus reporting values of sensitivity, specificity and accuracy of 90.15%, 66.35% and 81.31%, respectively.
4. Discussion
Within nonlinear symbolic analysis, PEn is a very popular index that has been recently used to characterize the EEG recording from a broad variety of mental problems, including Alzheimer’s disease [58], Parkinson’s disease [59], epileptic seizure [60], depth of anesthesia [55], consciousness disorders [61] and obsessive compulsive disorders [62], among others. However, to the best of our knowledge, no thorough study has previously considered this entropy for automatic recognition of emotions. Hence, the present work has introduced for the first time the use of PEn to identify automatically negative stress from the EEG recording. A modification of this index to take into consideration the time series amplitude has also been studied. No great differences between both metrics have been noticed, but a more clear identification of brain areas presenting activity with different levels of predictability has been reached by AAPEn. This outcome is in line with previous works where AAPEn has resulted as more useful than PEn [46,54,55]. As a consequence, it could be pointed out that, beyond the underlying dynamics presented by the EEG, its amplitude also seems to contain interesting information for automatic recognition of distress.
Interestingly, PEn and AAPEn have also reported classification results similar to QSEn from some EEG channels. Indeed, whereas the highest accuracy provided by QSEn was about 67%, this value was around 65% for both permutation entropies. Hence, just as QSEn, these two metrics could also be considered promising indicators of negative stress from the EEG recording. Indeed, although in previous works a greater discriminant ability between emotions of calm and stress has been reported, combinations of several dozens of variables through advanced classifiers have been required [37,38,39]. Unfortunately, discriminant models resulting in this way are only able to provide a classification outcome, thus burying potential insights associated with the brain behavior under different affective states. Contrarily, the analysis of single metrics, such as QSEn or AAPEn, may result as more useful, since they can be easily interpretable from a clinical point of view.
In this last respect, the average values of AAPEn and QSEn seem to suggest a contradictory brain behavior under negative stress. Indeed, according to the distress definition entailing a concentration increase to protect organism integrity against external stimuli [28], QSEn has yielded higher entropy values from every EEG channel for distress than for calm. However, the opposite tendency has been noticed for PEn and AAPEn. It has to be remarked that these metrics are based on different approaches to compute regularity of patterns in time series. Thus, whereas PEn and AAPEn estimate repetition of ordinal patterns [45,46], QSEn computes repetition of patterns with a absolute distance lower than a threshold, which can even change notably among successive EEG segments [56]. In this way, QSEn obtains estimates of time series irregularity, but it is unable to give accurate information about the data time structure. Hence, the findings revealed by these metrics could be considered as complementary, instead of contradictory. Indeed, PEn and QSEn have previously reported complementary information in several clinical contexts, thus suggesting that these indices (and, consequently, AAPEn) should be jointly considered for a thorough analysis of complex time series [42].
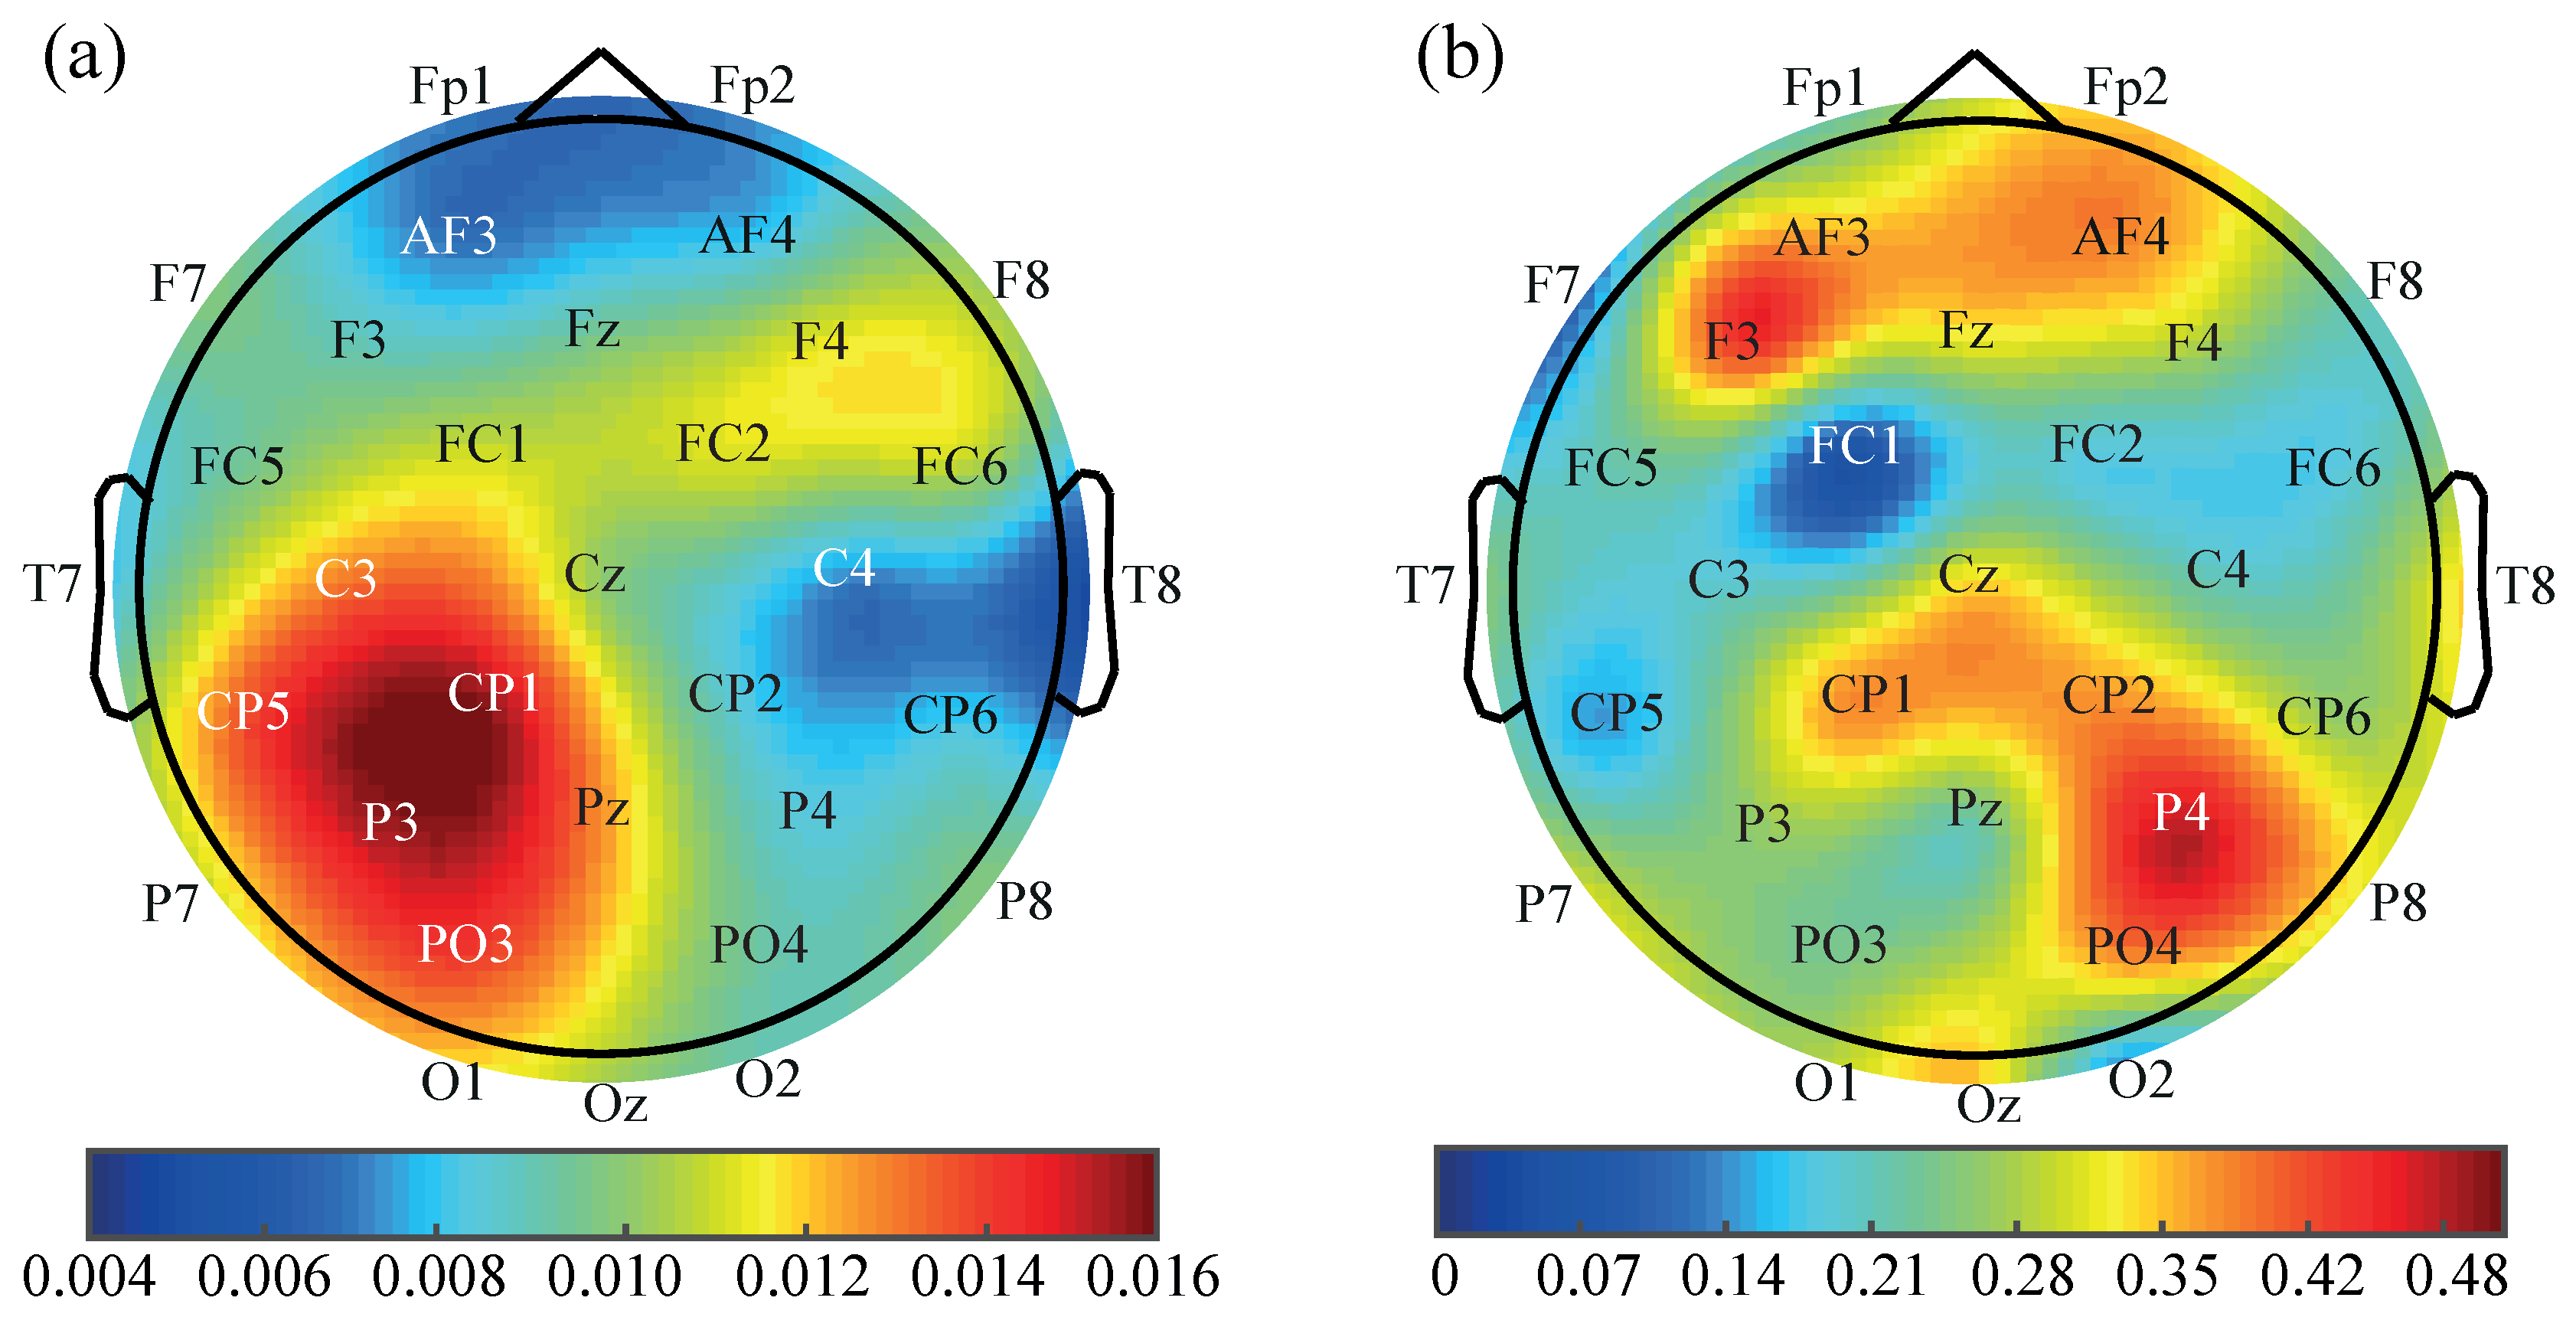
This lack of consensus about how the brain works under negative stress has also been previously highlighted in the literature. Indeed, according to AAPEn, CD has elucidated a more complex activity from most of the brain regions for calm than for distress [37,63]. Contrarily, in line with QSEn, an increased spectral power in some EEG channels has been noticed for patients suffering from stressful situations, post-traumatic stress disorders and chronic hyperarousal [64]. Other nonlinear indices, like Lyapunov exponents and SEn, have also reported a complexity reduction in many brain time series for stressed subjects undergoing relaxing treatments based on meditation, restful music or foot reflexology [65,66]. However, analyzing the spatial distribution of the differences between the average values of QSEn and AAPEn for both emotional states, displayed in Figure 4, it could be observed that both kinds of dynamics are compatible. Indeed, the greatest differences for AAPEn are seen in the left centro-parietal (channel P3) and right frontal (channels F4, FC2 and FC6) regions, and, for QSEn, they are observed in the right parietal (channel P4) and left frontal (channel F3) areas. Interestingly, these zones are completely symmetrical for each hemisphere and, therefore, complementary.
Somehow, these findings may point towards a synchronized conduct for opposite frontal and parietal areas from each hemisphere under negative stress. Thus, an increase of distress seems to cause a more irregular activity in the left frontal and right parietal regions and, simultaneously, more predictable dynamics in their counterparts. These two observations have been previously reported in isolation. In this respect, whereas stressful experiences and anxiety have proven to increase complexity in the dynamics observed from the right parietal lobe, relaxing stimulation has shown the opposite effect [67]. On the other hand, a higher activation has been observed during normal non-depressed and reasonably positive moods in the left hemisphere than in the right one [67,68]. In the same line, meditation has also been characterized by increasing activity of the left parietal region compared with its right counterpart [69]. More interestingly, other works have also reported a synchronized relationship between the frontal and parietal brain areas under stimulation of distress or calm. In fact, Davidson verified some years ago that a relative left frontal activation is balanced by a relative right parietal activation and vice versa [68]. A similar cross relation has also been observed in other studies where patients with different mental disorders are conducted to practice meditation [70]. Finally, the existence of anatomical cortico-cortical connections between frontal and parietal lobes was also proposed many years ago [71].
Another sign of complementarity among the brain dynamics quantified by AAPEn and QSEn is that both indices have been selected as independent indicators of distress by an FSVS approach. Precisely, these metrics computed from the channels P3 (left parietal area) and P4 (right parietal region), respectively, have provided the best single classification results. Nonetheless, their combination by an SVM classifier has improved their single diagnostic accuracy by a 15%. Thus, while AAPEn and QSEn have presented a single discriminant ability around 65–67%, the SVM-based discriminant model has reported an accuracy higher than 80%. Additionally, compared with other works also dealing with automatic identification of distress from the EEG [37,38,39], this classification result could be considered as similar or slightly higher, such as Table 2 shows. Indeed, the blend of only irregularity information from the right parietal (channel P4) and left occipital (channel O1) brain areas, introduced recently by García-Martínez et al. [40], has only reported a diagnostic accuracy about 75%. Similarly, the combination of linear features from the EEG spectral analysis has also been unable to provide a discriminant ability greater than 70% [39].
Moreover, it is interesting to note that the proposed SVM-based discriminant model also presents the additional advantage of only using two EEG electrodes (located at the left and right parietal brain regions). This characteristic could make its integration in clinical and psychological trials very easy and, thus, the proposed system may be conveniently used for continuous monitoring of subjects with mental and affective problems. This kind of follow-up may be very useful to gain information about how the brain works under different controlled stressful environments, as well as to provide the best-tailored actions for the regulation of this emotion towards a positive mood, when possible [36].
Finally, some limitations merit consideration. On the one hand, the studied DEAP dataset was not tailor-made for recognition of negative stress. Indeed, it contains samples different from emotional states of calm and distress [47]. Additionally, a variety of alternatives for arousal of emotions can be found in the literature and no consensus exists about which the best option is [20]. Although audiovisual stimulation has been widely used in previous experiments, too long music videos with a duration of 1 min in length were considered here. Thus, the likelihood of elicitation of subsequent emotions could be rated as high [47]. Despite these limitations, note that unbiased results are obtained with this dataset, which can moreover be honestly compared with other previous or future works making use of the same EEG recordings. On the other hand, only brain dynamics have been characterized in the present study, thus discarding information from other physiological recordings. Since the DEAP database also contains additional peripheral recordings to the EEG, some of them will be considered in the future to assess the relationship between the brain and other physiological signals under distress. Nonetheless, since most physiological signals are non-stationary, advanced nonlinear tools will be used for exploring fractal, multiscale, multivariate and causal information [72,73,74]. Although PEn and AAPEn take into consideration causal information within each ordinal pattern, causality among patterns is dismissed. Thus, specific indices to estimate time series causality, such as transfer entropy or Granger index, will be considered to improve current automatic identification of distress.
5. Conclusions
Two permutation entropies have been analyzed for the first time with the aim of complementing the promising analysis of brain dynamics with QSEn for automatic recognition of negative stress. Interestingly, they have proven a similar ability to QSEn for discerning between emotional states of calm and distress, moreover quantifying successfully some additional unrevealed brain dynamics. More precisely, the obtained results suggest a synchronized conduct between cross parietal and frontal areas from both hemispheres of the brain. Thus, according to previous neurophysiological studies, heightened stress levels seem to cause activation of the left frontal and right parietal areas and, simultaneously, relaxing of their counterparts. Considering this brain behavior, an SVM-based discriminant model combining only two variables has also shown a higher diagnostic accuracy than other algorithms previously proposed to identify distress. Moreover, compared with these previous methods, which typically require a wide variety of features, the proposed discriminant model may be conveniently used for continuous monitoring of distress in controlled environments, thus making its regulation towards a more positive affective state possible. Nonetheless, further studies with wider datasets, where emotions were elicited by a variety of different ways, are required in the future to corroborate and improve the presented results.
Acknowledgments
This work was supported by the Spanish Ministerio de Economía y Competitividad/European Regional Development Fund under TIN2015–72931–EXP, TIN2016-79100-R, and DPI2016–80894–R grants.
Author Contributions
Beatriz García-Martínez and Arturo Martínez-Rodrigo conceived and designed the study, programmed the experiments and drafted the manuscript. Roberto Zangróniz and Jose Manuel Pastor helped to interpret the results and reviewed the manuscript. Finally, Raúl Alcaraz supervised the experiments, reviewed the manuscript and contributed to the final version. All authors have read and approved the final version of the manuscript.
Conflicts of Interest
The authors declare no conflict of interest.
References
- Sanei, S. Adaptive Processing of Brain Signals; Wiley: Hoboken, NJ, USA, 2013. [Google Scholar]
- Micoulaud-Franchi, J.A.; McGonigal, A.; Lopez, R.; Daudet, C.; Kotwas, I.; Bartolomei, F. Electroencephalographic neurofeedback: Level of evidence in mental and brain disorders and suggestions for good clinical practice. Neurophysiol. Clin. 2015, 45, 423–433. [Google Scholar] [CrossRef] [PubMed]
- Takahashi, T. Complexity of spontaneous brain activity in mental disorders. Prog. Neuropsychopharmacol. Biol. Psychiatry 2013, 45, 258–266. [Google Scholar] [CrossRef] [PubMed]
- Jadhav, N.; Manthalkar, R.; Joshi, Y. Effect of meditation on emotional response: An EEG-based study. Biomed. Signal Process. Control 2017, 34, 101–113. [Google Scholar] [CrossRef]
- Wang, R.; Wang, J.; Yu, H.; Wei, X.; Yang, C.; Deng, B. Power spectral density and coherence analysis of Alzheimerś EEG. Cogn. Neurodyn. 2015, 9, 291–304. [Google Scholar] [CrossRef] [PubMed]
- Chai, R.; Tran, Y.; Naik, G.R.; Nguyen, T.N.; Ling, S.H.; Craig, A.; Nguyen, H.T. Classification of EEG based-mental fatigue using principal component analysis and Bayesian neural network. In Proceedings of the 2016 IEEE 38th Annual International Conference of the Engineering in Medicine and Biology Society (EMBC), Orlando, FL, USA, 16–20 August 2016; pp. 4654–4657. [Google Scholar]
- Chai, R.; Ling, S.H.; San, P.P.; Naik, G.R.; Nguyen, T.N.; Tran, Y.; Craig, A.; Nguyen, H.T. Improving EEG-Based Driver Fatigue Classification Using Sparse-Deep Belief Networks. Front. Neurosci. 2017, 11, 103. [Google Scholar] [CrossRef] [PubMed]
- Zhang, Y.; Liu, B.; Ji, X.; Huang, D. Classification of EEG signals based on autoregressive model and Wavelet packet decomposition. Neural Proc. Lett. 2017, 45, 365–378. [Google Scholar] [CrossRef]
- Vavadi, H.; Ayatollahi, A.; Mirzaei, A. A wavelet-approximate entropy method for epileptic activity detection from EEG and its sub-bands. J. Biomed. Sci. Eng. 2010, 3, 1182. [Google Scholar] [CrossRef]
- Simons, S.; Abasolo, D.; Hughes, M. Investigation of Alzheimer’s Disease EEG Frequency Components with Lempel-Ziv Complexity. In Proceedings of the 6th European Conference of the International Federation for Medical and Biological Engineering, Dubrovnik, Croatia, 7–11 September 2014; Springer: Berlin, Germany, 2015; pp. 46–49. [Google Scholar]
- Akar, S.A.; Kara, S.; Agambayev, S.; Bilgic, V. Nonlinear analysis of EEG in major depression with fractal dimensions. In Proceedings of the 37th Annual International Conference of the IEEE Engineering in Medicine and Biology Society (EMBC), Milano, Italy, 25–29 August 2015; pp. 7410–7413. [Google Scholar]
- Kalev, K.; Bachmann, M.; Orgo, L.; Lass, J.; Hinrikus, H. Lempel-Ziv and multiscale Lempel-Ziv complexity in depression. In Proceedings of the 37th Annual International Conference of the IEEE Engineering in Medicine and Biology Society (EMBC), Milano, Italy, 25–29 August 2015; pp. 4158–4161. [Google Scholar]
- Micheloyannis, S.; Pachou, E.; Stam, C.J.; Breakspear, M.; Bitsios, P.; Vourkas, M.; Erimaki, S.; Zervakis, M. Small-world networks and disturbed functional connectivity in schizophrenia. Schizophr. Res. 2006, 87, 60–66. [Google Scholar] [CrossRef]
- Padma Shri, T.; Sriraam, N.; Bhat, V. Characterization of EEG signals for identification of alcoholics using ANOVA ranked approximate entropy and classifiers. In Proceedings of the 2014 International Conference on Circuits, Communication, Control and Computing (I4C), Bengaluru, India, 21–22 November 2014; pp. 109–112. [Google Scholar]
- Andrzejak, R.G.; Lehnertz, K.; Mormann, F.; Rieke, C.; David, P.; Elger, C.E. Indications of nonlinear deterministic and finite-dimensional structures in time series of brain electrical activity: Dependence on recording region and brain state. Phys. Rev. E 2001, 64, 061907. [Google Scholar] [CrossRef]
- Cao, Y.; Cai, L.; Wang, J.; Wang, R.; Yu, H.; Cao, Y.; Liu, J. Characterization of complexity in the electroencephalograph activity of Alzheimer’s disease based on fuzzy entropy. Chaos 2015, 25, 083116. [Google Scholar] [CrossRef] [PubMed]
- Stam, C.J. Nonlinear dynamical analysis of EEG and MEG: Review of an emerging field. Clin. Neurophysiol. 2005, 116, 2266–2301. [Google Scholar] [CrossRef] [PubMed]
- Jenke, R.; Peer, A.; Buss, M. Feature Extraction and Selection for Emotion Recognition from EEG. IEEE Trans. Affect. Comput. 2014, 5, 327–339. [Google Scholar] [CrossRef]
- Calvo, R.A.; D’Mello, S.K. Affect Detection: An Interdisciplinary Review of Models, Methods, and Their Applications. IEEE Trans. Affect. Comput. 2010, 1, 18–37. [Google Scholar] [CrossRef]
- Valenza, G.; Lanata, A.; Scilingo, E.P. The Role of Nonlinear Dynamics in Affective Valence and Arousal Recognition. IEEE Trans. Affect. Comput. 2012, 3, 237–249. [Google Scholar] [CrossRef]
- Yin, Z.; Zhao, M.; Wang, Y.; Yang, J.; Zhang, J. Recognition of emotions using multimodal physiological signals and an ensemble deep learning model. Comput. Methods Progr. Biomed. 2017, 140, 93–110. [Google Scholar] [CrossRef] [PubMed]
- Yin, Z.; Zhang, J. Operator functional state classification using least-square support vector machine based recursive feature elimination technique. Comput. Methods Progr. Biomed. 2014, 113, 101–115. [Google Scholar] [CrossRef] [PubMed]
- Coan, J.A.; Allen, J.J.B. Handbook of Emotion Elicitation and Assessment; Oxford University Press: Oxford, UK, 2007. [Google Scholar]
- Gomes, M.; Oliveira, T.; Silva, F.; Carneiro, D.; Novais, P. Establishing the relationship between personality traits and stress in an intelligent environment. In Proceedings of the International Conference on Industrial, Engineering and Other Applications of Applied Intelligent Systems, Kaohsiung, Taiwan, 3–6 June 2014; pp. 378–387. [Google Scholar]
- Ekman, P. An argument for basic emotions. Cogn. Emot. 1992, 6, 169–200. [Google Scholar] [CrossRef]
- Russell, J.A. A circumplex model of affect. J. Pers. Soc. Psychol. 1980, 39, 1161–1178. [Google Scholar] [CrossRef]
- Alberdi, A.; Aztiria, A.; Basarab, A. Towards an automatic early stress recognition system for office environments based on multimodal measurements: A review. J. Biomed. Inform. 2016, 59, 49–75. [Google Scholar] [CrossRef] [PubMed]
- Bong, S.Z.; Murugappan, M.; Yaacob, S. Methods and approaches on inferring human emotional stress changes through physiological signals: A review. IJMEI 2013, 5, 152–162. [Google Scholar] [CrossRef]
- Minguillon, J.; Lopez-Gordo, M.A.; Pelayo, F. Stress Assessment by Prefrontal Relative Gamma. Front. Comput. Neurosci. 2016, 10, 1–9. [Google Scholar] [CrossRef]
- What Is Stress? American Institute of Stress. Available online: http://www.stress.org (accessed on 15 February 2017).
- Pickering, T.G. Mental stress as a causal factor in the development of hypertension and cardiovascular disease. Curr. Hypertens. Rep. 2001, 3, 249–254. [Google Scholar] [CrossRef] [PubMed]
- Mönnikes, H.; Tebbe, J.J.; Hildebrandt, M.; Arck, P.; Osmanoglou, E.; Rose, M.; Klapp, B.; Wiedenmann, B.; Heymann-Mönnikes, I. Role of stress in functional gastrointestinal disorders. Evidence for stress-induced alterations in gastrointestinal motility and sensitivity. Dig. Dis. 2001, 19, 201–211. [Google Scholar] [CrossRef] [PubMed]
- Brzozowski, B.; Mazur-Bialy, A.; Pajdo, R.; Kwiecien, S.; Bilski, J.; Zwolinska-Wcislo, M.; Mach, T.; Brzozowski, T. Mechanisms by which Stress Affects the Experimental and Clinical Inflammatory Bowel Disease (IBD). Role of Brain-Gut Axis. Curr. Neuropharmacol. 2016, 14, 892–900. [Google Scholar] [CrossRef]
- Bender, R.E.; Alloy, L.B. Life stress and kindling in bipolar disorder: Review of the evidence and integration with emerging biopsychosocial theories. Clin. Psychol. Rev. 2011, 31, 383–398. [Google Scholar] [CrossRef] [PubMed]
- Healey, J.; Picard, R.W. Detecting stress during real-world driving tasks using physiological sensors. IEEE Trans. Intell. Transp. Syst. 2005, 6, 156–166. [Google Scholar] [CrossRef]
- Fernández-Caballero, A.; Martínez-Rodrigo, A.; Pastor, J.M.; Castillo, J.C.; Lozano-Monasor, E.; López, M.T.; Zangróniz, R.; Latorre, J.M.; Fernández-Sotos, A. Smart environment architecture for emotion detection and regulation. J. Biomed. Inform. 2016, 64, 55–73. [Google Scholar] [CrossRef] [PubMed]
- Hosseini, S.A.; Khalilzadeh, M.A.; Changiz, S. Emotional stress recognition system for affective computing based on bio-signals. J. Biol. Syst. 2010, 18, 101–114. [Google Scholar] [CrossRef]
- Khosrowabadi, R.; Quek, C.; Ang, K.K.; Tung, S.W.; Heijnen, M. A Brain-Computer Interface for classifying EEG correlates of chronic mental stress. In Proceedings of the 2011 International Joint Conference on Neural Networks (IJCNN), San Jose, CA, USA, 31 July–5 August 2011; pp. 757–762. [Google Scholar]
- Bastos Filho, T.F.; Ferreira, A.; Atencio, A.C.; Arjunan, S.P.; Kumar, D. Evaluation of feature extraction techniques in emotional state recognition. In Proceedings of the 4th International Conference on Intelligent Human Computer Interaction (IHCI), Kharagpur, India, 27–29 December 2012; pp. 1–6. [Google Scholar]
- García-Martínez, B.; Martínez-Rodrigo, A.; Cantabrana, R.Z.; García, J.M.P.; Martínez, R.A. Application of Entropy-Based Metrics to Identify Emotional Distress from Electroencephalographic Recordings. Entropy 2016, 18, 221. [Google Scholar] [CrossRef]
- Lake, D.E.; Moorman, J.R. Accurate estimation of entropy in very short physiological time series: The problem of atrial fibrillation detection in implanted ventricular devices. Am. J. Physiol. Heart Circ. Physiol. 2011, 300, H319–H325. [Google Scholar] [CrossRef] [PubMed]
- Keller, K.; Unakafov, A.; Unakafova, V. Ordinal patterns, entropy, and EEG. Entropy 2014, 16, 6212–6239. [Google Scholar] [CrossRef]
- Zanin, M.; Zunino, L.; Rosso, O.; Papo, D. Permutation entropy and its main biomedical and econophysics applications: A review. Entropy 2012, 14, 1553–1577. [Google Scholar] [CrossRef]
- Amigó, J.M.; Keller, K.; Unakafova, V.A. Ordinal symbolic analysis and its application to biomedical recordings. Philos. Trans. R. Soc. Lond. A Math. Phys. Eng. Sci. 2015, 373, 20140091. [Google Scholar] [CrossRef] [PubMed]
- Bandt, C.; Pompe, B. Permutation entropy: a natural complexity measure for time series. Phys. Rev. Lett. 2002, 88, 174102. [Google Scholar] [CrossRef] [PubMed]
- Azami, H.; Escudero, J. Amplitude-aware permutation entropy: Illustration in spike detection and signal segmentation. Comput. Methods Progr. Biomed. 2016, 128, 40–51. [Google Scholar] [CrossRef] [PubMed]
- Koelstra, S.; Mühl, C.; Soleymani, M.; Lee, J.; Yazdani, A.; Ebrahimi, T.; Pun, T.; Nijholt, A.; Patras, I. DEAP: A Database for Emotion Analysis using Physiological Signals. IEEE Trans. Affect. Comput. 2012, 3, 18–31. [Google Scholar] [CrossRef]
- Morris, J.D. Observations SAM: The Self-Assessment Manikin—An efficient cross-cultural measurement of emotional response. J. Advert. Res. 1995, 35, 63–68. [Google Scholar]
- Pomer-Escher, A.G.; de Souza, M.D.P.; Filho, T.F.B. Methology for analysis of stress level based on asymmetry patterns of alpha rhythms in EEG signals. In Proceedings of the 5th ISSNIP-IEEE Biosignals and Biorobotics Conference: Biosignals and Robotics for Better and Safer Living (BRC), Salvador, Brazil, 26–28 May 2014; pp. 1–5. [Google Scholar]
- Klem, G.H.; Lüders, H.O.; Jasper, H.; Elger, C. The ten-twenty electrode system of the International Federation. Electroencephalogr. Clin. Neurophysiol. 1999, 52, 3–6. [Google Scholar]
- Jadhav, P.; Shanamugan, D.; Chourasia, A.; Ghole, A.; Acharyya, A.; Naik, G. Automated detection and correction of eye blink and muscular artefacts in EEG signal for analysis of Autism Spectrum Disorder. In Proceedings of the 2014 36th Annual International Conference of the IEEE Engineering in Medicine and Biology Society (EMBC), Chicago, IL, USA, 26–30 August 2014; pp. 1881–1884. [Google Scholar]
- Bhardwaj, S.; Jadhav, P.; Adapa, B.; Acharyya, A.; Naik, G.R. Online and automated reliable system design to remove blink and muscle artefact in EEG. In Proceedings of the 2015 37th Annual International Conference of the IEEE Engineering in Medicine and Biology Society (EMBC), Milano, Italy, 25–29 August 2015; pp. 6784–6787. [Google Scholar]
- Reis, P.M.R.; Hebenstreit, F.; Gabsteiger, F.; von Tscharner, V.; Lochmann, M. Methodological aspects of EEG and body dynamics measurements during motion. Front. Hum. Neurosci. 2014, 8, 156. [Google Scholar] [CrossRef] [PubMed]
- Fadlallah, B.; Chen, B.; Keil, A.; Príncipe, J. Weighted-permutation entropy: a complexity measure for time series incorporating amplitude information. Phys. Rev. E 2013, 87, 022911. [Google Scholar] [CrossRef] [PubMed]
- Liu, X.; Jiang, A.; Xu, N.; Xue, J. Increment entropy as a measure of complexity for time series. Entropy 2016, 18, 22. [Google Scholar] [CrossRef]
- Richman, J.S.; Moorman, J.R. Physiological time-series analysis using approximate entropy and sample entropy. Am. J. Physiol. Heart Circ. Physiol. 2000, 278, H2039–H2049. [Google Scholar] [PubMed]
- Jung, Y.; Jianhua, H. A K-fold averaging cross-validation procedure. J. Nonparametr. Stat. 2015, 27, 167–179. [Google Scholar] [CrossRef] [PubMed]
- Deng, B.; Liang, L.; Li, S.; Wang, R.; Yu, H.; Wang, J.; Wei, X. Complexity extraction of electroencephalograms in Alzheimer’s disease with weighted-permutation entropy. Chaos 2015, 25, 043105. [Google Scholar] [CrossRef] [PubMed]
- Yi, G.; Wang, J.; Dng, B.; Wei, X. Complexity of resting-state EEG activity in the patients with early-stage Parkinson’s disease. Cogn. Neurodyn. 2017, 11, 147–160. [Google Scholar] [CrossRef] [PubMed]
- Bruzzo, A.A.; Gesierich, B.; Santi, M.; Tassinari, C.A.; Birbaumer, N.; Rubboli, G. Permutation entropy to detect vigilance changes and preictal states from scalp EEG in epileptic patients. A preliminary study. Neurol. Sci. 2008, 29, 3–9. [Google Scholar] [CrossRef] [PubMed]
- Thul, A.; Lechinger, J.; Donis, J.; Michitsch, G.; Pichler, G.; Kochs, E.F.; Jordan, D.; Ilg, R.; Schabus, M. EEG entropy measures indicate decrease of cortical information processing in Disorders of Consciousness. Clin. Neurophysiol. 2016, 127, 1419–1427. [Google Scholar] [CrossRef] [PubMed]
- Aydin, S.; Arica, N.; Ergul, E.; Tan, O. Classification of obsessive compulsive disorder by EEG complexity and hemispheric dependency measurements. Int. J. Neural Syst. 2015, 25, 1550010. [Google Scholar] [CrossRef] [PubMed]
- Hosseini, S.A.; Khalilzadeh, M.A.; Naghibi-Sistani, M.B.; Homam, S.M. Emotional stress recognition using a new fusion link between electroencephalogram and peripheral signals. Iran. J. Neurol. 2015, 14, 142–151. [Google Scholar] [PubMed]
- Begić, D.; Hotujac, L.; Jokić-Begić, N. Electroencephalographic comparison of veterans with combat-related post-traumatic stress disorder and healthy subjects. Int. J. Psychophysiol. 2001, 40, 167–172. [Google Scholar] [CrossRef]
- Natarajan, K.; Acharya, U.R.; Alias, F.; Tiboleng, T.; Puthusserypady, S.K. Nonlinear analysis of EEG signals at different mental states. Biomed. Eng. OnLine 2004, 3, 7. [Google Scholar] [CrossRef] [PubMed]
- Gao, J.; Fan, J.; Wu, B.W.Y.; Zhang, Z.; Chang, C.; Hung, Y.S.; Fung, P.C.W.; Sik, H.H. Entrainment of chaotic activities in brain and heart during MBSR mindfulness training. Neurosci. Lett. 2016, 616, 218–223. [Google Scholar] [CrossRef] [PubMed]
- Heller, W.; Nitschke, J.B. The Puzzle of regional brain activity in and anxiety: The importance of subtypes and comorbidity. Cogn. Emot. 1998, 12, 421–447. [Google Scholar]
- Davidson, R.J. Affect, cognition, and hemispheric specialization. In Emotions, Cognition, and Behavior; Cambridge University Press: Cambridge, UK, 1984; p. 320. [Google Scholar]
- Manna, A.; Raffone, A.; Perrucci, M.G.; Nardo, D.; Ferretti, A.; Tartaro, A.; Londei, A.; Del Gratta, C.; Belardinelli, M.O.; Romani, G.L. Neural correlates of focused attention and cognitive monitoring in meditation. Brain Res. Bull. 2010, 82, 46–56. [Google Scholar] [CrossRef] [PubMed]
- Rubia, K. The neurobiology of Meditation and its clinical effectiveness in psychiatric disorders. Biol. Psychol. 2009, 82, 1–11. [Google Scholar] [CrossRef] [PubMed]
- Nauta, W.J. Neural associations of the frontal cortex. Acta Neurobiol. Exp. 1972, 32, 125–140. [Google Scholar]
- Amigó, J.; Zambrano, S.; Sanjuán, M. Permutation complexity of spatiotemporal dynamics. EPL (Europhys. Lett.) 2010, 90, 10007. [Google Scholar] [CrossRef]
- Morabito, F.C.; Labate, D.; La Foresta, F.; Bramanti, A.; Morabito, G.; Palamara, I. Multivariate multi-scale permutation entropy for complexity analysis of Alzheimer’s disease EEG. Entropy 2012, 14, 1186–1202. [Google Scholar] [CrossRef]
- Papana, A.; Kyrtsou, C.; Kugiumtzis, D.; Diks, C. Simulation study of direct causality measures in multivariate time series. Entropy 2013, 15, 2635–2661. [Google Scholar] [CrossRef]
Figure 1.
Distribution of entropy values obtained with different values of m for (a) PEn and (b) AAPEn from emotional states of calm (white box) and negative stress (shadow box). Statistically significant differences between groups are marked with *.
Figure 1.
Distribution of entropy values obtained with different values of m for (a) PEn and (b) AAPEn from emotional states of calm (white box) and negative stress (shadow box). Statistically significant differences between groups are marked with *.

Figure 2.
Visual representation on the brain of the average values of (a) PEn and (b) AAPEn for emotional states of calm and distress.
Figure 2.
Visual representation on the brain of the average values of (a) PEn and (b) AAPEn for emotional states of calm and distress.
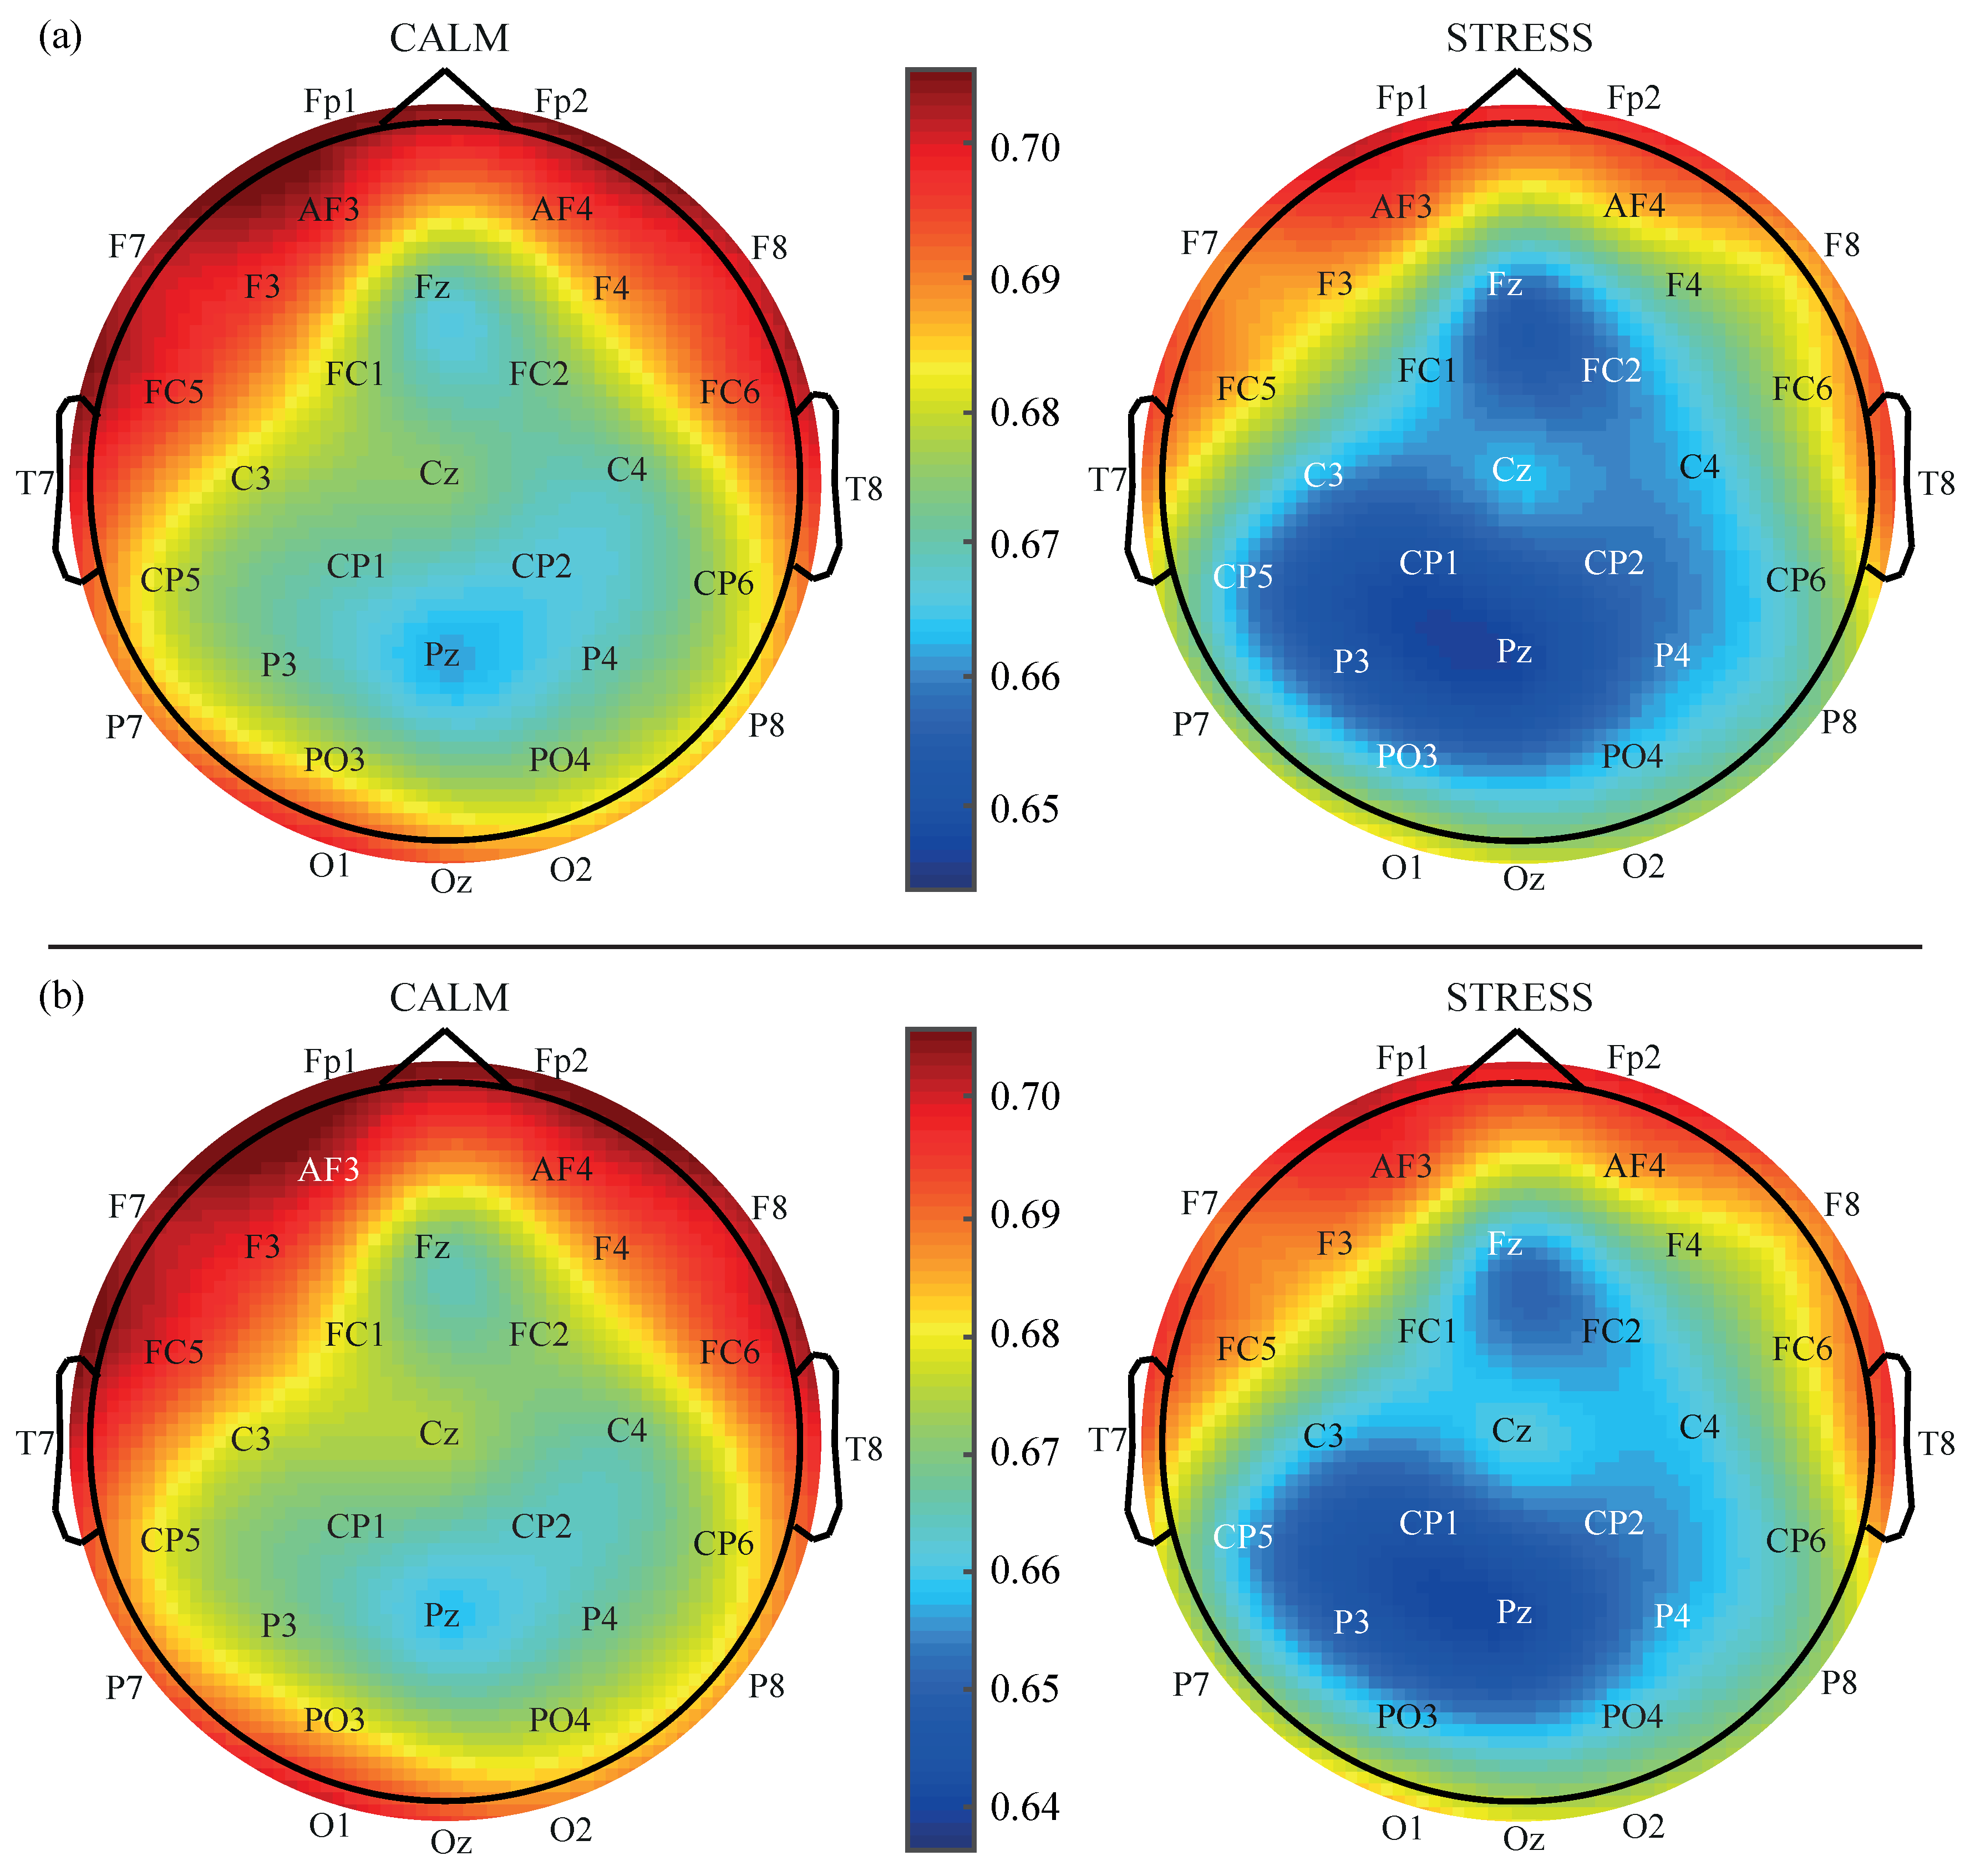
Figure 3.
Visual representation on the brain of the average QSEn values for emotional states of calm (left panel) and distress (right panel).
Figure 3.
Visual representation on the brain of the average QSEn values for emotional states of calm (left panel) and distress (right panel).

Figure 4.
Visual representation on the brain of the differences between the average values of (a) AAPEn and (b) QSEn computed for calm and negatively stressed subjects.
Figure 4.
Visual representation on the brain of the differences between the average values of (a) AAPEn and (b) QSEn computed for calm and negatively stressed subjects.

Table 1.
Outcomes of , sensitivity (Se), specificity (Sp) and accuracy (Acc) obtained from the most statistically significant EEG channels.
Table 1.
Outcomes of , sensitivity (Se), specificity (Sp) and accuracy (Acc) obtained from the most statistically significant EEG channels.
| Entropy | EEG | ROC Analysis | |||
|---|---|---|---|---|---|
| Metric | Channel | Value | Se (%) | Sp (%) | Acc (%) |
| P3 | 5.62 | 78.17 | 48.46 | 64.11 | |
| PO3 | 8.14 | 62.85 | 59.00 | 61.42 | |
| PEn | P8 | 2.16 | 65.74 | 55.79 | 61.03 |
| CP5 | 5.95 | 66.47 | 53.32 | 60.28 | |
| FC1 | 1.85 | 67.23 | 52.55 | 60.19 | |
| P3 | 2.71 | 78.83 | 50.05 | 65.39 | |
| FC2 | 1.34 | 73.74 | 48.42 | 61.89 | |
| F8 | 1.85 | 71.54 | 50.83 | 61.81 | |
| AAPEn | PO3 | 6.53 | 58.42 | 64.87 | 61.43 |
| CP5 | 5.31 | 70.13 | 50.86 | 61.07 | |
| P8 | 2.07 | 65.77 | 56.64 | 60.92 | |
| FC1 | 1.64 | 70.12 | 50.01 | 60.64 | |
Table 2.
Comparison of the most relevant works dealing with automatic identification of negative stress from the EEG recording.
Table 2.
Comparison of the most relevant works dealing with automatic identification of negative stress from the EEG recording.
| Work | Experiment | Features | Classifier | Accuracy |
|---|---|---|---|---|
| Bastos-Filho et al. [39] (2012) | 32 subjects | Statistical features, PSD and HOC | K-nearest neighbor (K-NN) | Stat.: 66.25% |
| 4 EEG channels | PSD: 70.1% | |||
| Videoclips | HOC: 69.6% | |||
| Hosseini et al. [37] (2010) | 15 subjects | FD, CD and wavelet entropy | Linear discriminant analysis (LDA) and SVM | LDA: 80.1% SVM: 84.9% |
| 5 EEG channels | ||||
| IAPS | ||||
| García-Martínez et al. [40] (2016) | 32 subjects | SEn, QSEn and DEn | Decision tree | 75.29% |
| 32 EEG channels | ||||
| Videoclips | ||||
| This study | 32 subjects | QSEn, PEn and AAPEn | SVM | 81.31% |
| 32 EEG channels | ||||
| Videoclips |
© 2017 by the authors. Licensee MDPI, Basel, Switzerland. This article is an open access article distributed under the terms and conditions of the Creative Commons Attribution (CC BY) license (http://creativecommons.org/licenses/by/4.0/).
Share and Cite
MDPI and ACS Style
García-Martínez, B.; Martínez-Rodrigo, A.; Zangróniz, R.; Pastor, J.M.; Alcaraz, R. Symbolic Analysis of Brain Dynamics Detects Negative Stress. Entropy 2017, 19, 196. https://doi.org/10.3390/e19050196
AMA Style
García-Martínez B, Martínez-Rodrigo A, Zangróniz R, Pastor JM, Alcaraz R. Symbolic Analysis of Brain Dynamics Detects Negative Stress. Entropy. 2017; 19(5):196. https://doi.org/10.3390/e19050196
Chicago/Turabian StyleGarcía-Martínez, Beatriz, Arturo Martínez-Rodrigo, Roberto Zangróniz, José Manuel Pastor, and Raúl Alcaraz. 2017. "Symbolic Analysis of Brain Dynamics Detects Negative Stress" Entropy 19, no. 5: 196. https://doi.org/10.3390/e19050196
Note that from the first issue of 2016, this journal uses article numbers instead of page numbers. See further details here.