
Muscle Fatigue Analysis of the Deltoid during Three Head-Related Static Isometric Contraction Tasks


Department of Electronic Science and Technology, University of Science and Technology of China, Hefei 230026, China
*
Author to whom correspondence should be addressed.
Entropy 2017, 19(5), 221; https://doi.org/10.3390/e19050221
Submission received: 27 March 2017
/
Revised: 5 May 2017
/
Accepted: 9 May 2017
/
Published: 11 May 2017
(This article belongs to the Special Issue Information Theory Applied to Physiological Signals)
Abstract
:This study aimed to investigate the fatiguing characteristics of muscle-tendon units (MTUs) within skeletal muscles during static isometric contraction tasks. The deltoid was selected as the target muscle and three head-related static isometric contraction tasks were designed to activate three heads of the deltoid in different modes. Nine male subjects participated in this study. Surface electromyography (SEMG) signals were collected synchronously from the three heads of the deltoid. The performances of five SEMG parameters, including root mean square (RMS), mean power frequency (MPF), the first coefficient of autoregressive model (ARC1), sample entropy (SE) and Higuchi’s fractal dimension (HFD), in quantification of fatigue, were evaluated in terms of sensitivity to variability ratio (SVR) and consistency firstly. Then, the HFD parameter was selected as the fatigue index for further muscle fatigue analysis. The experimental results demonstrated that the three deltoid heads presented different activation modes during three head-related fatiguing contractions. The fatiguing characteristics of the three heads were found to be task-dependent, and the heads kept in a relatively high activation level were more prone to fatigue. In addition, the differences in fatiguing rate between heads increased with the increase in load. The findings of this study can be helpful in better understanding the underlying neuromuscular control strategies of the central nervous system (CNS). Based on the results of this study, the CNS was thought to control the contraction of the deltoid by taking the three heads as functional units, but a certain synergy among heads might also exist to accomplish a contraction task.
1. Introduction
Muscle fatigue can be defined as a lack of ability to temporarily maintain a required or expected force [1,2,3]. The mechanism of muscle fatigue generation is very complex as it relates to various factors, such as the metabolites, muscle structures and the nervous system. Because muscle fatigue can effectively reflect functional muscle changes, it has been widely explored in the fields of rehabilitation medicine, kinesiology and biomechanics [4,5]. In the fields of rehabilitation medicine, muscle fatigue can reflect changes of muscle attributes and functions caused by neuromuscular system diseases so that it can be used as a disease diagnosis tool. For instance, Eken et al. found significant differences in muscle fatigue among children with cerebral palsy, developing children and young healthy adults [6]. Villafañe et al. applied muscle fatigue to examine the validity and applicability of rehabilitation exercises in patients with chronic non-specific low back pain [7]. In the fields of kinesiology or biomechanics, muscle fatigue is regarded as a dominant factor affecting kinematic and mechanical parameters [4,8]. For example, Becker et al. studied the changes of kinematic and kinetic parameters caused by core muscle fatigue in header [9]. Corben et al. studied the muscle fatigue during fast-pitch softball performance [10].
In the human anatomy, some skeletal muscles are composed of smaller structures called muscle-tendon units (MTUs) or heads. For example, the biceps brachii, the deltoid and the extensor digitorum communis have two, three and four MTUs, respectively [11,12,13]. Some researchers believe that the central nervous system (CNS) controls motion tasks with different strategies for different MTUs, rather than taking the muscle as a single unit [13,14]. Early studies about muscle fatigue just considered muscles as single units and overlooked the dissimilarities among different regions of some skeletal muscles. In recent studies, researchers started to notice that there existed region-specific manifestations of fatigue within some skeletal muscles, which partly proved that muscles did not work as a single unit. In 2011, Gallina et al. used a matrix of electrodes to measure surface electromyography (SEMG) signals from the medial gastrocnemius muscle under the intermittent plantar flection fatigue protocol. They selected root mean square (RMS) and mean power frequency (MPF) as indexes for the quantification of muscle fatigue, and found that SEMG manifestation of fatigue was distributed locally within the human medial gastrocnemius muscle [15]. Similarly, Watanabe et al. conducted a study to detect region-specific manifestations of muscle fatigue within the rectus femoris muscle based on a multi-channel SEMG grid in 2013. In their study, two motion tasks including isometric knee extension and hip flexion were designed to induce muscle fatigue of the rectus femoris muscle, RMS and MPF were chosen as indexes, and the manifestation of fatigue within the rectus femoris muscle was found to be region-specific [16]. Watanabe et al. believed that the differences between the motor nerve branch components and originations within the rectus femoris muscle, were the factors resulting in the region-specific manifestation of fatiguing characteristics. Furthermore, in a study which used SEMG to investigate the fatiguing characteristics of the triceps brachii, the three heads of the triceps brachii also showed different fatiguing characteristics during a controlled forceful hand grip task with full elbow extension [17]. To some extent, the research results related to the region-specific manifestation of fatigue within some skeletal muscles all verified the assumption that the CNS controls a motion task with different strategies for different MTUs. However, all these works just found region-specific manifestation of fatigue within muscles during a targeted motion task whereas they did not explore the fatiguing differences among the MTUs.
SEMG is the interferential tissue-filtered summation of all motor unit action potentials (MUAP, the combination of muscle fiber action potentials generated by one motor unit). Therefore, SEMG could be used to detect muscle force, neuromuscular diseases and muscle fatigue [18]. Specifically, SEMG could reflect the changes of recruitment strategies of MUs and the biochemical environment in muscle fibers due to muscle fatigue [3,19]. Various SEMG parameters such as RMS, MPF and the first coefficients of autoregressive models (ARC1) were proved effective in muscle fatigue analyses [2,20]. However, the effectiveness in quantification of muscle fatigue is different in these SEMG parameters, since various factors such as muscle force, would affect SEMG signals [21]. For instance, Kim et al. investigated the performance of ARC1 in depicting trunk muscle fatigue under 15%, 30%, 45%, 60% and 75% of the maximal voluntary contraction (MVC) force levels. Other four parameters including RMS, zero crossing rate (ZCR), MPF and MDF were compared with ARC1 in terms of sensitivity and reliability. Their research results revealed that the activation levels of muscle had impact on the performance of SEMG features in depicting muscle fatigue. ARC1 was found to be the most sensitive parameter at 15–45% MVC and ZCR was found to be the most sensitive parameter at 60–75% MVC [20]. Because different MTUs may be at different activation levels in a given task, the robustness and effectiveness of SEMG parameters for individual MTU fatigue analysis should be ensured in relevant studies.
In order to further reveal the neuromuscular control mechanism of the CNS, this study conducted an investigation on the fatiguing characteristics of the three deltoid heads during three head-related static isometric contraction tasks based on SEMG technique. Specifically, the performance in depicting fatigue of five SEMG parameters were evaluated based on the sensitivity to variability ratio (SVR) and consistency firstly. Then, the best one was selected for further MTU-related fatigue analysis. This study put efforts into extending the muscle fatigue analysis from the whole muscle to the MTU level, and the research achievements are meaningful for the training guidance, the rehabilitation action design, and the establishment of biomechanical model in the fields of fitness, rehabilitation medicine and biomechanics.
2. Materials and Methods
2.1. Subjects
Nine male subjects without history of shoulder, elbow, and wrist pathology or complaints volunteered to participate in this study (age: 23.2 ± 3.1 years old, stature: 175.7 ± 3.0 cm, mass: 65.2 ± 4.0 kg). All the participants were informed of the experiment procedure and signed an informed consent approved by the Ethics Review Committee of Anhui Medical University (No. PJ 2014-08-04).
2.2. Head-Related Static Isometric Contraction Tasks
The deltoid, which forms the rounded contour of the shoulder, was selected as the target muscle. The deltoid is made up of three distinct sets of muscle fibers forming three MTUs known as the anterior, lateral, and posterior head [11]. The unique anatomy of the deltoid ensures its capability to move the arm in different directions. The anterior head, lateral head and posterior head are in charge of shoulder flexion (raising the arm forward), shoulder abduction (lifting the arm out to the side), and shoulder extension (moving the arm backward), respectively [11,22]. In this study, three head-related static isometric contraction tasks were designed to activate the three deltoid heads preferentially. In order to standardize the experimental protocol, a guiding device with a height adjustable horizontal pole was used as an auxiliary device (Figure 1).
Task 1: This task was designed to preferentially activate the anterior deltoid. As shown in Figure 1a, subjects firstly sat erect with the right arm straight forward and holding a dumbbell in the hand, and then kept their arm and shoulder at the same height as guided by a horizontal pole. Subjects were asked to maintain this posture until they failed to maintain it, which was considered to be in the state of exhaustion.
Task 2: This task was designed to preferentially activate the lateral deltoid. As shown in Figure 1b, subjects sat erect with the right arm straight outward and the holding a dumbbell, and kept their arm and shoulder at the same height as guided by a horizontal pole until the state of exhaustion.
Task 3: This task was designed to preferentially activate the posterior deltoid. As shown in Figure 1c, the difference between Task 3 and Task 2 was that in Task 2 subjects were asked to sit erect, but in Task 3 subjects were asked to sit with the chest touching their knee first, and then keep their arm and back at the same height as guided by the horizontal pole until they could not maintain it.
In most muscle fatigue studies, two methods are usually used to keep the muscles at a different activation level during one specific task. One method suggested subjects maintain contraction with a certain percentage of the MVC. The other method allows using different loads to activate the target muscle [23,24]. In this study, the object of fatigue analysis was the MUTs instead of the whole muscle. However, the measurement of MVC for MTUs was almost impossible since it was difficult to activate one specific MTU independently. Hence, step-increasing loads were used to activate MTUs at different activation levels. To determine the weights of the loads, the MVCs of the whole deltoid, were measured under three tasks for each subject before the formal experiments. Finally, three loads of 1, 2 and 3 kg, respectively, which could approximately cover the activation level ranging from 20% to 60% of the MVC, were used.
2.3. Data Collection
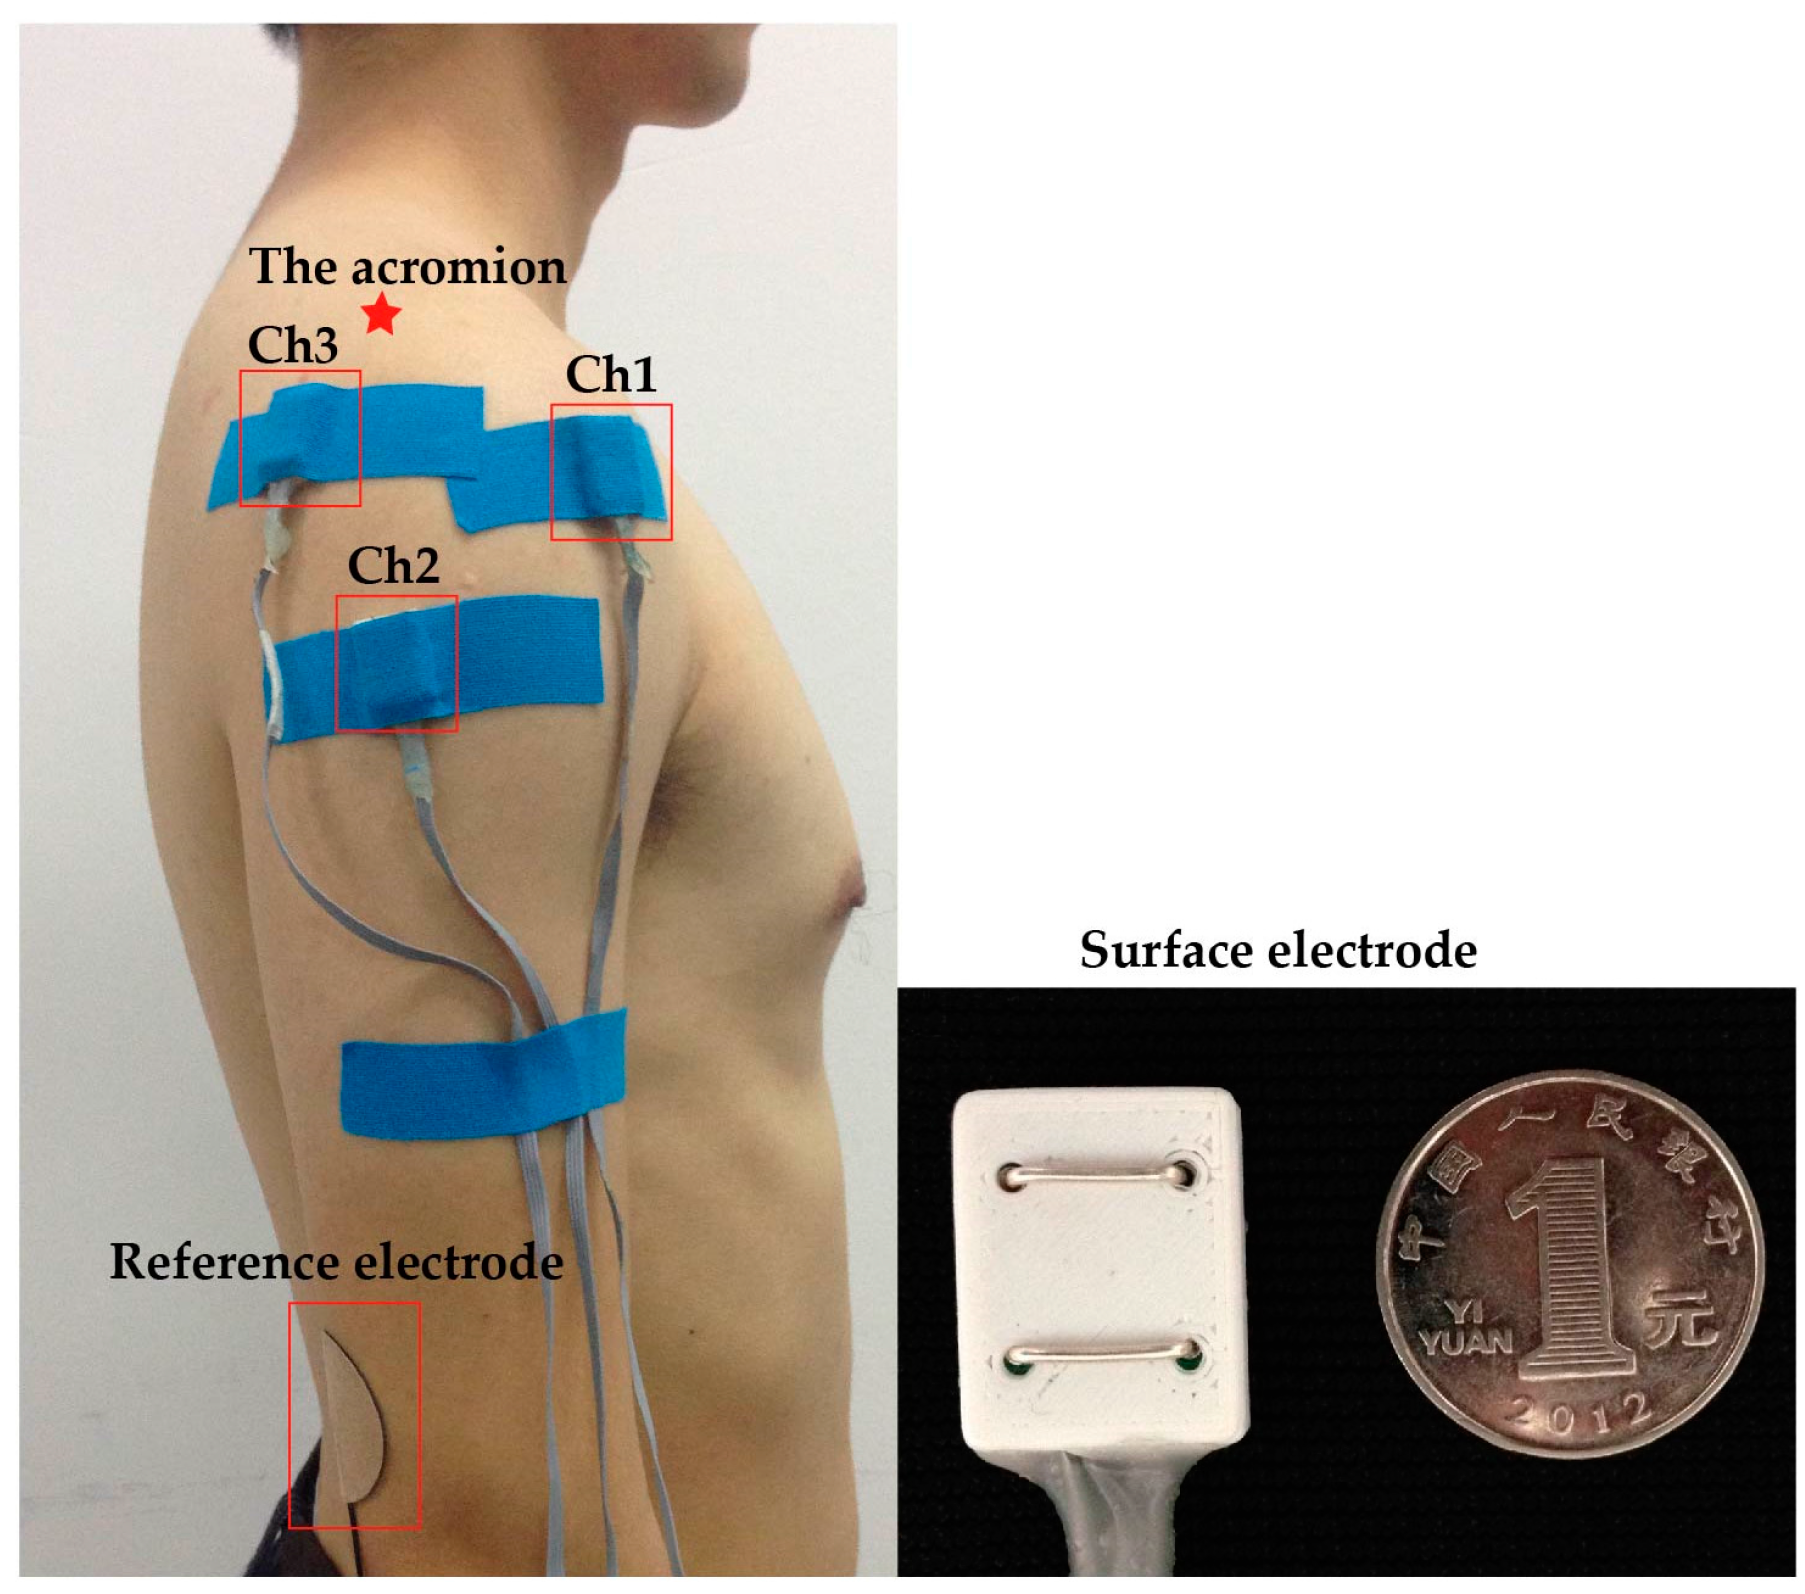
During the experiment, the rough region of the deltoid and a reference point called the acromion were firstly detected through palpation. Then, the skin area of the deltoid was shaved and cleaned with alcohol. Three bipolar electrodes were placed on the three deltoid heads by elastic adhesive bandages in order to reduce artefacts. The detailed placements of these electrodes are shown in Figure 2. “Ch1” was placed at about one finger width distal and anterior to the acromion and directed in the line between the acromion and thumb. “Ch2” was placed in the greatest bulge of the muscle from the acromion to the lateral epicondyle of the elbow and in the line between the acromion and the hand. “Ch3” was placed at the area about two finger breaths behind the angle of the acromion and oriented in the line between the acromion and the little finger. The placements of SEMG sensors on the deltoid followed the recommendation of the SENIAM project [25,26]. The reference electrode was placed at the proximal head of the elbow on the same arm. Electrode locations were marked for each subject in order to ensure the consistency of sensor placements during the following two days. A home-made 16-channel SEMG acquisition system (actually, only three channels were used) was used in this study. Each SEMG sensor has two parallel Ag bars with a 10 mm × 1 mm physical dimension and a 10-mm center-to-center spacing respectively, as presented in Figure 2. An amplifier with a total gain of 37 dB and a band-pass filter with bandwidth between 20 and 500 Hz were used for analog SEMG signals. Then the analog SEMG signals were sampled at 1000-Hz sampling rate using a 24-bit A/D converter (ADS 1299, Texas Instruments, Inc., Dallas, TX, USA). All data were stored on computer disks for further off-line analysis.
The whole experiment was completed in three days in case of fatigue accumulation. On the first day, subjects were asked to successively perform three head-related tasks at 1 kg load. Between each task, a 30-min rest was required to reduce muscle fatigue accumulation. In the following two days, subjects repeated a similar experimental process with the 2 kg and 3 kg loads, respectively. All subjects were trained to do these three tasks correctly before the experiments.
2.4. Signal Preprocessing
Raw SEMG signals were filtered firstly (4-th order Butterworth digital high-pass filter with a 20 Hz cutoff) to remove the noise which mainly consists of low frequency components. Then, filtered SEMG signals were divided into 2 s long epochs (non-overlap) using a moving window.
2.5. SEMG Parameters
(1) Root mean square (RMS)
Parameter RMS, which could be used for the measurement of SEMG amplitude and has been verified to increase with fatigue, is defined as in Equation (1), where T is the length of SEMG signals [2]. In this study, the average of RMS (MRMS) is calculated using Equation (2) to estimate the activities of three heads, where M indicates the number of epochs:
(2) Mean power frequency (MPF)
During the fatiguing process, the power spectral density was found to move toward low frequencies and this phenomenon could be described indirectly by the MPF parameter [2]. The definition of MPF is presented in Equation (3), where PSD is the power spectral density of SEMG signals and is the sampling frequency:
(3) The first coefficient of the autoregressive model (ARC1)
The AR model could be mathematically expressed using Equation (4), where stands for smooth white noise process and p is the order of model:
Many studies have demonstrated that the first coefficient of the AR model () decreases during the fatiguing process [4,20].
(4) Sample entropy (SE)
The entropy is introduced in the field of information theory as a non-linear measurement of the complexity of signals. During isometric fatiguing contraction, the entropy of SEMG was found to decrease with time [27]. SE was derived from approximate entropy and the calculation procedure was described below. In order to compute SE, a delayed m-dimensional vectors from a given signal ,, , is constructed via Equation (5):
The sample entropy is then computed using Equation (6), where stands for the probability that two sequences match for m points. was calculated by counting the average number of vector pairs, for which the distance is lower than the tolerance [28]. We set m = 2 and in this study, where SD refers to the standard deviation of the original signal [28].
(5) Higuchi’s fractal dimension (HFD)
In mathematics, a fractal dimension is a statistical index which is used for measuring the space-filling capacity of a pattern. SEMG signals have self-similarity properties, which means that if SEMG signals are split into parts, each of these parts is a reduced-size copy of original signal [2,29]. A previous study demonstrated that HFD parameters of SEMG signals decreased with time during fatiguing contractions [30]. A brief introduction of Higuchi’s algorithm for fractal dimension calculation is provided below [31]:
Step 1: construct new signals from a given SEMG signal , , , according to Equation (7), where and are integers indicating the initial and interval time and stands for newly constructed signals:
Step 2: calculate the length of according to Equation (8) and compute the average of over m called :
Step 3: plot against (ranging from 1 to ) on a double logarithmic scale and calculate the slope of this line as the HFD parameter.
2.6. The Performance of Fatigue Indexes in Quantification of Fatigue
Numerous studies have manifested that SEMG variables were linearly correlated with time during static isometric fatiguing contraction tasks [17,20,30]. To relate the changes in power loss caused by muscle fatigue to the changes in SEMG variables, the linear regression technique was highly recommended in the studies of González-Izal et al. [32,33]. In this study, RMS, MPF, ARC1, SE and HFD were firstly calculated for each SEMG epoch. Then all parameters were normalized to the value obtained at the first epoch. After that, the linear regression technique was applied to depict the variation trend for these parameters during fatiguing process.
The performance of five SEMG parameters in depicting muscle fatiguing characteristics was evaluated via SVR and consistency. In detail, when the variation trend of a SEMG parameter with time was represented by a linear fitting curve, SVR could be defined as in Equation (9) [34]:
In Equation (9), represents the true value of the parameter, is the value of fitting curve at the corresponding point. The numerator describes the sensitivity of and the denominator stands for the variability of . High SVR value means high sensitivity and low variability of the SEMG parameter in depicting muscle fatigue. When a parameter shows a relatively fixed variation trend (decreasing or increasing) due to fatigue during all fatiguing processes, it can be considered to have good consistency in depicting fatiguing characteristics. In this study, the slopes of the linear fitting curves of SEMG parameters were calculated to represent their variation trend during a fatigue process. For a SEMG parameter, the combination of three tasks and three loads formed nine fatiguing processes, and all cases were divided into two classes according to the positive or negative characteristics of the slopes of the corresponding linear fitting curves. Consistency parameter was defined as Equation (10) in which and stand for the number of cases that linear regression slope was positive and negative respectively. The consistency parameter ranges from 0 to 1, and a good fatigue-depicting index should has high consistency:
The SEMG parameter with high SVR and good consistency was selected to depict MTUs’ fatigue characteristics in further head-related muscle fatigue analysis, and the linear regression slope of that parameter was considered to be a descriptor of fatiguing rate [17].
2.7. Statistical Analysis
In order to investigate possible between-task and between-load differences in terms of activity and fatiguing rate of one head we ran a two-way repeated measures ANOVA for the dependent variables MRMS and the slopes of fitting curves. The design included two independent with-in subjects factors, each consisting of three levels (Task: “Task 1”, “Task 2” and “Task 3”; Load: “1 kg”, “2 kg” and “3 kg”). Additionally, in order to examine the difference in activity among heads a one-way repeated measures ANOVA for the dependent variables MRMS was applied. The design included one independent within-subjects factor, each consisting of three levels (Head: “Anterior”, “Lateral” and “Posterior”). The level of statistical significance was set to p < 0.05 for all analyses. All statistical analyses were carried out using the SPSS software (version 20.0, SPSS Inc., Chicago, IL, USA).
3. Results
3.1. Activation Level Analysis of the Three Deltoid Heads during Three Head-Related Tasks
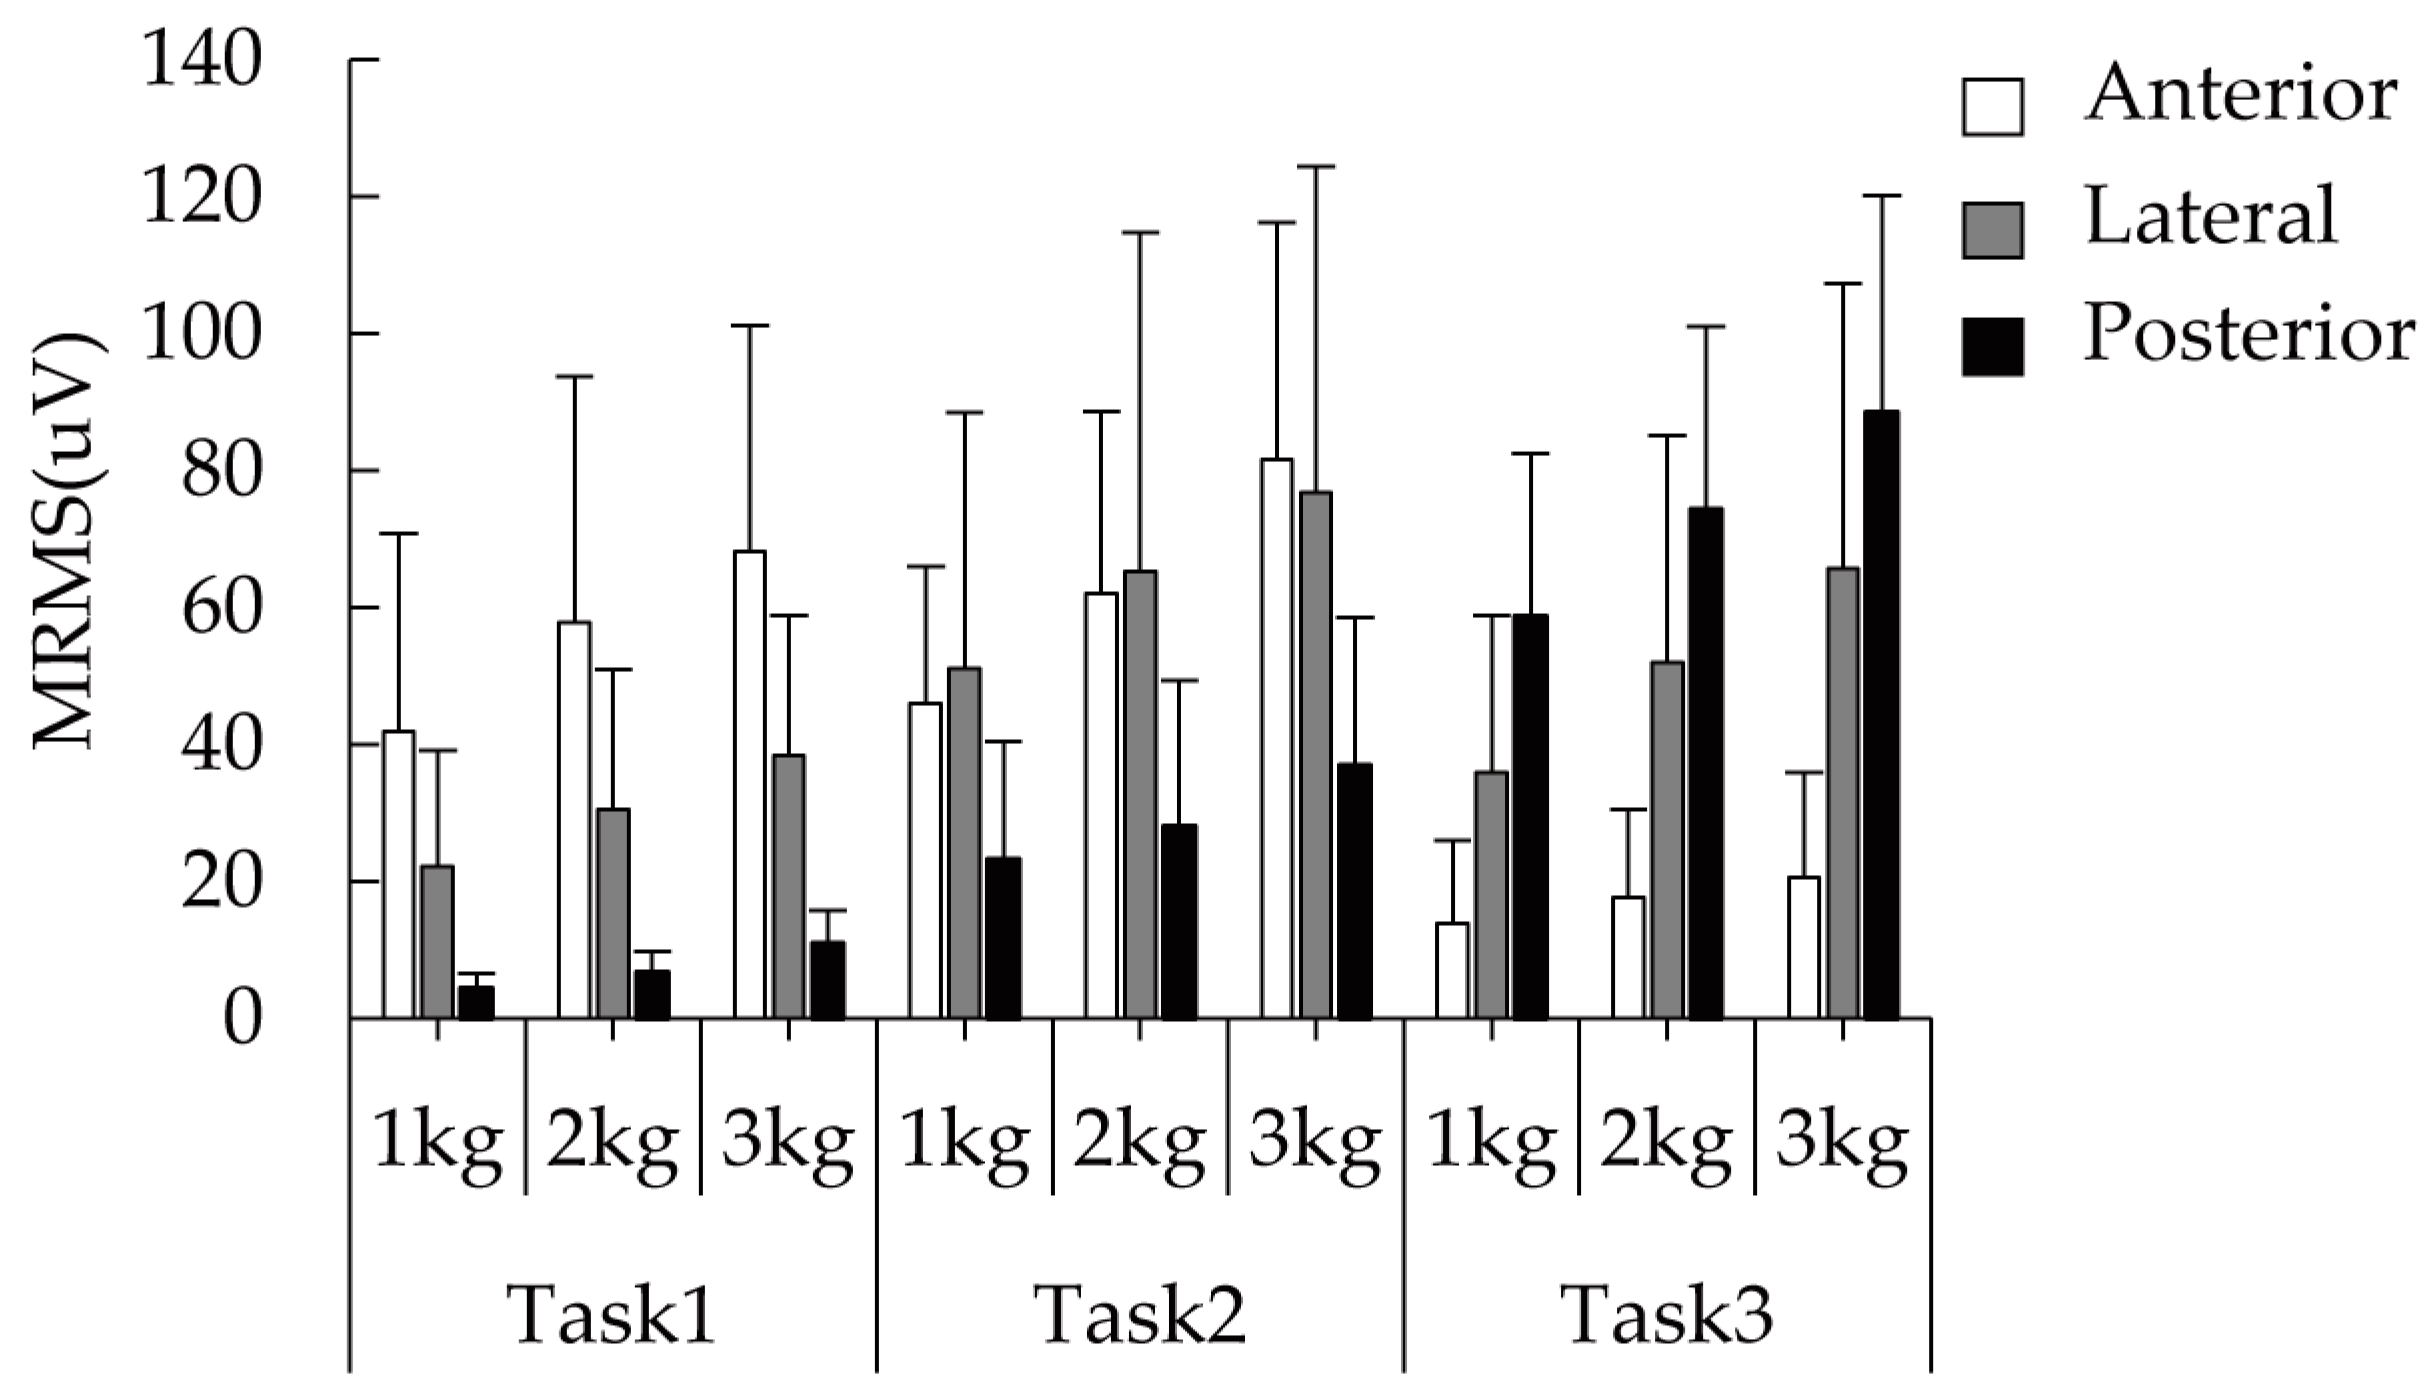
As mentioned above, the MRMS parameter of SEMG signals was used to estimate muscle activation levels in this study. Figure 3 shows MRMS values (mean and standard deviation for all nine subjects) of the three heads, during three head-related tasks with different loads.
The statistical results in Table 1 indicate that factors including task and load had significant effects on the activities of the three deltoid heads. For Task 1, there were significant differences in the MRMS values among the three heads under all loads (p values, 1 kg: 0.002, 2 kg: 0.001 and 3 kg: 0.000). The anterior head obtained the highest MRMS values, followed by the lateral head. For Task 2, the anterior head and the lateral head gave similar MRMS values which were much higher than that of the posterior head (p values, 1 kg: 0.092, 2 kg: 0.045 and 3 kg: 0.059). For Task 3, there were also significant differences in the MRMS values among the three heads under all loads (p values, 1 kg: 0.000, 2 kg: 0.000 and 3 kg: 0.000). The posterior head gave the highest MRMS values, followed by the lateral head. The results mentioned above demonstrate that the anterior head was mainly activated during Task 1, the posterior head was mainly activated during Task 3, and the anterior head and the lateral head were activated almost equally in Task 2. Although there were significant differences in the activation levels of the three deltoid heads in Task 1 and Task 3, it was inaccurate to conclude that the anterior and posterior heads were activated preferentially in Task 1 and Task 3, respectively. More precisely, Task 1, Task 2 and Task 3 should be considered as the anterior-lateral-head-related task, the anterior-lateral-posterior-head-related task and the lateral-posterior-head-related task respectively. Moreover, although three heads showed different activation levels in three head-related motion tasks, all of them exhibited an increase in activation level with the rising in loads no matter which motion task was conducted.
3.2. Performance of Five SEMG Parameters in Quantification of Fatigue
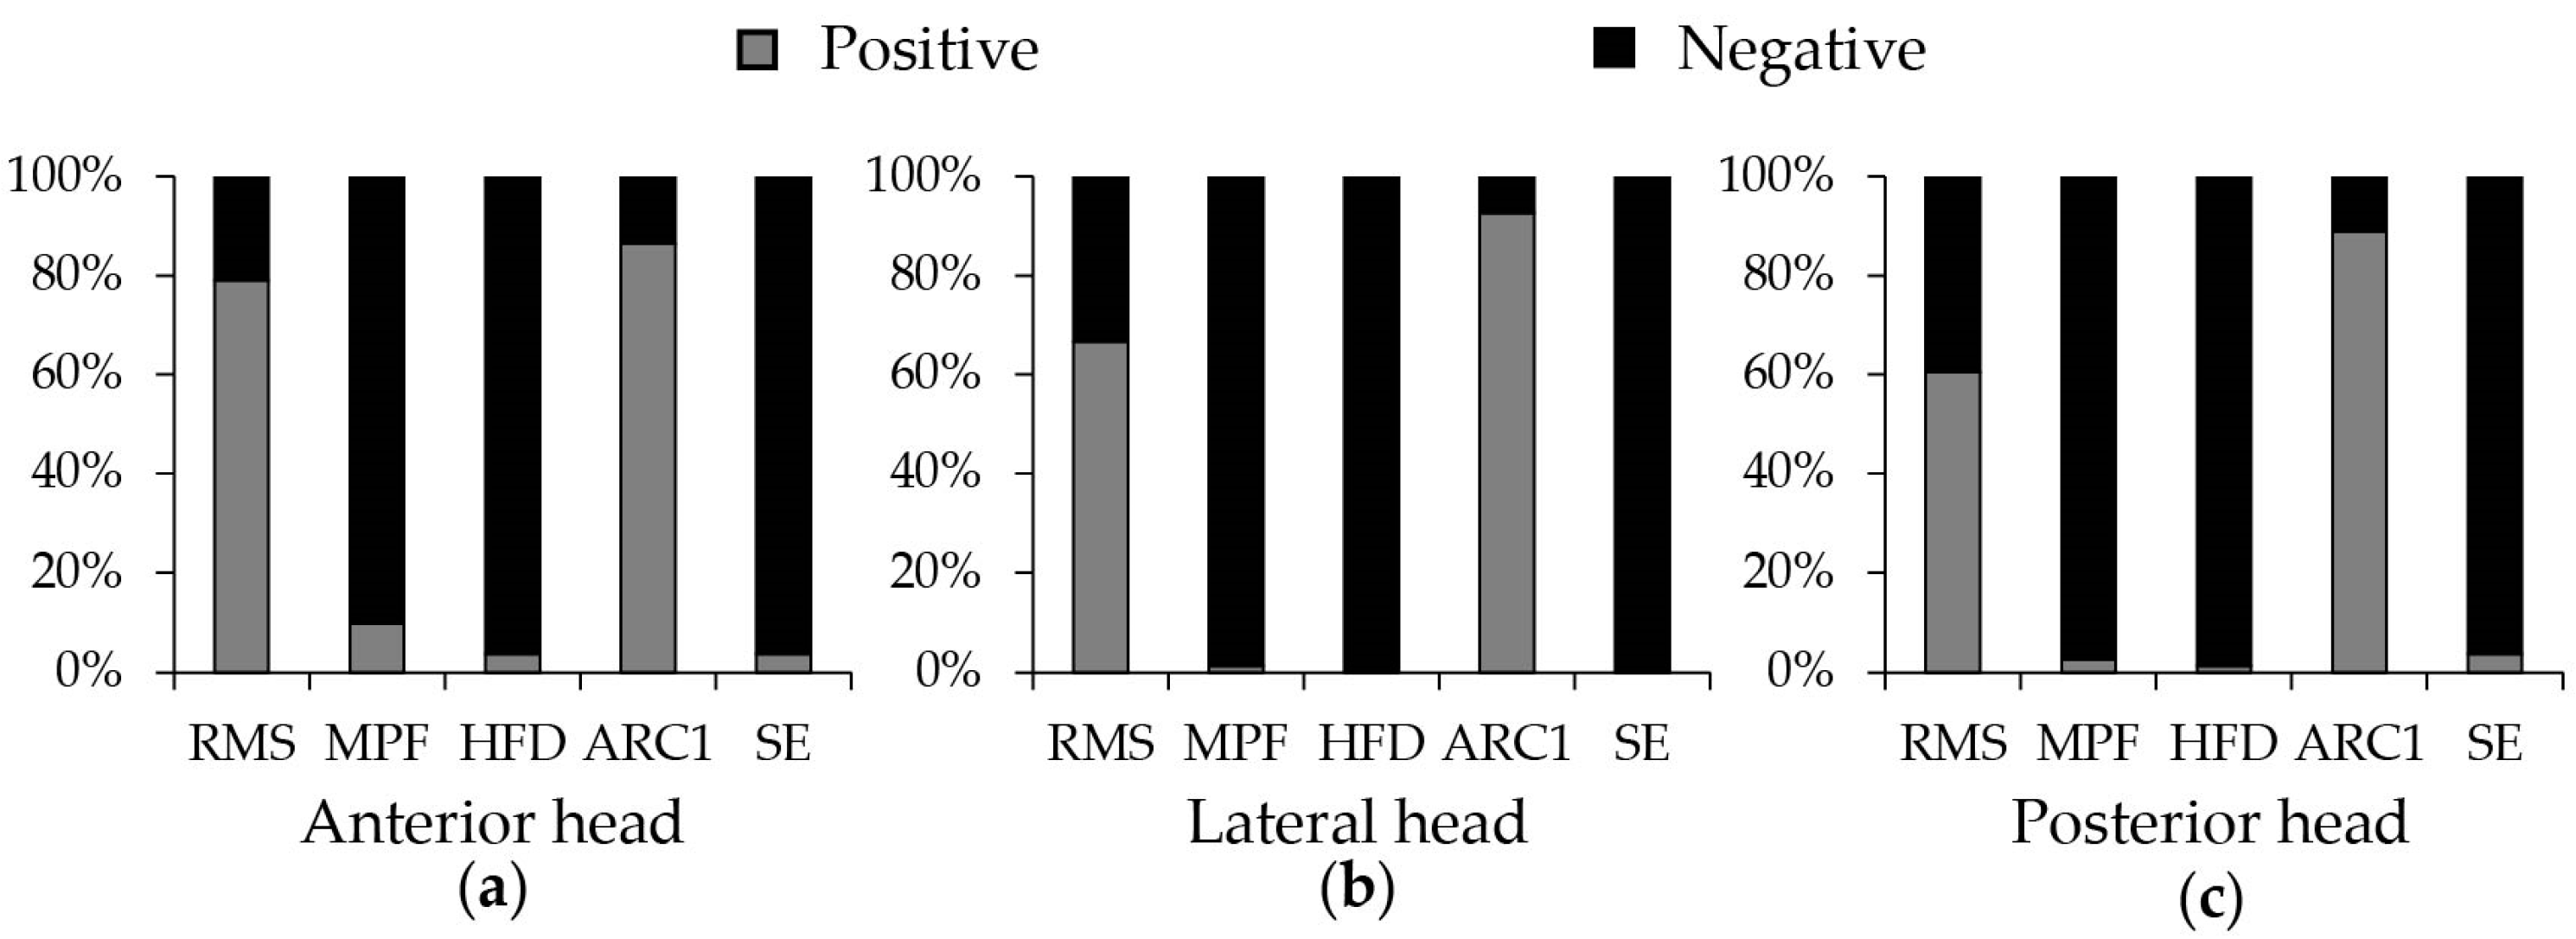
The SVR indexes (Mean ± SD for nine subjects) of five SEMG parameters in the three deltoid heads during three head-related tasks with three loads are shown in Figure 4. Taking all subjects, tasks and loads into account, the proportional distribution of the two classes, corresponding to the positive or negative characteristics of the linear regression slopes, is demonstrated in Figure 5.
On the one hand, although there were large individual differences, HFD gave the highest SVR values while RMS gave the lowest SVR values in all three heads of the deltoid during all nine cases. On the other hand, MPF, HDF and SE parameters obtained good consistency in all three heads. In almost 97% cases, the linear regression slopes of these parameters maintained negative. RMS and ARC1 parameters showed bad consistency since only in 79% cases, the linear regression slopes of these parameters maintained positive. Taking both SVR and consistency into consideration, HFD which obtained a high SVR (Anterior: 497.77 ± 397.76, Lateral: 668.28 ± 405.90, Posterior: 520.03 ± 460.86) and high consistency (Anterior: 0.96, Lateral: 1.00, Posterior: 0.99) was selected as a fatigue index for further head-related muscle fatigue analysis. Specifically, the value of the linear regression slope of HFD was adopted to depict the fatiguing rate of the three deltoid heads.
3.3. HFD-Based Fatigue Analysis of the Three Deltoid Heads
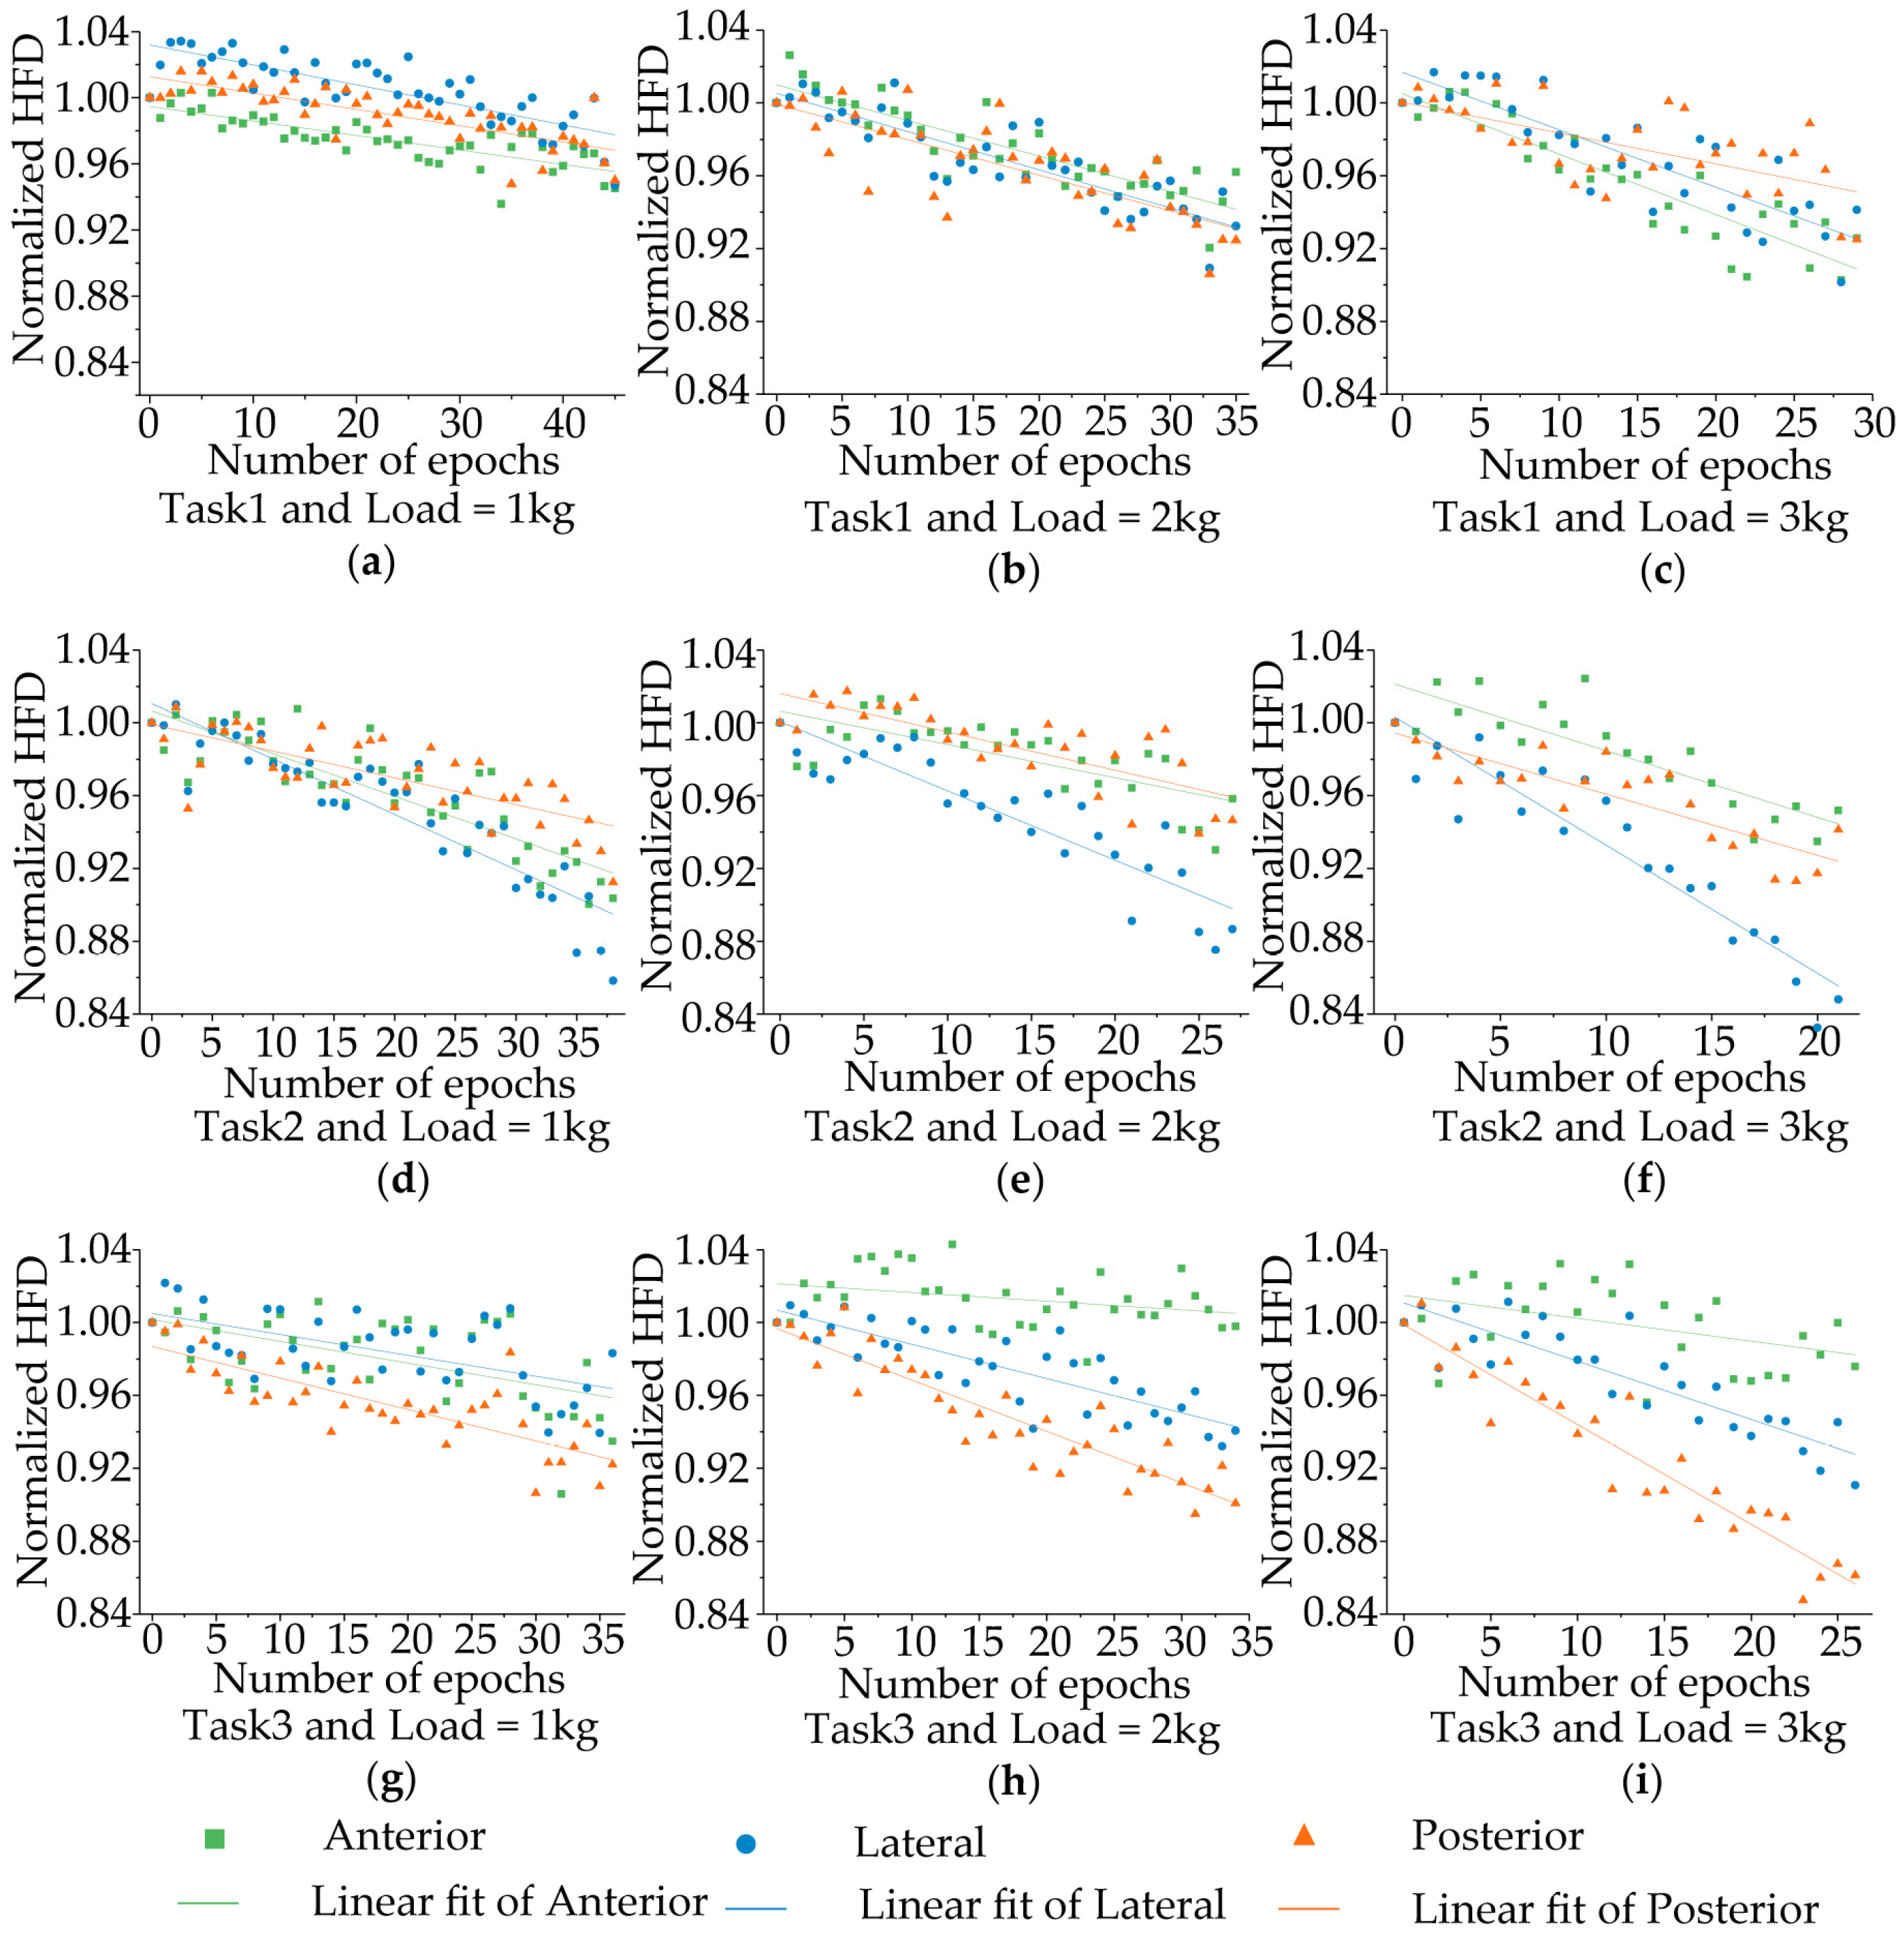
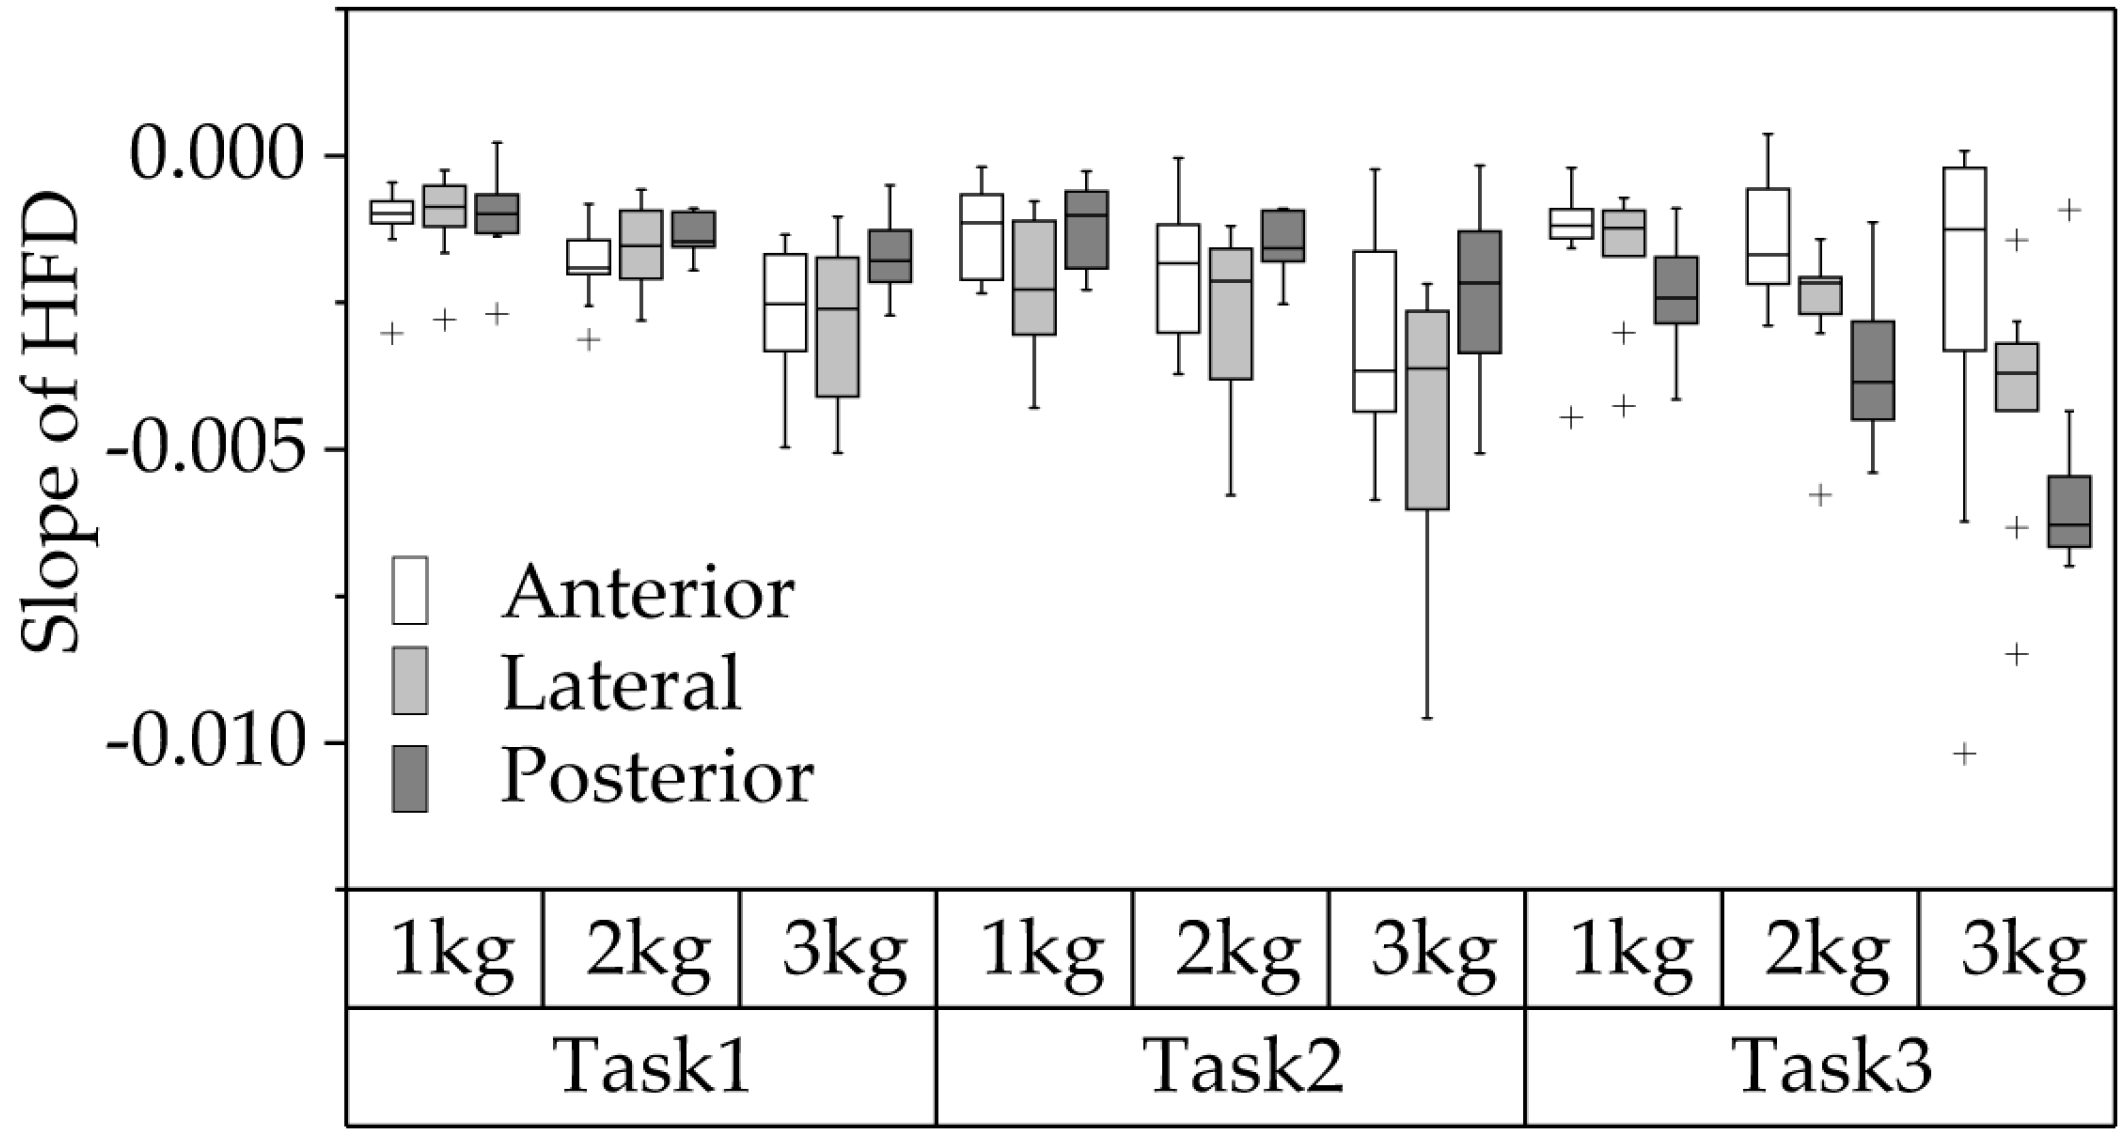
Taking one subject as an example, Figure 6 reports the normalized HFD values and the linear fitting of HFD against number of epochs in the three deltoid heads during three head-related tasks with different loads. From Figure 6, HFD was found to be linearly correlated with muscle fatigue, and the fatigue-related decreases were observed in the three deltoid heads in all cases. For all subjects, the linear regression slopes of HFD under different conditions are presented in Figure 7, and Table 2 gives the statistical results of two-way repeated measure ANOVA (factors: task and load).
In this study, load factor was found to have a significant effect on the fatiguing characteristics for all three heads of the deltoid (Table 2, p < 0.05). From Figure 7, we can observe that, with the increase of load, the fatiguing rates of three heads all increased. These results revealed that the heads were more prone to fatigue in the case of high load. Meanwhile, the differences of fatiguing rate among heads were also found to increase with the increase in load during all tasks.
In addition, the three deltoid heads were found to show different fatiguing rates in the same task. Combining Figure 3 and Figure 7, we can find that preferentially activated heads were usually more prone to fatigue. In Task 1, the anterior head and the lateral head showed similar fatiguing rates which were higher than that in the posterior head. In Task 2, the lateral head showed the highest fatiguing rate followed by the anterior head. In Task 3, the posterior head showed the highest fatiguing rate followed by the lateral head.
4. Discussion
Previous studies have found that there existed region-specific manifestation of fatigue within some skeletal muscles. The differences in control strategies of the CNS for different regions were considered as a major factor resulting in the region-specific manifestation of fatigue. However, all these studies did not relate the substructures within skeletal muscles (such as MTU) with the region-specific manifestation of fatigue. In this study, the deltoid was targeted as the object, and the fatiguing characteristics of the three heads during three head-related static isometric contraction tasks were investigated by means of SEMG technique. The experimental results of this study can help us better understand the underlying neuromuscular control strategies of the CNS.
4.1. The Performance in Quantification of Fatigue for Different SEMG Parameters
In relevant researches, the variation in SEMG parameters was considered to be related to the changes of MU recruitment patterns and biochemical environment of muscle, which is caused by fatigue [2,4,18]. In this study, the performance of five SEMG parameters (RMS, MPF, ARC1, HFD and SE) in depicting fatiguing characteristics of heads was evaluated, under different tasks and loads. Being consistent with previous studies [20,27,30], RMS and ARC1 (normalized) parameters showed increasing trends with fatigue in most cases. MPF, HFD and SE parameters showed decreasing trends with fatigue almost in all cases. In order to find an effective parameter to depict muscle fatigue linearly during isometric contraction protocol, SVR and consistency were defined as criteria for the assessment of the performance in quantification of muscle fatigue. Results indicated that HFD showed the maximal SVR index and consistency for three head-related tasks with different loads. Arjunan et al. found that increase in synchronization (IIS) index of SEMG, had the highest correlation with muscle fatigue, compared with other SEMG parameters such as RMS, MPF, and waveform length (WL) [21]. This means that parameters which could describe the MUs synchronization well would be suitable for muscle fatigue assessment. Exactly, HFD was proved to be one of those parameters [35,36,37]. In addition, Troiano et al. found that the fractal dimension of SEMG was not affected by force level during non-fatiguing contractions but decreased against time during fatiguing contractions [30]. Therefore, HFD is a promising index in depicting fatigue of the three deltoid heads during head-related isometric contraction tasks.
4.2. Possible Control Strategies of the CNS to Control the Three Deltoid Heads during Contraction Task
In 2015, Franke et al. conducted a study to analyze the activities of the anterior, lateral and posterior deltoid during single and multi-joint exercises including the inclined lat pull-down, reverse peck deck and seated row [38]. They found that the activation of the anterior portion of deltoid muscle maintained in similar level in the three exercises, while the lateral head presented greater activation during the reverse peck deck and the seated row compared to the inclined lat pull-down, and the posterior head showed greater activation during the reverse peck deck compared to the other two exercises. In our study, we tried to design three head-related motion tasks to activate the three deltoids heads relatively independently. The experimental results revealed that the anterior head, the lateral head and posterior head were activated in different modes in the three head-related tasks. Despite the exercises in the study of Franke et al. were different from the tasks defined in this study, both of the studies proved that the deltoid presented region-specific manifestation of activation in different motion tasks and the heads might be the functional unit of the deltoid. Additionally, all three deltoid heads showed a sign of fatigue no matter which motion task was conducted in this study. Moreover, with the rising of loads, the activation levels and the fatiguing rates of all three heads exhibited increasing trends. These experimental results suggested that, although the CNS might control the contraction of the deltoid by taking the three heads as functional units, certain synergies between heads might exist when muscle accomplishes a contraction task [11,39].
4.3. Possible Reasons for the Differences of the Fatiguing Characteristics among the Three Deltoid Heads
Previous studies have found that the region-specific manifestation of muscle fatigue existed in some skeletal muscles, for example, the retus femoris muscle and the medial gastrocnemius muscle [15,16]. Later, Ali et al. reported the difference of fatigue characteristics existed in the three heads of triceps brachii during a static task, in which the activation level was maintained at 80% MVC [17]. Consistent with the above studies, this study also found the region-specific manifestations of fatigue between the three deltoid heads during three head-related static isometric contraction tasks. From the perspective of muscle sub-structures, the fatiguing characteristics of the three deltoid heads were found to be task-dependent, and the factor of load was found to have significant effects on the fatiguing rate of all three heads. Specifically, the heads were more prone to fatigue in the case of high load, and the differences in fatiguing rate between heads became larger with the increase in load in each task.
In fact, muscle fatigue can be divided into central and peripheral fatigue according to its origin [36]. “Central fatigue” is related to a decline of motor drive, MUs synchronization, and the variations in control strategy of the CNS. “Peripheral fatigue” can be related to biochemical changes of the environment locally. From the perspective of “peripheral fatigue”, a higher activation level would lead to a faster accumulation of metabolites like lactates. Increased concentration of the lactates is responsible for fatigue via changes in intracellular pH, which would lower the muscle fiber conduction velocity (CV) [4]. In this study, heads which maintained in higher activation level would consume more nutrients and oxygen, and produce more lactates, compared with heads maintained in low activation level. Consequently, a higher concentration of lactates contributes to a higher fatiguing rate in these preferentially activated heads. In addition, with the increase of loads, the difference of activities among heads was gradually widening, as shown in Figure 3. Therefore, the differences in fatiguing rate between heads became larger with the increase in load.
From the perspective of “central fatigue”, the dissimilarities in muscle fiber type and the motor recruitment pattern might be another main reason. Numerous studies have proved that MU synchronization is a major factor which contributes to muscle fatigue [21,40,41]. MUs are made up of two types of fibers, including Type I fibers (slow MU) and Type II fibers (fast MU). Slow MUs are recruited first but have stronger fatigue resistance compared with fast MUs [42,43]. In the case of low level load, slow MUs were mainly recruited in all heads so that MUs synchronization in all heads was not obvious. Consequently, all three heads presented similar low fatiguing rates. However, in the case of high level load, the preferentially activated heads started to recruit fast MUs but heads in low activation level still mainly recruited slow MUs [43]. In this condition, the difference in terms of MUs synchronization between the preferentially activated head and the others began to appear. As a result, the difference of fatiguing rate between heads became larger with the increase of loads.
4.4. Limitations
In this study, the fatiguing characteristics of MTUs within the deltoid during static isometric contraction tasks were investigated via SEMG. Although some interesting results were obtained, some potential issues were noted. Firstly, due to the difficulties in the measurement of the MVCs for MTUs, a compromised approach namely step-increasing loads was used to activate MTUs. This approach inevitably causes individual differences between subjects because different subjects had different load acceptance. The other issue was the bias caused by electrode misalignment. Although we have placed the sensors in strict accordance with the guidance of the SENIAM project, the differences in muscle shape and fat layer thickness of subjects inevitably cause some bias.
5. Conclusions
In this paper, the performance of five SEMG parameters in depicting the fatiguing characteristics of MTUs was evaluated firstly. Then, fatigue analysis was conducted on the three deltoid heads during three head-related static isometric contraction tasks. The experimental results demonstrated that the anterior head, the lateral head and posterior head were activated in different modes in the three head-related tasks. The fatiguing characteristics of the three heads were found to be task-dependent, and the heads at high activation level were more prone to fatigue. In addition, the fatigue differences among heads increased with the increase in load. The findings of this study could help us better understand the underlying neuromuscular control strategies of the CNS, and are meaningful for training guidance, rehabilitation motion design, and establishment of biomechanical model in the fields of fitness, rehabilitation medicine, biomechanics, kinesiology and neuroscience.
Acknowledgments
We are grateful to all the subjects for their participation in this study. This work was supported by the National Nature Science Foundation of China (NSFC) under Grant 61431017 and 61671417.
Author Contributions
Wenxiang Cui performed the experiments, analyzed the data, interpreted the results and wrote the first draft of the manuscript. Xiang Chen provided instructions on all stages of the study including experimental design, data analysis, interpretation, and substantial revision of the manuscript. Shuai Cao put efforts on data acquisition system. Xu Zhang provided guidance on data analysis and interpretation. All authors have read and approved the final version of the manuscript.
Conflicts of Interest
The authors declare no conflict of interest.
References
- Edwards, R.H. Human muscle function and fatigue. Ciba Found. Symp. 1981, 82, 1–18. [Google Scholar] [PubMed]
- Gonzalez-Izal, M.; Malanda, A.; Gorostiaga, E.; Izquierdo, M. Electromyographic models to assess muscle fatigue. J. Electromyogr. Kinesiol. 2012, 22, 501–512. [Google Scholar] [CrossRef] [PubMed]
- Grassi, B.; Rossiter, H.B.; Zoladz, J.A. Skeletal muscle fatigue and decreased efficiency: Two sides of the same coin? Exerc. Sport Sci. Rev. 2015, 43, 75–83. [Google Scholar] [CrossRef] [PubMed]
- Cifrek, M.; Medved, V.; Tonkovic, S.; Ostojic, S. Surface emg based muscle fatigue evaluation in biomechanics. Clin. Biomech. 2009, 24, 327–340. [Google Scholar] [CrossRef] [PubMed]
- Toebes, M.J.; Hoozemans, M.J.; Dekker, J.; van Dieen, J.H. Effects of unilateral leg muscle fatigue on balance control in perturbed and unperturbed gait in healthy elderly. Gait Posture 2014, 40, 215–219. [Google Scholar] [CrossRef] [PubMed]
- Eken, M.M.; Dallmeijer, A.J.; Houdijk, H.; Doorenbosch, C.A. Muscle fatigue during repetitive voluntary contractions: A comparison between children with cerebral palsy, typically developing children and young healthy adults. Gait Posture 2013, 38, 962–967. [Google Scholar] [CrossRef] [PubMed]
- Villafane, J.H.; Gobbo, M.; Peranzoni, M.; Naik, G.; Imperio, G.; Cleland, J.A.; Negrini, S. Validity and everyday clinical applicability of lumbar muscle fatigue assessment methods in patients with chronic non-specific low back pain: A systematic review. Disabil. Rehabil. 2016, 38, 1859–1871. [Google Scholar] [CrossRef] [PubMed]
- Sedeek, A.B.; Attaallah, M.; Saleh, A. The relation between muscle fatigue and some physiological and biomechanical parameters. J. Am. Sci. 2016, 12, 82–87. [Google Scholar]
- Becker, S.; Fröhlich, M.; Kelm, J.; Ludwig, O. Change of muscle activity as well as kinematic and kinetic parameters during headers after core muscle fatigue. Sports 2017, 5, 10. [Google Scholar] [CrossRef]
- Corben, J.S.; Cerrone, S.A.; Soviero, J.E.; Kwiecien, S.Y.; Nicholas, S.J.; McHugh, M.P. Performance demands in softball pitching: A comprehensive muscle fatigue study. Am. J. Sports Med. 2015, 43, 2035–2041. [Google Scholar] [CrossRef] [PubMed]
- Jarmey, C. Muscles of the shoulder and upper arm. In The Concise Book of Muscles, 2nd ed.; Lotus Publishing and North Atlantic Books: Chichester, UK, 2008; pp. 96–97. [Google Scholar]
- Wickham, J.B.; Brown, J. The function of neuromuscular compartments in human shoulder muscles. J. Neurophysiol. 2012, 107, 336–345. [Google Scholar] [CrossRef] [PubMed]
- Huang, C.; Chen, X.; Cao, S.; Zhang, X. Muscle-tendon units localization and activation level analysis based on high-density surface emg array and nmf algorithm. J. Neural Eng. 2016, 13, 066001. [Google Scholar] [CrossRef] [PubMed]
- Watanabe, K.; Kouzaki, M.; Moritani, T. Non-uniform surface electromyographic responses to change in joint angle within rectus femoris muscle. Muscle Nerve 2014, 50, 794–802. [Google Scholar] [CrossRef] [PubMed]
- Gallina, A.; Merletti, R.; Vieira, T.M. Are the myoelectric manifestations of fatigue distributed regionally in the human medial gastrocnemius muscle? J. Electromyogr. Kinesiol. 2011, 21, 929–938. [Google Scholar] [CrossRef] [PubMed]
- Watanabe, K.; Kouzaki, M.; Moritani, T. Region-specific myoelectric manifestations of fatigue in human rectus femoris muscle. Muscle Nerve 2013, 48, 226–234. [Google Scholar] [CrossRef] [PubMed]
- Ali, A.; Sundaraj, K.; Badlishah Ahmad, R.; Ahamed, N.U.; Islam, A.; Sundaraj, S. Muscle fatigue in the three heads of the triceps brachii during a controlled forceful hand grip task with full elbow extension using surface electromyography. J. Hum. Kinet. 2015, 46, 69–76. [Google Scholar] [CrossRef] [PubMed]
- Naik, G.R.; Kumar, D.K.; Wheeler, K.; Arjunan, S.P. Estimation of Muscle Fatigue during Cyclic Contractions Using Source Separation Techniques. In Proceedings of the 2008 Digital Image Computing: Techniques and Applications (2009), Melbourne, Australia, 1–3 December 2009; pp. 217–222. [Google Scholar]
- Venugopal, G.; Navaneethakrishna, M.; Ramakrishnan, S. Extraction and analysis of multiple time window features associated with muscle fatigue conditions using semg signals. Expert Syst. Appl. 2014, 41, 2652–2659. [Google Scholar] [CrossRef]
- Kim, J.Y.; Jung, M.C.; Haight, J.M. The sensitivity of autoregressive model coefficient in quantification of trunk muscle fatigue during a sustained isometric contraction. Int. J. Ind. Ergon. 2005, 35, 321–330. [Google Scholar] [CrossRef]
- Arjunan, S.P.; Kumar, D.K.; Naik, G. Computation and evaluation of features of surface electromyogram to identify the force of muscle contraction and muscle fatigue. Biomed. Res. Int. 2014, 2014, 197960. [Google Scholar] [CrossRef] [PubMed]
- Evans, N. Shoulders. In Bodybuilding Anatomy, 2nd ed.; Klug, J., Ed.; Human Kinetics: Champaign, IL, USA, 2015; pp. 1–43. [Google Scholar]
- Vøllestad, N.K. Measurement of human muscle fatigue. J. Neurosci. Methods 1997, 74, 219–227. [Google Scholar] [CrossRef]
- Hagberg, M. Work load and fatigue in repetitive arm elevations. Ergonomics 1981, 24, 543–555. [Google Scholar] [CrossRef] [PubMed]
- Hermens, H.J.; Freriks, B.; Disselhorst-Klug, C.; Rau, G. Development of recommendations for semg sensors and sensor placement procedures. J. Electromyogr. Kinesiol. 2000, 10, 361–374. [Google Scholar] [CrossRef]
- Seniam. Available online: http://www.seniam.org/ (accessed on 12 December 2015).
- Xie, H.B.; Guo, J.Y.; Zheng, Y.P. Fuzzy approximate entropy analysis of chaotic and natural complex systems: Detecting muscle fatigue using electromyography signals. Ann. Biomed. Eng. 2010, 38, 1483–1496. [Google Scholar] [CrossRef] [PubMed]
- Zhang, X.; Zhou, P. Sample entropy analysis of surface emg for improved muscle activity onset detection against spurious background spikes. J. Electromyogr. Kinesiol. 2012, 22, 901–907. [Google Scholar] [CrossRef] [PubMed]
- Anmuth, C.J.; Goldberg, G.; Mayer, N.H. Fractal dimension of electromyographic signals recorded with surface electrodes during isometric contractions is linearly correlated with muscle activation. Muscle Nerve 1994, 17, 953–954. [Google Scholar] [CrossRef] [PubMed]
- Troiano, A.; Naddeo, F.; Sosso, E.; Camarota, G.; Merletti, R.; Mesin, L. Assessment of force and fatigue in isometric contractions of the upper trapezius muscle by surface emg signal and perceived exertion scale. Gait Posture 2008, 28, 179–186. [Google Scholar] [CrossRef] [PubMed]
- Garavito, F.; Gonzalez, J.; Cabarcas, J.; Chaparro, D.; Portocarrero, I.; Vargas, A. Emg signal analysis based on fractal dimension for muscle activation detection under exercice protocol. In Proceedings of the 2016 XXI Symposium on Signal Processing, Images and Artificial Vision (STSIVA), Bucaramanga, Colombia, 30 August–2 September 2016. [Google Scholar]
- Gonzalez-Izal, M.; Malanda, A.; Navarro-Amezqueta, I.; Gorostiaga, E.M.; Mallor, F.; Ibanez, J.; Izquierdo, M. Emg spectral indices and muscle power fatigue during dynamic contractions. J. Electromyogr. Kinesiol. 2010, 20, 233–240. [Google Scholar] [CrossRef] [PubMed]
- Gonzalez-Izal, M.; Rodriguez-Carreno, I.; Malanda, A.; Mallor-Gimenez, F.; Navarro-Amezqueta, I.; Gorostiaga, E.M.; Izquierdo, M. Semg wavelet-based indices predicts muscle power loss during dynamic contractions. J. Electromyogr. Kinesiol. 2010, 20, 1097–1106. [Google Scholar] [CrossRef] [PubMed]
- Rogers, D.R.; MacIsaac, D.T. Emg-based muscle fatigue assessment during dynamic contractions using principal component analysis. J. Electromyogr. Kinesiol. 2011, 21, 811–818. [Google Scholar] [CrossRef] [PubMed]
- Kumar, D.K.; Arjunan, S.P.; Naik, G.R. Measuring increase in synchronization to identify muscle endurance limit. IEEE Trans. Neural Syst. Rehabil. Eng. 2011, 19, 578–587. [Google Scholar] [CrossRef] [PubMed]
- Beretta-Piccoli, M.; D’Antona, G.; Barbero, M.; Fisher, B.; Dieli-Conwright, C.M.; Clijsen, R.; Cescon, C. Evaluation of central and peripheral fatigue in the quadriceps using fractal dimension and conduction velocity in young females. PLoS ONE 2015, 10, e0123921. [Google Scholar]
- Mesin, L.; Cescon, C.; Gazzoni, M.; Merletti, R.; Rainoldi, A. A bi-dimensional index for the selective assessment of myoelectric manifestations of peripheral and central muscle fatigue. J. Electromyogr. Kinesiol. 2009, 19, 851–863. [Google Scholar] [CrossRef] [PubMed]
- Franke, R.D.; Botton, C.E.; Rodrigues, R.; Pinto, R.S.; Lima, C.S. Analysis of anterior, middle and posterior deltoid activation during single and multijoint exercises. J. Sports Med. Phys. Fit. 2015, 55, 714–721. [Google Scholar]
- Tang, L.; Li, F.; Cao, S.; Zhang, X.; Chen, X. Muscle synergy analysis for similar upper limb motion tasks. Conf. Proc. IEEE Eng. Med. Biol. Soc. 2014, 2014, 3590–3593. [Google Scholar] [PubMed]
- Arjunan, S.P.; Kumar, D.; Naik, G. Independence between two channels of surface electromyogram signal to measure the loss of motor units. Meas. Sci. Rev. 2015, 15, 152–155. [Google Scholar] [CrossRef]
- Naik, G.R.; Kumar, D.K.; Arjunan, S. Measure of Increase in Motor Unit Synchronisaton for Young and Old Using Semg. In Proceedings of the Biosignals and Biorobotics Conference (BRC), Manaus, Brazil, 9–11 January 2012; pp. 1–4. [Google Scholar]
- Maton, B. Human motor unit activity during the onset of muscle fatigue in submaximal isometric isotonic contraction. Eur. J. Appl. Physiol. 1981, 46, 271–281. [Google Scholar] [CrossRef]
- Al Harrach, M.; Carriou, V.; Boudaoud, S.; Laforet, J.; Marin, F. Analysis of the semg/force relationship using hd-semg technique and data fusion: A simulation study. Comput. Biol. Med. 2017, 83, 34–47. [Google Scholar] [CrossRef] [PubMed]
Figure 1.
Three head-related static isometric contraction tasks: (a) Task 1; (b) Task 2; (c) Task 3.
Figure 1.
Three head-related static isometric contraction tasks: (a) Task 1; (b) Task 2; (c) Task 3.

Figure 2.
Placement of EMG sensors on the deltoid. Here “Ch” denotes the channel of EMG sensor.

Figure 3.
MRMS of the three deltoid heads during three head-related tasks with different loads. The boxes and whiskers show the mean and standard deviation respectively for all nine subjects.
Figure 3.
MRMS of the three deltoid heads during three head-related tasks with different loads. The boxes and whiskers show the mean and standard deviation respectively for all nine subjects.

Figure 4.
SVR indexes of five SEMG parameters for the anterior head (a), the lateral head (b) and the posterior head (c) during three isometric contraction tasks with different loads. The boxes and whiskers show the mean and standard deviation values for all nine subjects.
Figure 4.
SVR indexes of five SEMG parameters for the anterior head (a), the lateral head (b) and the posterior head (c) during three isometric contraction tasks with different loads. The boxes and whiskers show the mean and standard deviation values for all nine subjects.
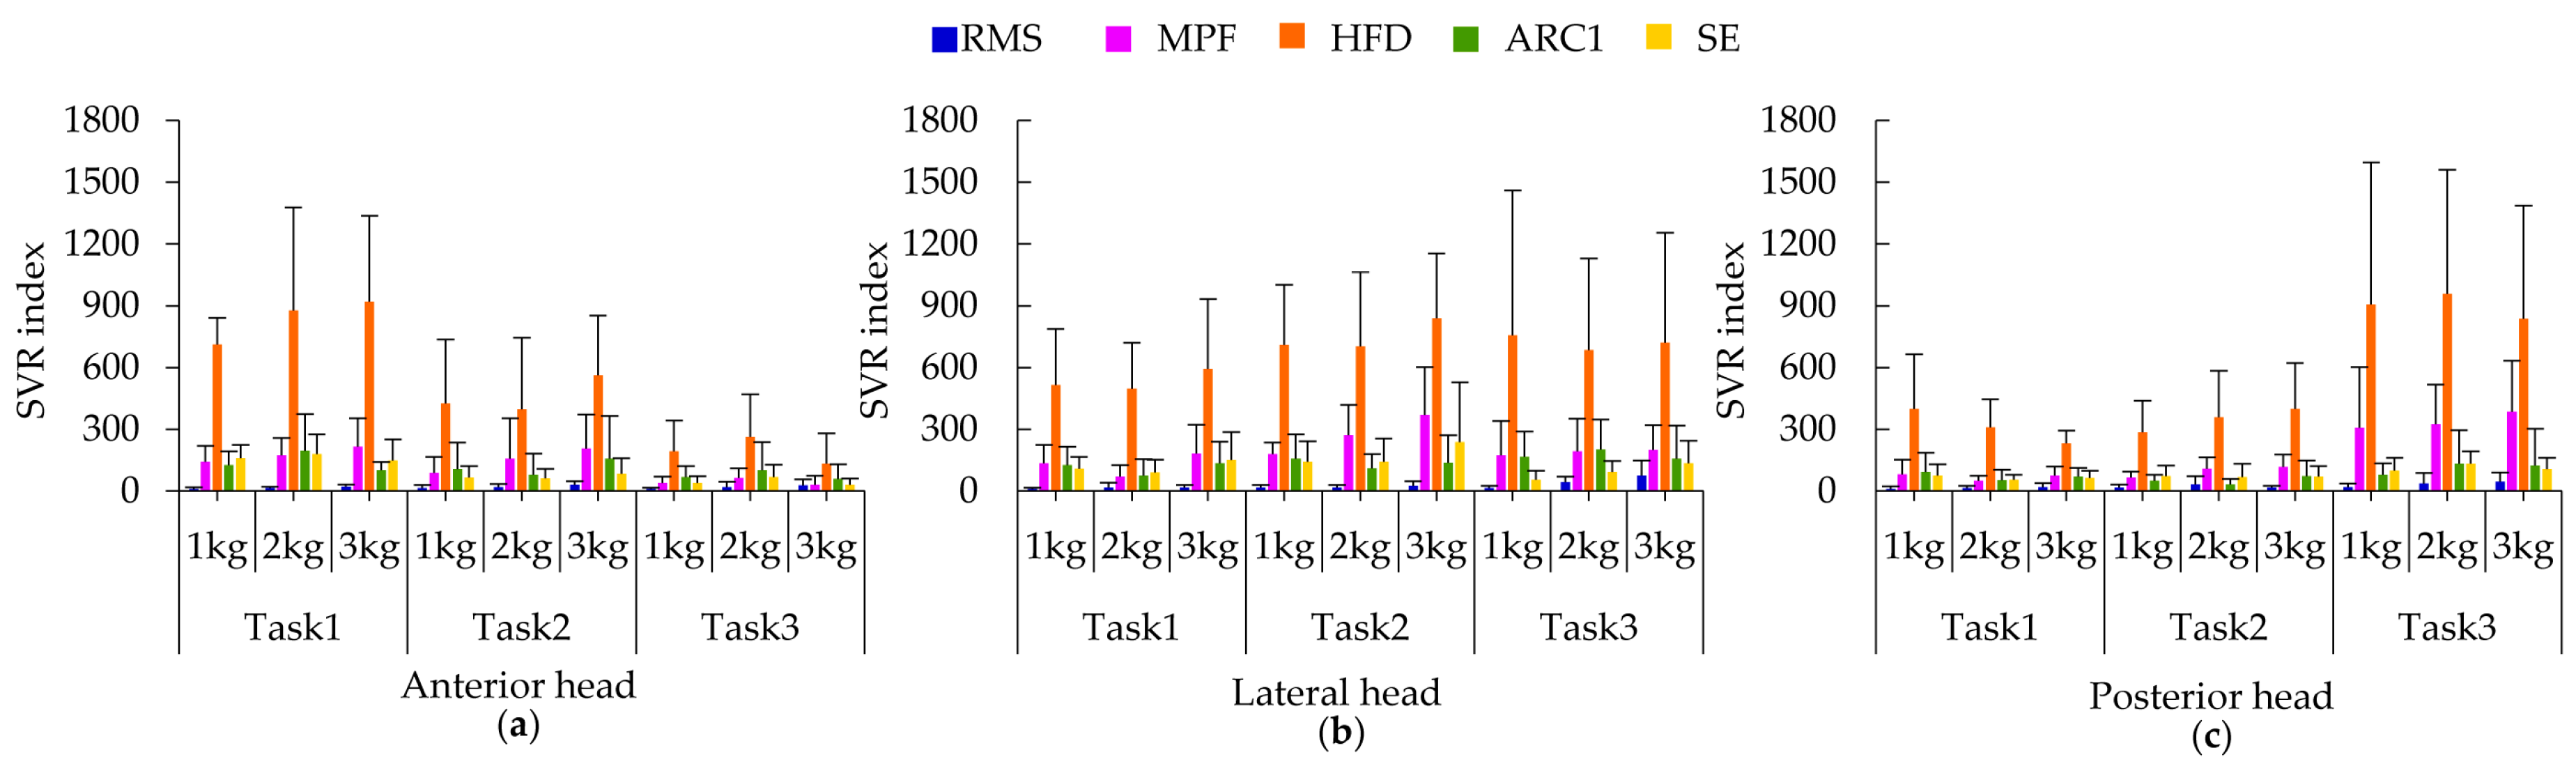
Figure 5.
Proportional distribution of two classes, corresponding to the positive or negative characteristics of linear regression slopes for five SEMG parameters. (a) In the anterior head; (b) In the lateral head; (c) In the posterior head.
Figure 5.
Proportional distribution of two classes, corresponding to the positive or negative characteristics of linear regression slopes for five SEMG parameters. (a) In the anterior head; (b) In the lateral head; (c) In the posterior head.

Figure 6.
The linear fit of HFD against time (number of epochs) in the three heads of the deltoid under nine conditions for one subject. (a) Task1 and load = 1 kg; (b) Task1 and load = 2 kg; (c) Task1 and load = 3 kg; (d) Task2 and load = 1 kg; (e) Task2 and load = 2 kg; (f) Task2 and load = 3 kg; (g) Task3 and load = 1 kg; (h) Task3 and load = 2 kg; (i) Task3 and load = 3 kg.

Figure 7.
Boxplot of linear regression slopes of HFD for all subjects under different conditions. Box plots show the results for all subjects, the middle line in each box plot represents the median value, and the whisker indicates the range. The bottom and top limits of each box reveal the interquartile range and black plus signs denote outliers.


Table 1.
Results of two-way repeated measure ANOVA for MRMS values in the three deltoid heads.
| Factors | Significance (p Values) | ||
|---|---|---|---|
| Anterior | Lateral | Posterior | |
| Task | 0.001 * | 0.007 * | 0.000 * |
| Load | 0.000 * | 0.000 * | 0.000 * |
* Statistically significant correlation at p < 0.05.
Table 2.
Results of two-way repeated measure ANOVA for linear regression slopes of HFD in the three deltoid heads.
Table 2.
Results of two-way repeated measure ANOVA for linear regression slopes of HFD in the three deltoid heads.
| Factors | Significance (p Values) | ||
|---|---|---|---|
| Anterior | Lateral | Posterior | |
| Task | 0.782 | 0.031 * | 0.000 * |
| Load | 0.004 * | 0.000 * | 0.000 * |
* Statistically significant correlation at p < 0.05.
© 2017 by the authors. Licensee MDPI, Basel, Switzerland. This article is an open access article distributed under the terms and conditions of the Creative Commons Attribution (CC BY) license (http://creativecommons.org/licenses/by/4.0/).
Share and Cite
MDPI and ACS Style
Cui, W.; Chen, X.; Cao, S.; Zhang, X. Muscle Fatigue Analysis of the Deltoid during Three Head-Related Static Isometric Contraction Tasks. Entropy 2017, 19, 221. https://doi.org/10.3390/e19050221
AMA Style
Cui W, Chen X, Cao S, Zhang X. Muscle Fatigue Analysis of the Deltoid during Three Head-Related Static Isometric Contraction Tasks. Entropy. 2017; 19(5):221. https://doi.org/10.3390/e19050221
Chicago/Turabian StyleCui, Wenxiang, Xiang Chen, Shuai Cao, and Xu Zhang. 2017. "Muscle Fatigue Analysis of the Deltoid during Three Head-Related Static Isometric Contraction Tasks" Entropy 19, no. 5: 221. https://doi.org/10.3390/e19050221
Note that from the first issue of 2016, this journal uses article numbers instead of page numbers. See further details here.