Node Importance Ranking of Complex Networks with Entropy Variation

Automation School, Beijing University of Posts and Telecommunications, Beijing 100876, China
Entropy 2017, 19(7), 303; https://doi.org/10.3390/e19070303
Submission received: 28 May 2017
/
Revised: 21 June 2017
/
Accepted: 22 June 2017
/
Published: 26 June 2017
(This article belongs to the Special Issue Complex Systems, Non-Equilibrium Dynamics and Self-Organisation)
Abstract
:The heterogeneous nature of a complex network determines the roles of each node in the network that are quite different. Mechanisms of complex networks such as spreading dynamics, cascading reactions, and network synchronization are highly affected by a tiny fraction of so-called important nodes. Node importance ranking is thus of great theoretical and practical significance. Network entropy is usually utilized to characterize the amount of information encoded in the network structure and to measure the structural complexity at the graph level. We find that entropy can also serve as a local level metric to quantify node importance. We propose an entropic metric, Entropy Variation, defining the node importance as the variation of network entropy before and after its removal, according to the assumption that the removal of a more important node is likely to cause more structural variation. Like other state-of-the-art methods for ranking node importance, the proposed entropic metric is also used to utilize structural information, but at the systematical level, not the local level. Empirical investigations on real life networks, the Snake Idioms Network, and several other well-known networks, demonstrate the superiority of the proposed entropic metric, notably outperforming other centrality metrics in identifying the top-k most important nodes.
1. Introduction
Complex networks provide convenient models for complex systems in biology, physics, and social sciences [1,2,3,4,5]. The heterogeneous nature of complex networks determines the roles of each node in the networks that are quite different [6]. Many mechanisms of complex networks such as spreading dynamics, cascading reactions, and network synchronization are highly affected by a tiny fraction of so-called important nodes [7]. Identifying the most important nodes or ranking the node importance by using the method of quantitative analysis in large scale networks is thus very significant, which allows us to better control rumor and disease spreading [8,9], design viral marketing strategies [10], rank the reputation of scientists and publications [11,12], optimize limited resource allocation [13], protect critical regions from intended attacks [14], etc.
Since the pioneering works of several social scientists interested in quantifying the centrality and prestige of actors in social networks, the identification of the most central nodes in complex networks has come a long way [15], and diverse indices have been proposed to measure it; to name some well-knowns ones, Degree [16], Closeness [17], Coreness [8], Eccentricity [18], Herfindahl index (H-index) [19], Eigenvector [20], Page Rank [21], HITs [22], Subgraph centrality [23], Information centrality [24], Bonacich Alpha centrality [25]; Betweenness [26], Load [27], Stress [28], etc. Just as Borgatti and Everett summarized the graph-theoretic perspective [29], all measures of centrality assess a node’s involvement in the walk structure of a network: the walk type of degree-like centralities such as closeness and eigenvector, is radial, while the walk type of betweenness-like centralities such as load and stress is medial. In other words, the majority of known methods in identifying or ranking important nodes make use of the structural information [6]. For more details about the above mentioned centralities, we refer to [6,29].
Structural complexity is perhaps the most important property of a complex network [1]. Network entropy is usually utilized to characterize the amount of information encoded in the network structure and to measure the structural complexity [30]. Recently, considerable effort has focused on quantifying network complexity using entropy measures [31], and several entropic metrics have been proposed; to name a few, network connectivity entropy [32], cyclic entropy [33], mapping entropy [34], hotspot entropy [35], Riemannian-geometric entropy [36], and q-entropy [37]. These measures have been shown to be extremely successful in quantifying the level of organization encoded in structural features of networks.
As was mentioned before, we often resort to network structural information for ranking node importance, while entropy can serve as a fundamental tool to capture the structural information of complex networks. However, to the best of our knowledge, there are seldom entropic metrics developed to measure node importance. Two recent exceptions are the Relative Entropy [38] and Expected Force [39]. Relative entropy [38] is proposed as an integrated evaluation approach for node importance, which generates an optimal solution from different individual centrality indices by linear programming. Thus relative entropy serves not as a direct metric for node importance ranking, but a hybrid approach for synthesizing the existing ones. Expected Force [39] is a node property derived from local network topology to depict the force of infection, and can be approximated by the entropy of the onward connectivity of each transmission cluster. It outperforms the accessibility, k-shell, and eigenvalue centrality in predicting epidemic outcomes. However, it only utilizes the local structural information to depict node importance; the whole structural information is still not in use. It is generally assumed that metrics for ranking node importance should be defined on the local level for each node, “The one thing that all agree on is that centrality is a node-level construct [29]”. This leaves open the question whether it is able to utilize the graph-level structural information to evaluate the local-level node importance more efficiently.
The main contribution of this work is to borrow network entropy, which is defined to depict the structural complexity at the graph level, to characterize the node importance at the node level. Node importance is defined as the network entropy variation before and after its removal. Just like other state-of-the-art node importance ranking methods, the proposed method is also used to make use of structural information. However, the structural information here is at the systematical level, not the local level. Since more structural information of the network is utilized, better performance is expected. We will conduct empirical investigations on several real life complex networks to demonstrate the feasibility and the superiority of the proposed method. Results will show that this novel entropic metric outperforms other state-of-the-art metrics in identifying the top-k most important nodes.
The remainder of this paper is organized as follows. Section 2 describes the proposed entropic metric to quantify node importance and the algorithm to rank the top-k most important nodes. And eight real life networks, Snake Idioms Network, and seven other well-known networks, on which our empirical investigations will be conducted, are also depicted in this section. The experiment results are described in Section 3. The necessary conclusions, interpretations, and further directions are discussed in Section 4.
2. Materials and Methods
2.1. Methods
In the sense that the influence of a node is largely affected and reflected by the topological structure of the network it belongs to [6], we propose an entropic metric, namely Entropy Variation, which utilizes the whole structural information for node importance evaluation.
2.1.1. Entropy Variation as a Metric of Node Importance
A directed graph consists of a set of elements called nodes (or vertices) together with a set of ordered pairs of nodes called edges. If is an edge, is called the tail of the edge and is called the head of the edge. The number of the nodes, , is called the order of the graph and the number of the edges, , is called the size of the graph.
For convenience, we reproduce the definition of Shannon’s entropy (as in [40]).
Definition 1.
Let be a probability vector, namely, and . The Shannon’s entropy of is defined as:
Let be a tuple of non-negative integers . This tuple forms a probability distribution , where
Therefore, the entropy of the tuple is given by
Definition 2.
For a node in graph and an arbitrary information function , we define:
Since , we can interpret as probabilities.
Definition 3.
The entropy of graph with the information function is defined as:
In our study, the information functions of are defined as its degree and betweenness, the former is of a radial walk structure, while the latter is of a medial walk structure [29].
For a directed graph, we can calculate the entropy on the basis of in-degree, out-degree, and all-degree, respectively, by setting , and .
The information functions employed in our study are as follows:
Here, and denote the in-degree and out-degree of node . And . denotes the betweeness of .
Definition 4.
The importance of node in graph with information function is defined as the Entropy Variation under the removal of node :
Here, is the modified graph under the removal of .
Accordingly, for a node in a directed graph , its importance can be defined as the variation of the in-degree entropy, out-degree entropy, or all-degree entropy, respectively.
And the node importance in our study is calculated as follows:
The physical meaning of the proposed Entropy Variation is: to what extent the whole system’s entropy will change if one node and its connections are removed from the network. Thus Entropy Variation can be treated as the node’s influence on structure, and naturally we can treat it as the node importance.
Network entropy characterizes the amount of information encoded in the network structure. While defining node importance as Entropy Variation, we are of course making use of structural information, just as other state-of-the-art methods do. However, the information is no longer the connectivity pattern among its neighbors or through paths, but the network structure property as a whole.
2.1.2. Rank the Top-k Most Important Nodes
On the basis of the node importance definition mentioned above, the algorithm to rank the top-k most important nodes in graph is as follows:
The algorithm is a two-stage process. The first half, from step 1 to step 6, is to calculate the importance or the Entropy Variation of each node, resulting in a numeric importance sequence, and the latter part, from step 7 to step 9, is to rank this sequence in descending order and obtain the top-k nodes as our target.
In Algorithm 1, we have to calculate the network entropy for each node in the network, thus the time complexity of the proposed algorithm is the time complexity of computing the network entropy multiplied by the number of nodes in the network, namely . Here, is the time complexity of the specific entropy estimation algorithm. For example, if the time complexity of entropy estimation (as depicted in [41]), the time complexity of the proposed algorithm is , with as the number of the nodes. A detailed discussion of the entropy estimation is beyond the scope of this work, and we refer to [42].
| Algorithm 1. Rank the Top-k Most Important Nodes. | |
| Input: | Graph with |
| Output: | Top-k most important nodes with their corresponding importance series |
| 1: | Calculate , the entropy of graph as in Equation (5) |
| 2: | For each do |
| 3: | Generate by removing from as in Equation (11) |
| 4: | Calculate , the entropy of as in Equation (5) |
| 5: | Set the importance of as in Equation (10) |
| 6: | End for |
| 7: | Get the importance sequence: |
| 8: | Get the descending importance series: |
| 9: | Return , the first elements of |
2.1.3. Performance Evaluation
There are several evaluation criteria for the performance of node importance ranking methods, such as susceptibility [43] and robustness [44], with the size of the strongly connected component (SCC) being the most popular one [45,46]. Our evaluation criteria is also defined on the basis of the SCC size. We will define the Strongly Connected Component at first.
Definition 5.
Let be a digraph and , A path from to is a sequence of nodes where for each , is an edge. If there is such a path, is said to be reachable from . A directed graph is strongly connected if there is a path between all pairs of nodes, namely, any two nodes are mutually reachable. A strongly connected component of a directed graph is the maximal strongly connected subgraph.
To compare the performance of the proposed ranking method with other state-of-the-art methods, we will mainly investigate the nodes’ importance for network connectivity. Each method gives a ranking sequence of nodes according to the corresponding importance metric. We sequentially remove the nodes from the top-ranked ones and calculate the SCC size after the cumulative removal. Our final performance index will be the decreasing ratio of the resulting after the top-k nodes’ removal to , the SCC size of with no node removal.
Obviously, according to the objective function of the network connectivity, the bigger the r(k) is, the better the ranking method is. Our evaluation criteria here is under the assumption that if the removal of important nodes picked by a certain method leads to the widest failure or connectivity damage, that method will get the highest r(k) score.
2.2. Materials
In order to validate the proposed method, we will conduct our investigations on the Snake Idioms Network and several other real life networks. Since it is the first time for modeling the Snake Idioms as a complex network, we will describe the network formation model in detail.
2.2.1. Snake Idioms Network
Idioms are the crystallization of Chinese culture. Learning idioms can help Chinese learners understand Chinese culture, cultivate their Chinese thinking, enhance their language sense, and facilitate daily communication [47,48]. With idioms as the focus of the senior stage of the foreign students, experts also proposed a variety of teaching methods in teaching Chinese idioms [49], and one of the educational games, Snake Idioms, is very popular in China.
Like other word chain games, such as Shiritori that originated from Japan [50], Snake Idioms is played by chaining the Chinese idioms, and the last syllable of the previous idiom becomes the first syllable of the next idiom. Snake Idioms are in the form: , where the last character of is the same as the first character of , . In the difficult game mode, it is required that , which means the last idiom should be the same as the first idiom and at this time . If , there are only two idioms in the chain, such as 一飞冲天 (yì fēi chōng tiān) → 天下第一 (tiān xià dì yī) → 一飞冲天 (yì fēi chōng tiān).
We obtain the Chinese idioms from Chinese Idiom Dictionary published by the Commercial Press [51], which is the most authoritative and popular idiom dictionary in China. In [51], there are 4602 items in total, forming countless idiom chains. Since these chains are intertwined together, i.e., one idiom can be a node in several chains, they represent a complex systems-phenomenon which is suitable to be modeled as a network. The Snake Idioms Network is defined as:
Definition 6.
Snake Idioms Network is a directed graph denoted , is a set of idioms as nodes and is a set of ordered pairs of nodes (Chinese idioms here) .
According to Definition 6, we can visualize the Snake Idioms Network with the R language [52] and its add-on packages visNetwork [53] and ggplot2 [54] as shown in Figure 1.
The order of the Snake Idioms Network is 4234 and the size is 21,067. There are 368 isolated nodes which cannot be chained, such as 爱才若渴 (ài cái ruò kě), 爱毛反裘 (ài máo fǎn qiú), and 按图索骥 (àn tú suǒ jì). These isolated idioms are not included in this network. The network density is 0.001175448 which means the network is a sparse one. The diameter of the Snake Idioms Network is 16 and the average path length is 6.14, which means that when we chain the idioms with two certain idioms as the beginning and the end, the most efficient way is to finish it by 6.14 steps. That is, if we are on the right path, we can go back to the start idiom in about six steps.
There are 1907 idioms in the strongly connected component. As in other networks, SCC size is of significant physical meaning: randomly pick up to two nodes in SCC, and there will always be a path from one to the other. As for Snake Idioms gamers, the SCC size stands for the ability of successfully complete the word-chain game, because given any two idioms selected from the SCC as the beginning and end idioms, he can always chain them together.
2.2.2. Other Well-Known Networks to Be Investigated
In order to seek more universal conclusions, we will also conduct our investigations on seven other well-known networks which have been reported in previous studies: Air Traffic Control [56] was constructed from the USA’s Federal Aviation Administration, National Flight Data Center (NFDC). Nodes in this network represent airports or service centers and links are created from strings of preferred routes recommended by the NFDC. Blogs [57] is a directed network contains front-page hyperlinks between blogs in the context of the 2004 US election. A node represents a blog and an edge represents a hyperlink between two blogs. Gnutella [58] is a peer-to-peer file sharing network. Nodes represent hosts and edges represent connections between the hosts. Hens [59] is a directed network that contains the peck order of 32 White Leghorn hens. A node represents a hen and an edge represents dominance of the left hen over the right hen. High School [60] contains friendships between boys in a small high school in Illinois. A node represents a boy and an edge between two boys shows that the left boy chose the right boy as a friend. Neural [61] is the neural network of the worm Caenorhabditis Elegans, where an edge joins two neurons if they are connected by either a synapse or a gap junction. Physicians [62] captures innovation spread among 246 physicians in towns in Illinois; Peoria, Bloomington, Quincy, and Galesburg. A node represents a physician and an edge between two physicians shows that the left physician told that the right physician is his friend or that he turns to the right physician if he needs advice or is interested in a discussion.
The data of these networks are downloaded from the Stanford Large Network Dataset Collection [63] and the Koblenz Network Collection [64].
The basic statistical features of these seven networks along with the Snake Idioms network are listed in Table 1.
3. Results
3.1. On the Snake Idioms Network
We can calculate the entropy variations of each node for the Snake Idioms Network with the methods depicted in Section 2.1, and the results are shown in Figure 2.
We depict the entropy variation with both barplots and boxplots as in Figure 2. The height of the barplot represents the entropy variation after the removal of each node, while the boxplot can visualize the distribution of the entropy variation. The five important percentiles of these Entropy Variations are listed in Table 2.
Although the Entropy Variation is calculated on the basis of degree (or betweenness), it is of higher resolution than degree (or betweenness) itself. Taking the in-degree as an example, there are 1268 distinct Entropy Variation values for the 4234 nodes in the Snake Idioms Network, compared to only 29 different in-degree values. On average, with the proposed method, about 4234/1238 ≈ 3.42 nodes will share the same node importance, while with the in-degree centrality, 4234/29 ≈ 132.21 nodes have to be of the same node importance. For two nodes with the same node importance, what we can do is rank it randomly. In this sense, the proposed entropic metric has greater resolving power than the basic degree function. The reason may be that degree only counts how many neighbors there are for each node in the local view, while the Entropy Variation gains a deeper insight in the connectivity pattern and reveals more structural information in the global view.
Considering that several nodes share the same centrality scores, we will conduct a large number of randomizations while calculating the r(k) scores and observe their disturbance. Figure 3 shows the r(k) disturbances for in-degree centrality and the proposed Entropy Variation (also with in-degree as its information function).
One can observe that the in-degree (DEin) is of much greater divergence than Entropy Variation (EnVin). In this sense, the Entropy Variation calculated on the basis of in-degree is much more robust than in-degree itself. In view of the possible r(k) disturbances, the results in the following parts of this work will be the mean values after 50 times of randomization (random permutations of the nodes which have the same centrality scores).
Since the top-k largest-degree nodes are usually considered as the benchmark of node importance ranking in many applications [6,15], we will firstly compare Entropy Variation with the Degree centrality, and the results are shown in Figure 4.
The comparative plot in Figure 4 suggests that the performance of the Entropy Variation (either with in-degree, out-degree, or betweenness) has been notably improved than that of the Degree centralities, though Entropy Variation is calculated on the basis of degree (or betweenness). For a comprehensive comparison, we will sum over r(k) from k = 1 to k = 800. Entropy Variation with betweenness wins the best performance, with the sum of r(k) as 548.27, while the sum of r(k) for out-degree is only 440.42. Thus the r(k) is raised by almost a quarter (24.49%).
As mentioned before, there are several methods proposed to rank node importance, other than the basic degree centrality. We will conduct further comparative investigations on Snake Idioms Network among different methods, removing the top-10, top-50, top-100, and top-150 most important nodes according to different metrics. The resulting r(k) values are depicted in the dodged bar plot form, as shown in Figure 5. The numeric values are arranged in Table 3.
One can observe that, for the Snake Idioms Network, the performance of these methods can be ranked as: Entropy Variation (in) > Betweenness > Entropy Variation (all) > Load > Expected Force > Entropy Variation (betweenness) > Degree (all) > Entropy Variation (out) > Stress > Degree (out) > Closeness (all) > Page Rank > H-index (out) > Eigen Vector > H-index (all) > Information Centrality > Degree (in) > Bonacich Alpha centrality > HITs (hub) > Coreness (out) > HITs (authority) > H-index (in) > Coreness (in) > Subgraph centrality > Eccentricity (in) > Eccentricity (out) > Coreness (all) > Eccentricity (all) > Closeness (in) > Closeness (out).
If we just pick up the best one from the three modes “in”, “out”, and “all” for each method, they can be ranked as: Entropy Variation > Betweenness > Load > Expected Force > Degree > Stress > Closeness > Page Rank > H-index > Eigen Vector > Information Centrality > Bonacich Alpha centrality > HITs > Coreness > Subgraph centrality > Eccentricity.
The proposed ranking method outperforms all other state-of-the-art methods and the advantage is notable. Compared with the second best method, betweeness, the proposed Entropy Variation raises the r(k = 10), r(k = 50), r(k = 100), r(k = 150) by 154.13%, 101.08%, 16.94%, and 22.57%, respectively. Comprehensively, the sum of r(k) is raised by 42.95% (as in the penultimate column in Table 3).
3.2. On Other Well-Known Networks
In order to validate the feasibility of the proposed method in a broader range, we will conduct our investigations on more well-known networks, which have been reported in [57,58,59,60,61,62].
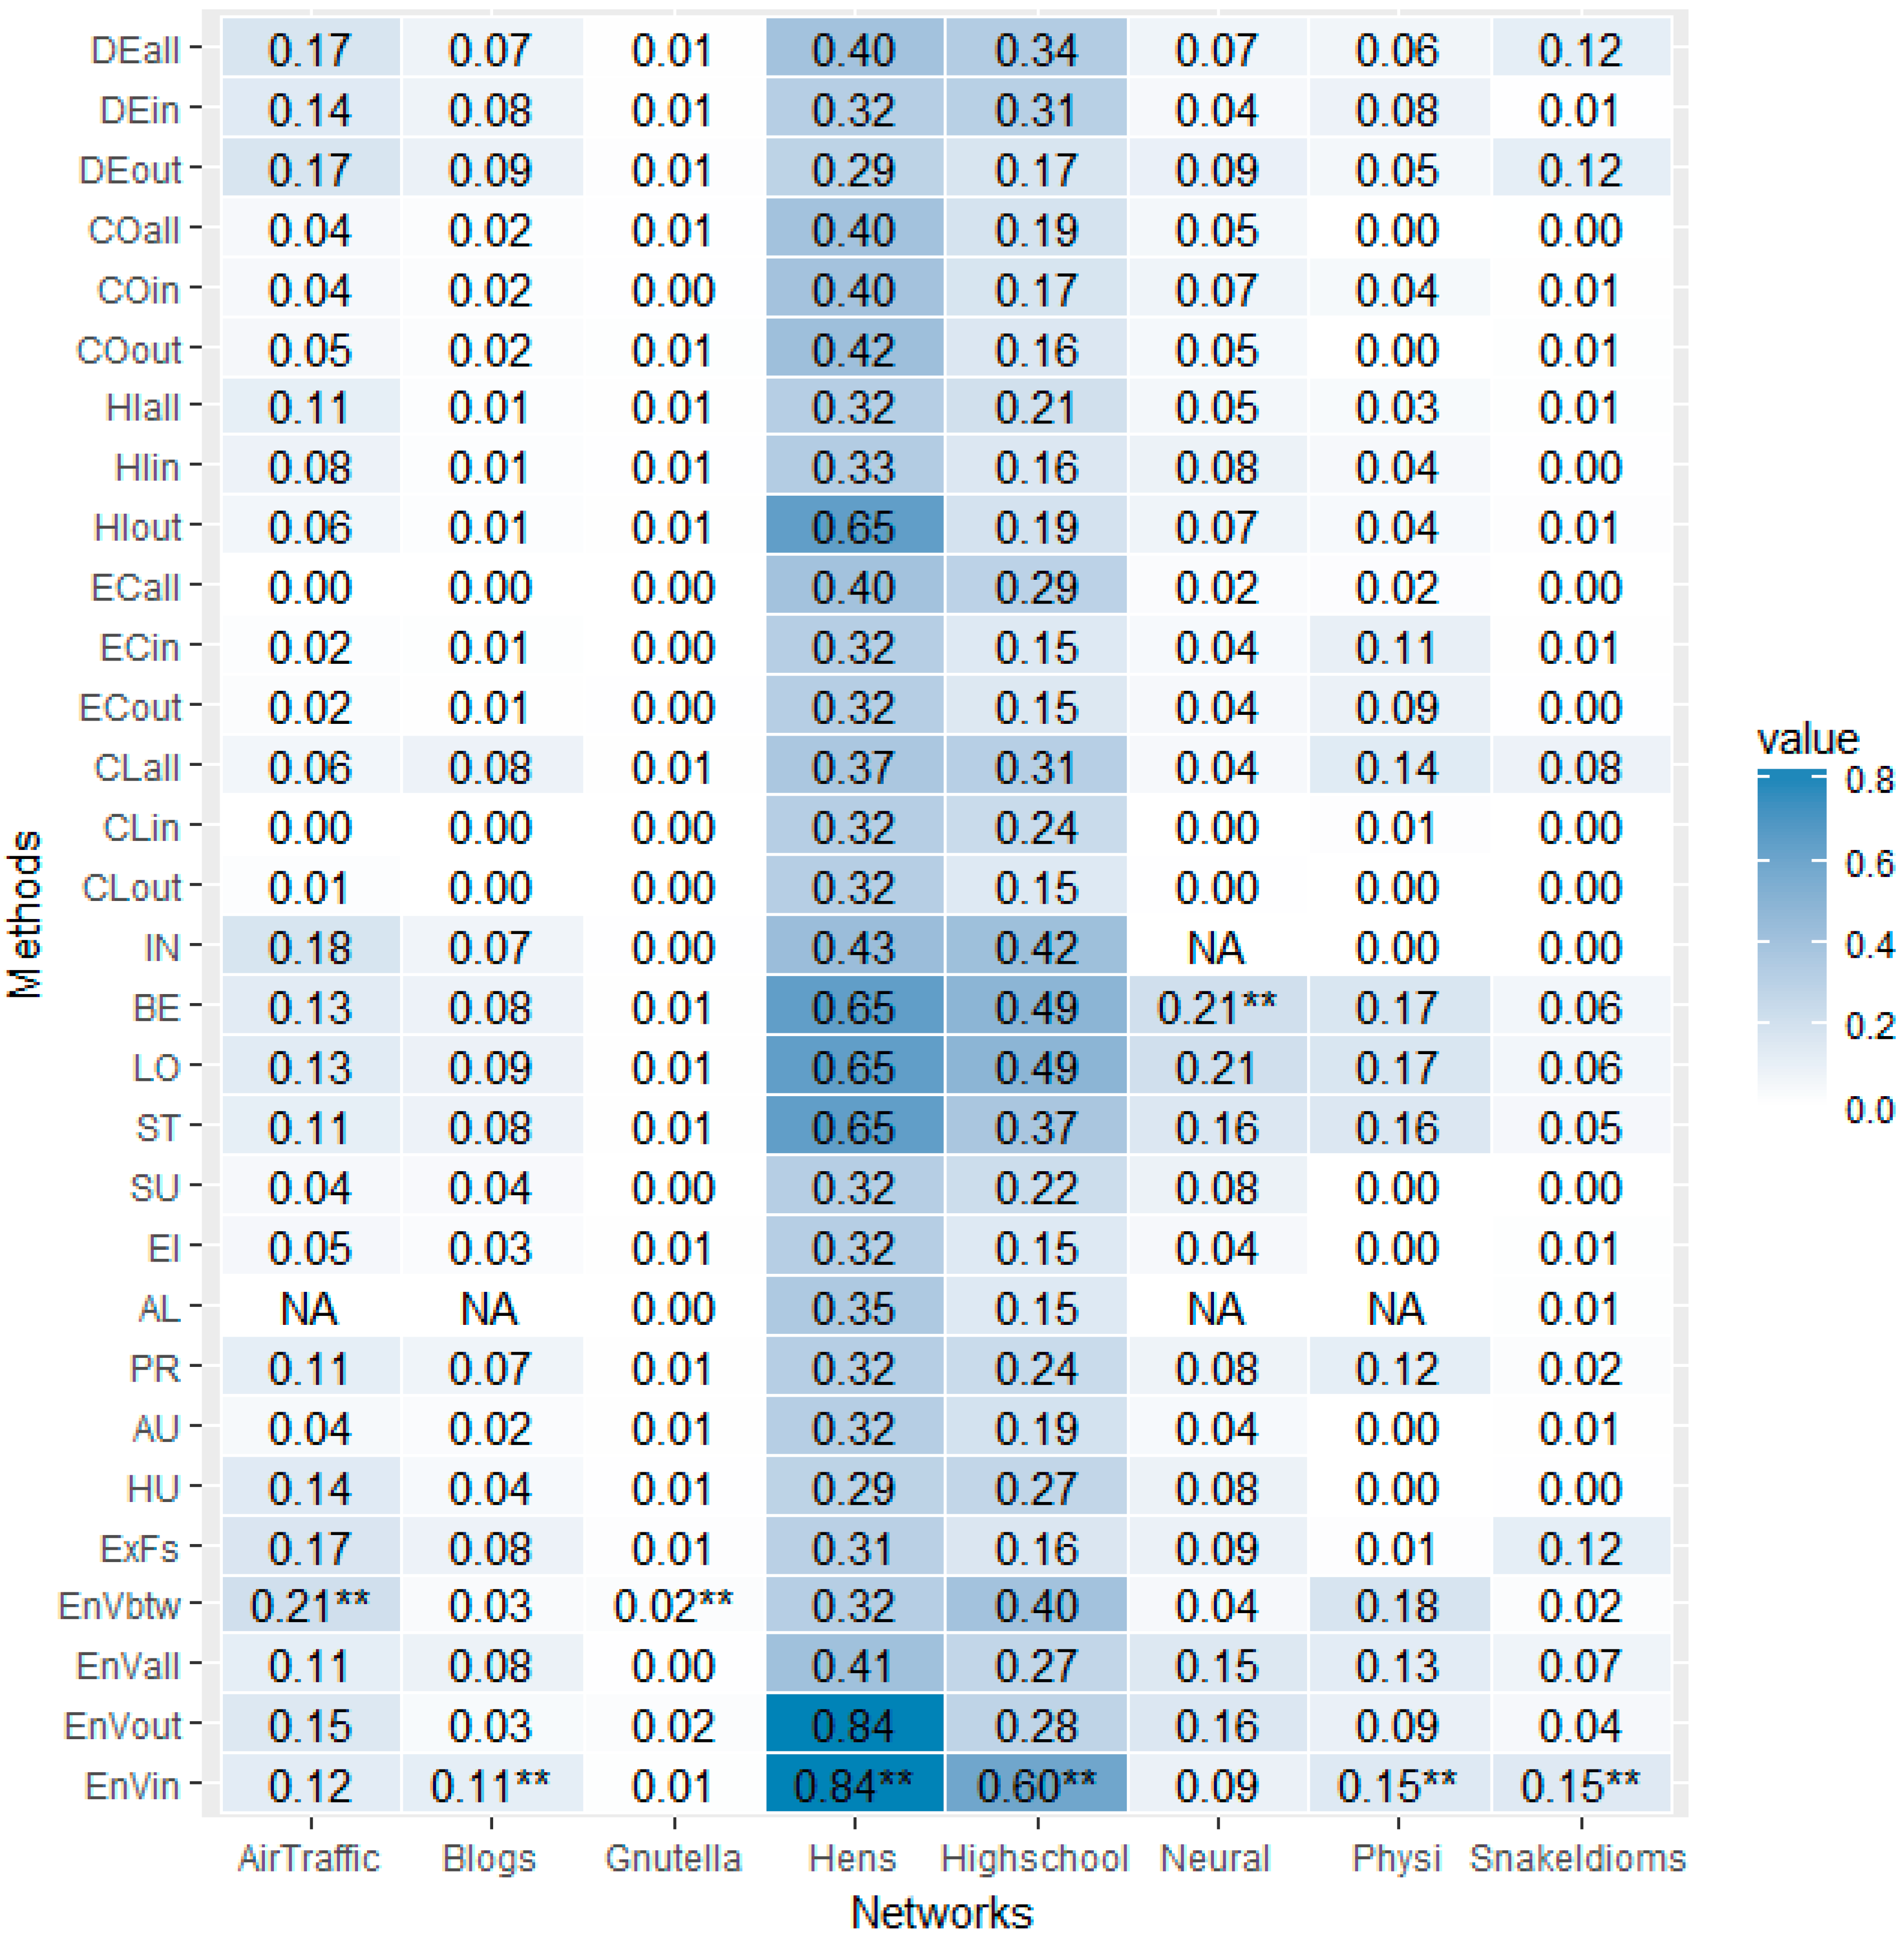
Considering that the orders of the networks (#node, number of nodes) differ greatly, ranging from 32 (the Hens network) to 6301 (the Gnutella network), we will only calculate the r(k = 10). Given the r(k = 10) values are not scaled by the orders of the networks, our attention is focused mainly on each column, comparing the r(k) values in the same column, which reveals the performance of different methods on the same network. The r(k = 10) values of different methods on different networks are arranged as a matrix, as shown in Figure 6.
It can be seen that the darkest parts of most of the columns lie in the last four lines, which reveals the advantage of the proposed Entropy Variation, regardless of its different information functions. More specifically, the last line, Entropy Variation with in-degree as its information function (EnVin), is marked with “**” five times, which indicates that, for five of the eight networks, namely, Blogs, Hens, High School, Physicians and Snake Idioms Network, the entropic metric, EnVin, outperforms all other ranking methods. For the other two networks, Air Traffic Control (AirTraffic) and Gnutella, Entropy Variation with betweenness (EnVbtw) performs the best. It should be mentioned that the proposed Entropy Variation is not always the best, such as in the case of Neural network, where betweenness gains the highest r(k) score.
4. Discussion and Conclusions
Network entropy is usually utilized to characterize the amount of information encoded in the network structure and to measure the structural complexity at the graph level. In this study, we borrow the network entropy to quantify and rank node importance at the node level. We propose an entropic metric, Entropy Variation, defining the node importance as the variation of network entropy before and after its removal, according to the assumption that the removal of a more important node is likely to cause more structural variation. Like other state-of-the-art methods for ranking node importance, the proposed entropic metric is also used to utilize structural information, but at the systematical level, not the local level. Empirical investigations on the Snake Idioms Network, and seven other well-known real-life networks demonstrate the superiority of the proposed entropic metric. Results show that the proposed method notably outperforms other methods such as Degree, Closeness, Coreness, Eccentricity, H-index, Eigenvector, Page Rank, HITs, Subgraph centrality, Information centrality, Bonacich Alpha centrality, Betweenness, Load, Stress, and the recently proposed entropic metric Expected Force.
As for the empirical investigation, we model the educational game Snake Idioms as a complex network, which helps to capture the holistic scenario of the complex system. Applying the proposed ranking method on this real life network, we are able to pick up the most important idioms, whose absence will cause the widest failure of the game. The results here can provide an important reference for Chinese idioms teaching.
For the proposed Entropy Variation, the point is to take advantage of the holistic structure information to evaluate the importance of each node. Being a graph level metric, more structure information is utilized and the empirical investigations show that the performance is better. However, sometimes the whole structure of the network is not always able to be captured. In that case, Entropy Variation is not suitable and we might resort to local level methods such as degree [16] and Expected Forces [39].
Another drawback of the proposed method is the computational complexity, in comparison with some of the existing centrality metrics such as degree. The proposed algorithm may take some time to run since we have to delete the node one by one and calculate the network entropy time and time again after each node removal. Though the proposed algorithm is in a loop structure, parallel computation is recommended, because the entropy variation computation for each node is mutually independent. In practical terms, we run our program written in the R language with add-on packages doParallel [68] and foreach [69] on a laptop, Lenovo T450 with Inter Core i7-5500U CPU, and it took 28.476 s (for the Snake Idioms Network).
It must be remarked that the responses to node removal differ from system to system and many complex networks display different levels of vulnerability against node removals. A centrality which is optimal for one application is sometimes sub-optimal for a different application, and it is impossible to find a universal index that best quantifies nodes’ importance in every situation [6,29,70]. In order to seek more universal conclusions, we will conduct our investigations on more empirical and theoretical networks in the future.
Acknowledgments
This work was partially supported by the National Natural Science Foundation of China under Grant Nos. 61503034, 61627816, and the National Key Research and Development Program of China under Grant No. 2016YFC0701309-01.
Conflicts of Interest
The author declares no conflict of interest.
References
- Ye, C.; Wilson, R.C.; Comin, C.H.; Costa, L.D.; Hancock, E.R. Approximate von Neumann entropy for directed graphs. Phys. Rev. E Stat. Nonlinear Soft Matter Phys. 2014, 5, 052804. [Google Scholar] [CrossRef] [PubMed]
- Gao, Z.K.; Zhang, S.S.; Dang, W.D.; Li, S.; Cai, Q. Multilayer network from multivariate time series for characterizing nonlinear flow behavior. Int. J. Bifurc. Chaos 2017, 27, 1750059. [Google Scholar] [CrossRef]
- Gao, Z.K.; Cai, Q.; Yang, Y.X.; Dong, N.; Zhang, S.S. Visibility graph from adaptive optimal kernel time-frequency representation for classification of epileptiform EEG. Int. J. Neural Syst. 2017, 27, 1750005. [Google Scholar] [CrossRef] [PubMed]
- Gao, Z.K.; Dang, W.D.; Yang, Y.X.; Cai, Q. Multiplex multivariate recurrence network from multi-channel signals for revealing oil-water spatial flow behavior. Chaos 2017, 27, 035809. [Google Scholar] [CrossRef] [PubMed]
- Gao, Z.K.; Small, M.; Kurths, J. Complex network analysis of time series. EPL 2016, 116, 50001. [Google Scholar] [CrossRef]
- Lü, L.; Chen, D.; Ren, X.L.; Zhang, Q.M.; Zhang, Y.C.; Zhou, T. Vital nodes identification in complex networks. Phys. Rep. 2016, 650, 1–63. [Google Scholar] [CrossRef]
- Chen, D.; Lü, L.; Shang, M.S.; Zhang, Y.C.; Zhou, T. Identifying influential nodes in complex networks. Phys. A Stat. Mech. Appl. 2012, 4, 1777–1787. [Google Scholar] [CrossRef]
- Kitsak, M.; Gallos, L.K.; Havlin, S.; Liljeros, F.; Muchnik, L.; Stanley, H.E.; Makse, H.A. Identification of influential spreaders in complex networks. Nat. Phys. 2010, 6, 888–893. [Google Scholar] [CrossRef]
- Zhang, H.; Guan, Z.H.; Li, T.; Zhang, X.H.; Zhang, D.X. A stochastic sir epidemic on scale-free network with community structure. Phys. A Stat. Mech. Appl. 2013, 392, 974–981. [Google Scholar] [CrossRef]
- Richardson, M.; Domingos, P. Mining knowledge-sharing sites for viral marketing. In Proceedings of the Eighth ACM SIGKDD International Conference on Knowledge Discovery and Data Mining (KDD’02), New York, NY, USA, 23–25 July 2002; pp. 61–70. [Google Scholar]
- Radicchi, F.; Fortunato, S.; Markines, B.; Vespignani, A. Diffusion of scientific credits and the ranking of scientists. Phys. Rev. E Stat. Nonlinear Soft Matter Phys. 2009, 80, 056103. [Google Scholar] [CrossRef] [PubMed]
- Chen, P.; Xie, H.; Maslov, S.; Redner, S. Finding scientific gems with Google’s PageRank algorithm. J. Informetr. 2008, 1, 8–15. [Google Scholar] [CrossRef]
- Csermely, P.; Korcsmáros, T.; Kiss, H.J.M.; London, G.; Nussinov, R. Structure and dynamics of molecular networks: A novel paradigm of drug discovery. Pharmacol. Ther. 2013, 3, 333–408. [Google Scholar] [CrossRef] [PubMed]
- Albert, R.; Albert, I.; Nakarado, G.L. Structural vulnerability of the North American power grid. Phys. Rev. E Stat. Nonlinear Soft Matter Phys. 2004, 69, 025103. [Google Scholar] [CrossRef] [PubMed]
- Estrada, E.; Hatano, N. A vibrational approach to node centrality and vulnerability in complex networks. Phys. A Stat. Mech. Appl. 2009, 17, 3648–3660. [Google Scholar] [CrossRef]
- Chen, G.R.; Wang, X.F.; Li, X. Introduction to Complex Networks: Models, Structures and Dynamics; Higher Education Press: Beijing, China, 2012. [Google Scholar]
- Freeman, L.C. Centrality in social networks conceptual clarification. Soc. Netw. 1979, 3, 215–239. [Google Scholar] [CrossRef]
- Hage, P.; Harary, F. Eccentricity and centrality in networks. Soc. Netw. 1995, 1, 57–63. [Google Scholar] [CrossRef]
- Korn, A.; Schubert, A.; Telcs, A. Lobby index in networks. Phys. A Stat. Mech. Appl. 2008, 11, 2221–2226. [Google Scholar] [CrossRef]
- Hébertdufresne, L.; Allard, A.; Young, J.G.; Dubé, L.J. Global efficiency of local immunization on complex networks. Sci. Rep. 2012, 8, 2171. [Google Scholar]
- Brin, S.; Page, L. Reprint of: The anatomy of a large-scale hypertextual web search engine. Comput. Netw. 2012, 18, 3825–3833. [Google Scholar] [CrossRef]
- Kleinberg, J.M. Authoritative Sources in a Hyperlinked Environment. J. ACM 1999, 5, 604–632. [Google Scholar] [CrossRef]
- Estrada, E.; Rodríguez-Velázquez, J.A. Subgraph centrality in complex networks. Phys. Rev. E Stat. Nonlinear Soft Matter Phys. 2005, 2, 056103. [Google Scholar] [CrossRef] [PubMed]
- Stephenson, K.; Zelen, M. Rethinking centrality: Methods and examples. Soc. Netw. 1989, 1, 1–37. [Google Scholar] [CrossRef]
- Bonacich, P.; Paulette, L. Eigenvector-like measures of centrality for asymmetric relations. Soc. Netw. 2001, 23, 191–201. [Google Scholar] [CrossRef]
- Freeman, L.C. A set of measures of centrality based on betweenness. Sociometry 1977, 1, 35–41. [Google Scholar] [CrossRef]
- Brandes, U. On Variants of Shortest-Path Betweenness Centrality and their Generic Computation. Soc. Netw. 2008, 30, 136–145. [Google Scholar] [CrossRef]
- Shimbel, A. Structural Parameters of Communication Networks. Bull. Math. Biophys. 1953, 15, 501–507. [Google Scholar] [CrossRef]
- Borgatti, S.P.; Everett, M.G. A graph-theoretic perspective on centrality. Soc. Netw. 2006, 4, 466–484. [Google Scholar] [CrossRef]
- Buldyrev, S.V.; Parshani, R.; Paul, G.; Stanley, H.E.; Havlin, S. Catastrophic cascade of failures in interdependent networks. Nature 2010, 7291, 1025–1028. [Google Scholar] [CrossRef] [PubMed]
- Anand, K.; Krioukov, D.; Bianconi, G. Entropy distribution and condensation in random networks with a given degree distribution. Phys. Rev. E Stat. Nonlinear Soft Matter Phys. 2014, 6, 062807. [Google Scholar] [CrossRef] [PubMed]
- Wu, L.; Tan, Q.; Zhang, Y. Network connectivity entropy and its application on network connectivity reliability. Phys. A Stat. Mech. Appl. 2013, 21, 5536–5541. [Google Scholar] [CrossRef]
- Sorkhoh, I.; Mahdi, K.; Safar, M. Cyclic Entropy of Complex Networks. In Proceedings of the IEEE/AXM International Conference on Advances in Social Networks Analysis and Mining, Istanbul, Turkey, 26–29 August 2012; pp. 1050–1055. [Google Scholar]
- Nie, T.; Guo, Z.; Zhao, K.; Lu, Z.M. Using mapping entropy to identify node centrality in complex networks. Phys. A Stat. Mech. Appl. 2016, 453, 290–297. [Google Scholar] [CrossRef]
- Yuan, P.; Ma, H.; Fu, H. Hotspot-entropy based data forwarding in opportunistic social networks. Pervasive Mob. Comput. 2015, 16, 136–154. [Google Scholar] [CrossRef]
- Franzosi, R.; Felice, D.; Mancini, S.; Pettini, M. Riemannian-geometric entropy for measuring network complexity. Phys. Rev. E Stat. Nonlinear Soft Matter Phys. 2016, 93, 062317. [Google Scholar] [CrossRef] [PubMed]
- Chehreghani, M.H.; Abdessalem, T. Upper and lower bounds for the q -entropy of network models with application to network model selection. Inf. Process. Lett. 2017, 119, 1–8. [Google Scholar] [CrossRef]
- Chen, B.; Wang, Z.X.; Chen, L. Integrated evaluation approach for node importance of complex networks based on relative entropy. J. Syst. Eng. Electron. 2016, 6, 1219–1226. [Google Scholar] [CrossRef]
- Lawyer, G. Understanding the influence of all nodes in a network. Sci. Rep. 2015, 5, 8665. [Google Scholar] [CrossRef] [PubMed]
- Cao, S.; Dehmer, M.; Shi, Y. Extremality of degree-based graph entropies. Inf. Sci. 2014, 10, 22–33. [Google Scholar] [CrossRef]
- Lu, L.; Tan, Q.M. Maximum entropy distribution algorithm and its application. Syst. Eng. Electron. 2007, 29, 820–822. [Google Scholar]
- Schürmann, T. A note on entropy estimation. Neural Comput. 2015, 27, 2097. [Google Scholar] [CrossRef] [PubMed]
- Cheng, X.Q.; Ren, F.X.; Shen, H.W.; Zhang, Z.K.; Zhou, T. Bridgeness: A Local Index on Edge Significance in Maintaining Global Connectivity. J. Stat. Mech. Theory Exp. 2010, 10, 595–685. [Google Scholar] [CrossRef]
- Schneider, C.M.; Moreira, A.A.; José, A.J., Jr.; Havlin, S.; Herrmann, H.J. Mitigation of malicious attacks on networks. Proc. Natl. Acad. Sci. USA 2011, 10, 3838–3841. [Google Scholar] [CrossRef] [PubMed]
- Trajanovski, S.; Martínhernández, J.; Winterbach, W.; van Mieghem, P. Robustness envelopes of networks. J. Complex Netw. 2013, 1, 44–62. [Google Scholar] [CrossRef]
- Fan, W.L.; Liu, Z.G.; Hu, P. Identifying node importance based on information entropy in complex networks. Phys. Scr. 2013, 6, 5201. [Google Scholar]
- Wang, L.; Yu, S.; Wang, Z.; Qu, W.; Wang, H. A Study on Metaphors in Idioms Based on Chinese Idiom Knowledge Base. Lect. Notes Comput. Sci. 2014, 8922, 434–440. [Google Scholar]
- An, Y.; Wang, S. Narrative Idioms for Elementary-Level Chinese as a Second Language Learners. Lect. Notes Comput. Sci. 2015, 9332, 457–464. [Google Scholar]
- Liang, W.; Shi, Y.; Chi, K.T.; Liu, J.; Wang, Y.; Cui, X. Comparison of co-occurrence networks of the Chinese and English languages. Phys. A Stat. Mech. Appl. 2009, 23, 4901–4909. [Google Scholar] [CrossRef]
- Kobayashi, H.; Tanio, K.; Sassano, M. Effects of game on user engagement with spoken dialogue system. In Proceedings of the 16th Annual Meeting of the Special Interest Group on Discourse and Dialogue, Prague, Czech Republic, 2–4 September 2015; pp. 422–426. [Google Scholar]
- Dictionary Research Center. Chinese Idiom Dictionary, 6th ed.; Commercial Press: Beijing, China, 2016. [Google Scholar]
- R Core Team. R: A Language and Environment for Statistical Computing. R Foundation for Statistical Computing: Vienna, Austria, 2017; Available online: https://www.R-project.org/ (accessed on 12 May 2017).
- Almende, B.V.; Benoit, T. visNetwork: Network Visualization Using ‘vis.js’ Library. R Package Version 1.0.3. 2016. Available online: https://CRAN.R-project.org/package=visNetwork (accessed on 12 May 2017).
- Wickham, H. ggplot2: Elegant Graphics for Data Analysis; Springer-Verlag: New York, NY, USA, 2009. [Google Scholar]
- Pons, P.; Latapy, M. Computing Communities in Large Networks Using Random Walks. Lect. Notes Comput. Sci. 2005, 3733, 284–293. [Google Scholar]
- Federal Aviation Administration. Air Traffic Control System Command Center. Available online: http://www.fly.faa.gov/ (accessed on 12 May 2017).
- Adamic, L.A.; Glance, N. The political blogosphere and the 2004 U.S. election: Divided they blog. In Proceedings of the 3rd International Workshop on Link Discovery, Chicago, IL, USA, 21–25 August 2005; Volume 62, pp. 36–43. [Google Scholar]
- Leskovec, J.; Kleinberg, J.; Faloutsos, C. Graph evolution: Densification and shrinking diameters. ACM Trans. Knowl. Discov. Data 2007, 1, 2. [Google Scholar] [CrossRef]
- Guhl, A.M. Social behavior of the domestic fowl. Trans. Kansas Acad. Sci. 1968, 71, 379. [Google Scholar] [CrossRef] [PubMed]
- Coleman, J.S. Introduction to Mathematical Sociology; London Free Press: Glencoe, UK, 1964. [Google Scholar]
- Watts, D.J.; Strogatz, S.H. Collective dynamics of “small-world” networks. Nature 1998, 393, 440–442. [Google Scholar] [CrossRef] [PubMed]
- Coleman, J.; Katz, E.; Menzel, H. The diffusion of an innovation among physicians. Soc. Netw. 1977, 20, 107–124. [Google Scholar]
- Stanford Large Network Dataset Collection. Available online: http://snap.stanford.edu/data/index.html (accessed on 10 June 2017).
- Koblenz Network Collection. Available online: http://konect.uni-koblenz.de/ (accessed on 10 June 2017).
- Csardi, G.; Nepusz, T. The Igraph Software Package for Complex Network Research, InterJournal, Complex Systems 1695. 2006. Available online: http://igraph.org (accessed on 12 May 2017).
- Carter, T.B. sna: Tools for Social Network Analysis. R Package Version 2.4. 2016. Available online: https://CRAN.R-project.org/package=sna (accessed on 12 May 2017).
- Ai, X. Node Entropy Variation. 2017. Available online: https://github.com/byaxb/NodeEntropyVariation (accessed on 26 June 2017).
- Revolution, Analytics; Steve, Weston. doParallel: Foreach Parallel Adaptor for the ‘Parallel’ Package. R Package Version 1.0.10. 2015. Available online: https://CRAN.R-project.org/package=doParallel (accessed on 12 May 2017).
- Revolution, Analytics; Steve, Weston. foreach: Provides Foreach Looping Construct for R. R Package Version 1.4.3. 2015. Available online: https://CRAN.R-project.org/package=foreach (accessed on 12 May 2017).
- Jahanpour, E.; Chen, X. Analysis of complex network performance and heuristic node removal strategies. Commun. Nonlinear Sci. Numer. Simul. 2013, 12, 3458–3468. [Google Scholar] [CrossRef]
Figure 1.
The Snake Idioms Network: (a) A small network consists of only 20 Chinese idioms to demonstrate how the Snake Idioms Network is created. One of the idioms chain is 轩然大波 (xuān rán dà bō) → 波谲云诡 (bō jué yún guǐ) → 诡计多端 (guǐ jì duō duān) → 端倪可察 (duān ní kě chá) → 察言观色 (chá yán guān sè); (b) A network consists of all possible 4234 idioms from the Chinese Idioms Dictionary [51], which provides a holistic scenario. Communities of this network are detected using the random walks algorithm [55], and the communities are colored after k-means clustering for better visualization.
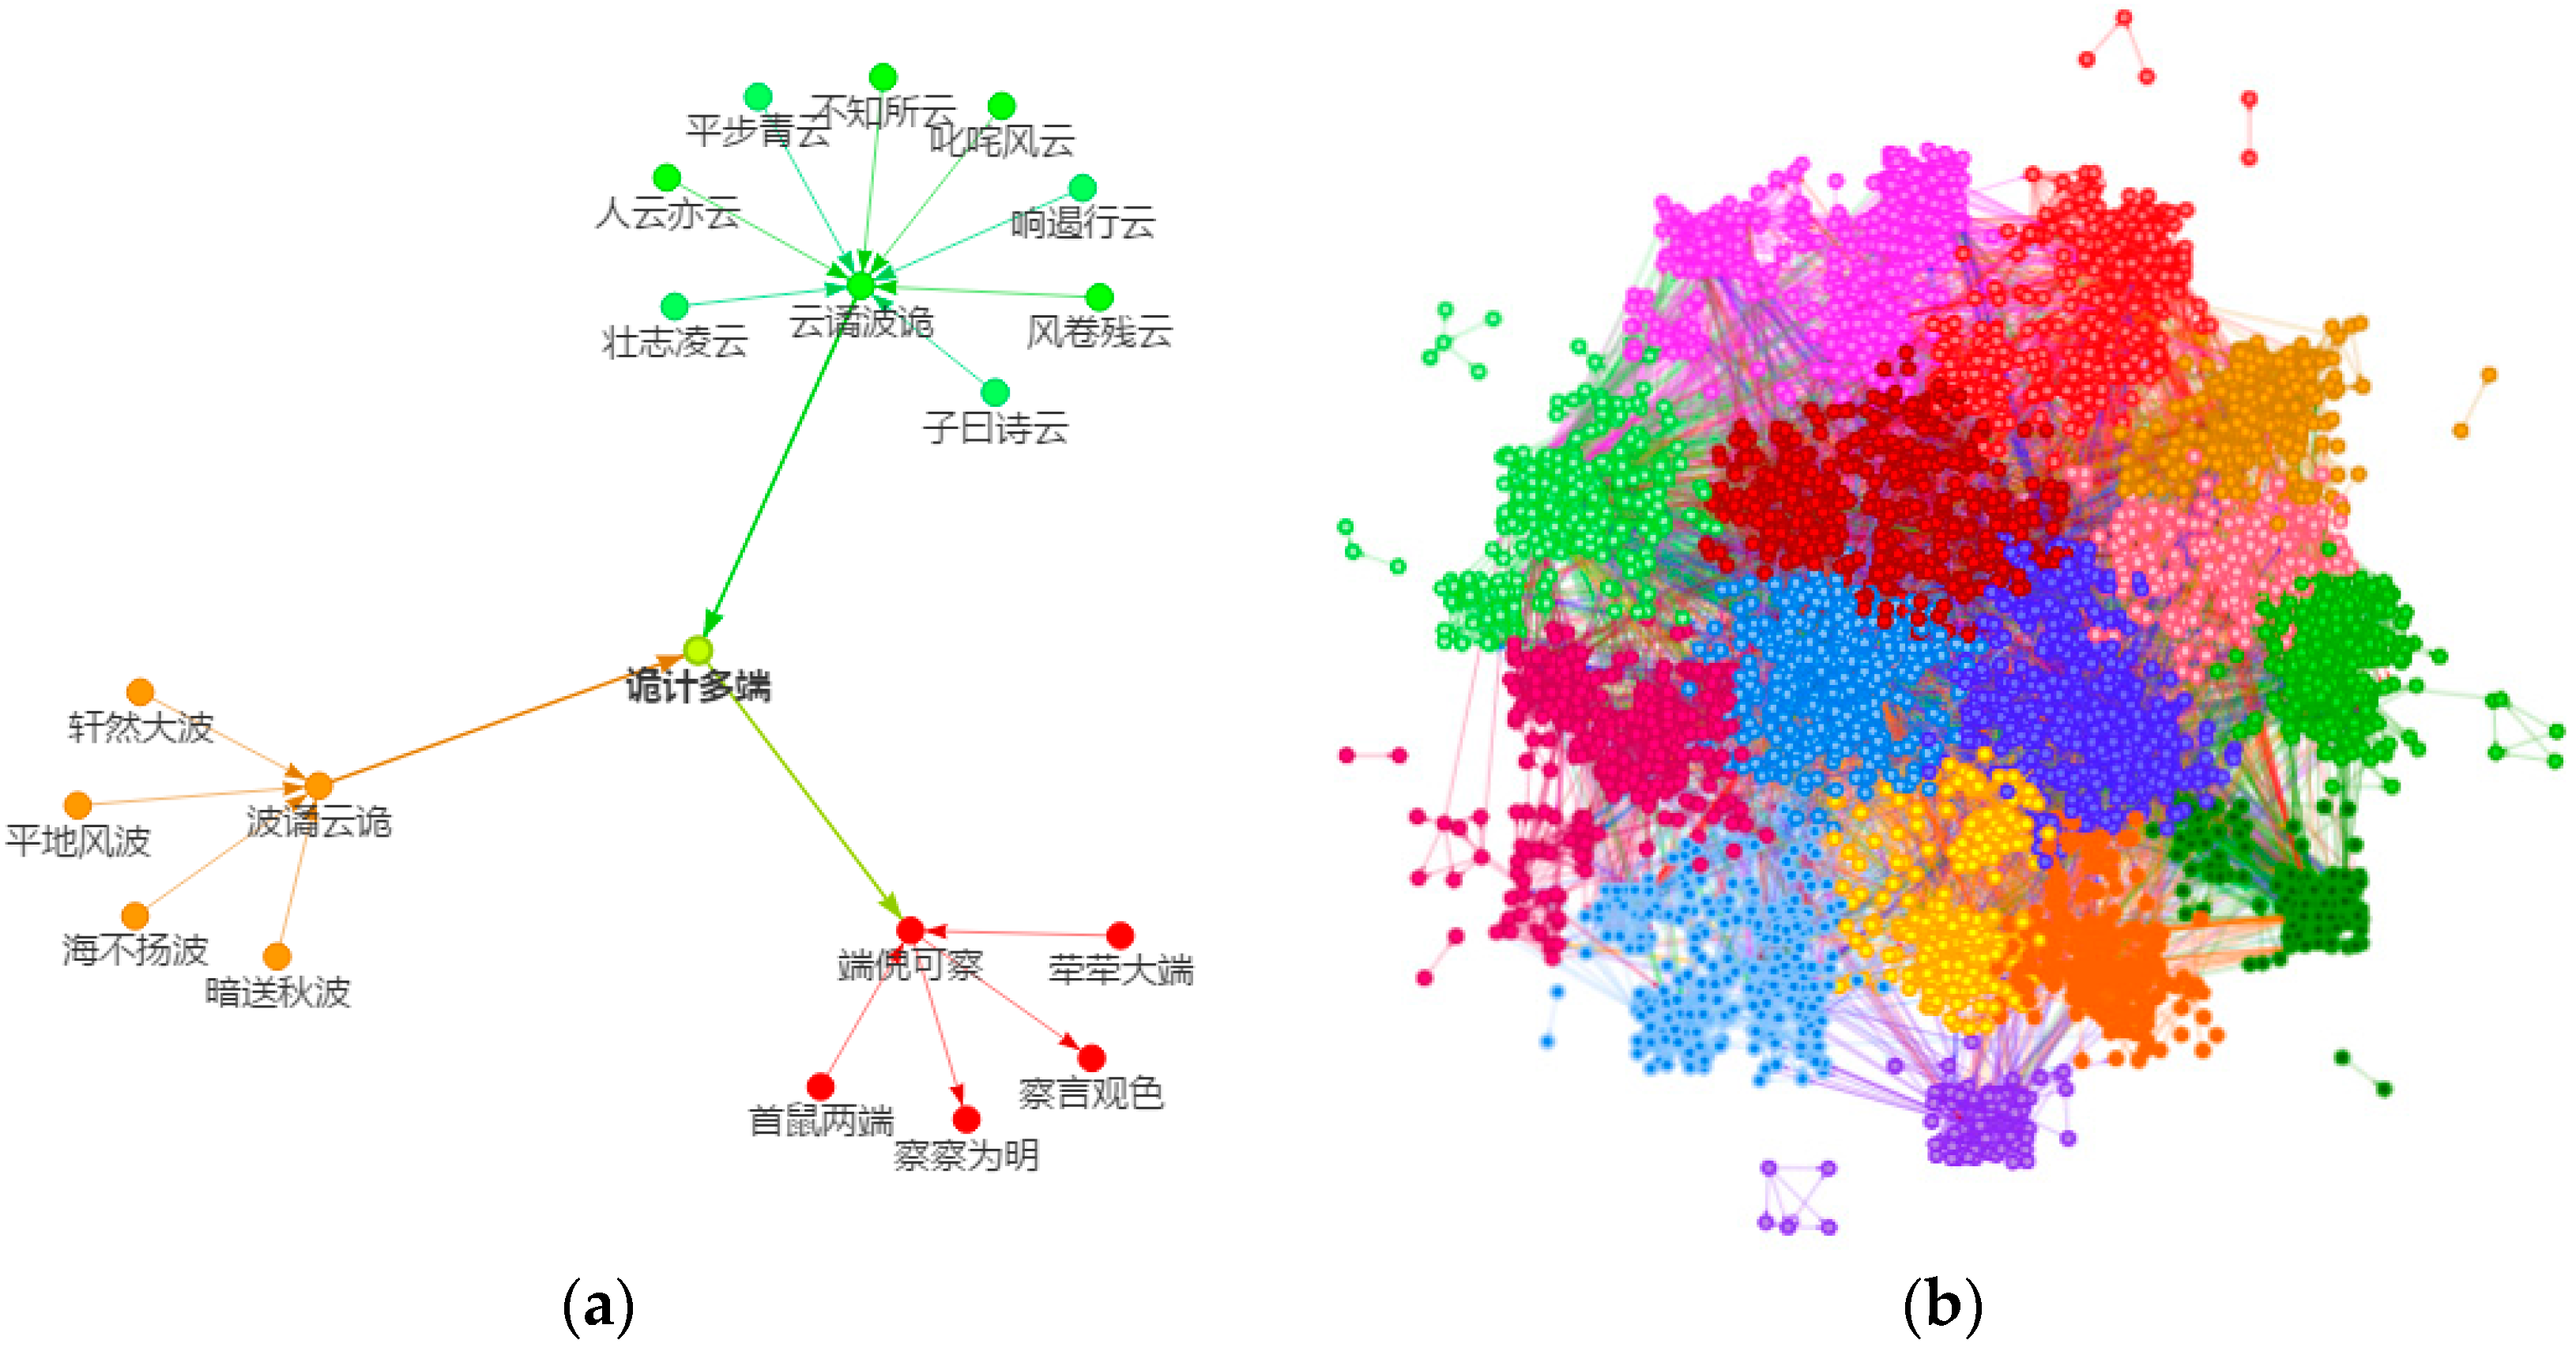
Figure 2.
The Entropy Variations of nodes in the Snake Idioms Network. The upper part is with the in-degree information function (EnVin), while the middle part is with out-degree (EnVout), and the lower part is with betweenness (EnVbtw). Each part consists of a barplot on the left and a boxplot on the right.
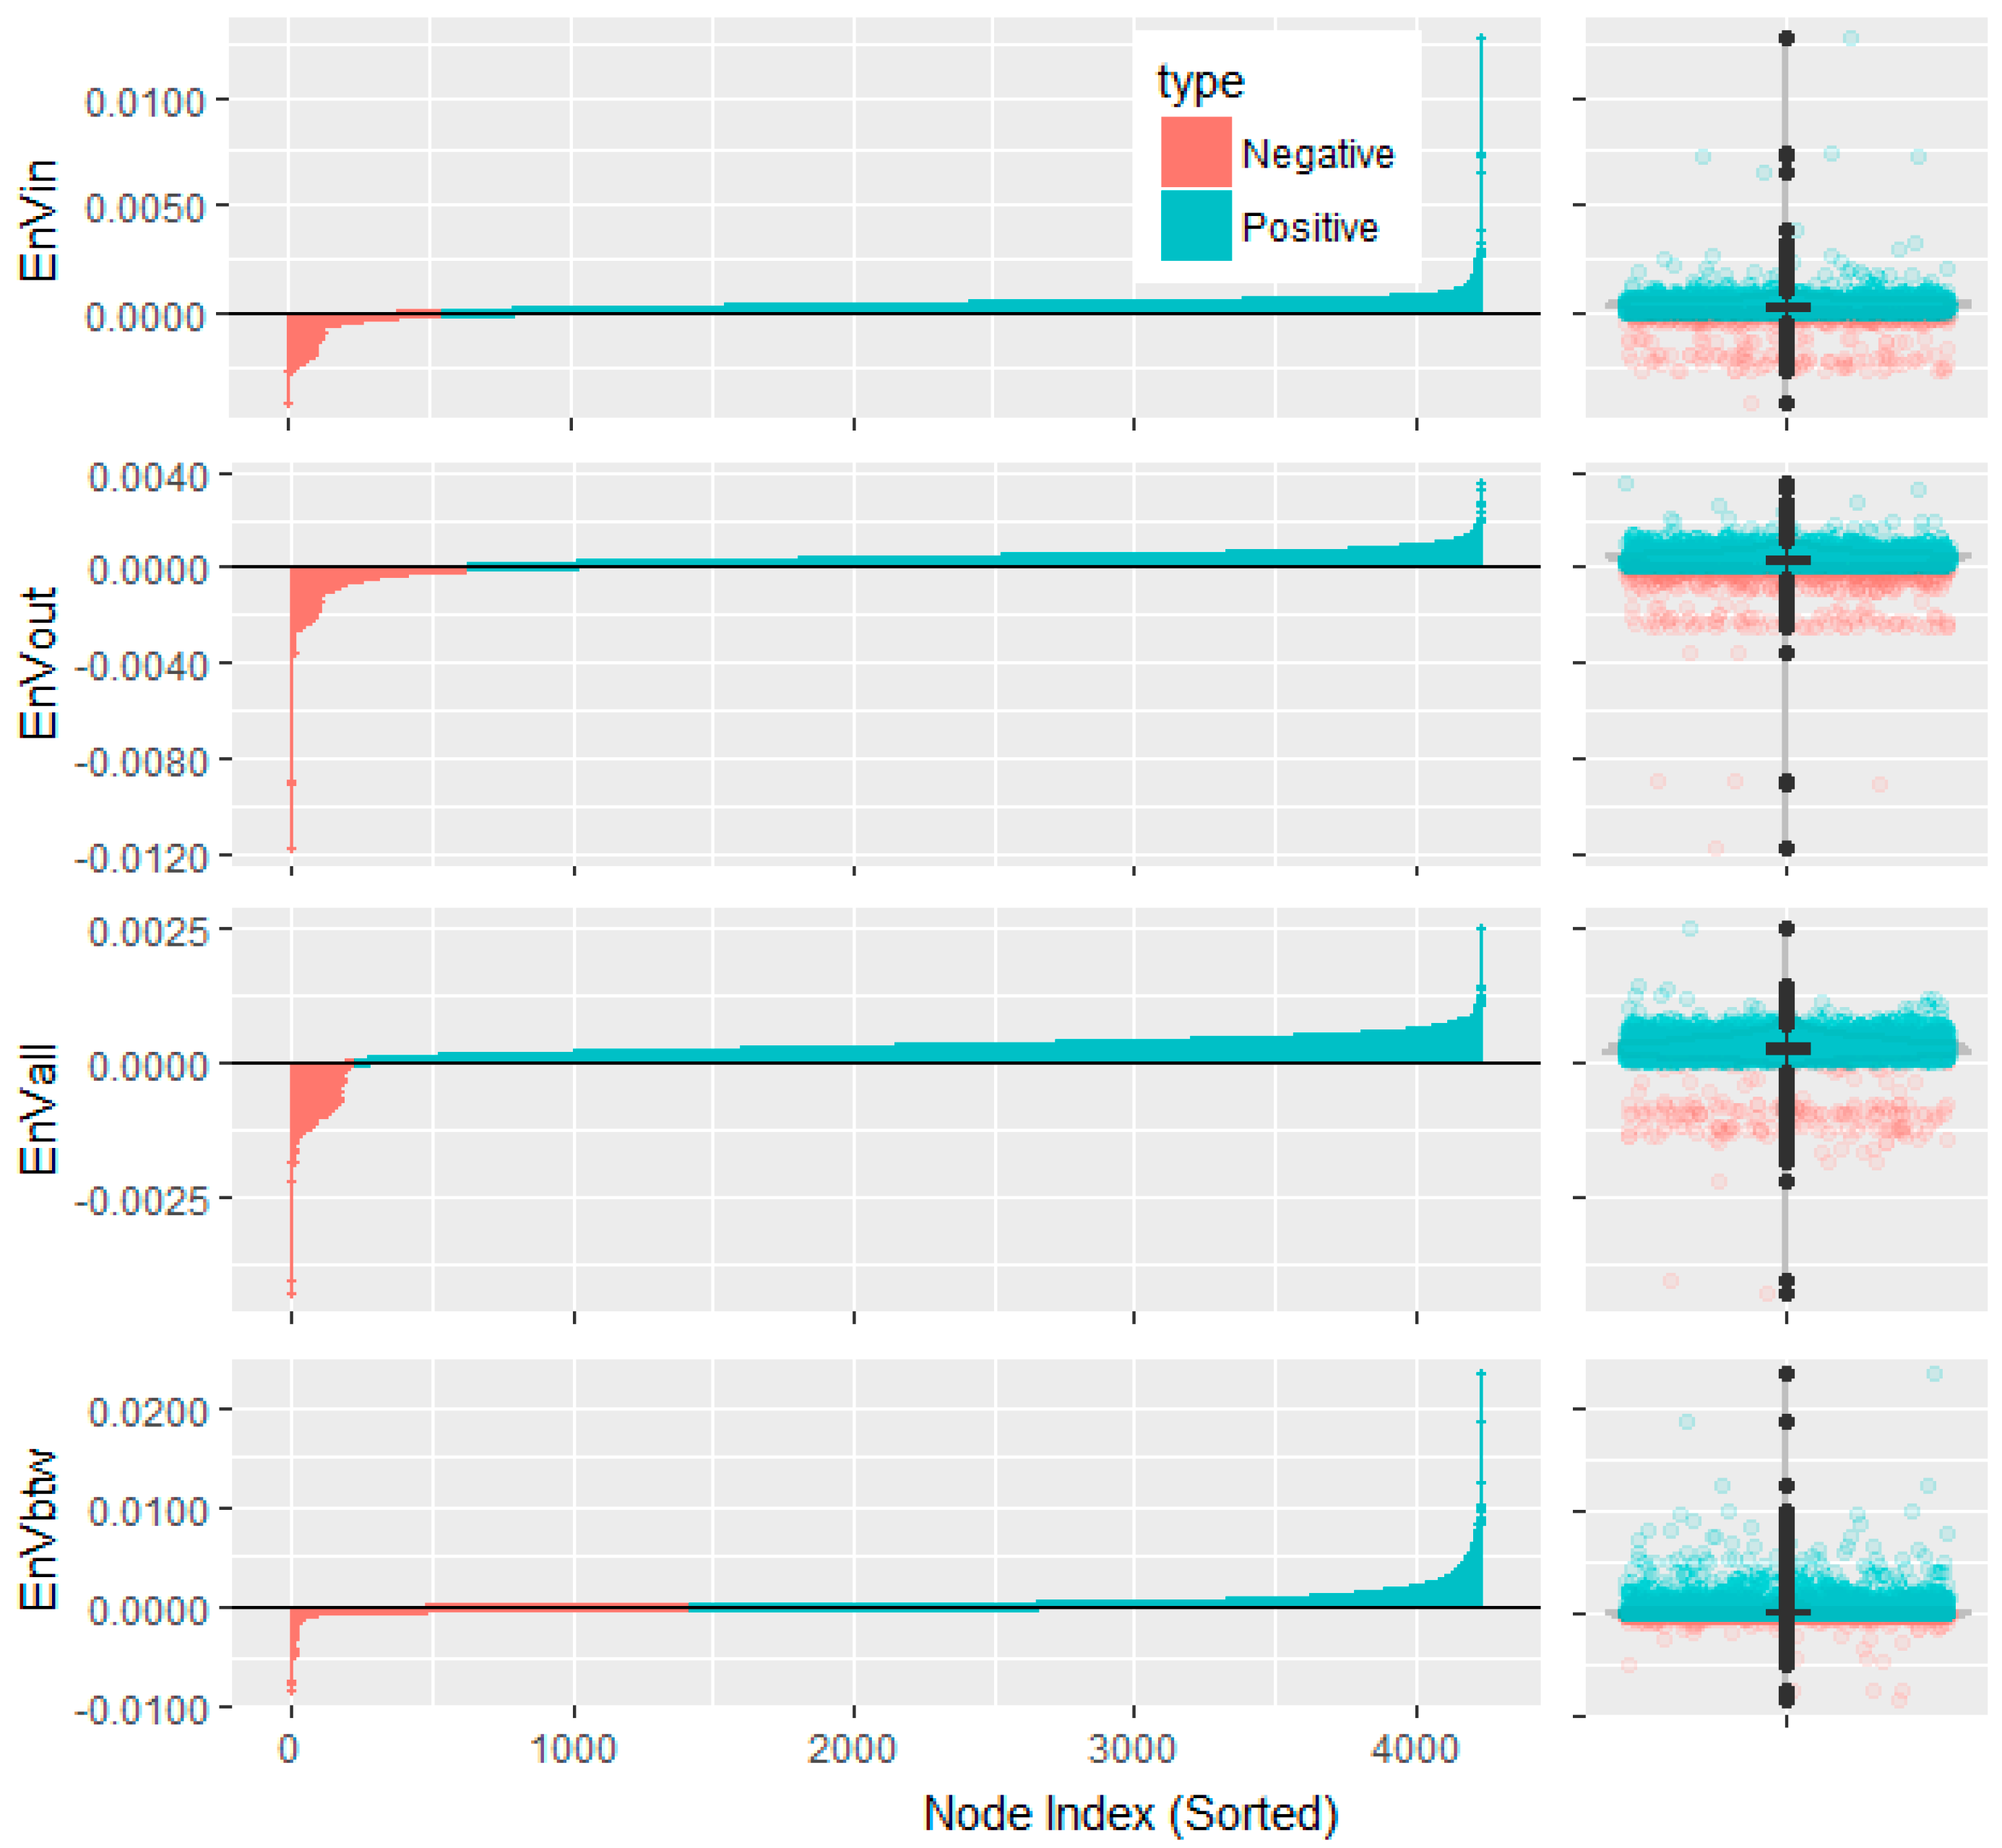
Figure 3.
Comparison boxplots of the r(k) disturbances for in-degree (DEin) and Entropy Variation with in-degree as its information function (EnVin). The randomization is repeated 50 times.
Figure 3.
Comparison boxplots of the r(k) disturbances for in-degree (DEin) and Entropy Variation with in-degree as its information function (EnVin). The randomization is repeated 50 times.
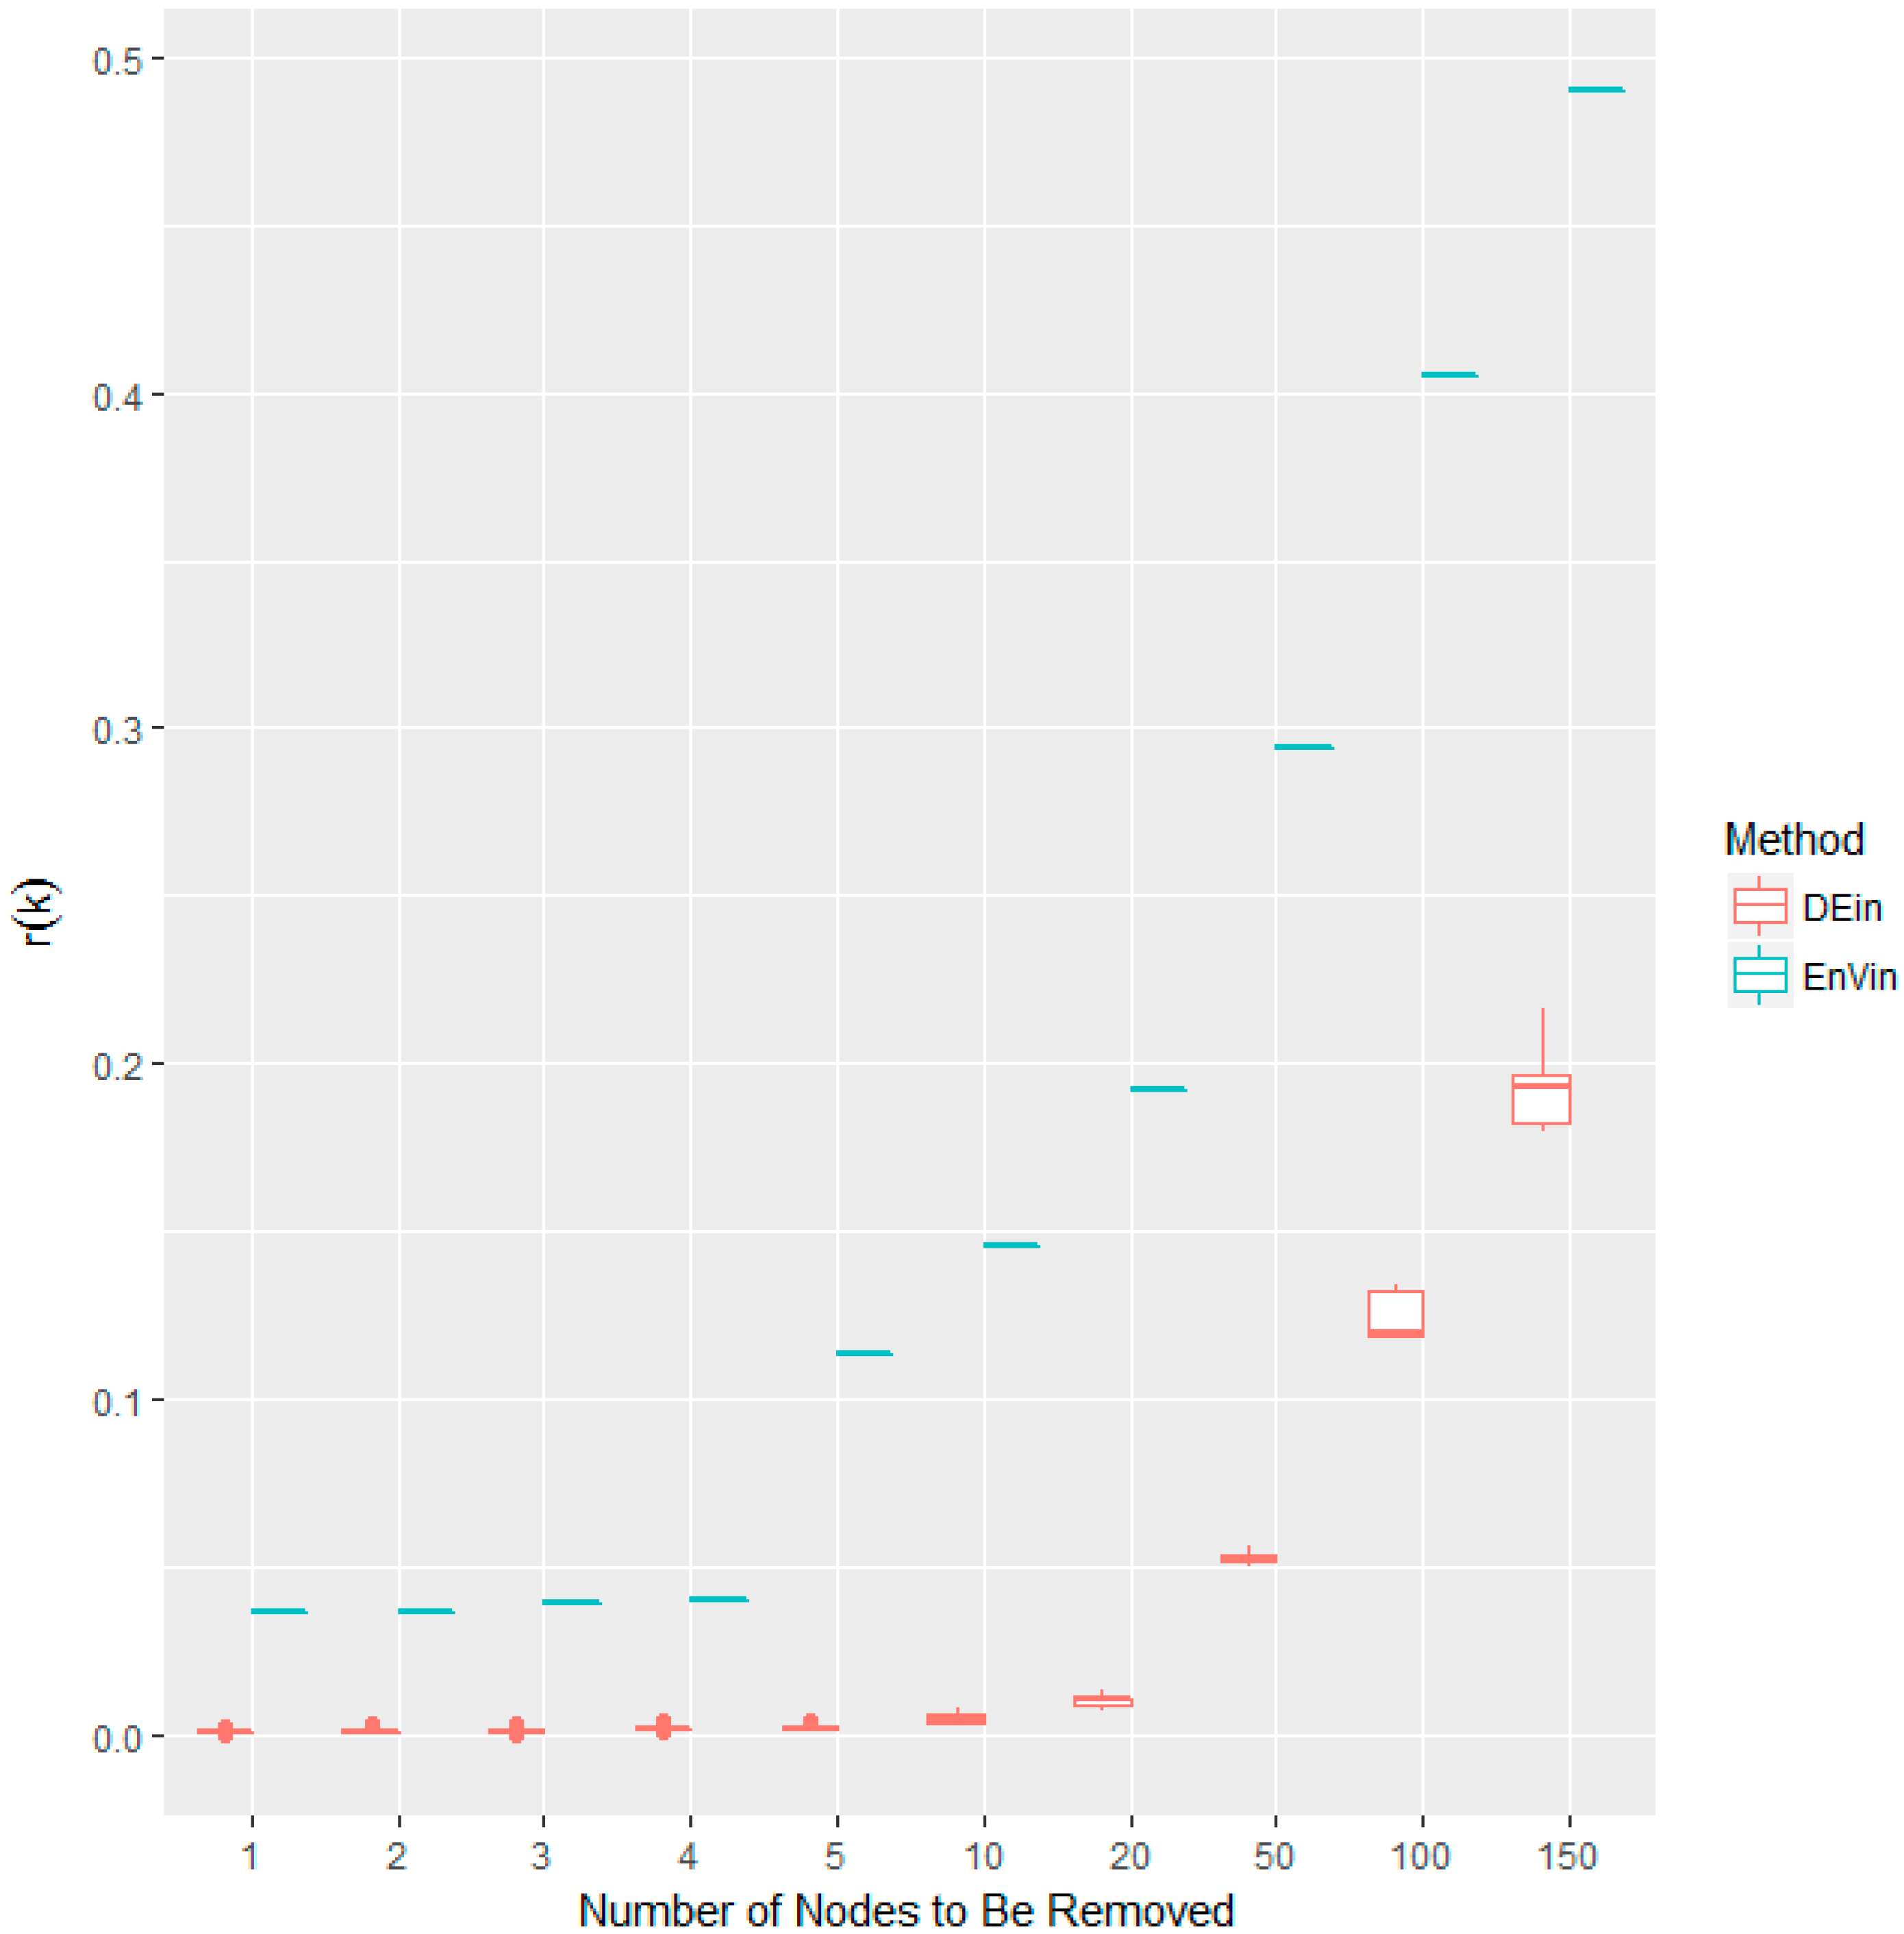
Figure 4.
Performance comparison between Entropy Variation and Degree centrality. The horizontal axis is the number of nodes to be removed, while the vertical axis is the corresponding r(k) score after removing the top-k most important nodes.
Figure 4.
Performance comparison between Entropy Variation and Degree centrality. The horizontal axis is the number of nodes to be removed, while the vertical axis is the corresponding r(k) score after removing the top-k most important nodes.
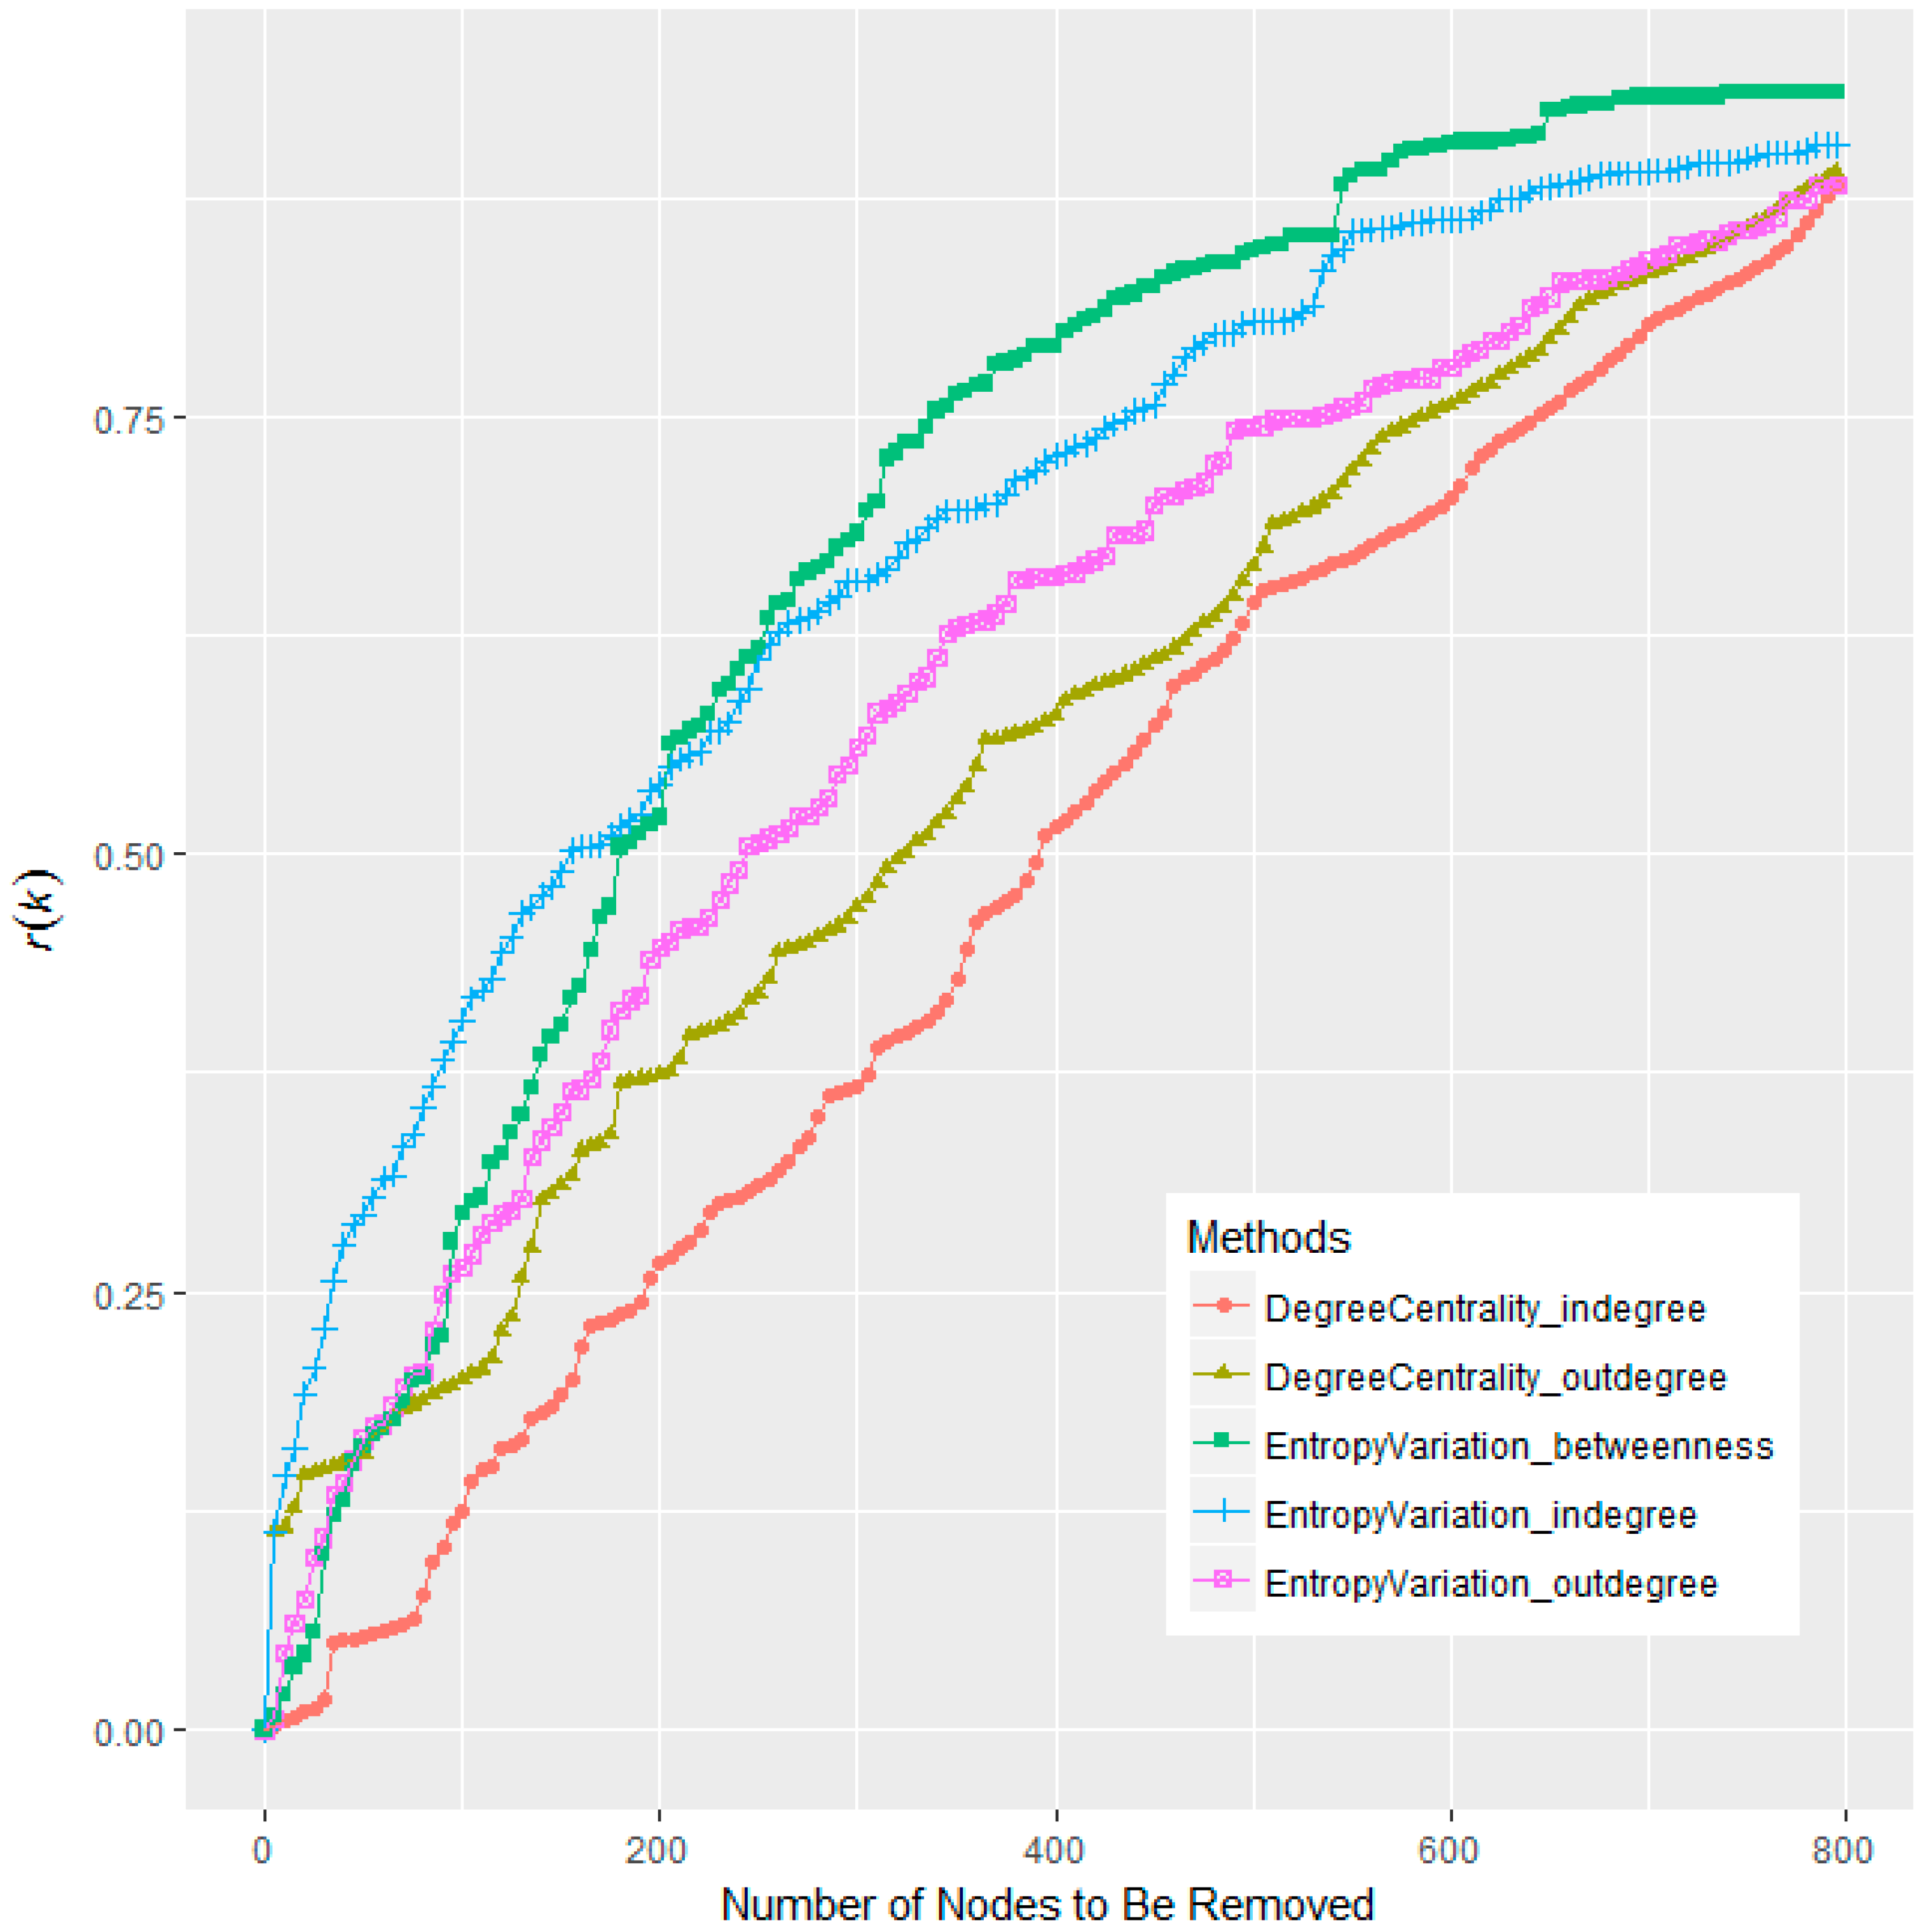
Figure 5.
Performance comparison between the proposed Entropy Variation (EnV) and 15 other state-of-the-art methods, including: DEgree Centrality (DE), COrness (CO), H-Index (HI); Eccentricity (EC), CLoseness centrality (CL), INformation index (IN), BEtweenness Centrality (BE), LOad Centrality (LO), STress Centrality Scores (ST), SUbgraph Centrality (SU); EIgenvector Centrality (EI), ALpha centrality (AL), Page Rank (PR), HITs_Authority (AU), and HITs_Hub (HU); Expected Force (ExF), and with the Snake Idioms Network being a digraph, centralities like Degree, Coreness, H-index, Eccentricity, Closeness centrality will be calculated in three modes, namely, “in”, “out”, and “all” and we mark them with suffixes, such as DEall and ECout. The Entropy Variation metrics are calculated using in-degree (EnVin), out-degree (EnVout), all-degree (EnVall), and betweenness (EnVbtw) as its information function, respectively. These centrality metrics are implemented in R language and computed via standard functions in its add-on packages igraph [65] and SNA [66].
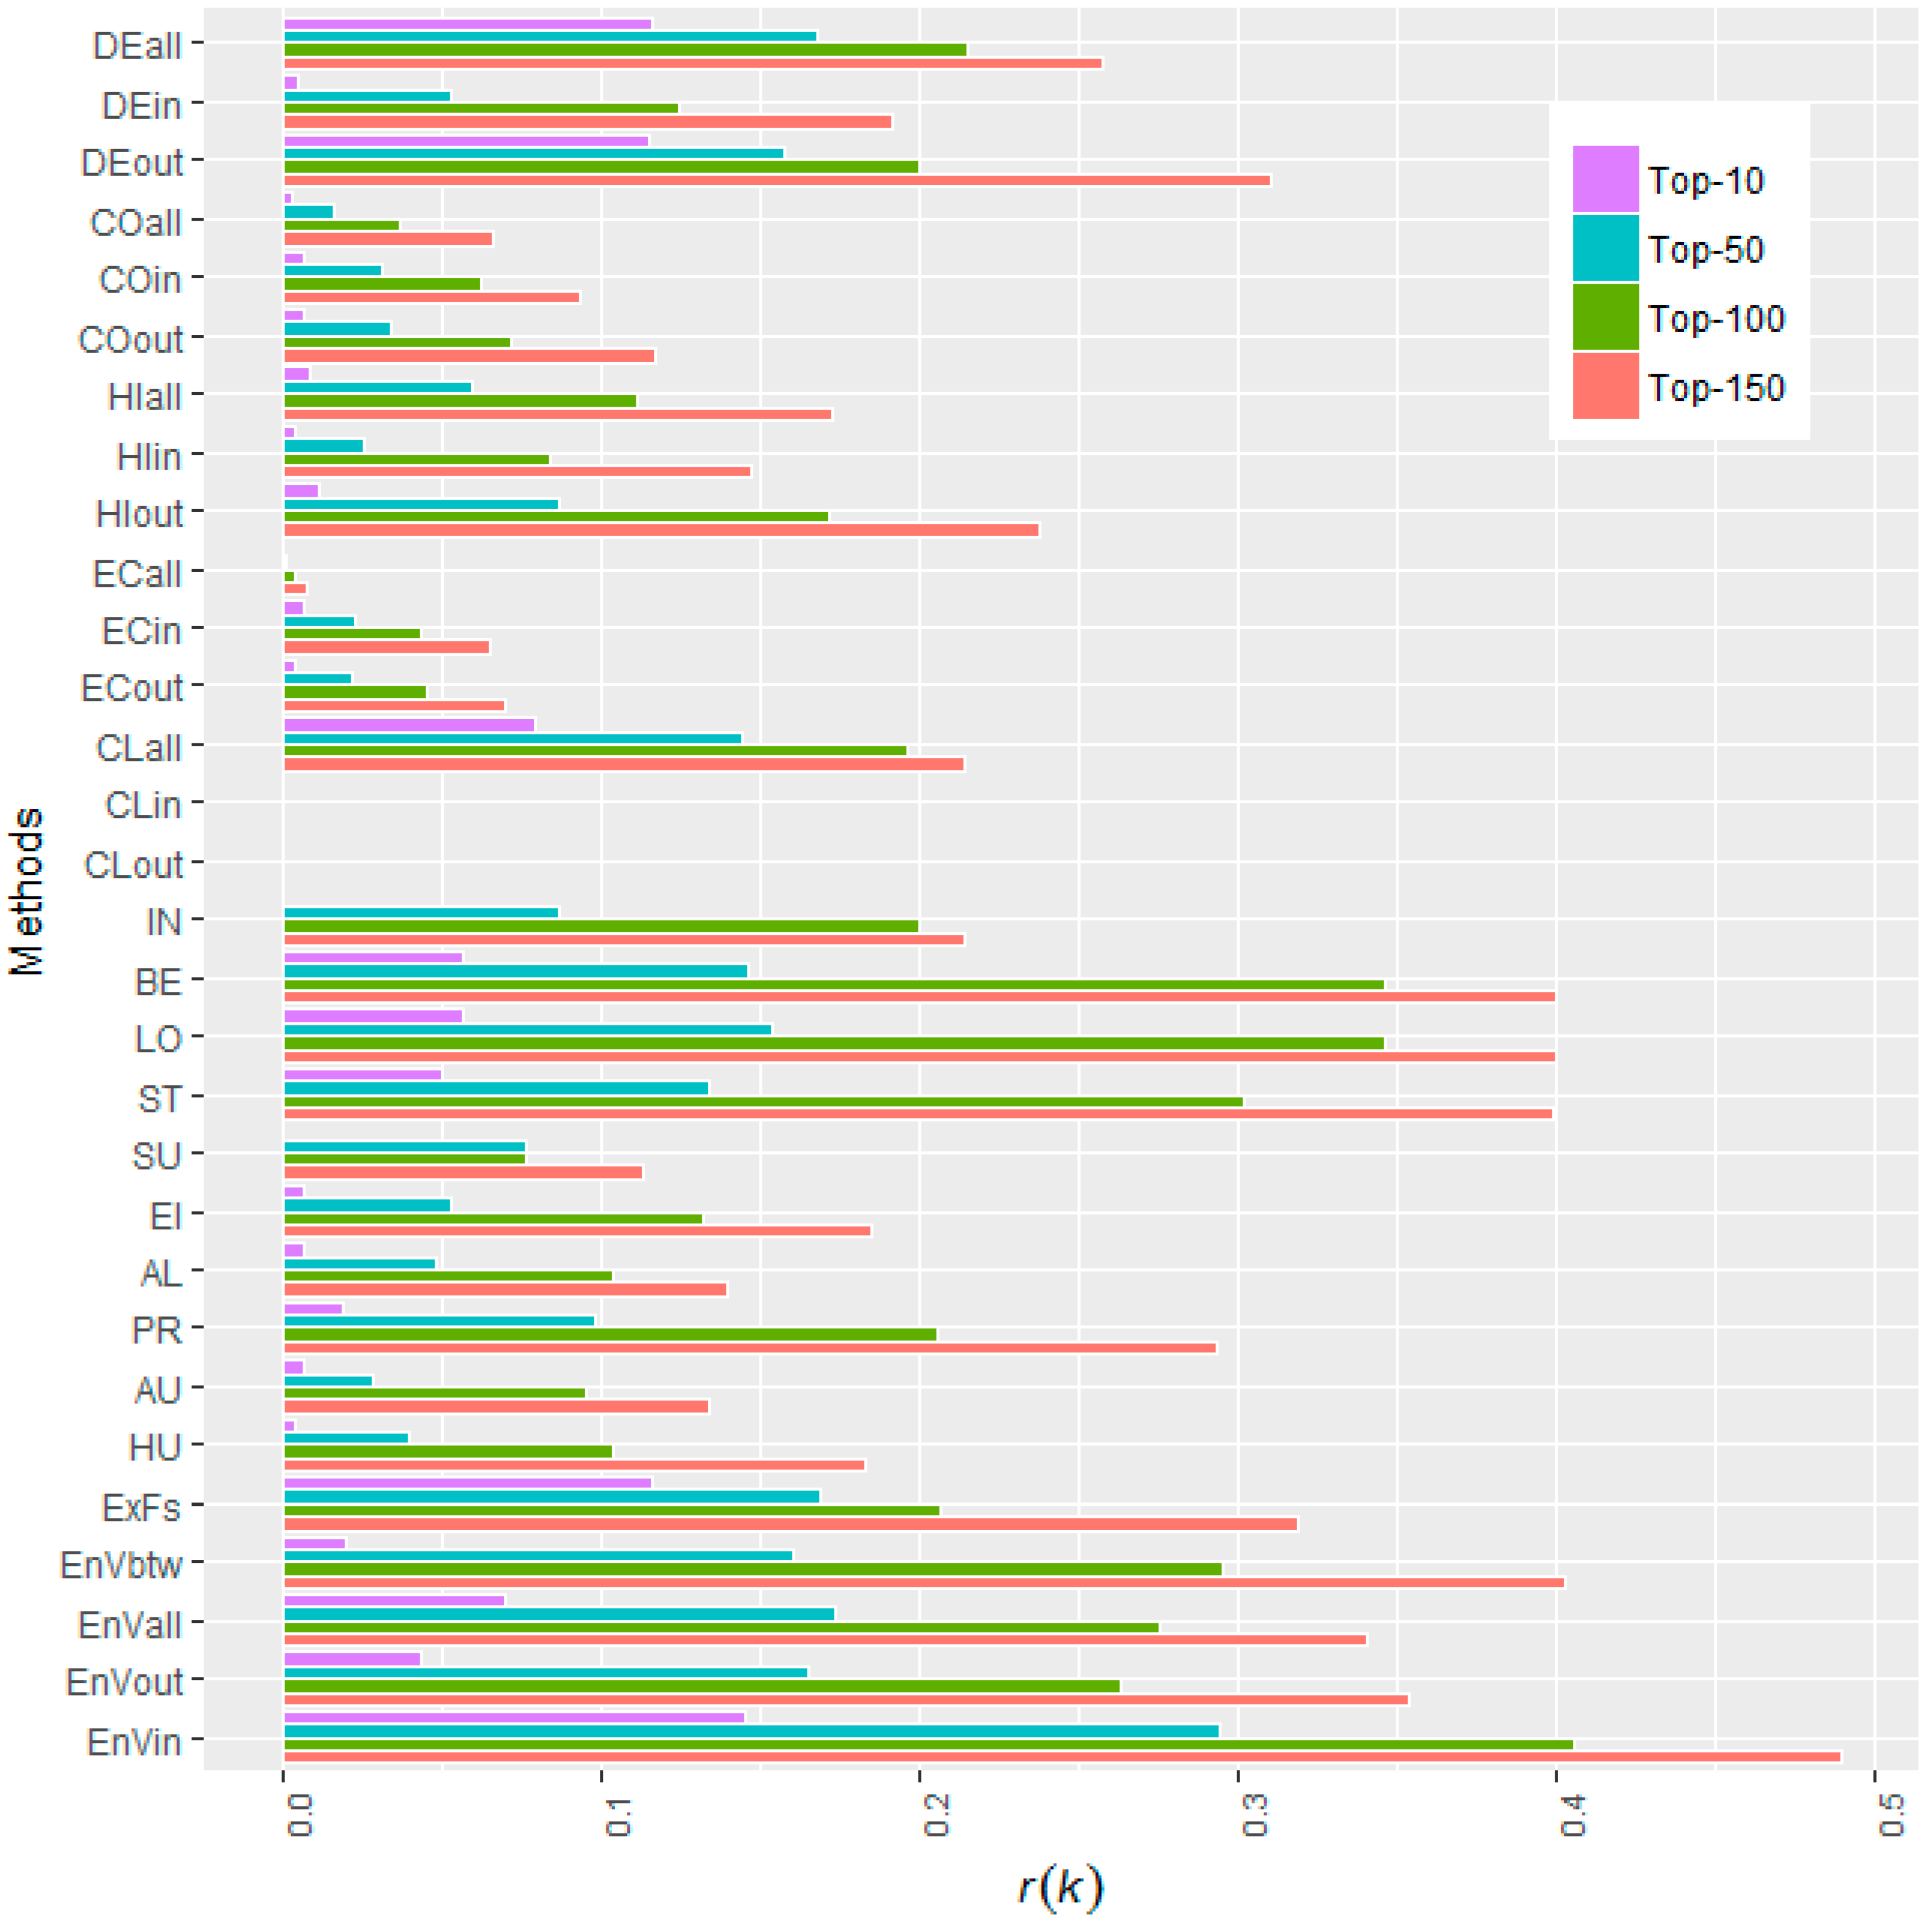
Figure 6.
The r(k = 10) performance comparison matrix. The matrix comprises 30 × 8 = 240 entries, with 30 different methods as its rows and 8 different real life networks as its columns. Entry [i, j] of the matrix stands for the r(k = 10) score gained while conducting the method in row i on the network in column j. The value of each entry is mapped into the color depth of its background. The greater the value is, the deeper its background is. The maximal values of each column are marked with an extra “**” in its right side, indicating which is the best ranking method for that network.

Table 1.
Basic statistical features of the networks to be investigated.
| Network | Number of Nodes | Number of Edges | Density | Diameter | Average Path Length | SCC Size |
|---|---|---|---|---|---|---|
| Air traffic control | 1226 | 2615 | 0.00174 | 25 | 7.96 | 792 |
| Blogs | 1224 | 19,025 | 0.01271 | 9 | 3.39 | 793 |
| Gnutella | 6301 | 20,777 | 0.00052 | 20 | 6.63 | 2068 |
| Hens | 32 | 496 | 0.50000 | 6 | 1.96 | 31 |
| High School | 70 | 366 | 0.07578 | 12 | 3.97 | 67 |
| Neural | 297 | 2359 | 0.02683 | 14 | 3.99 | 239 |
| Physicians | 241 | 1098 | 0.01898 | 9 | 3.31 | 95 |
| Snake Idioms | 4234 | 21,067 | 0.00118 | 16 | 6.14 | 1907 |
Table 2.
Five important percentiles of Entropy Variations with different information functions.
| Information Function | Minimum | 1st Quartile | Median | 3rd Quartile | Maximum |
|---|---|---|---|---|---|
| in-degree | −0.00414 | 0.000126 | 0.00032 | 0.000475 | 0.012829 |
| out-degree | −0.0117 | 0.000143 | 0.00033 | 0.000507 | 0.00357 |
| all-degree | −0.00431 | 0.00017 | 0.000279 | 0.000396 | 0.002523 |
| betweenness | −0.00844 | −0.000043 | 0.0000776 | 0.000382 | 0.023602 |
Table 3.
The performance of different ranking methods. The r(k) scores are followed by their order, ranging from the highest score as #1 to the lowest score as #30.
Table 3.
The performance of different ranking methods. The r(k) scores are followed by their order, ranging from the highest score as #1 to the lowest score as #30.
| Methods | r(k) | |||||||||
|---|---|---|---|---|---|---|---|---|---|---|
| k = 10 | k = 50 | k = 100 | k = 150 | |||||||
| Degree (all) | 0.12 | #2 | 0.17 | #4 | 0.22 | #8 | 0.26 | #11 | 29.07 | #8 |
| Degree (in) | 0.01 | #21 | 0.05 | #18 | 0.12 | #16 | 0.19 | #15 | 13.32 | #16 |
| Degree (out) | 0.12 | #4 | 0.16 | #7 | 0.20 | #11 | 0.31 | #9 | 28.26 | #10 |
| Coreness (all) | 0.00 | #25 | 0.02 | #27 | 0.04 | #27 | 0.07 | #26 | 4.32 | #27 |
| Coreness (in) | 0.01 | #20 | 0.03 | #22 | 0.06 | #24 | 0.09 | #24 | 7.07 | #24 |
| Coreness (out) | 0.01 | #17 | 0.03 | #21 | 0.07 | #23 | 0.12 | #22 | 8.34 | #23 |
| H-index(all) | 0.01 | #14 | 0.06 | #16 | 0.11 | #17 | 0.17 | #18 | 12.63 | #17 |
| H-index (in) | 0.00 | #22 | 0.03 | #24 | 0.08 | #21 | 0.15 | #19 | 9.20 | #21 |
| H-index (out) | 0.01 | #13 | 0.09 | #13 | 0.17 | #14 | 0.24 | #12 | 19.74 | #13 |
| Eccentricity (all) | 0.00 | #26 | 0.00 | #28 | 0.00 | #28 | 0.01 | #28 | 0.48 | #28 |
| Eccentricity (in) | 0.01 | #18 | 0.02 | #25 | 0.04 | #26 | 0.07 | #27 | 4.96 | #26 |
| Eccentricity (out) | 0.00 | #24 | 0.02 | #26 | 0.05 | #25 | 0.07 | #25 | 5.20 | #25 |
| Closeness (all) | 0.08 | #5 | 0.14 | #10 | 0.20 | #13 | 0.21 | #14 | 23.25 | #12 |
| Closeness (in) | 0.00 | #27 | 0.00 | #29 | 0.00 | #29 | 0.00 | #29 | 0.00 | #29 |
| Closeness (out) | 0.00 | #28 | 0.00 | #30 | 0.00 | #30 | 0.00 | #30 | 0.00 | #30 |
| Information index | 0.00 | #29 | 0.09 | #14 | 0.20 | #12 | 0.21 | #13 | 19.32 | #14 |
| Betweenness centrality | 0.06 | #7 | 0.15 | #9 | 0.35 | #2 | 0.40 | #3 | 35.07 | #3 |
| Load centrality | 0.06 | #8 | 0.15 | #8 | 0.35 | #3 | 0.40 | #4 | 36.13 | #2 |
| Stress centrality | 0.05 | #9 | 0.13 | #11 | 0.30 | #4 | 0.40 | #5 | 32.42 | #4 |
| Subgraph centrality | 0.00 | #30 | 0.08 | #15 | 0.08 | #22 | 0.11 | #23 | 11.09 | #20 |
| Eigenvector centrality | 0.01 | #15 | 0.05 | #17 | 0.13 | #15 | 0.19 | #16 | 13.35 | #15 |
| Alpha centrality | 0.01 | #16 | 0.05 | #19 | 0.10 | #19 | 0.14 | #20 | 11.29 | #19 |
| Page Rank | 0.02 | #12 | 0.10 | #12 | 0.21 | #10 | 0.29 | #10 | 23.61 | #11 |
| HITs (Authority) | 0.01 | #19 | 0.03 | #23 | 0.10 | #20 | 0.13 | #21 | 8.91 | #22 |
| HITs (Hub) | 0.00 | #23 | 0.04 | #20 | 0.10 | #18 | 0.18 | #17 | 12.60 | #18 |
| Expected Force (ExF) | 0.12 | #3 | 0.17 | #3 | 0.21 | #9 | 0.32 | #8 | 29.04 | #9 |
| Entropy Variation (btw) | 0.02 | #11 | 0.16 | #6 | 0.30 | #5 | 0.40 | #2 | 31.45 | #6 |
| Entropy Variation (all) | 0.07 | #6 | 0.17 | #2 | 0.28 | #6 | 0.34 | #7 | 32.21 | #5 |
| Entropy Variation(out) | 0.04 | #10 | 0.17 | #5 | 0.26 | #7 | 0.35 | #6 | 30.35 | #7 |
| Entropy Variation(in) | 0.15 | #1 | 0.29 | #1 | 0.41 | #1 | 0.49 | #1 | 50.13 | #1 |
© 2017 by the author. Licensee MDPI, Basel, Switzerland. This article is an open access article distributed under the terms and conditions of the Creative Commons Attribution (CC BY) license (http://creativecommons.org/licenses/by/4.0/).
Share and Cite
MDPI and ACS Style
Ai, X. Node Importance Ranking of Complex Networks with Entropy Variation. Entropy 2017, 19, 303. https://doi.org/10.3390/e19070303
AMA Style
Ai X. Node Importance Ranking of Complex Networks with Entropy Variation. Entropy. 2017; 19(7):303. https://doi.org/10.3390/e19070303
Chicago/Turabian StyleAi, Xinbo. 2017. "Node Importance Ranking of Complex Networks with Entropy Variation" Entropy 19, no. 7: 303. https://doi.org/10.3390/e19070303
Note that from the first issue of 2016, this journal uses article numbers instead of page numbers. See further details here.