Effects of Task Demands on Kinematics and EMG Signals during Tracking Tasks Using Multiscale Entropy


1
Key Laboratory of Sensing Technology and Biomedical Instrument of Guangdong Province, School of Engineering, Sun Yat-Sen University, Guangzhou 510275, China
2
Guangdong Provincial Engineering and Technology Center of Advanced and Portable Medical Devices, School of Engineering, Sun Yat-Sen University, Guangzhou 510275, China
*
Author to whom correspondence should be addressed.
Entropy 2017, 19(7), 307; https://doi.org/10.3390/e19070307
Submission received: 26 April 2017
/
Revised: 13 June 2017
/
Accepted: 16 June 2017
/
Published: 27 June 2017
(This article belongs to the Section Complexity)
Abstract
:Target-directed elbow movements are essential in daily life; however, how different task demands affect motor control is seldom reported. In this study, the relationship between task demands and the complexity of kinematics and electromyographic (EMG) signals on healthy young individuals was investigated. Tracking tasks with four levels of task demands were designed, and participants were instructed to track the target trajectories by extending or flexing their elbow joint. The actual trajectories and EMG signals from the biceps and triceps were recorded simultaneously. Multiscale fuzzy entropy was utilized to analyze the complexity of actual trajectories and EMG signals over multiple time scales. Results showed that the complexity of actual trajectories and EMG signals increased when task demands increased. As the time scale increased, there was a monotonic rise in the complexity of actual trajectories, while the complexity of EMG signals rose first, and then fell. Noise abatement may account for the decreasing entropy of EMG signals at larger time scales. This study confirmed the uniqueness of multiscale entropy, which may be useful in the analysis of electrophysiological signals.
1. Introduction
Target-directed tasks have been widely adopted in previous studies to investigate the relationship between motor performance and external factors such as task orientation [1], target size [2], visual information [3], and error tolerance [4]. Berthier et al. observed longer movement times and slower speeds with a decline in object size during hand reaching tasks [2]. Moreover, movement speed can also influence motor performance during target-directed movements [5,6,7]. Selen et al. [5] and Maill et al. [7] observed the tracking performance of normal individuals at different frequencies and found that movement variability decreased when movement frequency decreased. Hong et al. investigated the ability of normal individuals when generating a two-finger force under different task demands (error tolerance) and environmental information (visual feedback frequency), and confirmed an increased force variability towards higher error tolerance and lower feedback frequency [4]. Thus, Hong et al. suggested that there was compensation for the complexity between task, environment, and motor performance. Moreover, as Morrison et al. reported, there was also compensation of the complexity between postural sway and EMG signals towards different task demands [8]. Nevertheless, Barbado et al. observed a contrary result between the complexity of postural sway and EMG signals during different standing balance tasks [9].
As Hong et al. [3] proposed, the behavior of the motor system towards different task demands are fundamentally probabilistic, and their statistical properties could be applied in the characterization of motor performance. Fitts [10] observed an increase in movement times with increased task difficulty, and defined the difficulty as the of the probability of hitting a target. Therefore, a higher uncertainty of achievement, which could be represented by higher entropy values, occurred when tasks became more difficult. As a widely used measure of statistical properties, entropy well characterizes the probabilistic nature of motor performance during target-directed tasks [11].
Entropy was first introduced by Shannon [12], and different entropy-based measures such as approximate entropy (ApEn) [13], sample entropy (SampEn) [14], and fuzzy entropy (FuzzyEn) [15] have been widely applied to analyze physiological signals [16,17,18]. A decline in entropy value usually indicates an increase in signal regularity and a decrease in signal complexity [3]. Comparisons among different entropy algorithms have been investigated in previous studies. Yentes et al. [19] adjusted the parameter values on very short datasets to detect the robustness of ApEn and SampEn, and found a better relative consistency of SampEn. Xie et al. compared SampEn and FuzzyEn with simulated signals, and found that FuzzyEn was superior to SampEn in robustness and monotonicity to noise [20]. Since the fuzzy function with a soft and continuous boundary is applied in FuzzyEn rather than the Heaviside function with a hard and discontinuous boundary in SampEn, the superiority of FuzzyEn may have resulted from the fuzzy measurement of the vectors’ similarity [15], which can contribute to a better characterization of physiological signals.
Despite these distinctive features, the abovementioned entropies were single-scale measures which barely considered the important properties related to multiscale organization [21]. Previous studies have also elicited conflicting results for the complexity of motor performance towards different task demands. As Costa et al. indicated, based on a single time scale, an increase in system entropy might not represent an increase in its complexity [22]. For instance, the process of generating a randomized time series degrades the information content of the original time series and destroys the inherent correlations, but leads to higher entropy. To avoid misleading results, multiscale entropy was developed by Costa et al. to detect complex variations of the physiological system across multiple time scales [22], which was combined with a coarse-graining procedure and SampEn. Multiscale entropy and its variants have been applied in the detection of muscle fatigue [23], gait dynamics analysis [24,25], heart rate dynamics analysis [21,26], and electroencephalogram (EEG) analysis in rats [27]. Previous studies confirmed that studying the physiological system over a range of timescales could allow for more complete features [24].
Compared with the targets used in previous studies, movement with randomly changing targets could avoid adaptation as the target positions are unpredictable, but this has seldom been reported. In this study, sinusoidal trajectories mixed with different random noises were designed as four levels of task demands during elbow tracking tasks for healthy young subjects. The objective was to investigate the effects of task demands on complex kinematics and surface electromyographic (EMG) signals. Multiscale fuzzy entropy (MSFuzzyEn) was utilized to analyze the complexity of actual trajectories and EMG signals from the biceps and triceps over multiple time scales. The root mean square error (RMSE) between the target and actual trajectories represented the tracking performance during different tracking tasks. This study may provide a comprehensive understanding of the mechanisms of motor control in the neuromuscular system.
2. Materials and Methods
2.1. Subjects
In the current study, 12 healthy young volunteers (six men, six women, mean age: 22.75 ± 0.62 years) were recruited with no musculoskeletal or neurological problems. Before participating in the experiment, written informed consent was collected from all subjects. All experimental procedures were approved by the Ethics Committee of the First Affiliated Hospital of Sun Yat-Sen University ([2013]C-096, 28 February 2013).
2.2. Apparatus and Procedures
Figure 1 shows the experimental setup. Subjects were seated at a table during the experiment with their forearms attached to a manipulandum to support elbow extension or flexion in the horizontal plane, and their shoulders were at 90° abduction and 45° horizontal flexion. The markers attached to the manipulandum and the elbow joint were captured by a motion capture system (OptiTrack, NaturalPoint, Corvallis, OR, USA) at a sample rate of 100 Hz. The actual trajectory was calculated with the coordinates of the two markers. Two circular silver-silver chloride (Ag-AgCl) bipolar surface electrodes (diameter 10 mm) were attached to the bellies (center-to-center distance 2 cm) of two main contributing muscles for elbow joint extension and flexion, the biceps and triceps. Surface EMG signals were captured by a two-channel EMG amplifier with a gain of 5000, and then sampled by a data converter (DAQ-6341, National Instruments, Austin, TX, USA) at a sample rate of 1000 Hz with a 16-bit resolution. A computer screen providing the target and actual trajectories (with red and blue pointers, Figure 1b) in real-time feedback using a LabVIEW program (LabVIEW 2012, National Instruments, Austin, TX, USA) was placed in front of the subjects. The indicator light signaled when the subjects were to start the tracking tasks. As displayed in Figure 1c, the movement of the elbow joint ranged from 30° to 90° during the experiments.
The target trajectories MIX(P) were generated as follows [13]:
where N was the data length of the simulated signals;; was the independent identically distributed (i.i.d.) uniform random variables within [−0.5, 0.5]; and was the i.i.d. random variables consisting of 1 with the probability of P (0 < P < 1) and 0 with the probability of 1−P. A larger P indicated that the simulated signals were more complex. In this study, the simulated signals were applied in the experiment after interpolations to avoid poor tracking performance that resulted from too complex trajectories. The complexity of target trajectories was quantified by FuzzyEn. Target trajectories in Level 1, Level 2, Level 3, and Level 4 were generated from MIX(0.1), MIX(0.4), MIX(0.5), MIX(0.9), respectively. The data length of target trajectories in each level was set to 5000; thus, a higher level implied more complex tracking tasks.
After understanding the experimental protocol, subjects first performed two practice trials of each level by extending or flexing their elbow joints from 30° to 90° (Figure 1c). Subjects were instructed to try their best to follow the target pointer. Next, each subject conducted 16 trials, which were divided into four blocks, each consisting of four tasks with different levels in a random sequence. Each trial lasted for 50 s, and therefore 50,000 EMG samples and 5000 trajectory samples were collected. The subjects had a 30-s rest after each trial and a 5-min rest after each block.
2.3. Data and Statistical Analysis
The root mean square error (RMSE) of the tracking movements was measured to estimate the tracking error. The RMSE was defined as follows:
where and represented the actual and target trajectory, respectively, and N was the data length of the trajectory.
MSFuzzyEn revealed the complexity of the signal over multiple time scales by combining multiscale entropy [22] with FuzzyEn [15]. In this study, the algorithm comprised two steps: (1) a coarse-graining procedure for extracting the information at different time scales; and (2) estimating the irregularity of each coarse-graining time series with FuzzyEn.
We considered a one-dimensional time series as the original signal. The coarse-graining procedure first divided the original signal into non-overlapping segments of length τ. Second, the average of every segment formed a coarse-graining signal at time scale τ. The calculation was as follows:
The coarse-graining signal at time scale 1 (τ = 1) is simply the original signal. The length (N/τ) of the coarse-graining signal gradually became shorter as the time scale became larger. In this study, given that the data length of the actual trajectories and EMG signals was 5000, τ was set from 1 (N = 5000) to 20 (N = 250), which considered consistency and steadiness in the following entropy analysis.
The FuzzyEn algorithm was then applied to estimate the complexity of each coarse-graining signal across different time scales. Given a one-dimensional time series , an m-dimensional vector sequence was formed as follows, where :
The distance between the two vectors and was defined as:
The similarity of the two vectors was calculated as follows, where n and r determined the gradient of the boundary and the width of the exponential function, respectively:
Next, the average of the similarity from all vectors was calculated as:
Finally, the FuzzyEn value of the signal was defined as:
Suitable values for m, n, and r were quite important for estimating the complexity of specific physiological signals. According to our previous work, m = 2 and n = 2 were set in this study, and r was set as 0.15*std (signal) as it could ignore the amplitude differences of the signals among different analysis windows [28,29].
Our study analyzed trajectories and EMG signals by dividing the multiscale entropy index (MEI) into four small scale intervals using the MSFuzzyEn approach for comparison [30]:
The EMG signals obtained from the experiments were denoised by a band-pass Butterworth filter with a frequency band from 20 Hz to 450 Hz, and a 50 Hz digital notch filter. Next, the EMG signals from each trial were divided into 10 segments for MSFuzzyEn analysis, which consisted of 5000 samples in each segment. The MSFuzzyEn of the EMG signals from each trial was the average of 10 segments. The MSFuzzyEn and the RMSE of each subject were averaged over four performances at each level.
To assess the effects of time scale and task demands on motor performance, a two-factor analysis of variance (ANOVA) (repeated measure) was employed in the analysis of actual trajectories, biceps EMG, and triceps EMG. One-factor ANOVA (repeated measure) was utilized to: (1) compare the FuzzyEn across different levels of task demands at each scale interval; and (2) compare the RMSE between each two of the four levels. The statistical analysis was applied with SPSS21.0 (SPSS Inc., Chicago, IL, USA).
3. Results
Figure 2 is a graphical representation of an exemplar target trajectory, actual trajectory, and EMG signals from biceps and triceps during the tracking tasks with four levels. The FuzzyEn of the target trajectories at time scale one (τ = 1) when P were 0.1, 0.4, 0.5, and 0.9 were 0.003, 0.004, 0.009, and 0.013, respectively. Both target and actual trajectories became more complex as P increased. The amplitude of the EMG signals from the biceps and triceps was observed to have significant fluctuations over time across the different levels. The mean RMSE of twelve subjects from Levels 1 to 4 were 4.98 ± 0.48, 6.16 ± 0.52, 7.66 ± 0.61, and 7.02 ± 0.55, respectively. Based on a one-factor ANOVA (repeated measure), the RMSE increased monotonically from Level 1 to Level 3 (p-value < 0.01), and decreased significantly from Level 3 to Level 4 (p-value < 0.01). Considering the RMSE affected by task demands, the effect size (η2) was 0.95 for all subjects.
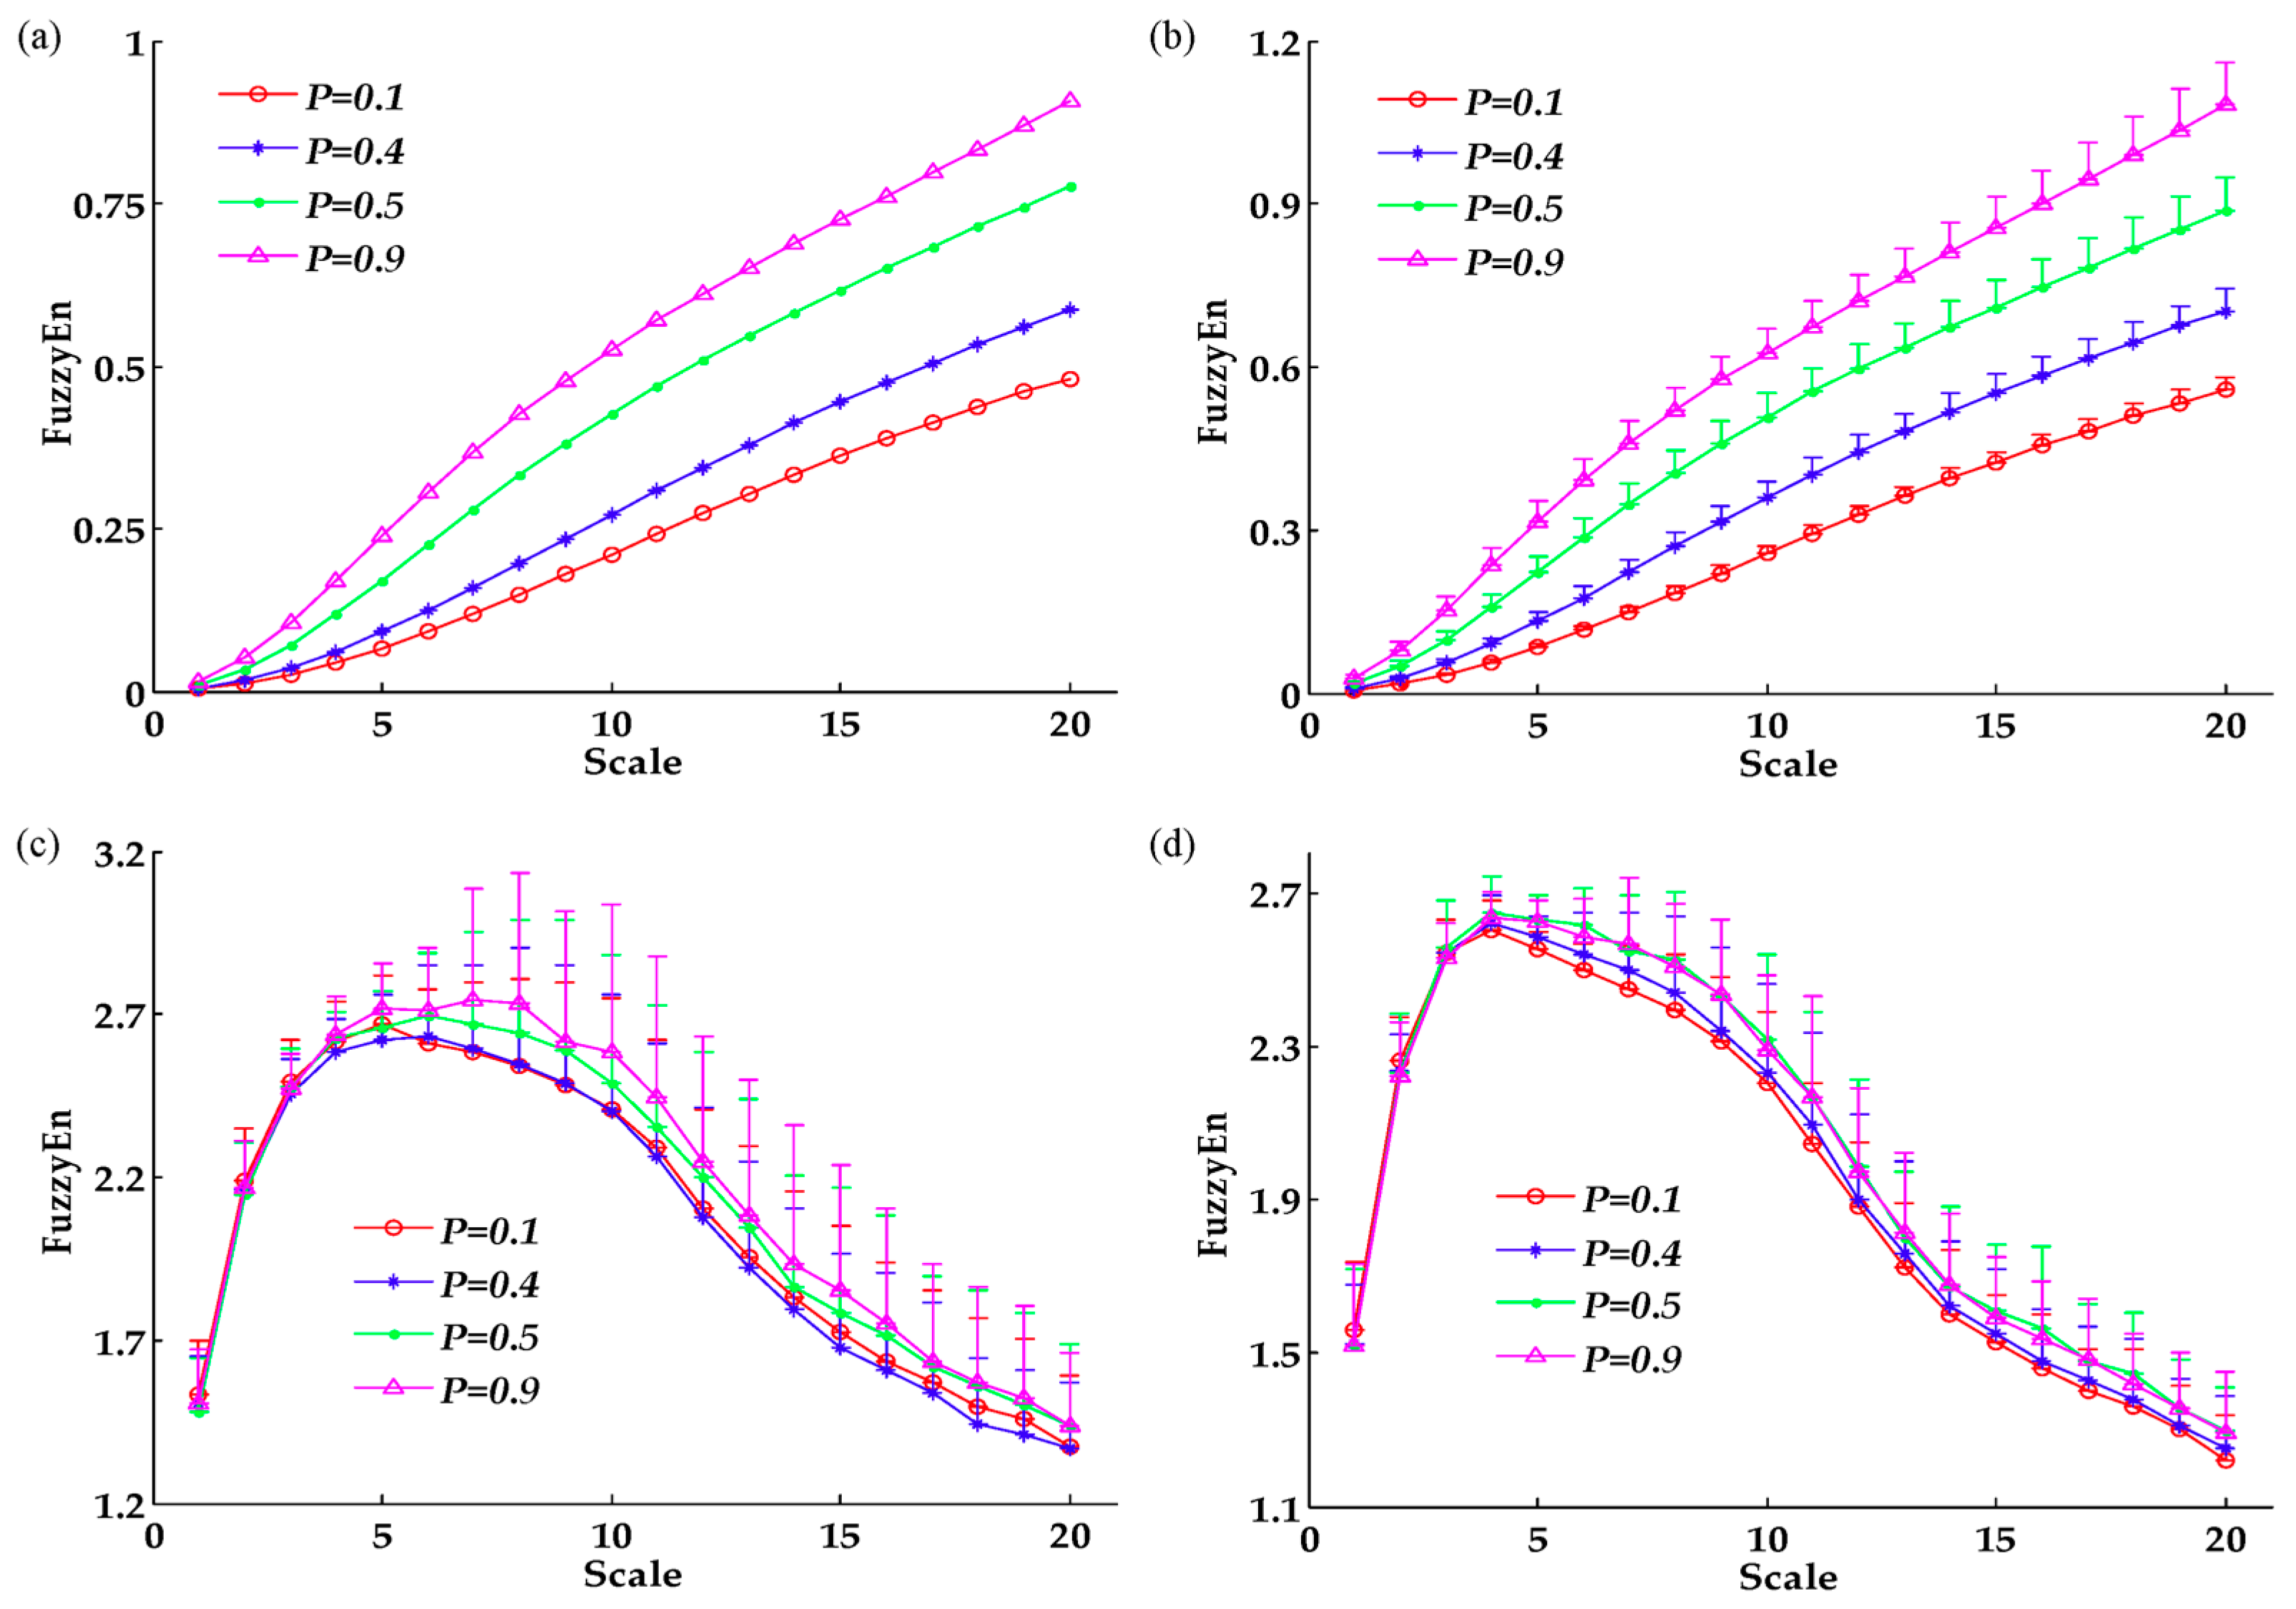
The averaged MSFuzzyEn values over 12 subjects of target trajectories, actual trajectories, biceps EMG signals, and triceps EMG signals are displayed in Figure 3. Both target and actual trajectories increased monotonically from Scale 1 to Scale 20, but the actual trajectories had a higher FuzzyEn than the target trajectories. The FuzzyEn of the biceps EMG and triceps EMG also presented a significant rise from Scale 1 to Scale 5, while there was a significant fall from Scale 5 to Scale 20. After successively coarse-graining, the FuzzyEn at Scale 20 dropped to a similar value at Scale 1. Figure 3 also shows the effects of task demands on motor performance. A higher FuzzyEn at higher levels was observed for target and actual trajectories over multiple time scales. Two-factor ANOVA (repeated measure) suggested that: (1) the time scale factor significantly affected the mean FuzzyEn of the actual trajectories (p-value < 0.01, η2 = 0.998), biceps EMG (p-value < 0.01, η2 = 0.90), and triceps EMG (p-value < 0.01, η2 = 0.96); and (2) the task demands factor had a significant effect on the mean FuzzyEn of the actual trajectories (p-value < 0.01, η2 = 0.98) and triceps EMG (p-value < 0.01, η2 = 0.45).
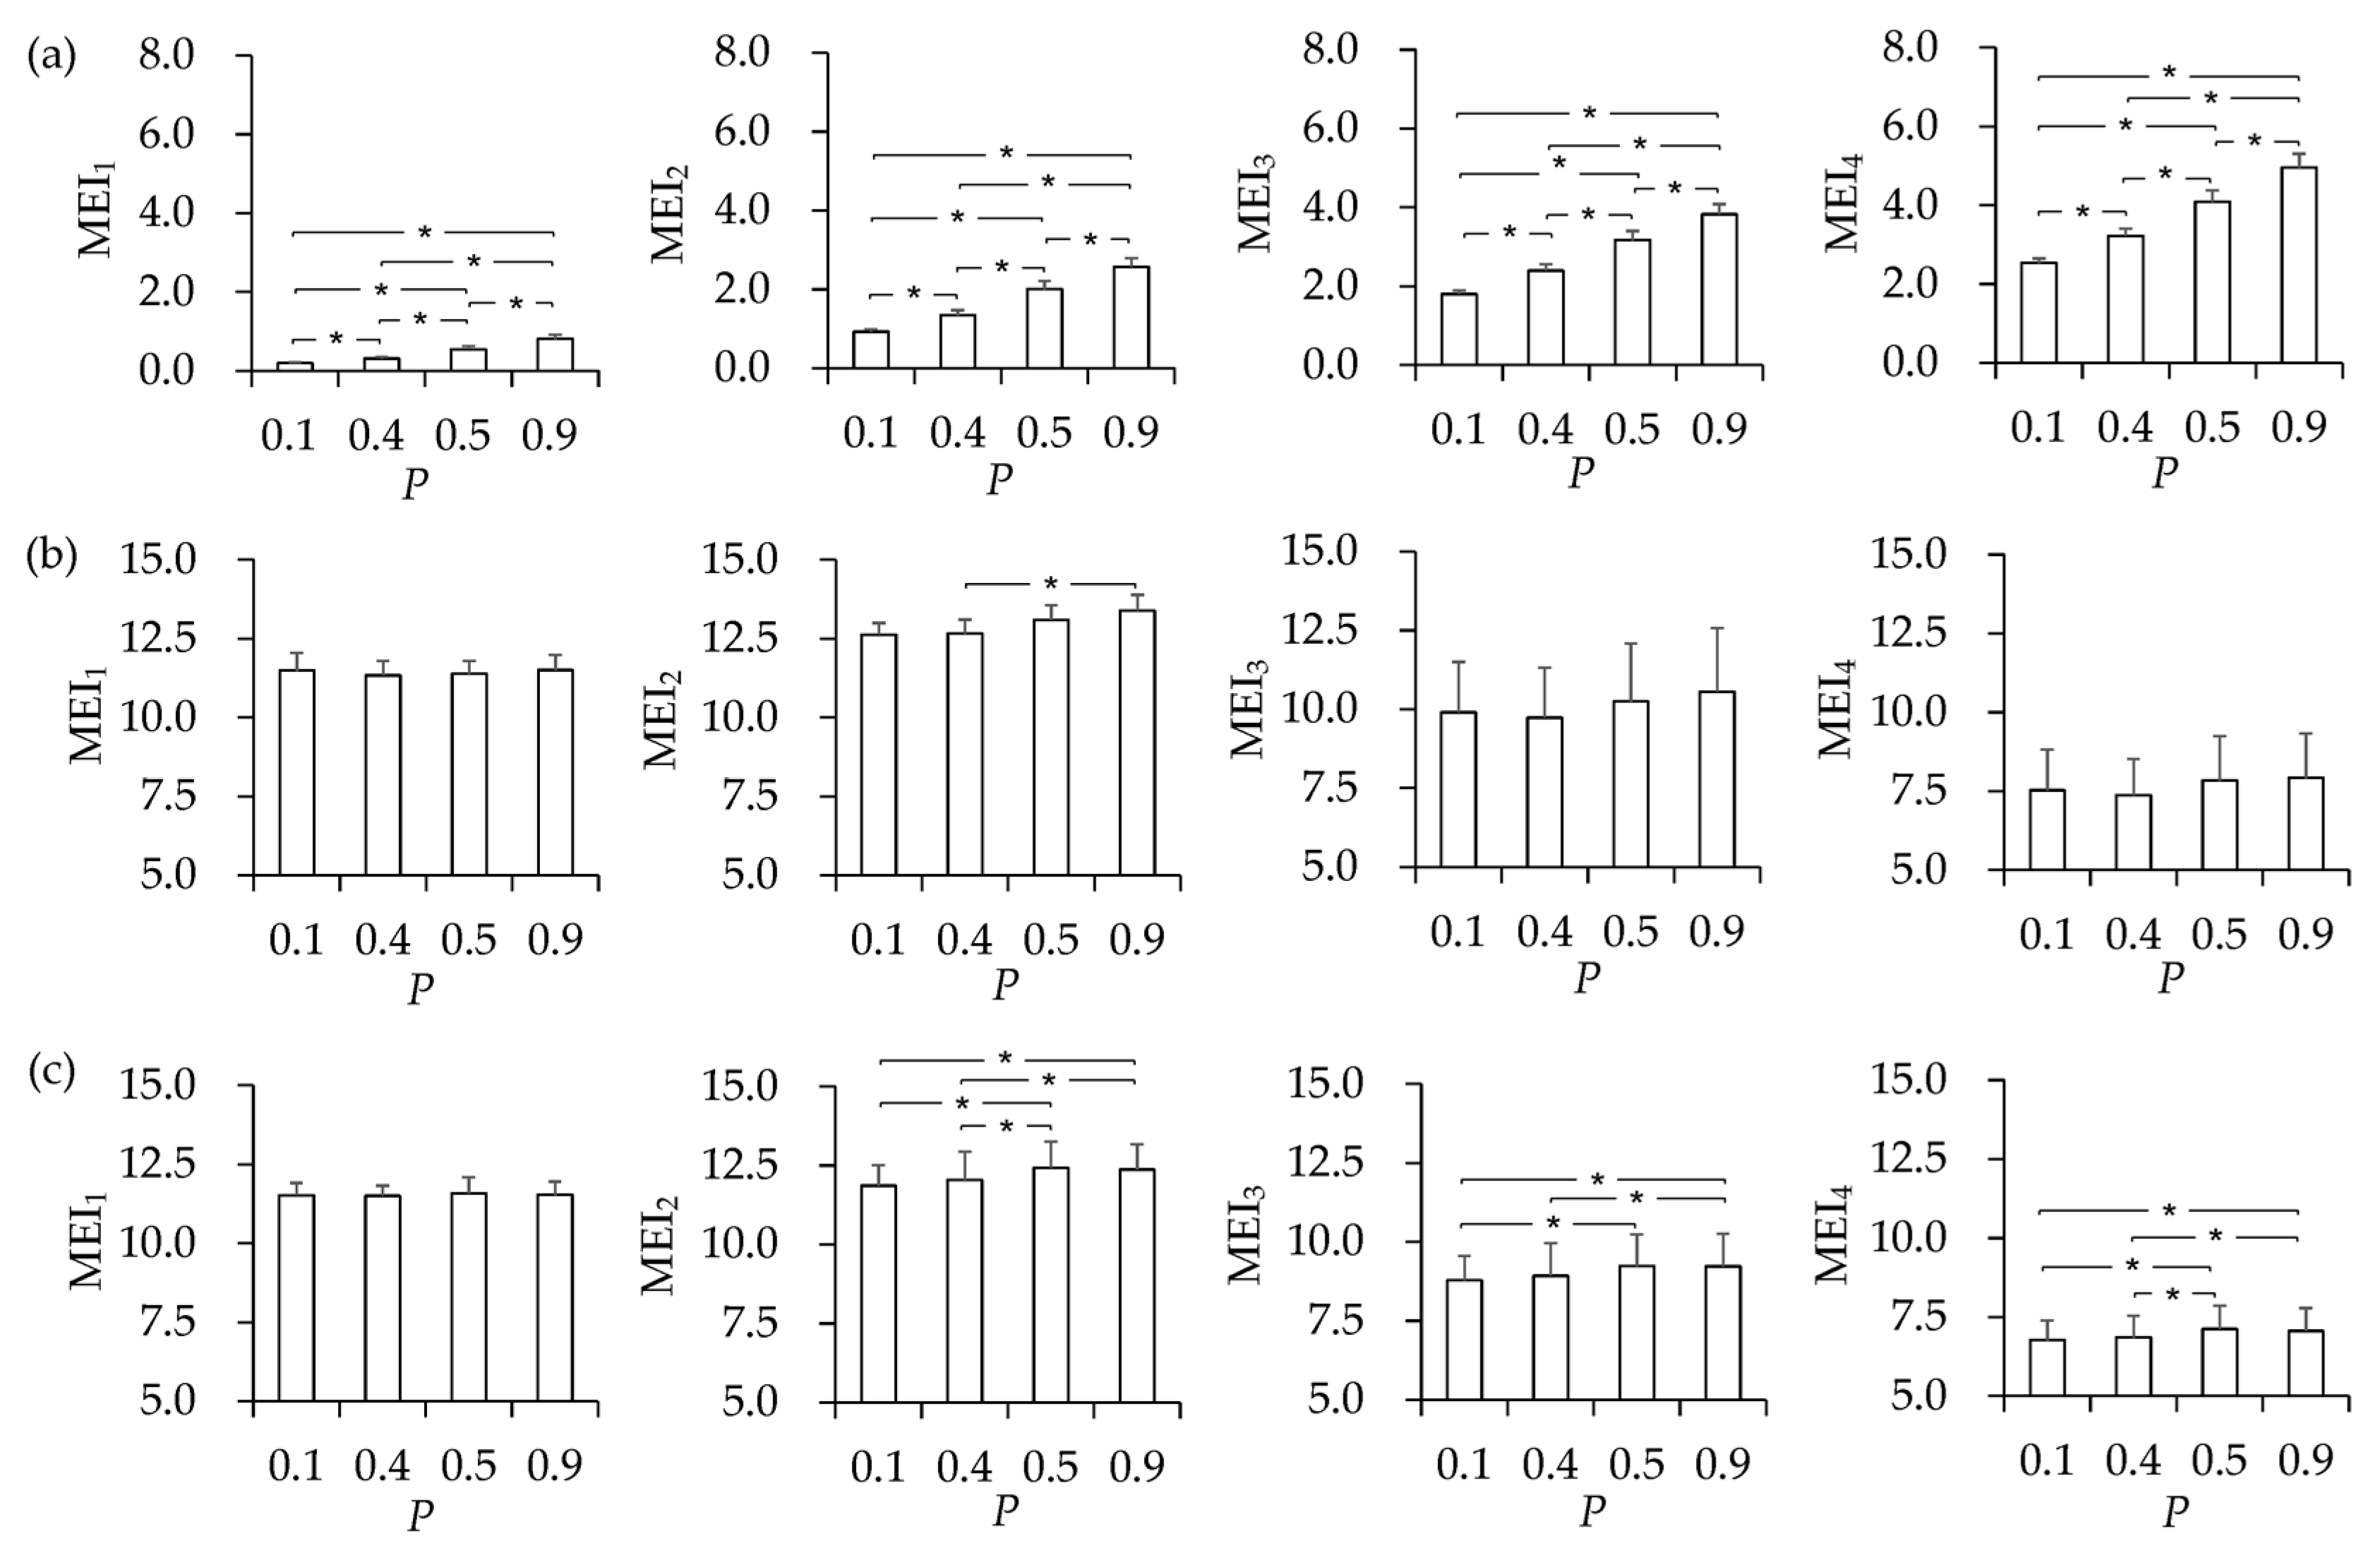
As seen in Figure 4, a more obvious difference between the different levels was found at larger time scales. The FuzzyEn of the trajectories and EMG signals over multiple time scales was divided into four scale (τ) intervals. Figure 4a showed a significant increase of the FuzzyEn in higher levels for the actual trajectories (p-value < 0.05). Considering that the MEIi was affected by task demands, the effect size (η2) for all subjects was 0.97, 0.98, 0.99, and 0.98, respectively when i = 1, 2, 3, 4. In the smallest scale interval (1 ≤ τ ≤ 5), the FuzzyEn of the EMG signals observed no obvious phenomenon towards different task demands (biceps: p-value = 0.44, η2 = 0.25; triceps: p-value = 0.64, η2 = 0.05). A significant increase of the biceps EMG in FuzzyEn was found in scale interval 6 ≤ τ ≤ 10 (p-value < 0.05, η2 = 0.21). Despite the lack of significant difference, the obvious rises were also observed in the last two scale intervals (11 ≤ τ ≤ 15: p-value = 0.054, η2 = 0.20; 16 ≤ τ ≤ 20: p-value = 0.07, η2 = 0.19). The effect of task demands on the triceps EMG were more obvious when compared with the biceps EMG. As Figure 4c shows, the FuzzyEn increased when task demands increased in the last three scale intervals (6 ≤ τ ≤ 10: p-value < 0.05, η2 = 0.44; 11 ≤ τ ≤ 15: p-value < 0.05, η2 = 0.36; 16 ≤ τ ≤ 20: p-value < 0.05, η2 = 0.42).
4. Discussion
The study aimed to investigate the effects of task demands on motor performance during elbow tracking tasks. Based on the target trajectories, actual trajectories, and surface EMG signals, the RMSE and MSFuzzyEn methods were applied to reflect the tracking accuracy and the complexity variations of the neuromuscular system, respectively.
4.1. MSFuzzyEn Analysis of Trajectories and EMG Signals
In accordance with the MSFuzzyEn of the target trajectories, the FuzzyEn of the actual trajectories displayed a monotonic increase over multiple time scales (1 ≤ τ ≤ 20), and the FuzzyEn of the EMG signals also observed a rise from Scale 1 to Scale 5. This finding was consistent with the study reported by Costa et al. [22], where the SampEn of the heart rate time series gradually increased from Scale 1 to Scale 6 for healthy young and old individuals. Kang et al. [27] observed an increased SampEn of EEG signals from Scale 1 to Scale 20 in rats, and it has been suggested that signals at larger scales could produce a higher entropy (FuzzyEn/SampEn) due to a shorter data length [28,31].
Nevertheless, in our study, contrasting results were found at larger time scales for EMG signals. Similar results were reported by Gu et al. in the study of EMG signals from leg muscles during treadmill walking [24]. The EMG signals during gait observed a lower entropy at larger time scales (4 ≤ τ ≤ 40) for healthy young and old individuals. The loss of complexity at larger time scales was also demonstrated in the study of the human heartbeat and gait time series [25,32]. Gu et al. [24] deemed it possible to obtain results from the elimination of uncorrelated white noise at larger time scales. According to Costa et al. [32], the coarse-graining procedure progressively filtered out periodic components and uncorrelated random components such as white noise. Thus, the decline in FuzzyEn at larger time scales (5 ≤ τ ≤ 20) for EMG signals could have a relatively higher signal-to-noise ratio.
In addition, the complexity of physiological signals could be affected by time scale and noise. The difference in MSFuzzyEn between the trajectories and EMG signals revealed the different nature of these physiological signals. Since many non-physiological and physiological factors influence surface EMG signals [33], it was easy to confound the useful EMG signals with uncorrelated noises. In particular, surface EMG signals were weaker and more complex when compared with the tracking trajectories. Therefore, a rise at smaller time scales (1 ≤ τ ≤ 5) and a fall at larger time scales (6 ≤ τ ≤ 20) in the FuzzyEn of EMG signals was probably influenced by time scale and noise, respectively. Moreover, the monotonic increase from Scale 1 to Scale 20 in the FuzzyEn of actual trajectories may be mainly influenced by time scale instead of noise.
4.2. Effects of Task Demands on Trajectories and EMG Signals
The MSFuzzyEn method indicated that the actual trajectories became more complex when task demands increased during elbow tracking tasks. Ma et al. [34] observed the motor performance of elderly people when performing checker game moves ranging from 1 to 4 steps, and found that a more complex move generated a higher peak velocity and a less smooth trajectory than a simple move. This finding was consistent with our results that the RMSE progressively rose in the first three levels. The increased task demands at higher levels was mainly due to the increased movement frequency of target trajectories; thus, a more complex task elicited a rise in movement variability and tracking error [5,7]. Arif et al. [35] observed the effects of different speed demands on gait stability for healthy young and old individuals, and found a reduced stability towards increased speed demands. Kudoh et al. [36] observed the spatiotemporal variability during prehension movements, and found that the target distance significantly influenced the variability of wrist trajectories. Therefore, the reduced range of movement in Level 4 might be the reason for the decrease in RMSE from Levels 3 to 4.
The effect of the task demands on the EMG signals were clearly observed after successive coarse graining (5 ≤ τ ≤ 20). The FuzzyEn of the EMG signals increased at higher levels, especially for the triceps which represented the EMG output, which became less regular facing with more complex tasks. As Morrison et al. [8] reported, a greater irregularity of EMG signals may have reflected less predictable muscle firing patterns. Specifically, the complexity of the EMG signals could be related to modifications in the neuromuscular system, including alternations of motor fiber recruitment, firing rate, muscle fiber conduction velocity, motor unit synchronization, etc. [37,38]. Although the entropy analysis has not been widely applied in the assessment of surface EMG signals, Ao et al. [28] observed complex changes for simulated EMG signals using the FuzzyEn method where their results showed an increase in the recruitment of motor fiber and firing rate, which could lead to a systematic increase in the complexity of the EMG signals.
This study revealed the nature of motor control towards different task demands. MSFuzzyEn at large time scales showed that an increase in task demands elicited more complex movement trajectories as a consequence of more unpredictable muscle firing patterns. Our results were consistent with a previous study where a decline in the FuzzyEn of postural sway and EMG signals from a stable condition to an unstable condition was found during different standing balance tasks [9]. Nevertheless, Morrison et al. [8] observed an inverse relationship in ApEn between postural sway and EMG signals towards different task demands. Based on the MSFuzzyEn analysis in our study, the FuzzyEn at smaller time scales was easily affected by uncorrelated noise. Since the two previous studies used single-scale entropies [8,9], their conflicting results may have been due to uncorrelated noise. Therefore, MSFuzzyEn analysis, especially at larger time scales, can provide a comprehensive analysis of physiological signals, and minimize the interference of uncorrelated noise. One limitation of this study was that we did not consider the influence of pathologies on movement trajectories and EMG signals, and further study will extend to MSFuzzyEn analysis across pathologies using different task demands.
5. Conclusions
In this study, MSFuzzyEn was utilized to analyze the complexity of movement trajectories and EMG signals during elbow tracking tasks across four levels of task demands for healthy young individuals. MSFuzzyEn at larger time scales showed that increased task demands elicited increased complexity in movement trajectories and EMG signals, which may have resulted from increased movement frequency and less predictable muscle firing patterns, respectively. Thus, MSFuzzyEn analysis may be able to provide a comprehensive insight into motor control towards different task demands.
Acknowledgments
The project was supported by the National Natural Science foundation of China (Grant Nos. 61273359 and 91520201), the Guangdong Science and Technology Planning Project (Grant Nos. 2014B090901056 and 2015B020214003) and the Guangzhou Research Collaborative Innovation Projects (Grant No. 201604020108).
Author Contributions
Yuanyu Wu and Rong Song conceived and designed the experiments; Yuanyu Wu performed the experiments and analyzed the data; Yuanyu Wu and Rong Song wrote the paper. All authors have read and approved the final manuscript.
Conflicts of Interest
The authors declare no conflict of interest.
References
- Schlerf, J.E.; Ivry, R.B. Task goals influence online corrections and adaptation of reaching movements. J. Neurophysiol. 2011, 106, 2622–2631. [Google Scholar] [CrossRef] [PubMed]
- Berthier, N.E.; Clifton, R.K.; Gullapalli, V.; Mccall, D.D.; Robin, D.J. Visual information and object size in the control of reaching. J. Mot. Behav. 1996, 28, 187–197. [Google Scholar] [CrossRef] [PubMed]
- Hong, S.L.; Newell, K.M. Motor entropy in response to task demands and environmental information. Chaos 2008, 18, 113–131. [Google Scholar] [CrossRef] [PubMed]
- Hong, S.L.; Newell, K.M. Entropy compensation in human motor adaptation. Chaos 2008, 18, 387–416. [Google Scholar] [CrossRef] [PubMed]
- Selen, L.P.; van Dieën, J.H.; Beek, P.J. Impedance modulation and feedback corrections in tracking targets of variable size and frequency. J. Neurophysiol. 2006, 96, 2750–2759. [Google Scholar] [CrossRef] [PubMed]
- Shin, H.-K; Park, J.-W.; Ryu, Y.U. Influence of movement speed on accuracy of tracking performance following stroke. J. Phys. Ther. Sci. 2011, 23, 141–144. [Google Scholar] [CrossRef]
- Miall, R.C.; Weir, D.J.; Stein, J.F. Intermittency in human manual tracking tasks. J. Mot. Behav. 1993, 25, 53–63. [Google Scholar] [CrossRef] [PubMed]
- Morrison, S.; Hong, S.L.; Newell, K.M. Inverse relations in the patterns of muscle and center of pressure dynamics during standing still and movement postures. Exp. Brain Res. 2007, 181, 347–358. [Google Scholar] [CrossRef] [PubMed]
- Barbado, M.D.; Sabido, S.R.; Veragarcia, F.J.; Gusi, F.N.; Moreno, F.J. Effect of increasing difficulty in standing balance tasks with visual feedback on postural sway and EMG: Complexity and performance. Hum. Mov. Sci. 2012, 31, 1224–1237. [Google Scholar] [CrossRef] [PubMed]
- Fitts, P.M. The information capacity of the human motor system in controlling the amplitude of movement. J. Exp. Psychol. 1954, 121, 262–269. [Google Scholar] [CrossRef]
- Hyman, R. Stimulus information as a determinant of reaction time. J. Exp. Psychol. 1953, 45, 188. [Google Scholar] [CrossRef] [PubMed]
- Shannon, C.E. A mathematical theory of communication. Bell Syst. Tech. J. 1948, 5, 3–55. [Google Scholar]
- Sm, P. Approximate entropy as a measure of system complexity. Proc. Natl. Acad. Sci. USA 1991, 88, 2297–2301. [Google Scholar]
- Richman, J.S.; Moorman, J.R. Physiological time-series analysis using approximate entropy and sample entropy. Am. J. Physiol. Heart Circ. Physiol. 2000, 278, H2039–H2049. [Google Scholar] [PubMed]
- Chen, W.; Wang, Z.; Xie, H.; Yu, W. Characterization of surface EMG signal based on fuzzy entropy. IEEE Trans. Neural Syst. Rehabil. Eng. 2007, 15, 266–272. [Google Scholar] [CrossRef] [PubMed]
- Xie, H.B.; Guo, J.Y.; Zheng, Y.P. Fuzzy approximate entropy analysis of chaotic and natural complex systems: Detecting muscle fatigue using electromyography signals. Ann. Biomed. Eng. 2010, 38, 1483–1496. [Google Scholar] [CrossRef] [PubMed]
- Caldirola, D.; Bellodi, L.; Caumo, A.; Migliarese, G.; Perna, G. Approximate entropy of respiratory patterns in panic disorder. Am. J. Psychiatry 2004, 161, 79–87. [Google Scholar] [CrossRef] [PubMed]
- Hu, X.; Miller, C.; Vespa, P.; Bergsneider, M. Adaptive computation of approximate entropy and its application in integrative analysis of irregularity of heart rate variability and intracranial pressure signals. Med. Eng. Phys. 2008, 30, 631–639. [Google Scholar] [CrossRef] [PubMed]
- Yentes, J.M.; Hunt, N.; Schmid, K.K.; Kaipust, J.P.; Mcgrath, D.; Stergiou, N. The appropriate use of approximate entropy and sample entropy with short data sets. Ann. Biomed. Eng. 2013, 41, 349–365. [Google Scholar] [CrossRef] [PubMed]
- Xie, H.B.; Chen, W.T.; He, W.X.; Liu, H. Complexity analysis of the biomedical signal using fuzzy entropy measurement. Appl. Soft Comput. 2011, 11, 2871–2879. [Google Scholar] [CrossRef]
- Costa, M.D.; Peng, C.K.; Goldberger, A.L. Multiscale analysis of heart rate dynamics: Entropy and time irreversibility measures. Cardiovasc. Eng. 2008, 8, 88–93. [Google Scholar] [CrossRef] [PubMed]
- Costa, M.; Goldberger, A.L.; Peng, C.K. Multiscale entropy analysis of complex physiologic time series. Phys. Rev. Lett. 2002, 92, 705–708. [Google Scholar] [CrossRef] [PubMed]
- Navaneethakrishna, M.; Karthick, P.A.; Ramakrishnan, S. Analysis of biceps brachii semg signal using multiscale fuzzy approximate entropy. In Proceedings of the International Conference of the IEEE Engineering in Medicine and Biology Society, Milan, Italy, 25–29 August 2015; pp. 7881–7884. [Google Scholar]
- Gu, K.H.; Dingwell, J.B. Differential changes with age in multiscale entropy of electromyography signals from leg muscles during treadmill walking. PLoS ONE 2016, 11, e0162034. [Google Scholar]
- Costa, M.; Peng, C.K.; Goldberger, A.L.; Hausdorff, J.M. Multiscale entropy analysis of human gait dynamics. Phys. A Stat. Mech. Appl. 2003, 330, 53–60. [Google Scholar] [CrossRef]
- Costa, M.D.; Goldberger, A.L. Generalized multiscale entropy analysis: Application to quantifying the complex volatility of human heartbeat time series. Entropy 2015, 17, 1197–1203. [Google Scholar] [CrossRef] [PubMed]
- Kang, X.; Jia, X.; Geocadin, R.G.; Thakor, N.V.; Maybhate, A. Multiscale entropy analysis of EEG for assessment of post-cardiac arrest neurological recovery under hypothermia in rats. IEEE Trans. Biomed. Eng. 2009, 56, 1023–1031. [Google Scholar] [CrossRef] [PubMed]
- Ao, D.; Sun, R.; Tong, K.Y.; Song, R. Characterization of stroke- and aging-related changes in the complexity of EMG signals during tracking tasks. Ann. Biomed. Eng. 2015, 43, 990–1002. [Google Scholar] [CrossRef] [PubMed]
- Zhou, P.; Barkhaus, P.E.; Zhang, X.; Rymer, W.Z. Characterizing the complexity of spontaneous motor unit patterns of amyotrophic lateral sclerosis using approximate entropy. J. Neural Eng. 2011, 8, 327–340. [Google Scholar] [CrossRef] [PubMed]
- Pan, W.Y.; Su, M.C.; Wu, H.T.; Lin, M.C.; Tsai, I.; Sun, C.K. Multiscale entropy analysis of heart rate variability for assessing the severity of sleep disordered breathing. Entropy 2015, 17, 231–243. [Google Scholar] [CrossRef]
- Chen, W.; Zhuang, J.; Yu, W.; Wang, Z. Measuring complexity using FuzzyEn, ApEn, and SampEn. Med. Eng. Phys. 2008, 31, 61–68. [Google Scholar] [CrossRef] [PubMed]
- Costa, M.; Goldberger, A.L.; Peng, C.K. Multiscale entropy analysis of biological signals. Phys. Rev. E 2005, 71, 021906. [Google Scholar] [CrossRef] [PubMed]
- Farina, D.; Merletti, R.; Enoka, R.M. The extraction of neural strategies from the surface EMG. J. Appl. Physiol. 2004, 96, 1486–1495. [Google Scholar] [CrossRef] [PubMed]
- Ma, H.I.; Trombly, C.A. Effects of task complexity on reaction time and movement kinematics in elderly people. Am. J. Occup. Ther. 2004, 58, 150–158. [Google Scholar] [CrossRef] [PubMed]
- Arif, M.; Ohtaki, Y.; Nagatomi, R.; Inooka, H. Estimation of the effect of cadence on gait stability in young and elderly people using approximate entropy technique. Meas. Sci. Rev. 2004, 4, 29–40. [Google Scholar]
- Kudoh, N.; Hattori, M.; Numata, N.; Maruyama, K. An analysis of spatiotemporal variability during prehension movements: Effects of object size and distance. Exp. Brain Res. 1997, 117, 457–464. [Google Scholar] [CrossRef] [PubMed]
- Fuglevand, A.J.; Winter, D.A.; Patla, A.E. Models of recruitment and rate coding organization in motor-unit pools. J. Neurophysiol. 1993, 70, 2470–2488. [Google Scholar] [PubMed]
- Zhou, P.; Rymer, W.Z. Factors governing the form of the relation between muscle force and the EMG: A simulation study. J. Neurophysiol. 2004, 92, 2878–2886. [Google Scholar] [CrossRef] [PubMed]
Figure 1.
Experimental setup: (a) block diagram of experimental setup; (b) computer interface of tracking tasks; (c) diagrammatic representations of the range of the elbow angle during the experiments.
Figure 1.
Experimental setup: (a) block diagram of experimental setup; (b) computer interface of tracking tasks; (c) diagrammatic representations of the range of the elbow angle during the experiments.
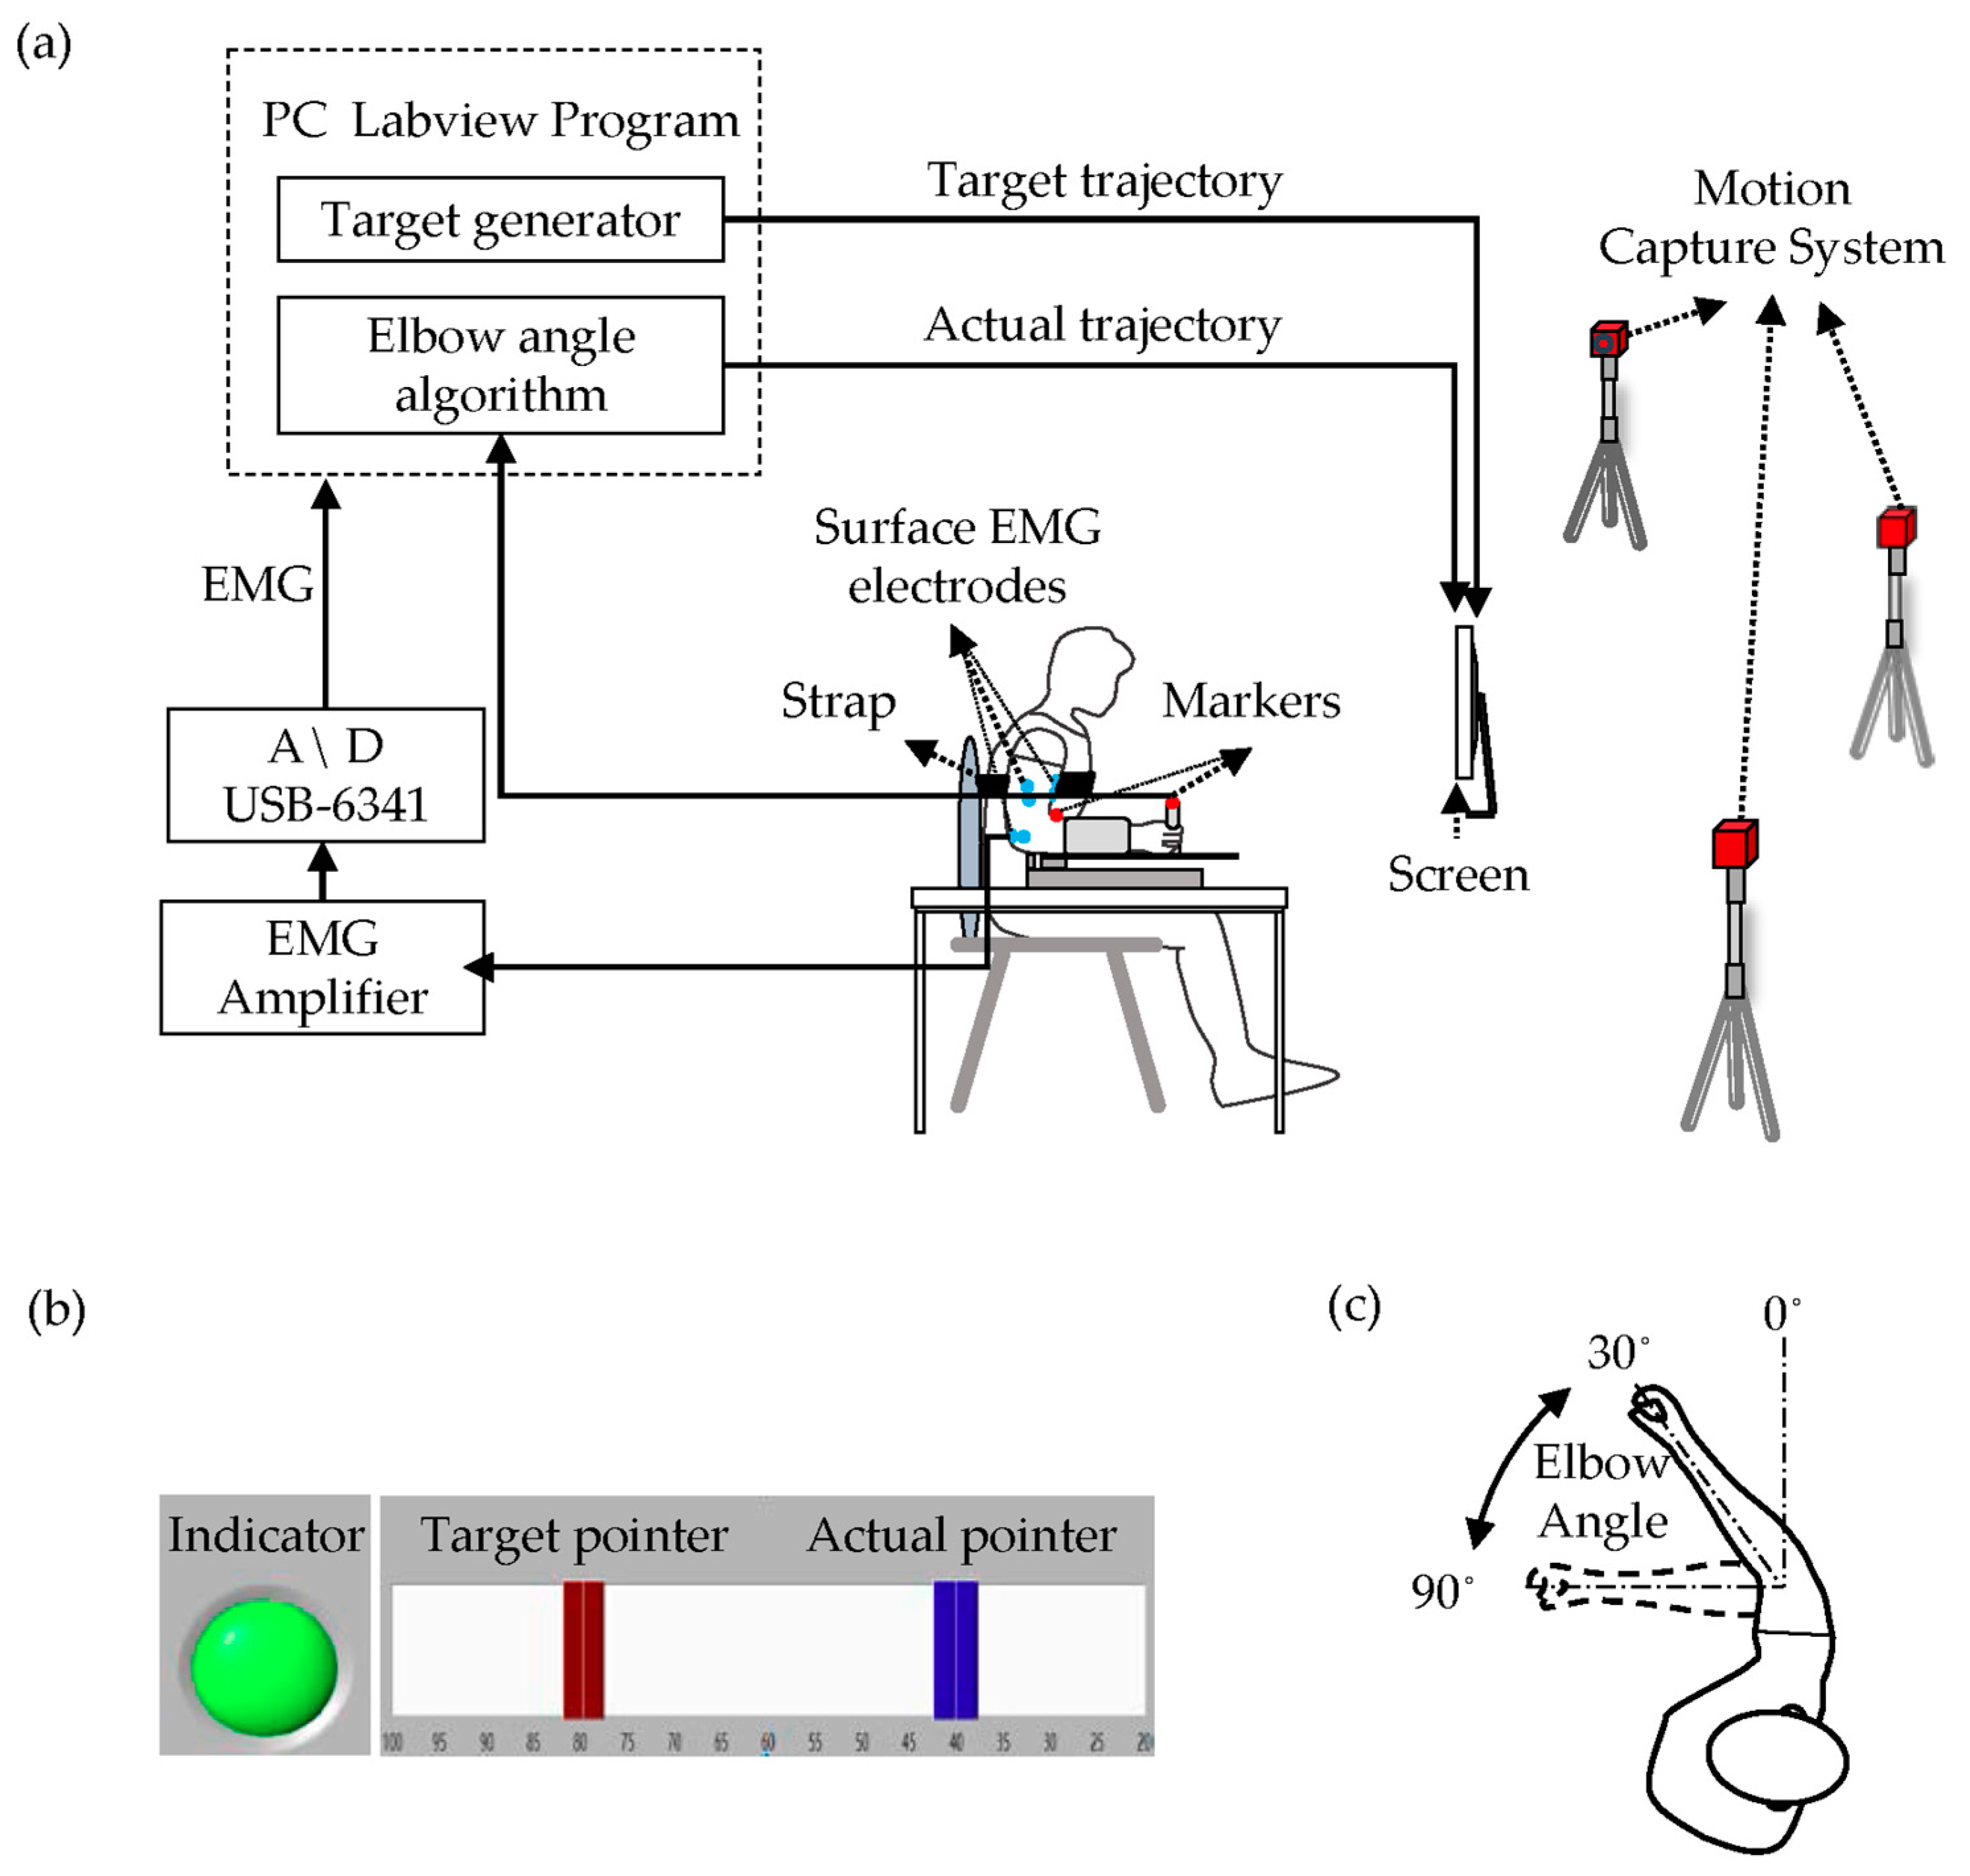
Figure 2.
A sample of denoised data during tracking tasks in four levels: (a) P = 0.1; (b) P = 0.4; (c) P = 0.5; (d) P = 0.9.
Figure 2.
A sample of denoised data during tracking tasks in four levels: (a) P = 0.1; (b) P = 0.4; (c) P = 0.5; (d) P = 0.9.
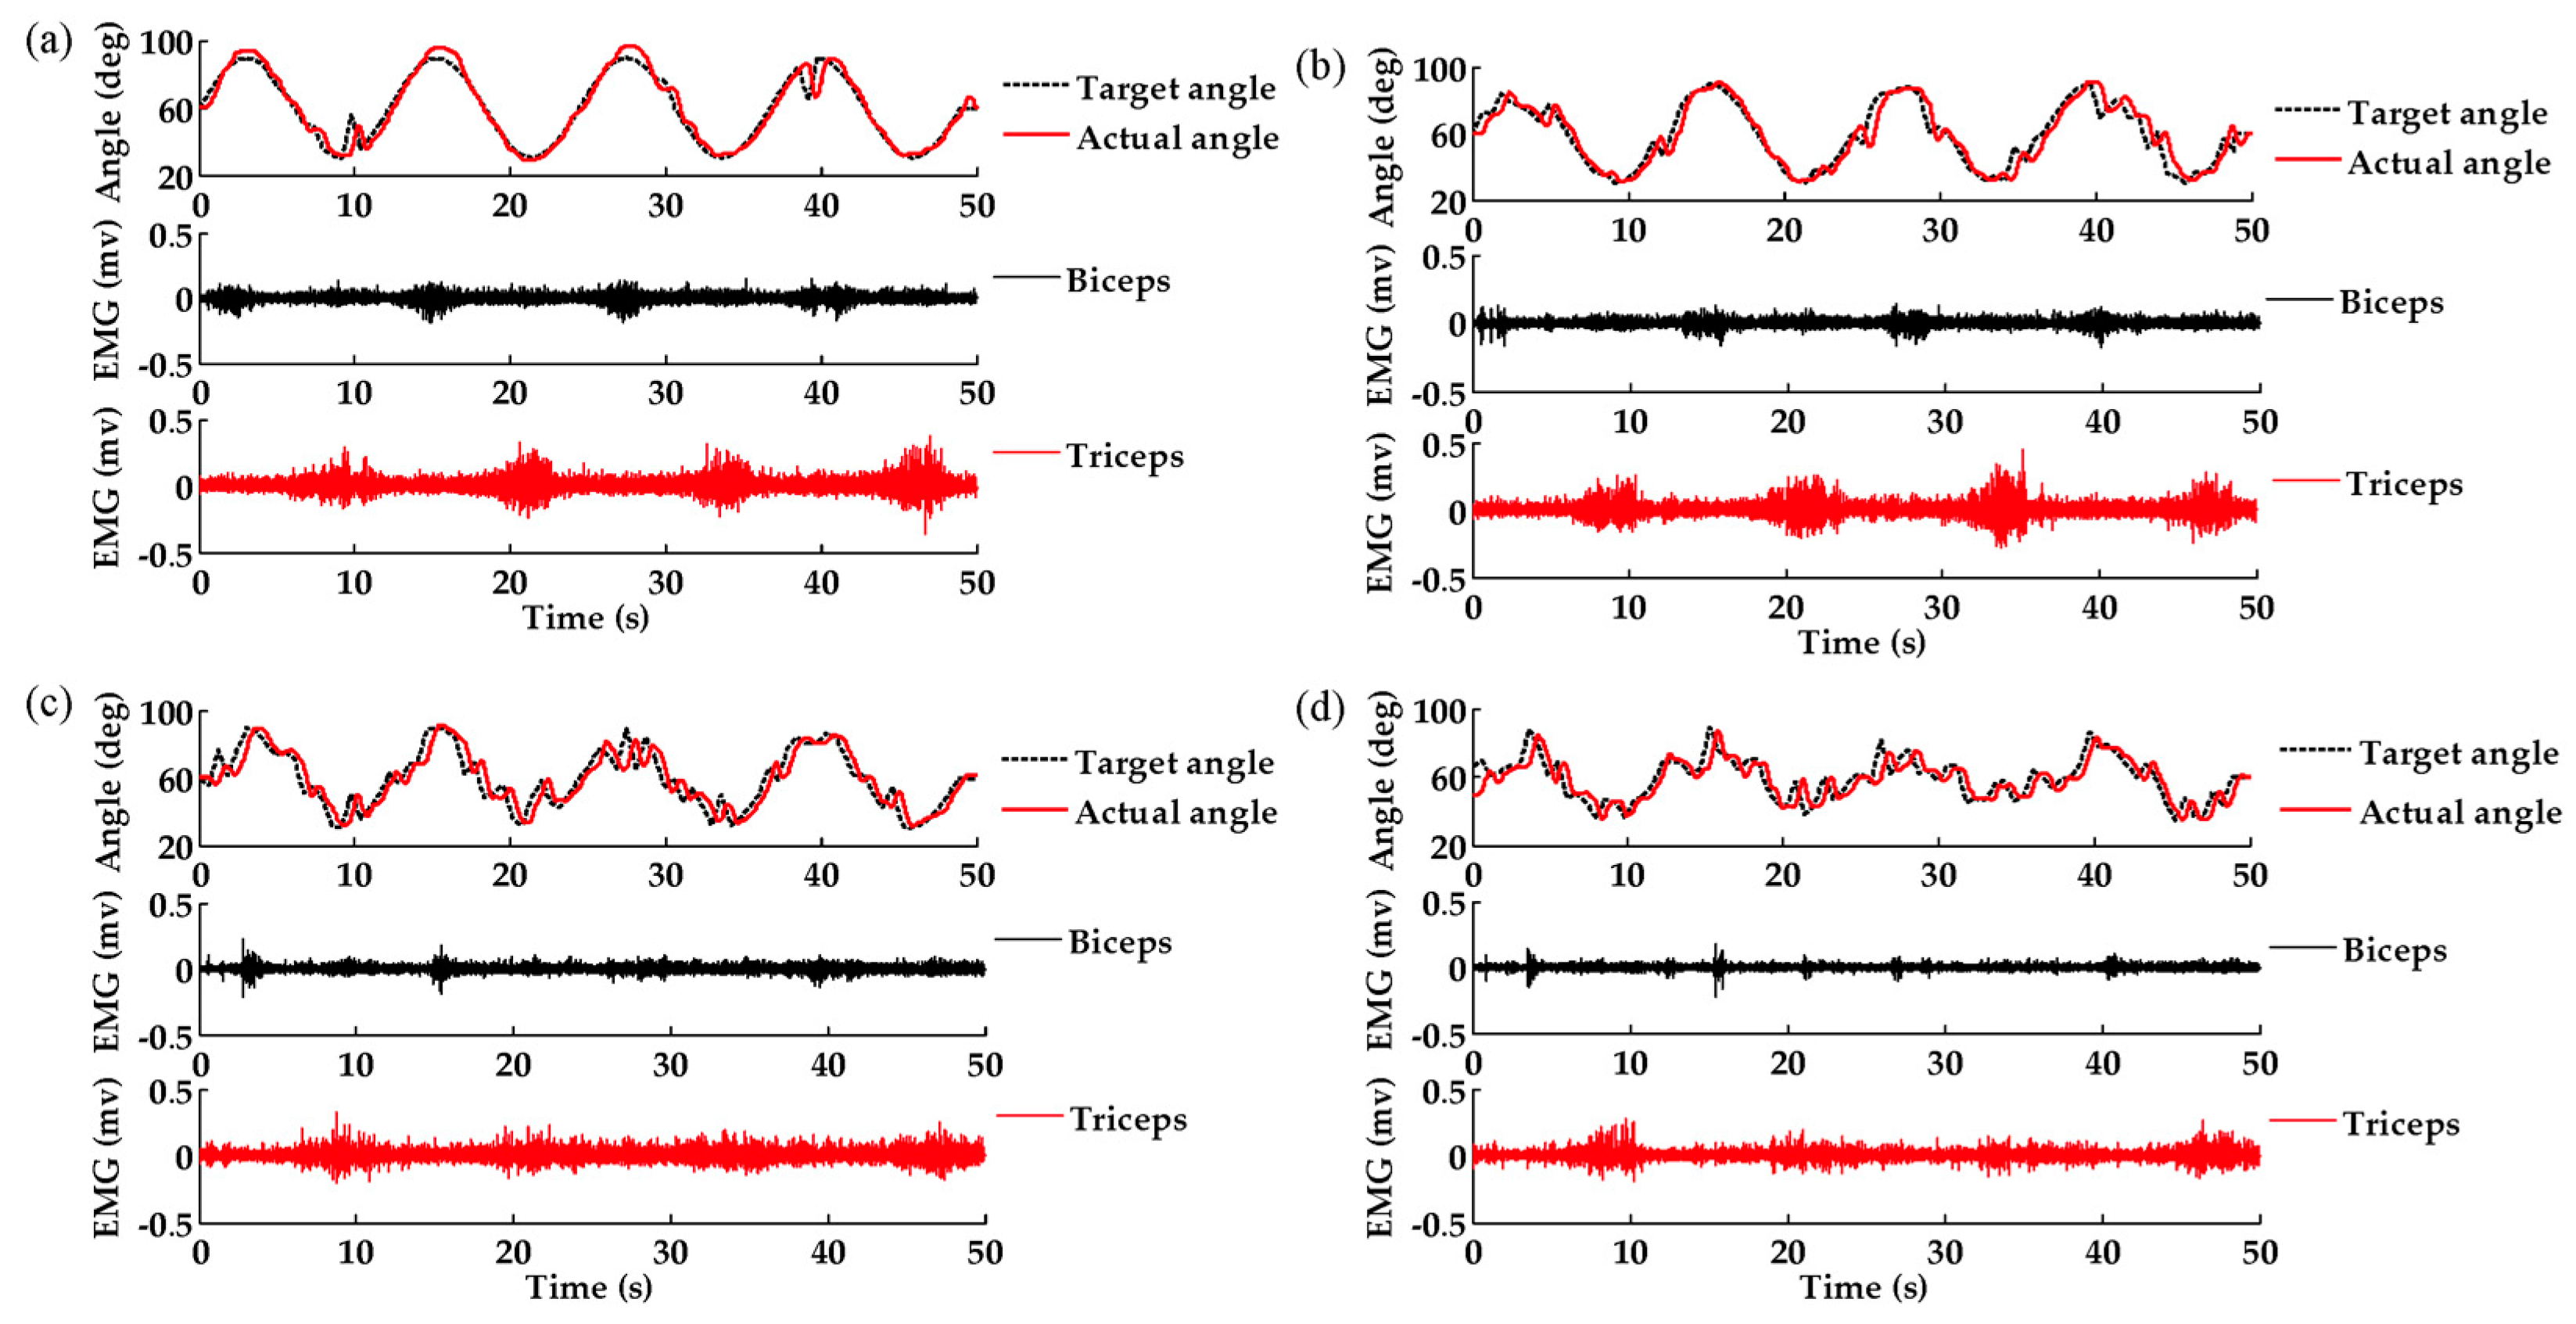
Figure 3.
The averaged MSFuzzyEn over 12 subjects of: (a) target trajectories; (b) actual trajectories; (c) biceps electromyographic (EMG) signals; (d) triceps EMG signals.
Figure 3.
The averaged MSFuzzyEn over 12 subjects of: (a) target trajectories; (b) actual trajectories; (c) biceps electromyographic (EMG) signals; (d) triceps EMG signals.

Figure 4.
The multiscale entropy index (MEI) at different scale intervals of: (a) actual trajectories; (b) biceps EMG signals; (c) triceps EMG signals. * Statistically significant difference (p-value < 0.05).
Figure 4.
The multiscale entropy index (MEI) at different scale intervals of: (a) actual trajectories; (b) biceps EMG signals; (c) triceps EMG signals. * Statistically significant difference (p-value < 0.05).

© 2017 by the authors. Licensee MDPI, Basel, Switzerland. This article is an open access article distributed under the terms and conditions of the Creative Commons Attribution (CC BY) license (http://creativecommons.org/licenses/by/4.0/).
Share and Cite
MDPI and ACS Style
Wu, Y.; Song, R. Effects of Task Demands on Kinematics and EMG Signals during Tracking Tasks Using Multiscale Entropy. Entropy 2017, 19, 307. https://doi.org/10.3390/e19070307
AMA Style
Wu Y, Song R. Effects of Task Demands on Kinematics and EMG Signals during Tracking Tasks Using Multiscale Entropy. Entropy. 2017; 19(7):307. https://doi.org/10.3390/e19070307
Chicago/Turabian StyleWu, Yuanyu, and Rong Song. 2017. "Effects of Task Demands on Kinematics and EMG Signals during Tracking Tasks Using Multiscale Entropy" Entropy 19, no. 7: 307. https://doi.org/10.3390/e19070307
Note that from the first issue of 2016, this journal uses article numbers instead of page numbers. See further details here.