1. Introduction
Many systems, across a wide array of disciplines, have been labeled “complex”. The striking analogies between these systems [
1,
2] beg the question: What collective properties do complex systems share and what quantitative techniques can we use to analyze these systems as a whole? With new measurement techniques and ever-increasing amounts of data becoming available about larger and larger systems, we are in a better position than ever before to understand the underlying dynamics and properties of these systems.
While few researchers agree on a specific definition of a complex system, common terms used to describe complex systems include “emergence” and “self-organization”, which characterize high-level properties in a system composed of many simpler sub-units. Often these sub-units follow local rules that can be described with much better accuracy than those governing the global system. Most definitions of complex systems include, in one way or another, the hallmark feature that the whole is more than the sum of its parts.
In the unified study of complex systems, a vast number of measures have been introduced to concretely quantify an intuitive notion of complexity (see, e.g., [
3,
4]). As Shalizi points out [
4], among the plethora of complexity measures proposed, roughly, there are two main threads: those that build on the notion of Kolmogorov complexity and those that use the tools of Shannon’s information theory. There are many systems for which the nature of their complexity seems to stem either from logical/computational/descriptive forms of complexity (hence, Kolmogorov complexity) and/or from information-theoretic forms of complexity. In this paper, we focus on information-theoretic measures.
While the unified study of complex systems is the ultimate goal, due to the broad nature of the field, there are still many sub-fields within complexity science [
1,
2,
5]. One such sub-field is the study of networks, and in particular, stochastic networks (broadly defined). Complexity in a stochastic network is often considered to be directly proportional to the level of stochastic interaction of the units that compose the network—this is where tools from information theory come in handy.
1.1. Information-Theoretic Measures of Complexity
Within the framework of considering stochastic interaction as a proxy for complexity, a few candidate measures of complexity have been developed and refined over the past decade. There is no consensus best measure, as each individual measure frequently captures some aspects of stochastic interaction better than others.
In this paper, we empirically examine four measures (described in detail later): (1) multi-information, (2) synergistic information, (3) total information flow, (4) geometric integrated information. Additional notable information-theoretic measures that we do not examine include those of Tononi et al., first proposed in [
6] and most recently refined in [
7], as a measure of consciousness, as well as similar measures of integrated information described by Barrett and Seth [
8], and Oizumi et al. [
9].
The term “humpology”, first coined by Crutchfield [
5], attempts to qualitatively describe a long and generally understood feature that a natural measure of complexity ought to have. In particular, as stochasticity varies from
to
, the structural complexity should be unimodal, with a maximum somewhere in between the extremes [
10]. For a physical analogy, consider the spectrum of molecular randomness spanning from a rigid crystal (complete order) to a random gas (complete disorder). At both extremes, we intuitively expect no complexity: a crystal has no fluctuations, while a totally random gas has complete unpredictability across time. Somewhere in between, structural complexity will be maximized (assuming it is always finite).
We now describe the four complexity measures of interest in this study. We assume a compositional structure of the system and consider a finite set
V of nodes. With each node
, we associate a finite set
of states. In the prime example of this article, the Boltzmann machine, we have
, and
for all
v. For any subset
, we define the state set of all nodes in
A as the Cartesian product
and use the abbreviation
. In what follows, we want to consider stochastic processes in
and assign various complexity measures to these processes. With a probability vector
,
, and a stochastic matrix
,
, we associate a pair
of random variables satisfying
Obviously, any such pair of random variables satisfies
, and
whenever
. As we want to assign complexity measures to transitions of the system state in time, we also use the more suggestive notation
instead of
. If we iterate the transition, we obtain a Markov chain
,
, in
, with
where, by the usual convention, the product on the right-hand side of this equation equals one if the index set is empty, that is, for
. Obviously, we have
, and
whenever
. Throughout the whole paper, we will assume that the probability vector
p is stationary with respect to the stochastic matrix
P. More precisely, we assume that for all
the following equality holds:
With this assumption, we have , and the distribution of does not depend on n. This will allow us to restrict attention to only one transition . In what follows, we define various information-theoretic measures associated with such a transition.
1.1.1. Multi-Information,
The multi-information is a measure proposed by McGill [
11] that captures the extent to which the whole is greater than the sum of its parts when averaging over time. For the above random variable
X, it is defined as
where the Shannon entropy
. (Here, and throughout this article, we take logarithms with respect to base 2.) It holds that
if and only if all of the parts,
, are mutually independent.
1.1.2. Synergistic Information,
The synergistic information, proposed by Edlund et al. [
12], measures the extent to which the (one-step) predictive information of the whole is greater than that of the parts. (For details related to the predictive information, see [
13,
14,
15].) It builds on the multi-information by including the dynamics through time in the measure:
where
denotes the mutual information between
X and
. One potential issue with the synergistic information is that it may be negative. This is not ideal, as it is difficult to interpret a negative value of complexity. Furthermore, a preferred baseline minimum value of 0 serves as a reference point against which one can objectively compare systems.
The subsequent two measures (total information flow and geometric integrated information) have geometric formulations that make use of tools from information geometry. In information geometry, the Kullback–Leibler divergence (KL divergence) is used to measure the dissimilarity between two discrete probability distributions. Applied to our context, we measure the dissimilarity between two stochastic matrices
P and
Q with respect to
p by
For simplicity, let us assume that
P and
Q are strictly positive and that
p is the stationary distribution of
P. In that case, we do not explicitly refer to the stationary distribution
p and simply write
. The KL divergence between
P and
Q can be interpreted by considering their corresponding Markov chains with distributions (
2) (e.g., see [
16] for additional details on this formulation). Denoting the chain of
P by
,
, and the chain of
Q by
,
, with some initial distributions
and
, respectively, we obtain
We can use the KL divergence (
5) to answer our original question—
To what extent is the whole greater than the sum of its parts?—by comparing a system of interest to its most similar (least dissimilar) system whose whole is exactly
equal to the sum of its parts. When comparing a transition
P to
Q using the KL divergence, one measures the amount of information lost when
Q is used to approximate
P. Hence, by constraining
Q to be equal to the sum of its parts, we can then arrive at a natural measure of complexity by taking the
minimum extent to which our distribution
P is greater (in the sense that it contains more information) than some distribution
Q, since
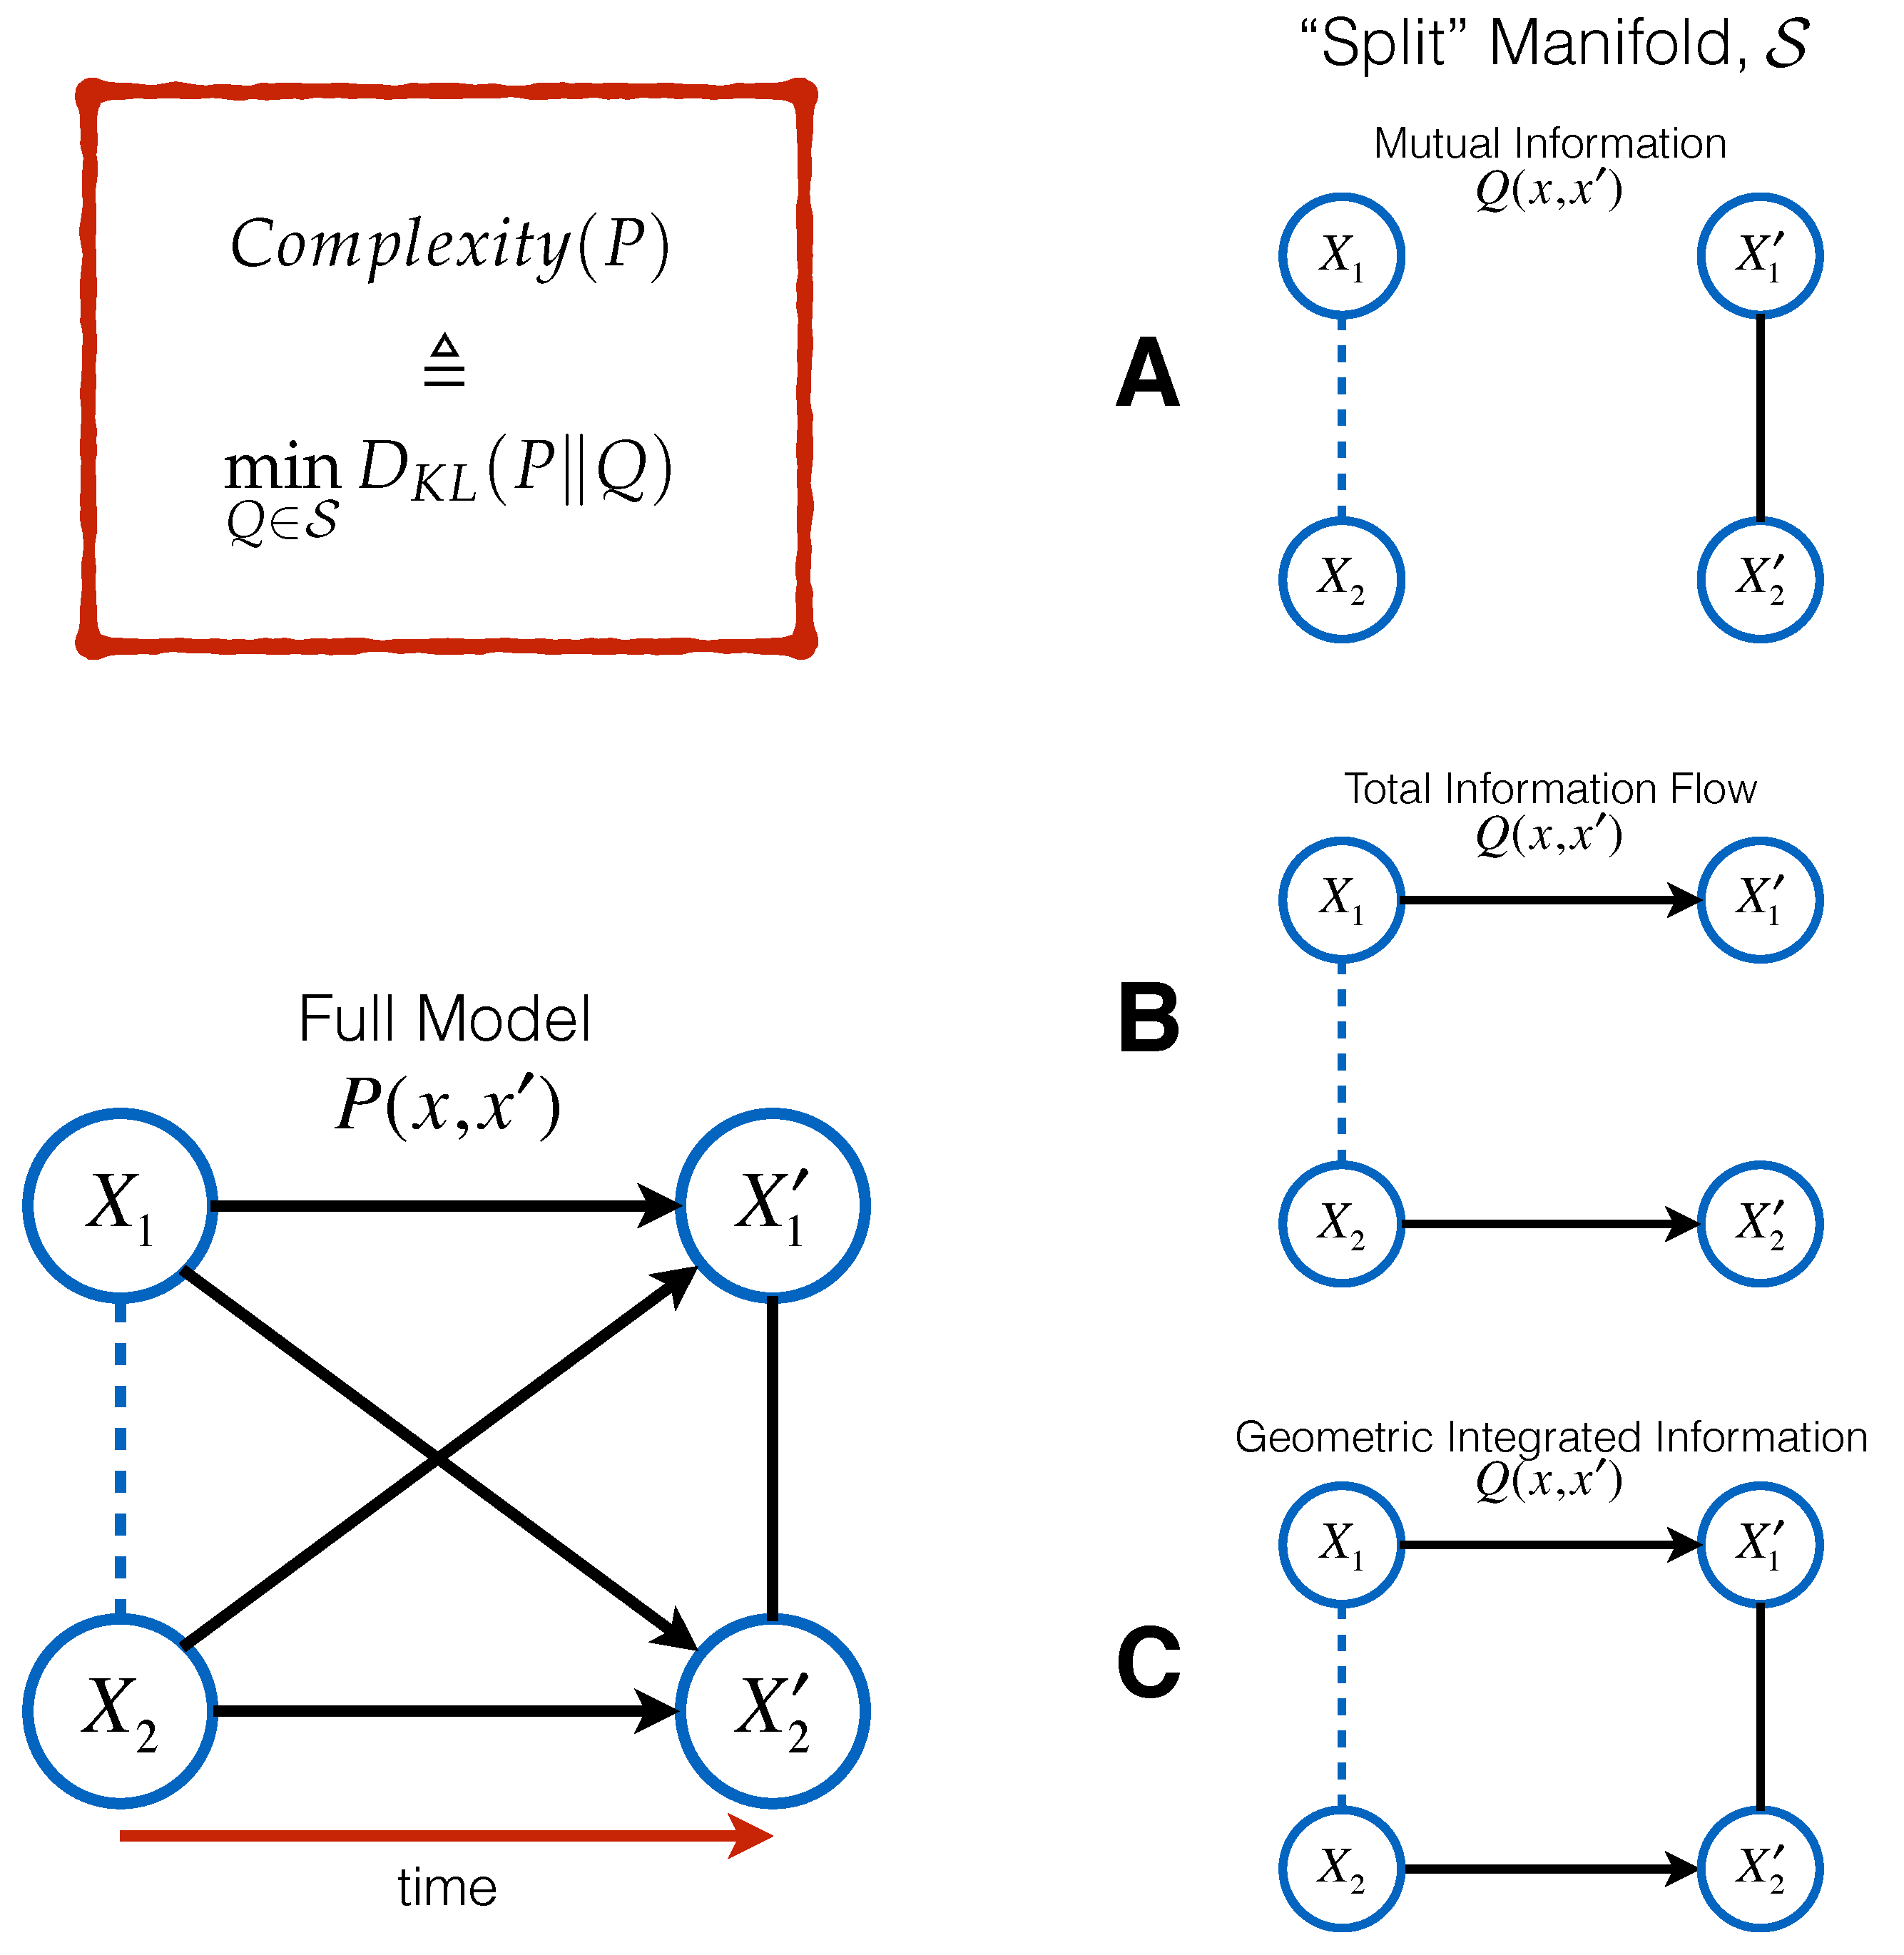
Q represents a system of zero complexity. Formally, one defines a manifold
, of so-called “split” systems, consisting of all those distributions that are equal to the sum of their parts, and then measures the minimum distance to that manifold:
It is important to note here that there are many different viable choices of split manifold
. This approach was first introduced by Ay for a general class of manifolds
[
17]. Amari [
18] and Oizumi et al. [
19] proposed variants of this quantity as measures of information integration. In what follows, we consider measures of the form (
6) for two different choices of
.
1.1.3. Total Information Flow,
The total information flow, also known as the stochastic interaction, expands on the multi-information (like
) to include temporal dynamics. Proposed by Ay in [
17,
20], the measure can be expressed by constraining
Q to the manifold of distributions,
, where there exists functions
,
, such that
Q is of the form:
where
denotes the partition function that properly normalizes the distribution. Note that any stochastic matrix of this kind satisfies the property that
. This results in
The total information flow is non-negative, as are all measures that can be expressed as a KL divergence. One issue of note, as pointed out in [
18,
19], is that
can exceed
. One can formulate the mutual information
as
where
consists of stochastic matrices
Q that satisfy
for some function
. Under this constraint,
. In other words, all spatio-temporal interactions
are lost. Thus, it has been postulated that no measure of information integration, such as the total information flow, should exceed the mutual information [
9]. The cause of this violation in the total information flow is due to the fact that
quantifies same-time interactions in
(due to the lack of an undirected edge in the output in
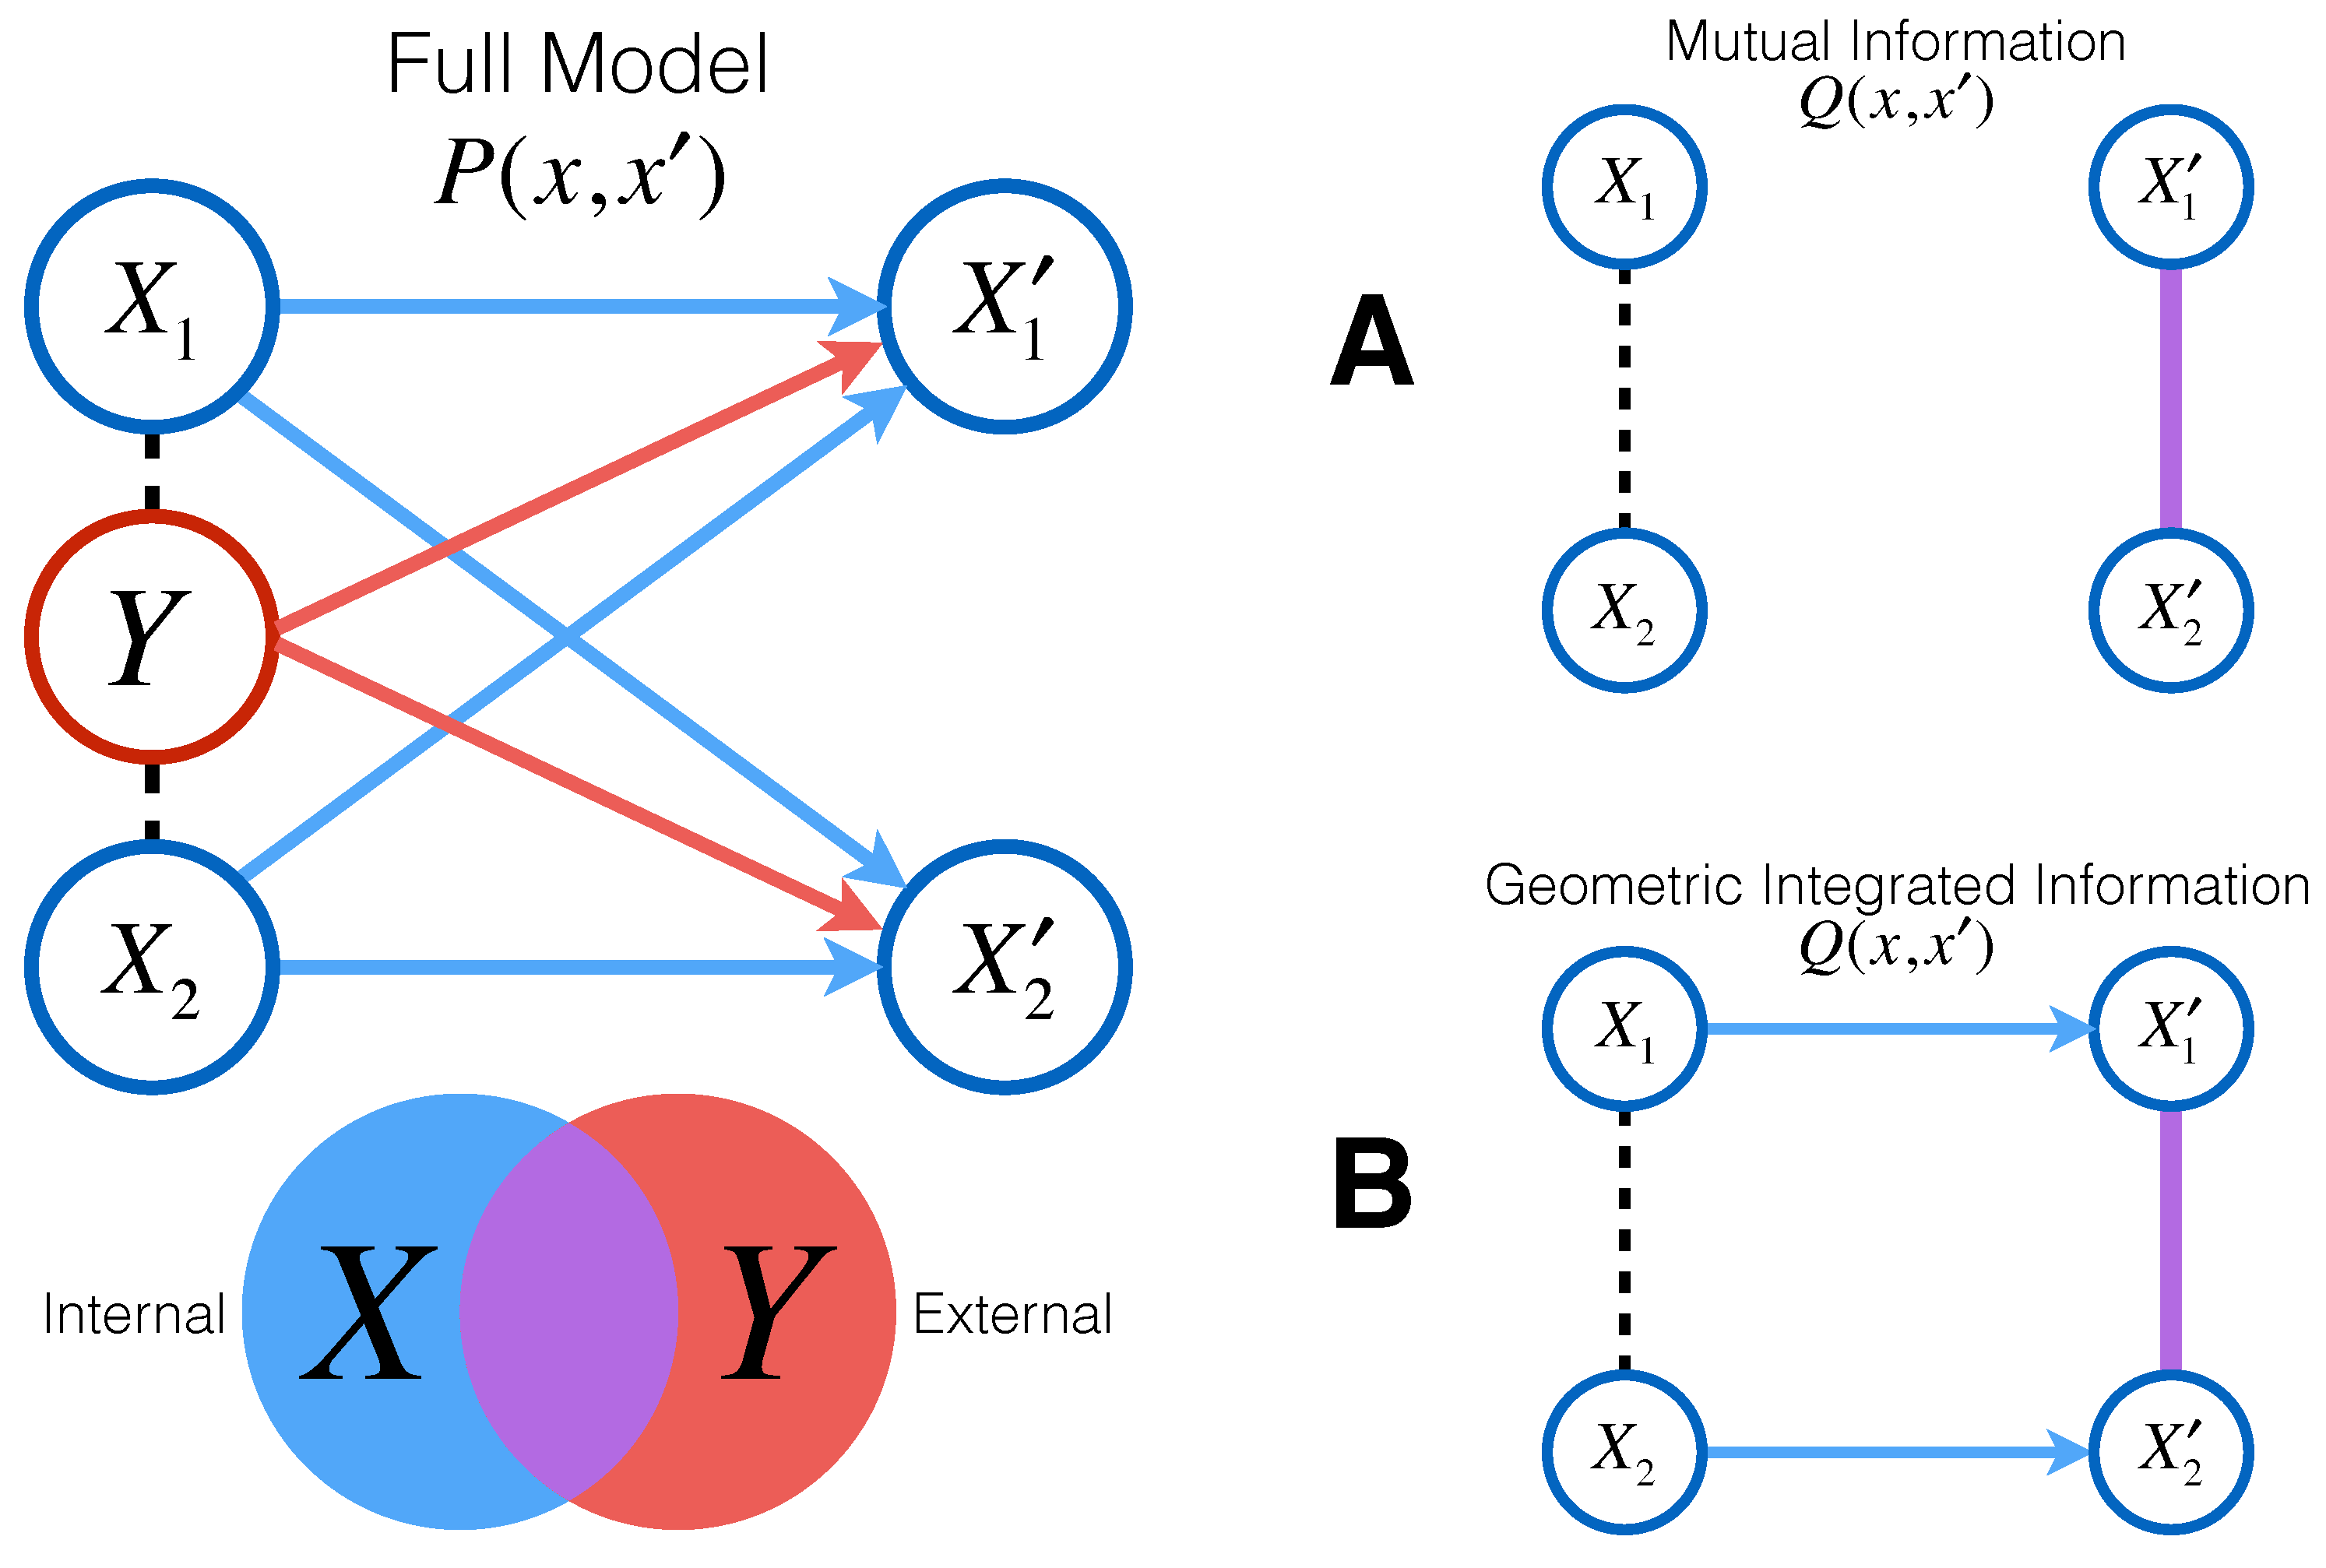
Figure 1B). Consider, for instance, a stochastic matrix
P that satisfies (
11),
for some probability vector
p. In that case, we have
. However, (
8) then reduces to the multi-information (
3) of
, which is a measure of stochastic dependence.
1.1.4. Geometric Integrated Information,
In order to obtain a measure of information integration that does not exceed the mutual information
, Amari [
18] (Section 6.9) defines
as
where
contains not only the split matrices (
7), but also those matrices that satisfy (
11). More precisely, the set
consists of all stochastic matrices for which there exists functions
,
, and
such that
Here,
Q belongs to the set of matrices where only time-lagged interactions are removed. Note that the manifold
contains
, the model of split matrices used for
, as well as
, the manifold used for the mutual information. This measure thus satisfies both postulates that
and
only partially satisfy:
However, unlike
, there is no closed-form expression to use when computing
. In this paper, we use the iterative scaling algorithm described in [
21] (Section 5.1) to compute
for the first time in concrete systems of interest.
Note that, in defining
, the notion of a split model used by Amari [
18] is related, but not identical, to that used by Oizumi et al. [
19]. The manifold considered in the latter work is defined in terms of conditional independence statements and forms a curved exponential family.
In the remainder of this article, we also use the shorthand notation , , , and , without explicit reference to X and , as already indicated in each measure’s respective subsection heading. We also use I as shorthand for the mutual information.
1.2. Boltzmann Machine
In this paper, we look at the aforementioned candidate measures in a concrete system in order to gain an intuitive sense of what is frequently discussed at a heavily theoretical and abstract level. Our system of interest is the Boltzmann machine (a fully-recurrent neural network with sigmoidal activation units).
We parameterize a network of
N binary nodes by
, which denotes the connectivity matrix of weights between each directed pair of nodes. Each node
i takes a value
, and updates to
according to:
where
,
denotes a global inverse-temperature parameter, and
denotes the directed weight from
to
.
This stochastic update rule implies that every node updates probabilistically according to a weighted sum of the node’s parents (or inputs), which, in the case of our fully recurrent neural network, is every node in the network. Every node
i has some weight,
, with which it influences node
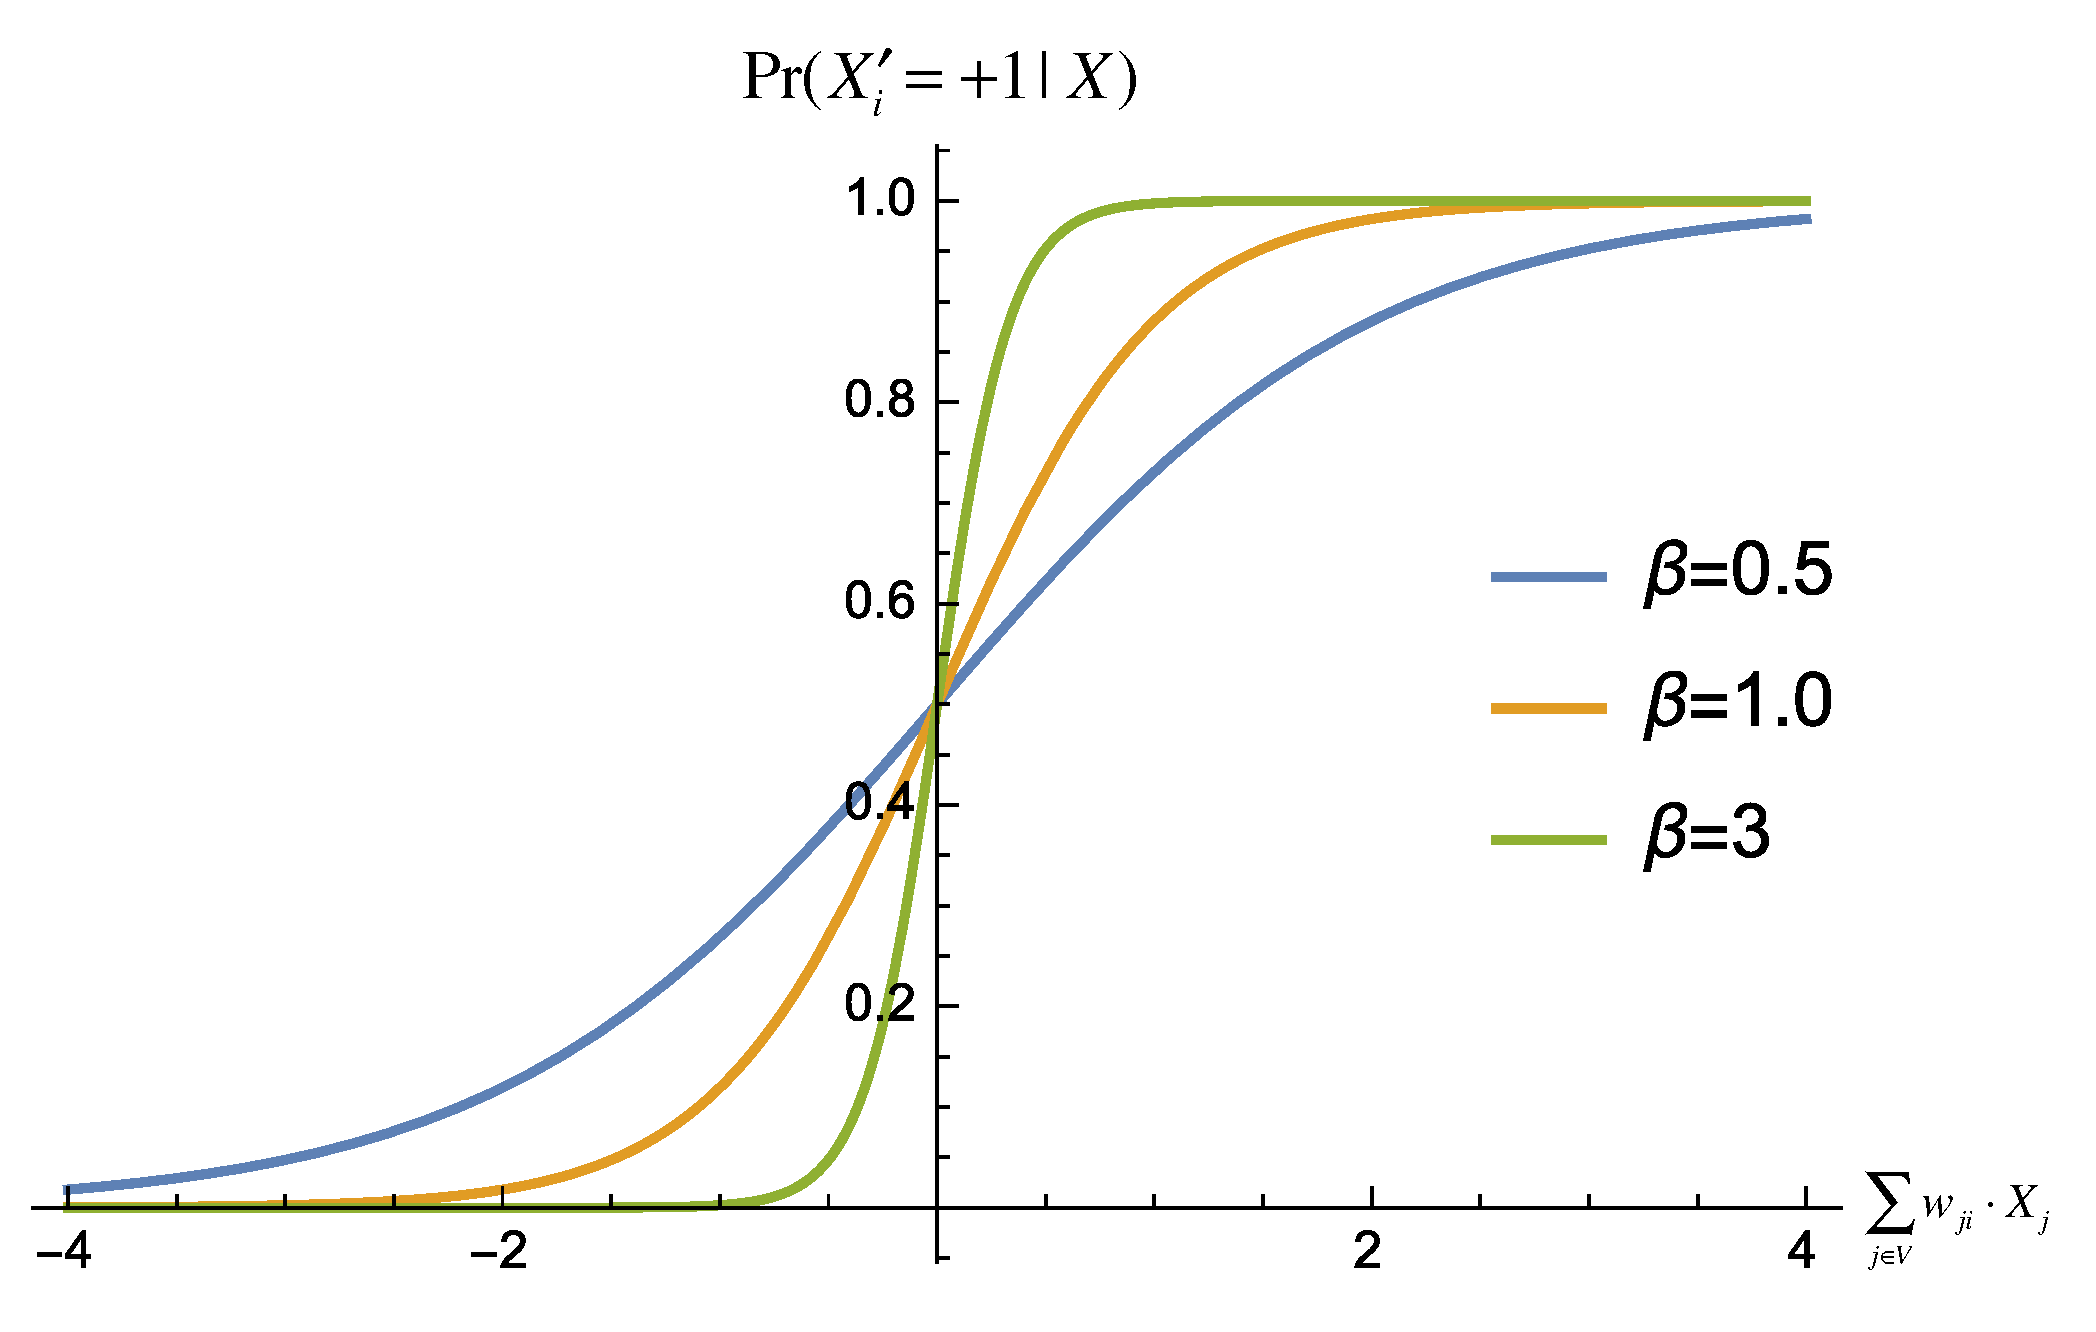
j on the next update. As the weighted sum of the inputs to a node becomes more positive, the likelihood of that node updating to the state
increases. The opposite holds true as the weighted sum becomes more negative, as seen in
Figure 2. The weights between nodes are a set of parameters that we are free to tune in the network.
The second tunable parameter in our network is , commonly known as the global inverse-temperature of the network. effectively controls the extent to which the system is influenced by random noise: it quantifies the system’s deviation from deterministic updating. In networks, the noise level directly correlates with what we call the “pseudo-temperature” T of the network, where . To contextualize what T might represent in a real-life complex system, consider the example of a biological neural network, where we can think of the pseudo-temperature as a parameter that encompasses all of the variables (beyond just a neuron’s synaptic inputs) that influence whether a neuron fires or not in a given moment (e.g., delays in integrating inputs, random fluctuations from the release of neurotransmitters in vesicles, firing of variable strength). As (), the interactions are governed entirely by randomness. On the other hand, as (), the nodal inputs takeover as the only factor in determining the subsequent states of the units—the network becomes deterministic rather than stochastic.
This sigmoidal update rule is commonly used as the nonlinearity in the nodal activation function in stochastic neural networks for reasons coming from statistical mechanics: It arises as a direct consequence of the Boltzmann–Gibbs distribution when assuming pairwise interactions (similar to Glauber dynamics on the Ising model), as explained in, for example, [
22] (Chapter 2 and Appendix A). As a consequence of this update rule, for finite
, there is always a unique stationary distribution on the stochastic network state space.
2. Results
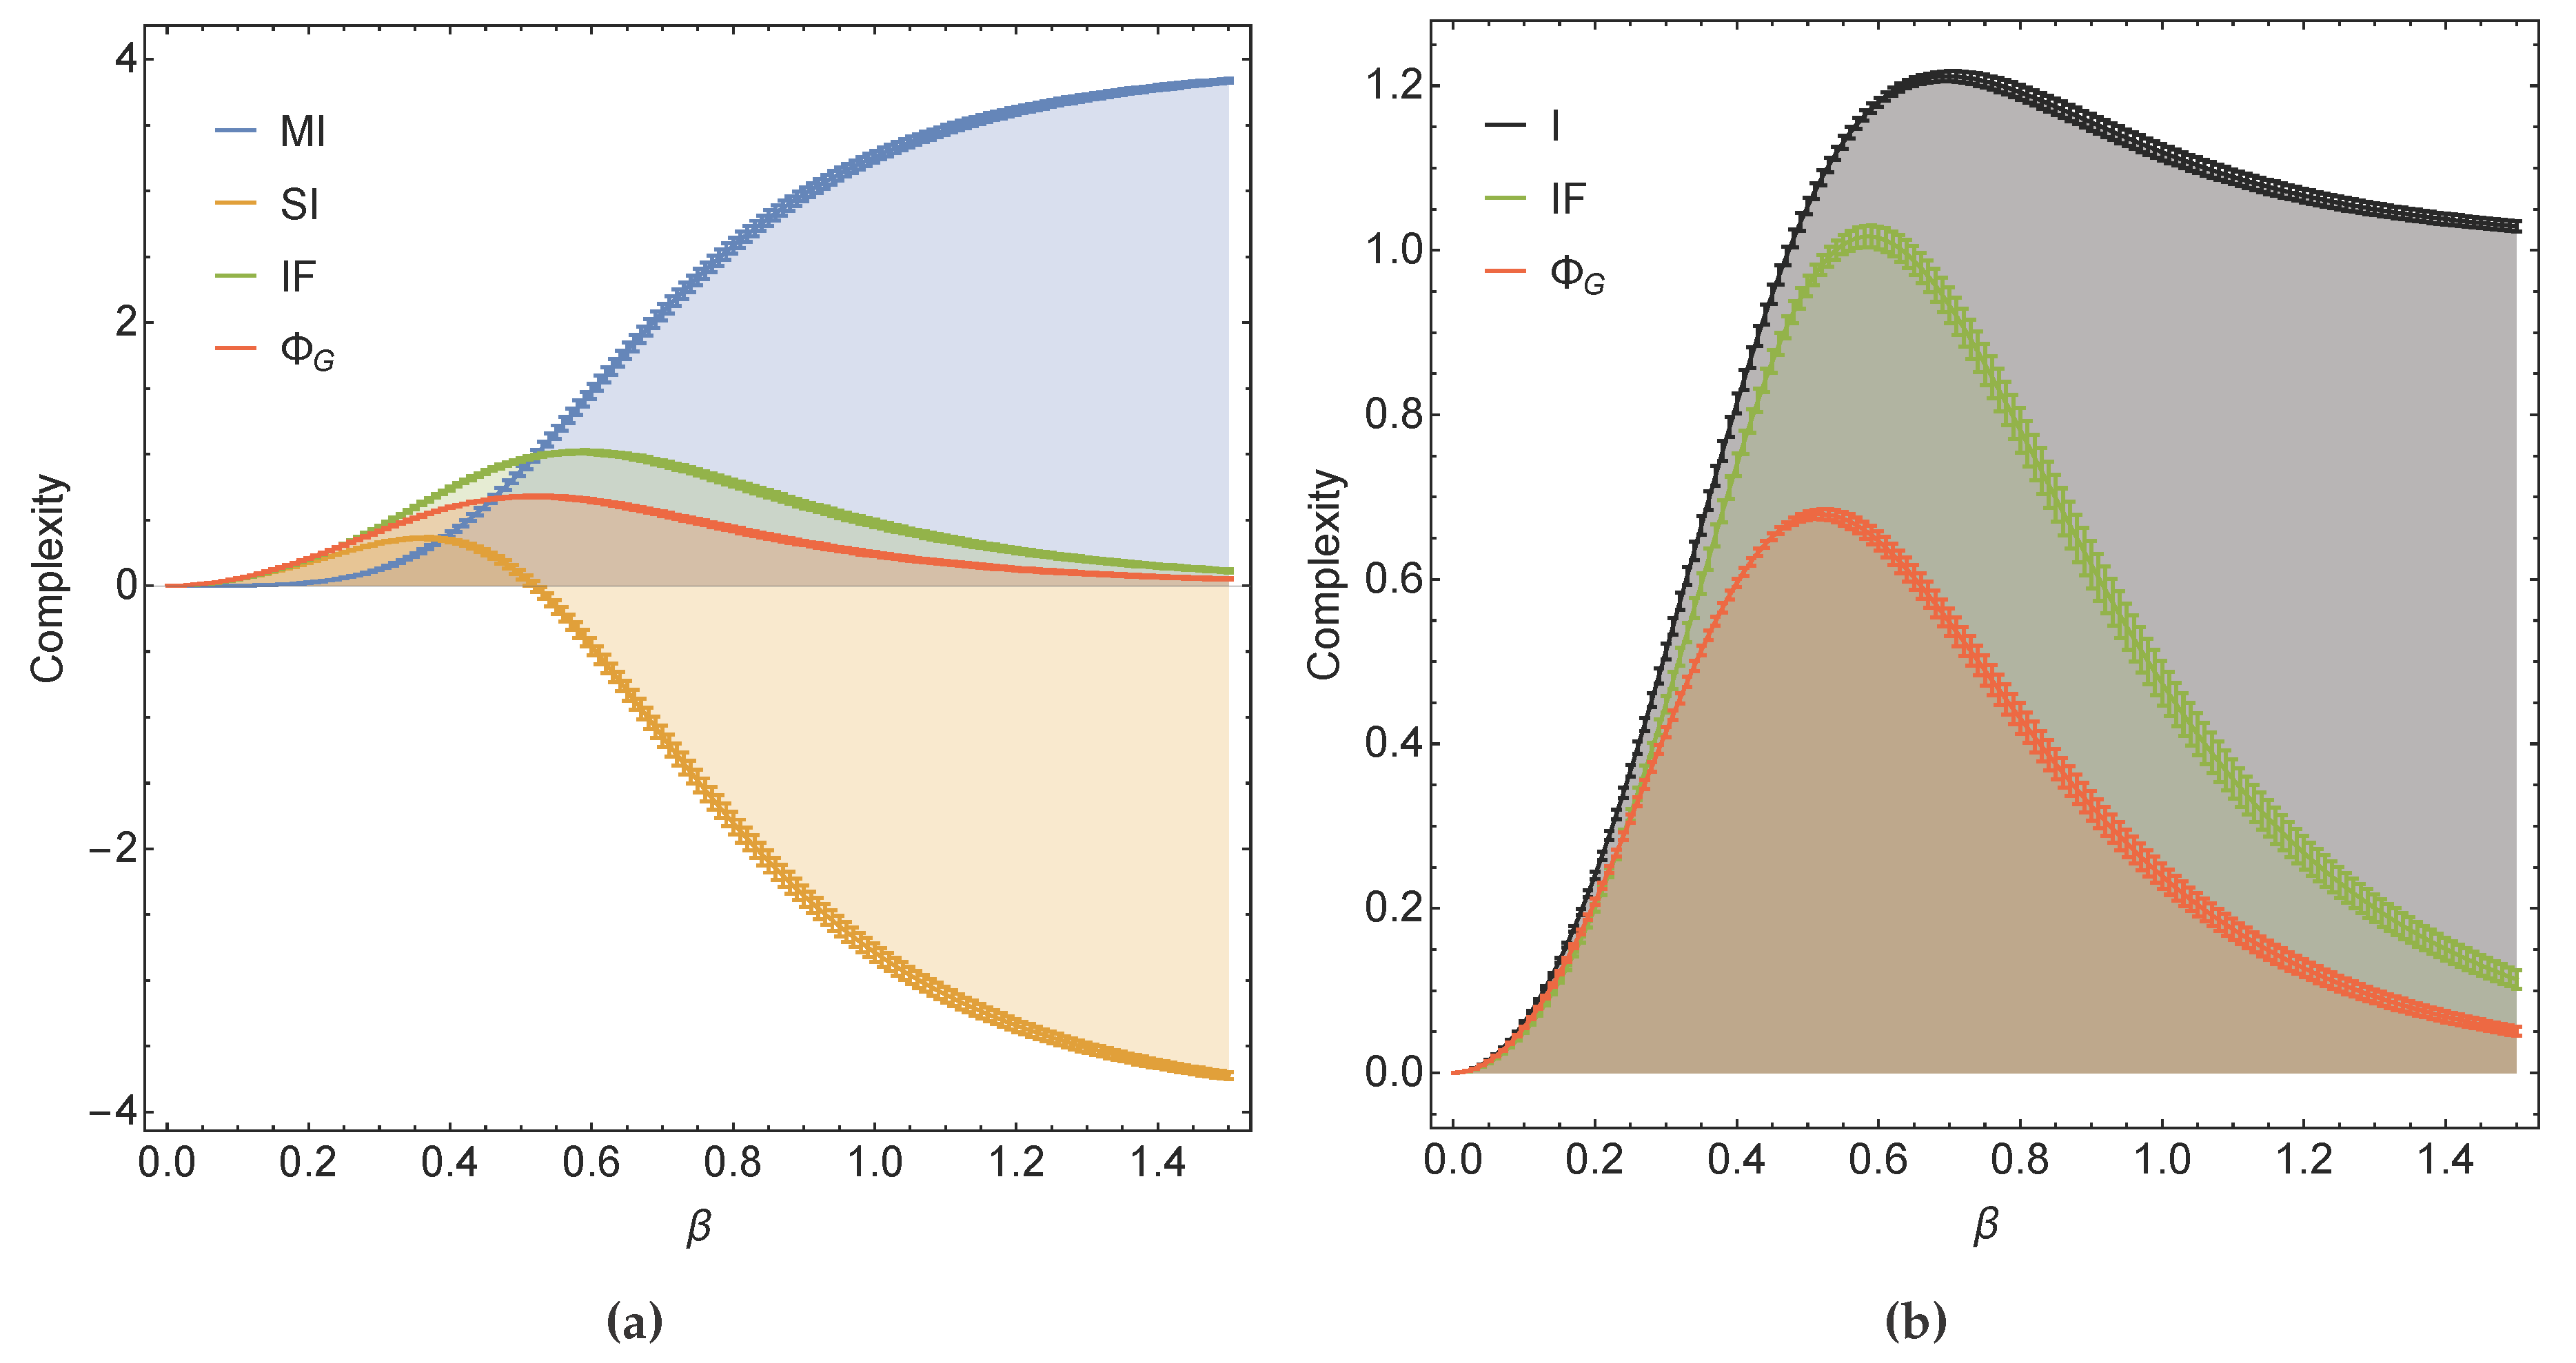
What follows are plots comparing and contrasting the four introduced complexity measures in their specified settings. The qualitative trends shown in the plots empirically hold regardless of network size; a 5-node network was used to generate the plots below.
In
Figure 3a, we see that when weights are uniformly distributed between 0 and 1,
and
are very similar qualitatively, with the additional property that
, which directly follows from
.
monotonically increases, which contradicts the intuition prescribed by humpology. Finally,
is peculiar in that it is not lower-bounded by 0. This makes for difficult interpretation: what does a negative complexity mean as opposed to zero complexity? Furthermore, in
Figure 3b, we see that
satisfies constraint (
14), with the mutual information in fact upper bounding both
and
.
It is straightforward to see the symmetry between selecting weights uniformly between 0 and and between and 0, hence the above results represent both scenarios.
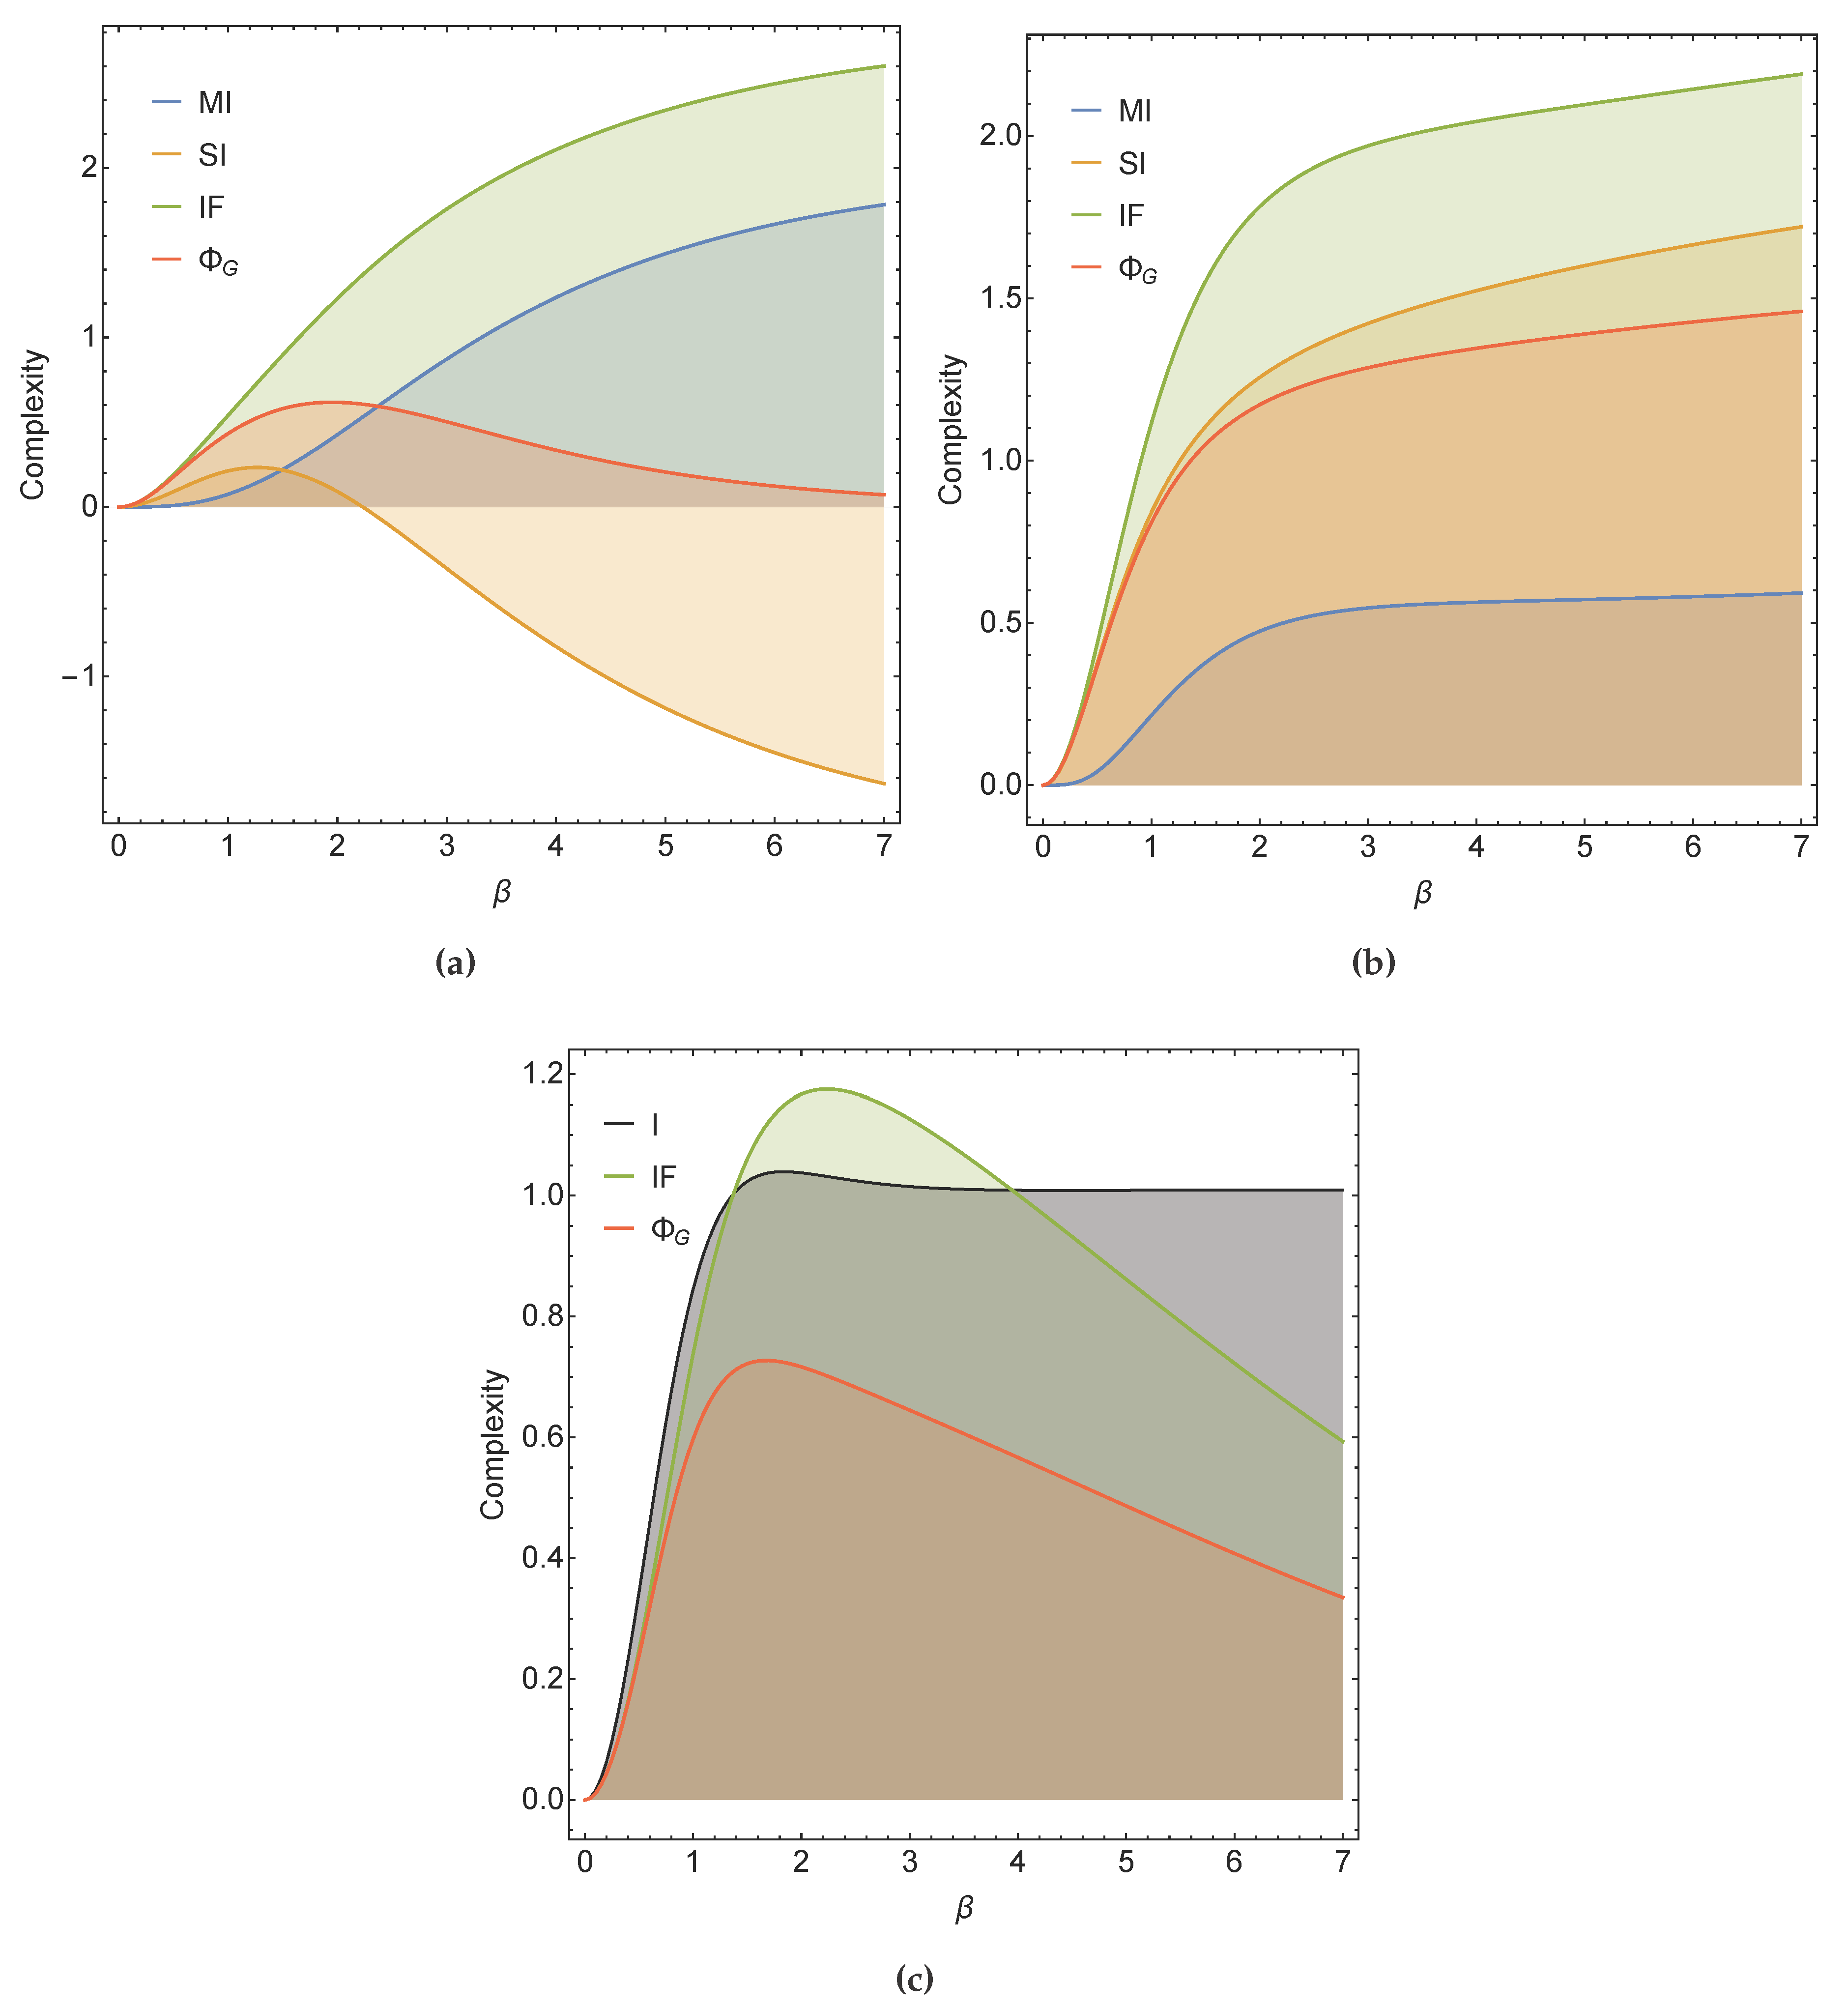
When we allow for both positive and negative weights, however, about as frequently as we observe the above behavior, we observe qualitatively different behavior as represented in
Figure 4. Physically, these results correspond to allowing for mutual excitation and inhibition in the same network.
In
Figure 4a, surprisingly, we see that in one instance of mixed weights,
monotonically increases (like
in
Figure 3a), a departure from humpology intuition. Meanwhile,
behaves qualitatively differently, such that
as
. In
Figure 4b, we see an instance where all measures limit to some non-zero value as
. Finally, in
Figure 4c, we see an instance where
exceeds
I while
satisfies constraint (
14), despite the common unimodality of both measures.
An overly simplistic interpretation of the idea that humpology attempts to capture may lead one to believe that
Figure 4b is a negative result discrediting all four measures. We claim, however, that this result suggests that the simple humpology intuition described in
Section 1.1 needs additional nuance when applied to quantifying the complexity of dynamical systems. In
Figure 4b, we observe a certain richness to the network dynamics, despite its deterministic nature. A network dynamics that deterministically oscillates around a non-trivial attractor is not analogous to the “frozen” state of a rigid crystal (no complexity). Rather, one may instead associate the crystal state with a network whose dynamics is the identity map, which can indeed be represented by a split stochastic matrix. Therefore, whenever the stochastic matrix
P converges to the identity matrix (the “frozen” matrix) for
, the complexity will asymptote to zero (as in
Figure 3b). In other words, for dynamical systems, a “frozen” system is exactly that: a network dynamics that has settled into a single
fixed-point dynamics. Consequently, in our results, as
, we should expect that the change in complexity depends on the dynamics that the network is settling into as it becomes deterministic, and the corresponding richness (e.g., number of attractors and their lengths) of that asymptotic dynamics.
So far, it may seem to be the case that
is without flaw; however, there are shortcomings that warrant further study. In particular, in formulating
, the undirected output edge in
Figure 5B (purple) was deemed necessary to avoid quantifying external influences to the system that
would consider as intrinsic information flow. Yet, in the model studied here—the Boltzmann machine—there are no such external influences (i.e.,
in
Figure 5), so this modification should have no effect on distinguishing between
and
in our setting. More precisely, a full model that lacks an undirected output edge at the start should not lead to a “split”-projection that incorporates such an edge. However, this is not generally true for the projection that
computes because the undirected output edge present in the split model will in fact capture causal interactions
within the system by deviously interpreting them as same-time interactions in the output (
Figure 5). This counterintuitive phenomenon suggests that we should have preferred
to be precisely equal to its ideal form
in the case of the Boltzmann machine, and yet, almost paradoxically, this would imply that the improved form would still violate constraint (
14). This puzzling conundrum begs further study of how to properly disentangle external influences when attempting to strictly quantify the intrinsic causal interactions.
The preceding phenomenon, in fact, also calls into question the very postulate that the mutual information ought to be an upper bound on information integration. As we see in
Figure 5A, the undirected output edge used in the “split”-projection for computing the mutual information
I is capable of producing the very same problematic phenomenon. Thus, the mutual information does not fully quantify the total causal influences intrinsic to a system. In fact, the assumption itself that
I quantified the total intrinsic causal influences was based on the assumption that one can distinguish between intrinsic and extrinsic influences in the first place, which may not be the case.
3. Application
In this section, we apply one of the preceding measures (
) and examine its dynamics during network learning. We wish to exemplify the insights that one can gain by exploring measures of complexity in a more general sense. The results presented in
Section 2 showed the promising nature of information-geometric formulations of complexity, such as
and
. Here, however, we restrict ourselves to studying
as a first step due to the provable properties of its closed-form expression that we are able to exploit to study it in greater depth in the context of autoassociative memory networks. It would be useful to extend this analysis to
, but this is beyond the scope of this work.
Autoassociative memory in a network is a form of “collective computation” where, given an incomplete input pattern, the network can accurately recall a previously stored pattern by evolving from the input to the stored pattern. For example, a pattern might be a binary image, in which each pixel in the image corresponds to a node in the network with a value in . In this case, an autoassociative memory model with a stored image could then take as input a noisy version of the stored image and accurately recall the fully denoised original image. This differs from a “serial computation” approach to the same problem where one would simply store the patterns in a database and, when given an input, search all images in the database for the most similar stored image to output.
One mechanism by which a network can achieve collective computation has deep connections to concepts from statistical mechanics (e.g., the Ising model, Glauber dynamics, Gibbs sampling). This theory is explained in detail in [
22]. The clever idea behind autoassociative memory models heavily leverages the existence of an energy function (sometimes called a Lyapunov function) to govern the evolution of the network towards a locally minimal energy state. Thus, by engineering the network’s weighted edges such that local minima in the energy function correspond to stored patterns, one can show that if an input state is close enough (in Hamming distance) to a desired stored state, then the network will evolve towards the correct lower-energy state, which will in fact be a stable fixed point of the network.
The above, however, is only true up to a limit. A network can only store so many patterns before it becomes saturated. As more and more patterns are stored, various problems arise such as desirable fixed points becoming unstable optima, as well as the emergence of unwanted fixed points in the network that do not correspond to any stored patterns (i.e., spin glass states).
In 1982, Hopfield put many of these ideas together to formalize what is today known as the Hopfield model, a fully recurrent neural network capable of autoassociative memory. Hopfield’s biggest contribution in his seminal paper was assigning an energy function to the network model:
For our study, we assume that we are storing random patterns in the network. In this scenario, Hebb’s rule (Equation (
17)) is a natural choice for assigning weights to each connection between nodes in the network such that the random patterns are close to stable local minimizers of the energy function.
Let
denote the set of
N-bit binary patterns that we desire to store. Then, under Hebb’s rule, the weight between nodes
i and
j should be assigned as follows:
where
denotes the
ith-bit of pattern
. Notice that all weights are symmetric,
.
Hebb’s rule is frequently used to model learning, as it is both local and incremental—two desirable properties of a biologically plausible learning rule. Hebb’s rule is local because weights are set based strictly on local information (i.e., the two nodes that the weight connects) and is incremental because new patterns can be learned one at a time without having to reconsider information from already learned patterns. Hence, under Hebb’s rule, training a Hopfield network is relatively simple and straightforward.
The update rule that governs the network’s dynamics is the same sigmoidal function used in the Boltzmann machine described in
Section 1.2. We will have this update rule take effect synchronously for all nodes (Note: Hopfield’s original model was described in the asynchronous, deterministic case but can also be studied more generally.):
At finite , our Hopfield model obeys a stochastic sigmoidal update rule. Thus, there exists a unique and strictly positive stationary distribution of the network dynamics.
Here, we study
incremental Hebbian learning, in which multiple patterns are stored in a Hopfield network in succession. We use total information flow (
Section 1.1.3) to explore how incremental Hebbian learning changes complexity, or more specifically, how the complexity relates to the number of patterns stored.
Before continuing, we wish to make clear upfront an important disclaimer: the results that we describe are qualitatively different when one uses asynchronous dynamics instead of synchronous, as we use here. With asynchronous dynamics, no significant overall trend manifests, but other phenomena emerge in need of further exploration.
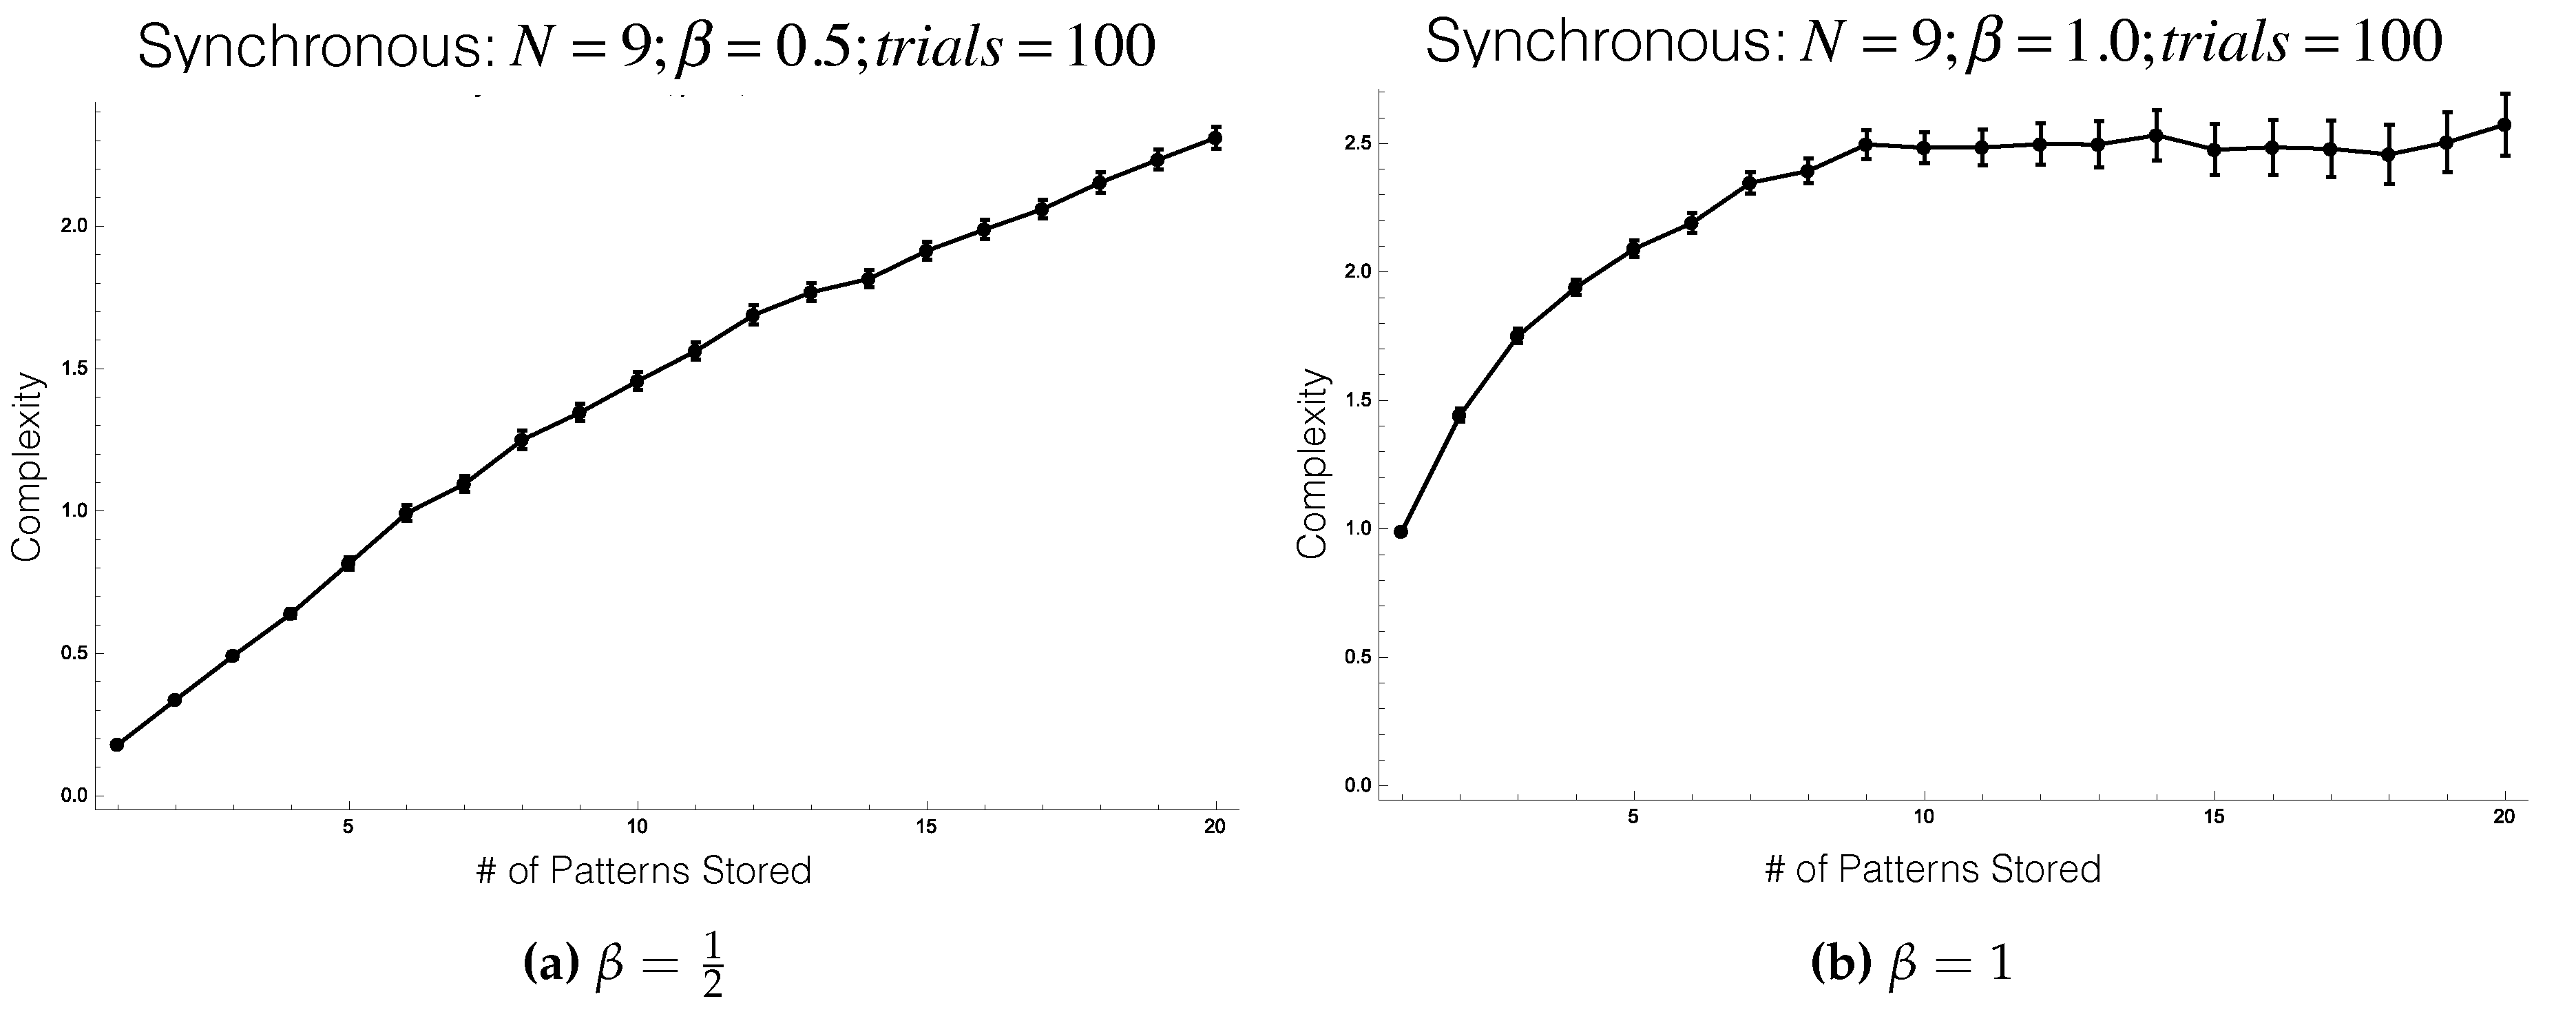
When we synchronously update nodes, we see very interesting behavior during learning: incremental Hebbian learning appears to increase complexity, on average (
Figure 6a,b). The dependence on
is not entirely clear, but as one can infer from
Figure 6a,b, it appears that increasing
increases the magnitude of the average complexity while learning, while also increasing the variance of the complexity. Thus, as
increases, the average case becomes more and more unrepresentative of the individual cases of incremental Hebbian learning.
We can also study the deterministic version of the Hopfield model. This corresponds to letting in the stochastic model. With a deterministic network, many stationary distributions on the network dynamics may exist, unlike in the stochastic case. As discussed above, if we want to recall a stored image, we would like for that image to be a fixed point in the network (corresponding to a stationary distribution equal to the Dirac measure at that state). Storing multiple images corresponds to the desire to have multiple Dirac measures acting as stationary distributions of the network. Furthermore, in the deterministic setting, the nodal update rule becomes a step rather than a sigmoid function.
Without a unique stationary distribution in the deterministic setting, we must decide how to select an input distribution to use in calculating the complexity. If there are multiple stationary distributions in a network, not all starting distributions on the network eventually lead to a single stationary distribution (as was the case in the stochastic model), but instead the stationary distribution that the network eventually reaches is sensitive to the initial state of the network. When there are multiple stationary distributions, there are actually infinitely many stationary distributions, as any convex combination of stationary distributions is also stationary. If there exist N orthogonal stationary distributions of a network, then there is in fact an entire -simplex of stationary distributions, any of which could be used as the input distribution for calculating the complexity.
In order to address this issue, it is fruitful to realize that the complexity measure we are working with is concave with respect to the input distribution (Theorem A1 in
Appendix A). As a function of the input distribution, there is thus an “apex” to the complexity. In other words, it is a unique local maximum of the complexity function, which is also therefore a global maximum (but not necessarily a unique maximizer since the complexity is not strictly concave). This means that the optimization problem of finding the supremum over the entire complexity landscape with respect to the input distribution is relatively simple and can be viably achieved via standard gradient-based methods.
We can naturally define a new quantity to measure complexity of a stochastic matrix
P in this setting, the
complexity capacity:
where the maximum is taken over all stationary distributions
p of
P. Physically, the complexity capacity measures the
maximal extent—over possible input distributions—to which the whole is more than the sum of its parts. By considering the entire convex hull of stationary input distributions and optimizing for complexity, we can find this unique maximal value and use it to represent the complexity of a network with multiple stationary distributions.
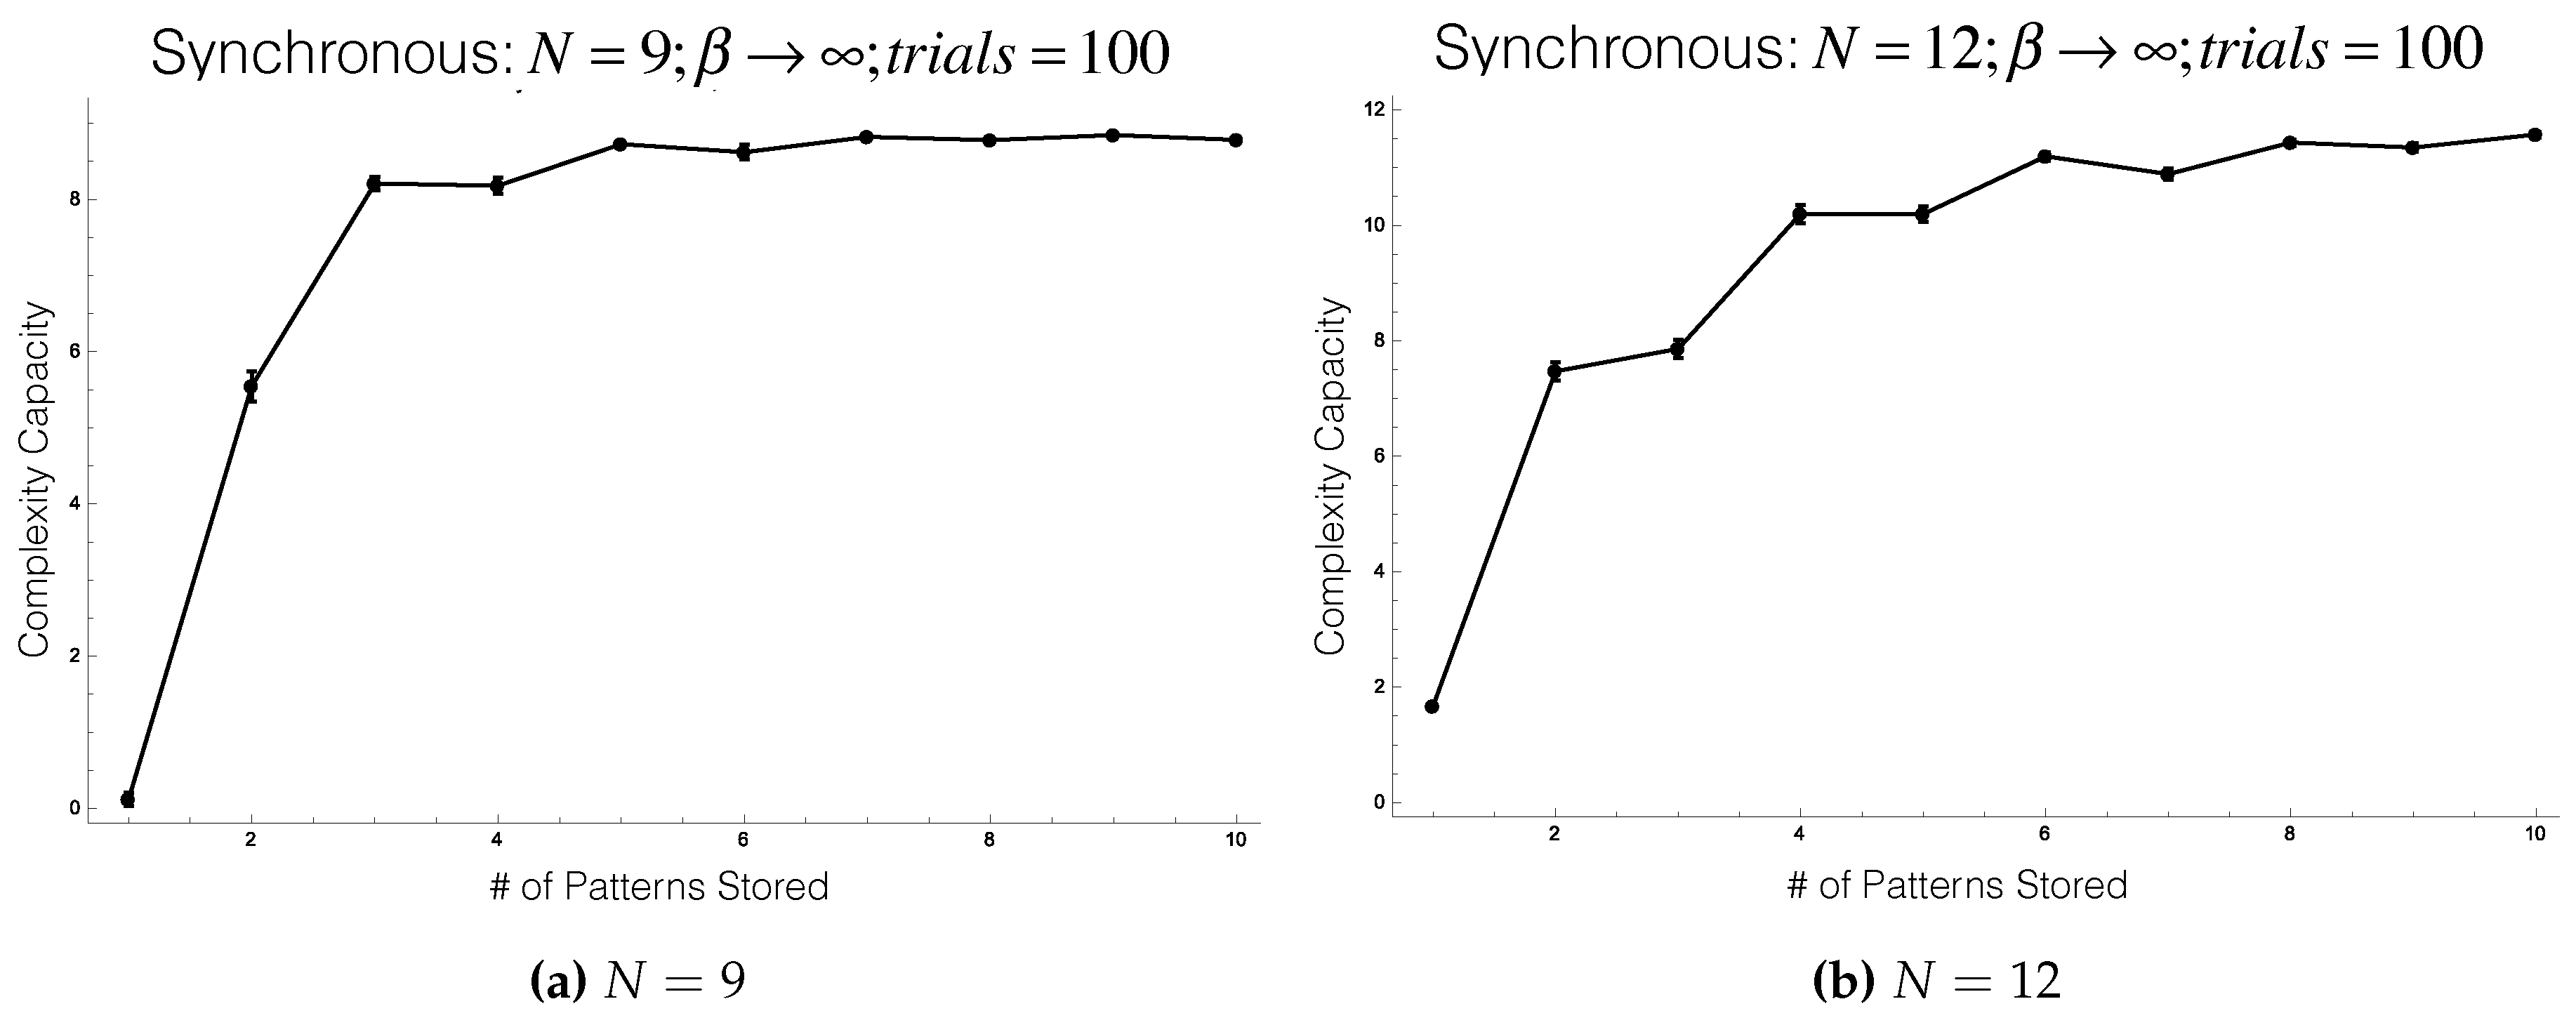
Again, in the synchronous-update setting, we see incremental Hebbian learning increases complexity
capacity (
Figure 7a,b). It is also worth noting that the complexity capacity in this setting is limiting towards the absolute upper bound on the complexity, which can never exceed the number of binary nodes in the network. Physically, this corresponds to each node attempting to store one full bit (the most information a binary node can store), and all of this information flowing through the network between time-steps, as more and more patterns are learned. This limiting behavior of the complexity capacity towards a maximum (as the network saturates with information) is more gradual as the size of the network increases. This observed behavior matches the intuition that larger networks should be able to store more information than smaller networks.
