Entropy Analysis of the Interaction between the Corner Separation and Wakes in a Compressor Cascade

Key Laboratory for Thermal Science and Power Engineering of Ministry of Education, Tsinghua University, Beijing 100084, China
*
Author to whom correspondence should be addressed.
Entropy 2017, 19(7), 324; https://doi.org/10.3390/e19070324
Submission received: 27 May 2017
/
Revised: 27 June 2017
/
Accepted: 27 June 2017
/
Published: 30 June 2017
(This article belongs to the Special Issue Entropy in Computational Fluid Dynamics)
Abstract
:The corner separation in the high-loaded compressors deteriorates the aerodynamics and reduces the stable operating range. The flow pattern is further complicated with the interaction between the aperiodic corner separation and the periodically wake-shedding vortices. Accurate prediction of the corner separation is a challenge for the Reynolds-Averaged Navier–Stokes (RANS) method, which is based on the linear eddy-viscosity formulation. In the current work, the corner separation is investigated with the Delayed Detached Eddy Simulation (DDES) approach. DDES results agree well with the experiment and are systematically better than the RANS results, especially in the corner region where massive separation occurs. The accurate results from DDES provide a solid foundation for mechanism study. The flow structures and the distribution of Reynolds stress help reveal the process of corner separation and its interaction with the wake vortices. Before massive corner separation occurs, the hairpin-like vortex develops. The appearance of the hairpin-like vortex could be a signal of large-scale corner separation. The strong interaction between corner separation and wake vortices significantly enhances the turbulence intensity. Based on these analyses, entropy analysis is conducted from two aspects to study the losses. One aspect is the time-averaged entropy analysis, and the other is the instantaneous entropy analysis. It is found that the interaction between the passage vortex and wake vortex yields remarkable viscous losses over the 0–12% span when the corner separation has not yet been triggered; however, when the corner separation occurs, an enlarged region covering the 0–30% span is affected, and it is due to the interaction between the corner separation and wake vortices. The detailed coherent structures, local losses information and turbulence characteristics presented can provide guidance for the corner separation control and better design.
1. Introduction
The corner separation, which widely exists in the junction area of high-loaded compressors [1], is one of the main concerns in the compressor community. In recent decades, increasing attention has been paid to the corner separation due to the demand of higher pressure rise. A series of experimental and numerical studies has been conducted about the parameters affecting corner separation, including two-dimensional and three-dimensional separations, the influence of surface roughness and the interaction between tip clearance and corner separation [2,3,4]. Despite these efforts, the mechanisms of corner separation are still not fully understood. In recent years, a number of experimental and high-fidelity numerical studies have been carried out in this field. Ma et al. experimentally studied the corner separation under different incidence angles [5,6] and numerically studied the intermittency of corner separation in a linear compressor cascade [7]. Gand et al. [8] numerically investigated the wing body junction, giving the fundamental mechanisms of corner separation. Results show that the strong adverse pressure gradient, the presence of secondary flow and the merging of wall and blade boundary layers mainly cause the corner separation. Scillitoe et al. [9] further investigated the influence of freestream turbulence intensity and end wall boundary layer state. Gao et al. [10,11] and Liu et al. [12,13] investigated turbulent characteristics and vortical structures of corner separation, finding that there exist horseshoe vortex, passage vortex, wake shedding vortex and “corner vortex”. Besides, the periodically-shedding wake at the trailing edge of the blade could interact with the aperiodic corner separation. Wang and Yuan [14] found out that the corner separation and the wake shedding were the two primary sources of the unsteadiness in the compressor cascade. Summarizing the existing literature, few studies have been conducted in this field, although the flow pattern is further complicated by the interaction between aperiodic corner separation and the periodically wake-shedding vortices. Hence, for further understanding of the mechanisms of corner separation, the interaction between corner separation and wake vortices should not be ignored.
The corner separation limits the static pressure rise and causes passage blockage, which leads to undesirable losses and reduces the stable operating range [15]. The interaction between the corner separation and the wake vortices would further enhance the deleterious consequences of corner separation, especially the losses. To achieve better performance of compressors, loss sources and loss mechanisms of corner separation considering the interaction with wake vortices should be figured out. For this purpose, the entropy generation rate is a useful tool, and it provides useful information about where and how the loss is locally generated compared to the currently widely-used loss coefficient. According to the second law of thermodynamics, the entropy generation rate can quantitatively measure irreversibility [16,17,18]. The entropy generation rate presents detailed information about the location of losses and provides a direct physical interpretation of losses in terms of exergy (available energy) losses [19]. Hence, based on the analysis of the entropy generation rate, local losses and overall losses can be assessed [20,21]. By combining analysis about flow structures and the entropy generation rate, the process of corner separation and its interaction with wake vortices can be further clarified.
Reliable flow prediction with high-fidelity is the foundation of the flow mechanisms’ study and loss analysis. The corner separation is characterized by multi-frequencies and strong interaction with the secondary flow, which cause strong turbulent anisotropy in the corner [13]. Therefore, RANS simulation, which is based on the linear eddy-viscosity formulation (Boussinesq assumption) cannot predict the corner separation accurately [14,22]. Further investigating the corner separation interaction with the wake shedding vortices needs scale-resolving numerical tools to accurately delineate the corner separation, analyze the underlying interaction mechanisms and achieve insightful investigation into the details of losses. High-fidelity scale-resolving strategies, such as the Large Eddy Simulation (LES) approach, can give a detailed flow field of corner separation. However, the computational cost is extremely expensive. For example, Gao et al. [11] carried out LES to investigate the corner separation in the NACA65 cascades under the Reynolds number of 382,000 with 200 million grid points. Besides, LES for the high Reynolds number case requires a suitable wall modeling. As a hybrid of RANS and LES, DDES uses RANS in the boundary layer and switches to the LES method in the separation area [23]. As a result, the computational cost is drastically reduced. According to the recent study [24], the capability of DDES in predicting the massive separation inside the compressor cascade still needs careful calibration and analysis. Hence, the other aim of this work is to evaluate the feasibility of DDES in predicting the corner separation and its interaction with the wake vortices.
In this paper, DDES successfully predicts the corner separation and its interaction with wake-shedding vortices, which proves the feasibility of DDES in the corner separation prediction. Based on the detailed flow field of DDES results, the production mechanisms, vortical structures and turbulence characteristics of corner separation are analyzed. The development and role of the hairpin-like vortex is investigated. Based on these results and analyses, the entropy analysis is conducted from two aspects. The time-averaged entropy analysis evaluates the overall contributions of the corner separation to the losses, and the instantaneous entropy analysis relates the local losses to the flow structure that generates the losses. This work aims to investigate the interaction process and the losses and to provide guidance for the corner separation control and better design.
This paper is organized as follows: firstly the experimental configuration is given, and then, the numerical modeling is introduced; in the following part, the detailed numerical results are compared to the experiment and analyzed; the last section concludes this paper.
2. Experimental Configuration and Numerical Modeling
A linear compressor cascade is used to investigate the corner separation, which is representative of highly-loaded compressor stator blades. The cascade consists of 13 blades and was tested experimentally by Ma et al. [5,6]. In the experiment, the inflow velocity was m/s, with a chord Reynolds number . The experimental parameters are summarized in Table 1.
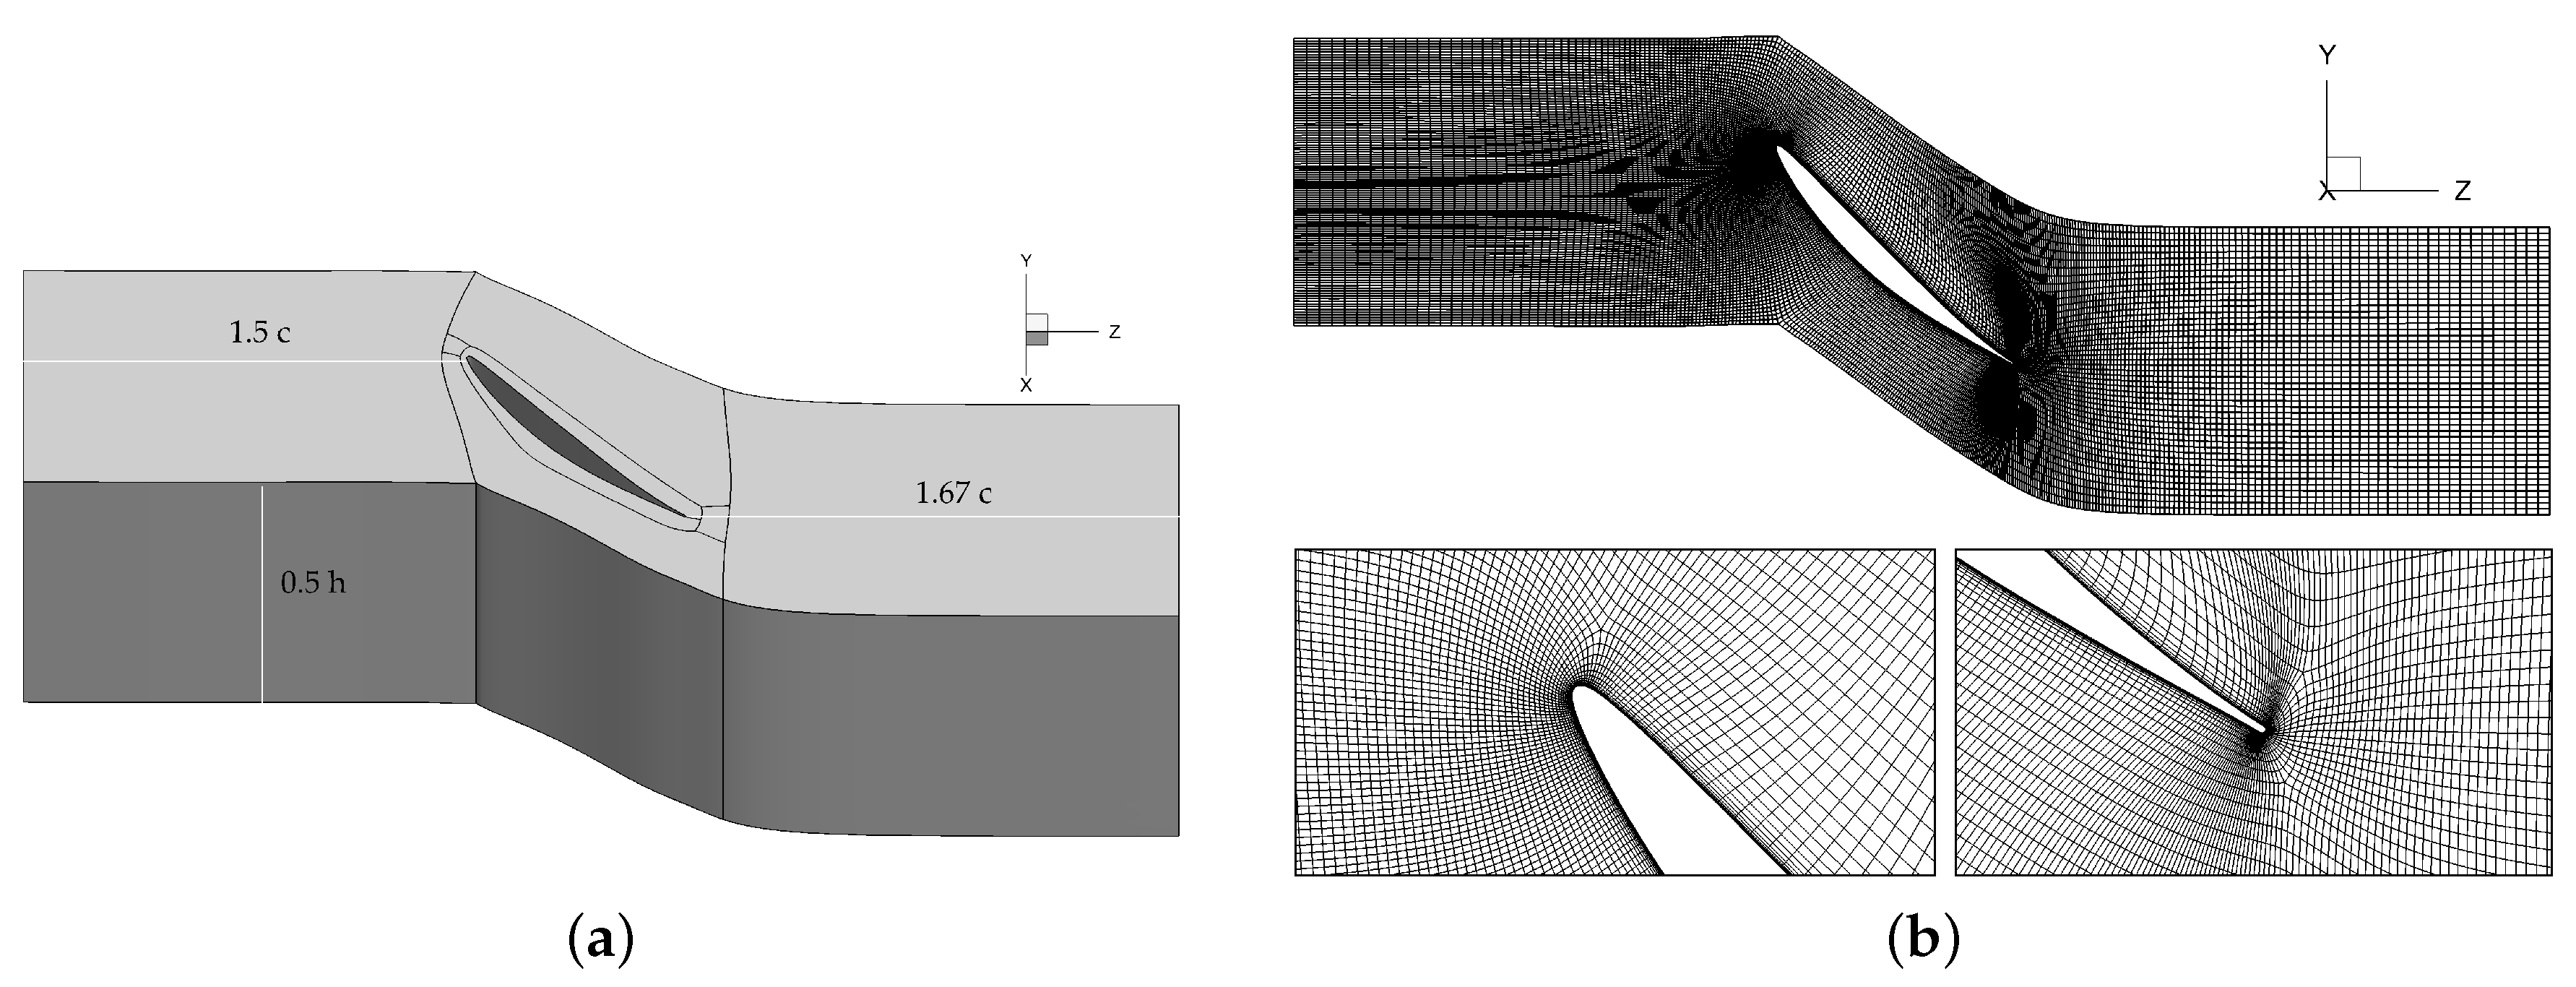
One blade passage is modeled in the simulation, and two sides of flow passage are set as periodic. As this is a linear cascade, the flow field ranging from the hub to span is modeled, and the symmetry boundary condition is enforced at half span to reduce cost. The multi-block structured mesh is generated with the 4HOtopology, as shown in Figure 1.
The mesh consists of about million points. The minimum at the wall is , and the maximum is 1.81. To better capture the corner separation in LES mode, the corner area is filled with nearly isotropic elements, with the expansion ratio less than and the aspect ratio less than two. The same mesh is used in the RANS simulation. The inlet boundary condition is set identical to the experiment, and the outlet static pressure is set to the atmospheric value.
A suite of well-proven in-house code [21,25,26,27,28] is employed to conduct both RANS and DDES simulations. This code is based on the multi-block structured mesh, and the integral form of the Navier–Stokes equation is solved with the finite volume method. In the DDES simulations, in order to minimize the numerical dissipation to retain small-scale turbulence structures, a fifth-order method [26] is employed. For the unsteady simulation, the dual time-step method is employed; the physical time step is set to be s; and the computation is performed for 80 flow-through times (), which are about 6000 time steps. The discretized governing equation is solved with an efficient implicit method, and the multigrid method is adopted to further accelerate the convergence. For current unsteady simulation, during every physical time step, 4∼5 orders of residual reduction can be obtained within 30 iterations.
In the experiment, sandpaper strips are used to force the transition from laminar to turbulence near the leading edge, and thus, the whole flow field can be regarded as fully turbulent. In this work, the turbulence is treated based on the standard Spalart-Allmaras (S-A) one-equation model [29]:
where d is the distance to the nearest wall, and the complete definition can be found in [29]. The Detached Eddy Simulation (DES) method [30] uses the Unsteady Reynolds-Averaged Navier–Stokes (URANS) model in the near wall region and switches to the LES model far from the wall. The DES method replaces d in the destruction term of the S-A model, in Equation (1), with defined as , where ▵ is the largest spacing of the grid cell in all directions. When , , and the model acts as the S-A model. When , , and the model switches to the LES algorithm. To deal with the Modeled Stresses Depletion (MSD) problem, Spalart et al. [23] improved the DES model, and the new Delayed Detached Eddy Simulation model (DDES) uses a formulation to limit the DES length scale to ensure that the transition is mesh-independent. The parameter used in the original S-A model is modified to:
where is the velocity gradient. The parameter is applied to the following function:
which reduces the grey transition area between the URANS and LES models [23].
3. Results and Discussion
3.1. Validations of Numerical Results
First, the predicted static pressure coefficient and total pressure loss coefficient are compared against the experiment. The static pressure coefficient is defined as , and the total pressure loss coefficient is defined as , where and represent the total pressure and reference static pressure, respectively.
The static pressure coefficient distributions from RANS and DDES are both in good agreement with the experiment along the blade surface at span, as shown in Figure 2a. However, in the corner area, the distribution from DDES is more accurate than RANS, as shown in Figure 2b.
The RANS prematurely predicts the corner separation, while the DDES accurately predicts the starting point of separation. The total pressure losses are compared with the experimental measurement at axial chord downstream from the trailing edge, as shown in Figure 3 and Figure 4.
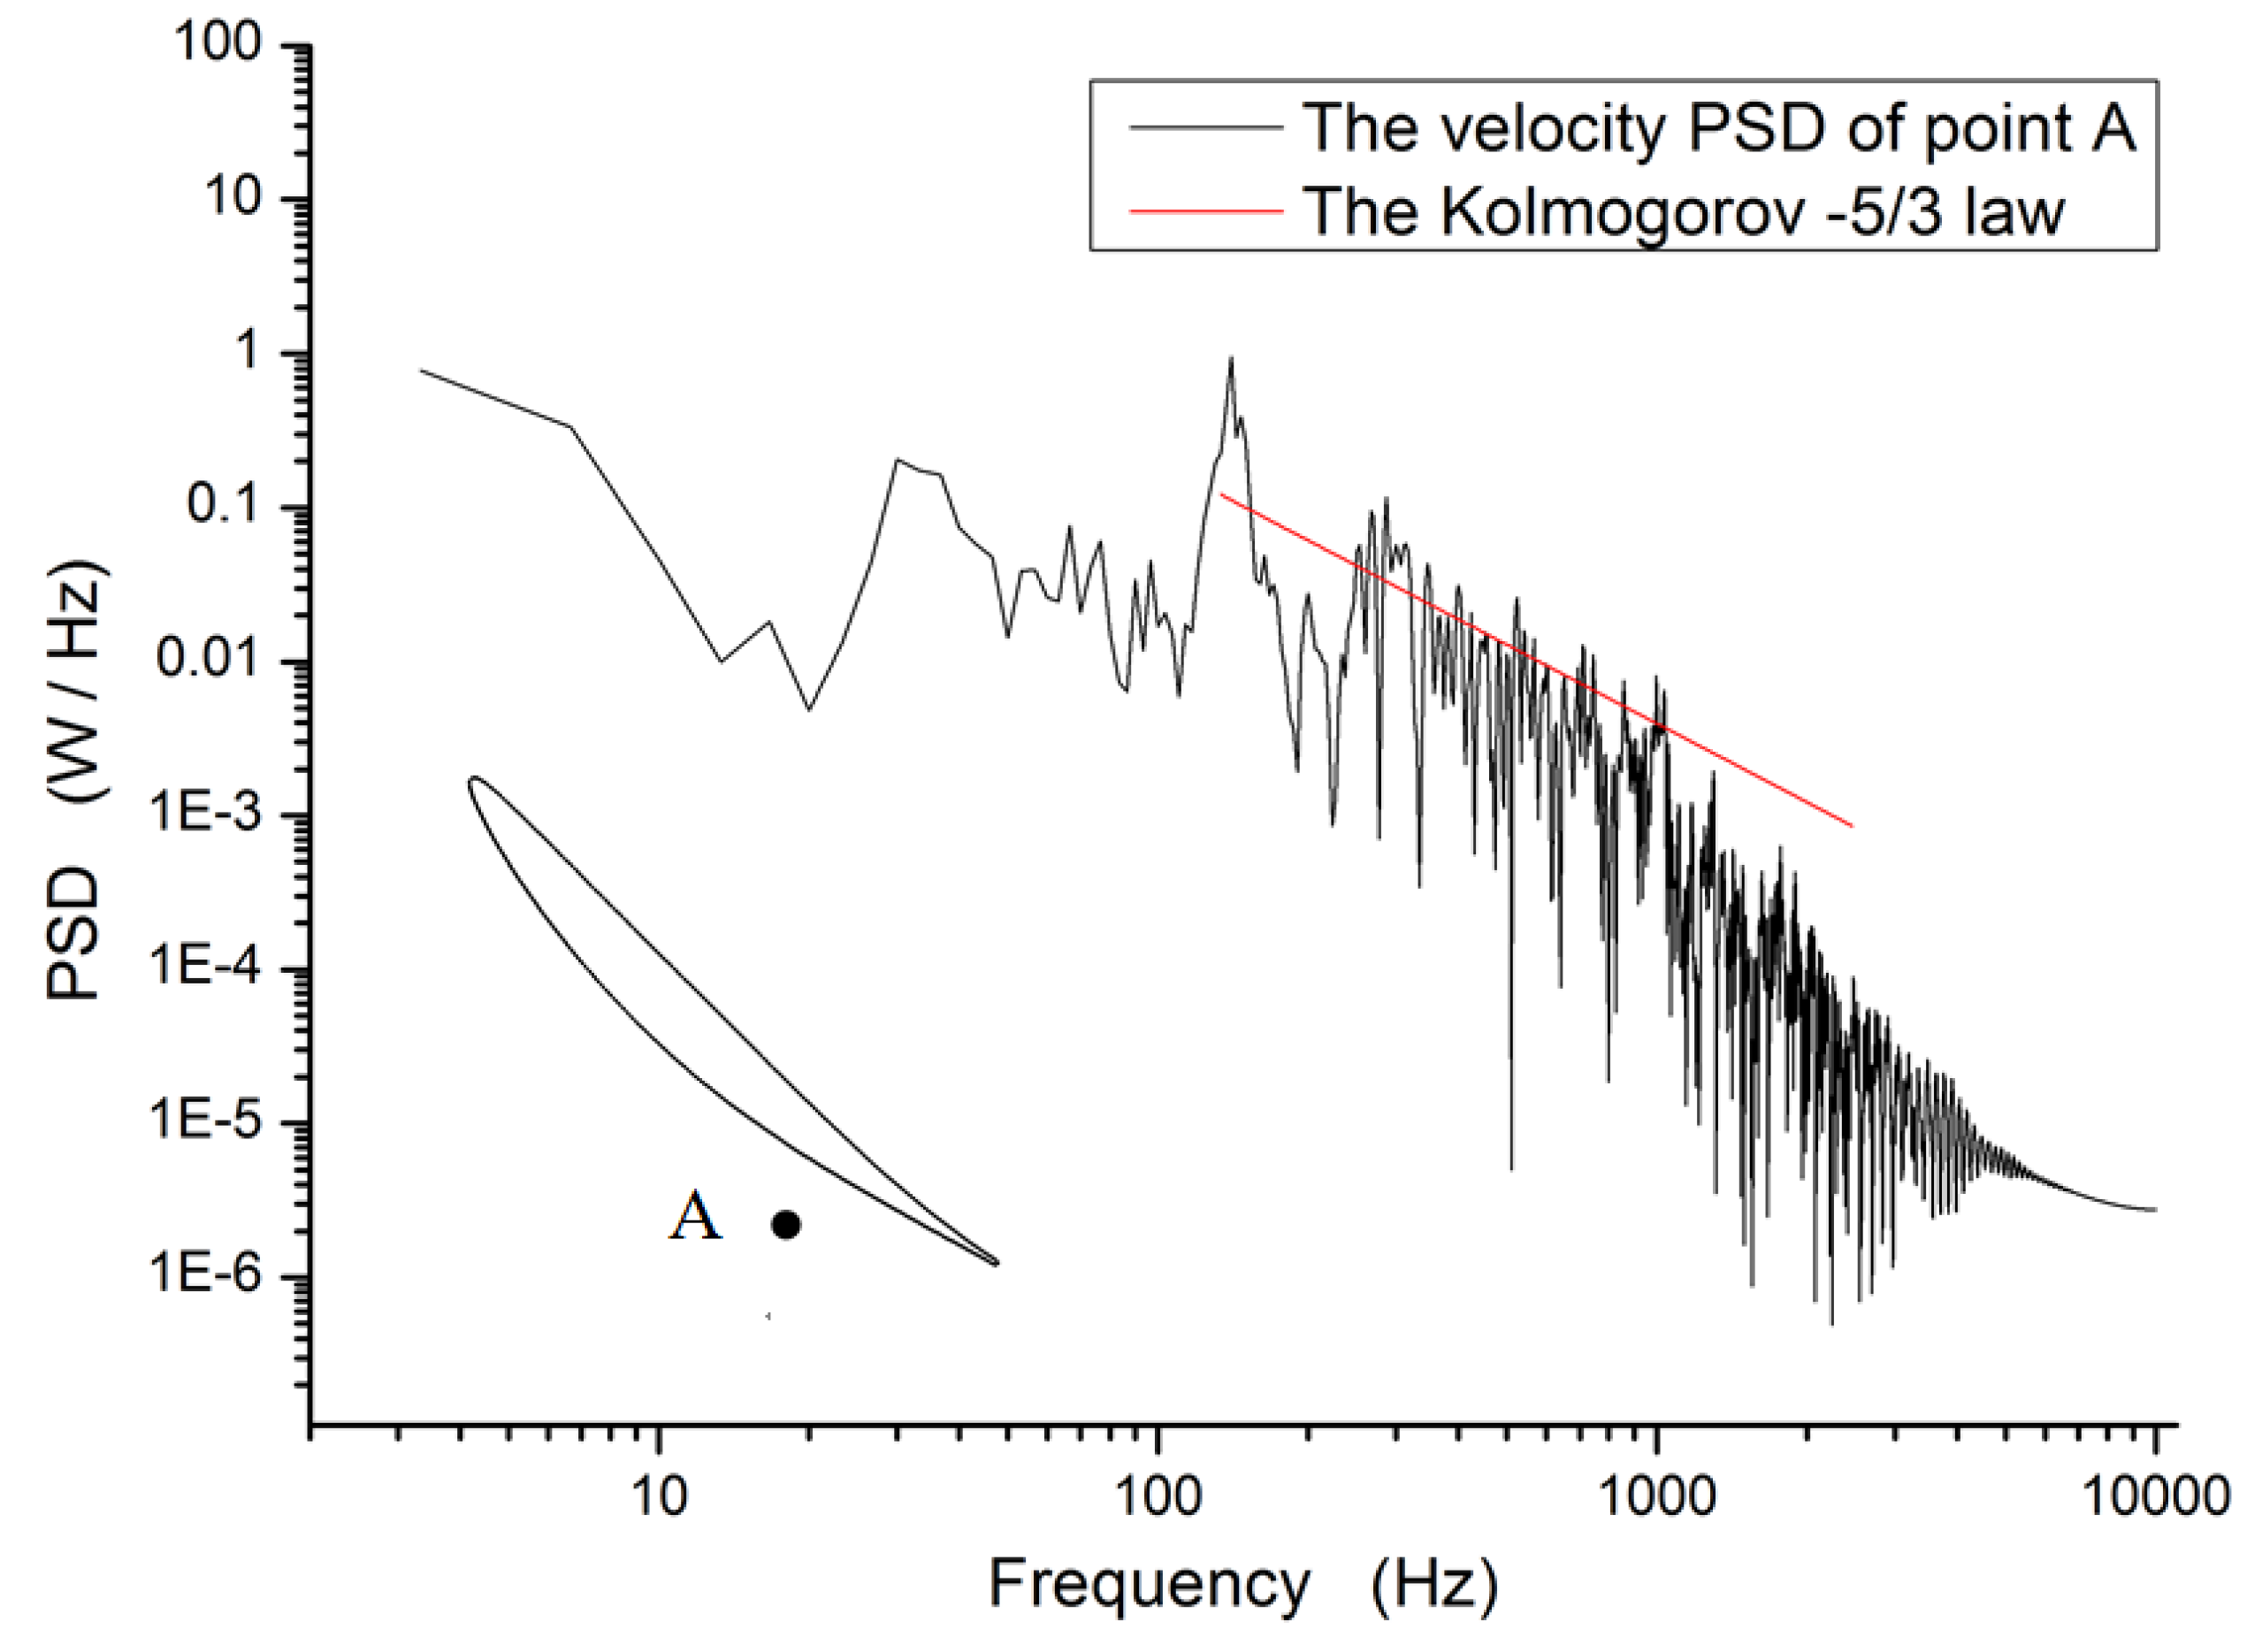
From the comparison, it is clear that RANS overestimates the total pressure loss, and this is because RANS prematurely predicts the corner separation, causing larger flow blockage. The power spectrum of velocity fluctuations at a point near the trailing edge is presented in Figure 5.
The DDES predicts an inertial subrange that agrees well with the Kolmogorov law [31]. From Figure 5, there exists a peak at about 140 Hz, which corresponds to the periodically-shedding vortices. The aperiodic corner separation contains a series of unsteady characteristic frequencies, instead of a single one. As the physical time interval is s, more than 140 physical time steps are employed during one shedding period.
3.2. Vortical Structures
In order to delineate the unsteady separation process in the corner region, the Q criterion is used to identify the vortical structures, and it is defined in the form of:
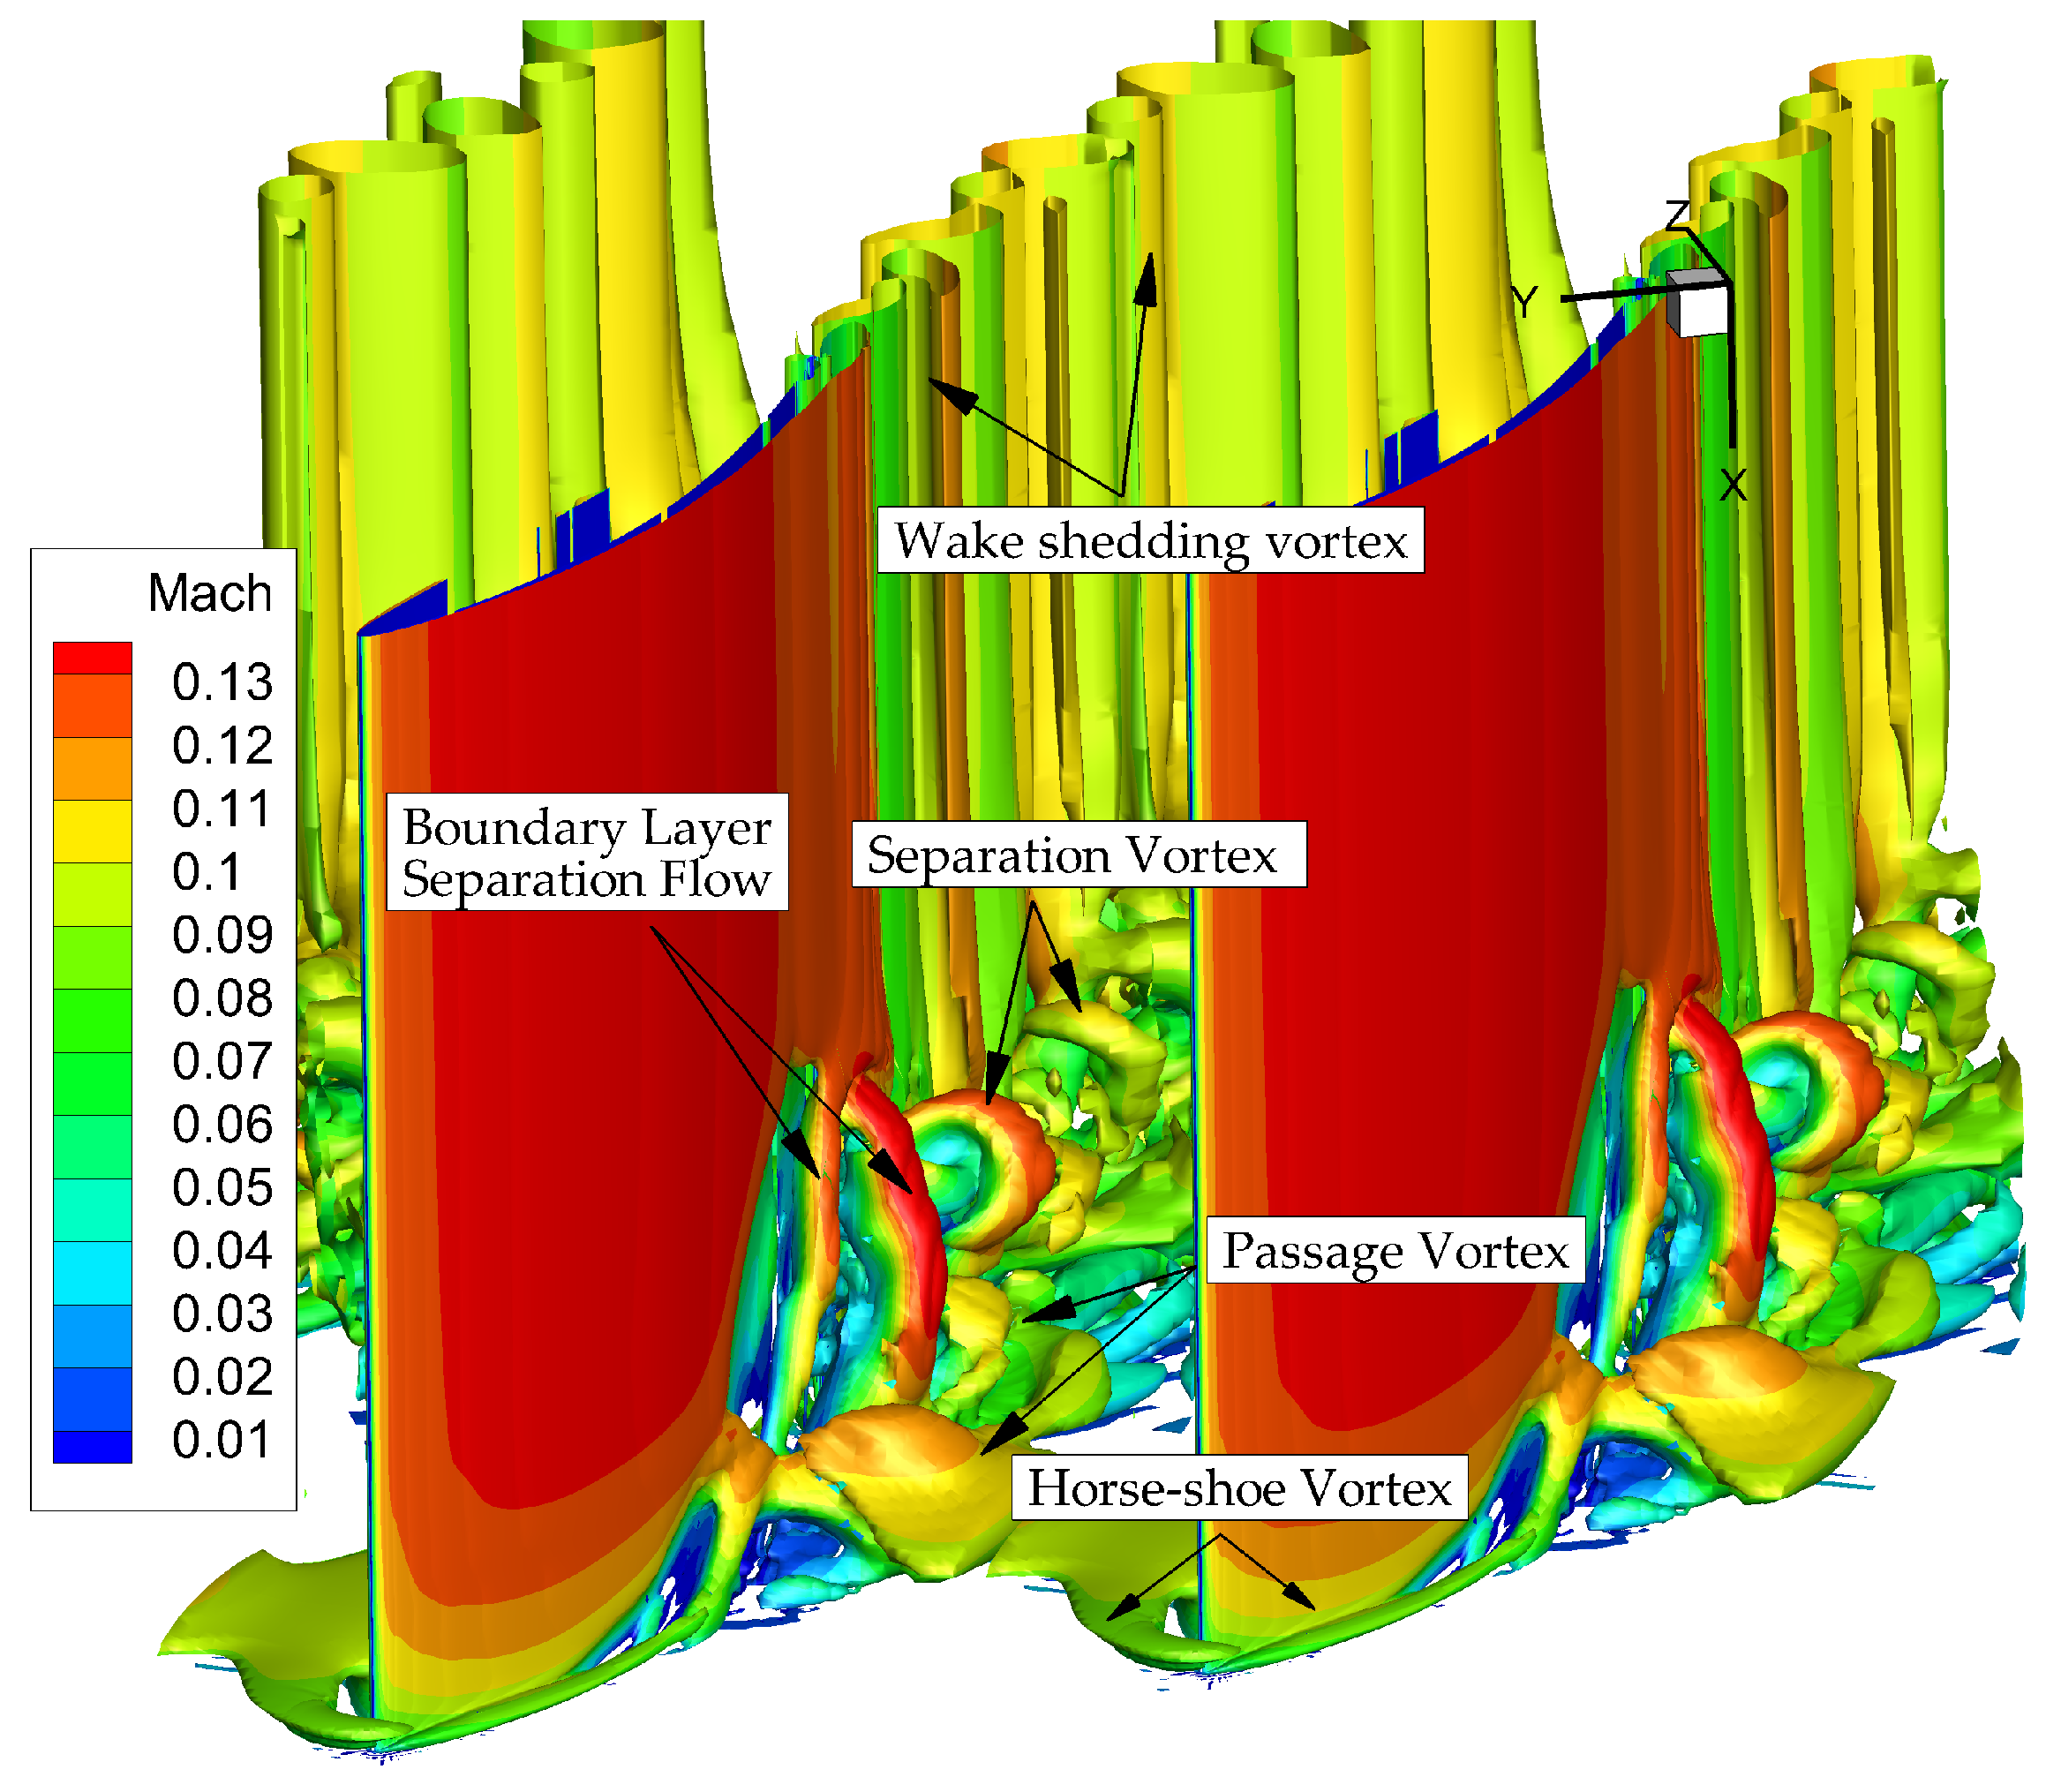
where is the vorticity tensor and is the shear strain tensor. Instantaneous vortical structures from DDES result are given in Figure 6 with the Mach number rendered on the isosurface. The stripe vortices near the trailing edge represent shedding wakes. Additionally, there are the horseshoe vortex, passage vortex and separation vortex near the corner area. The separation vortex is the mix of the pressure side branch of the horseshoe vortex, the passage vortex and the boundary layer separation flow. In this study, it is found that the location of the passage vortex is relatively steady, and a similar finding has been obtained in [13], while the structure and location of the separation vortex vary significantly with the development of corner separation. The suction side boundary layer separates much earlier, so there is no suction side wake vortices in the corner area. Based on these observations, the following part will discuss the interaction between the corner separation and pressure side wake vortices.
The development of corner separation at four time instants is shown in Figure 7.
The inlet flow produces two legs of the horseshoe vortex at the leading edge. The suction side branch of horseshoe vortex develops with the mainstream along the blade surface. With the inducing of the suction side branch of horseshoe vortex, the suction side boundary layer separates, as shown in Figure 7a. The strong streamwise adverse pressure gradient blocks the separation flow and makes the separation line keep rising up, as shown in Figure 7b. Then, the separation flow gradually rolls up and shears with the mainstream. Meanwhile, the cross-passage pressure gradient drives the pressure side branch of the horseshoe vortex and the passage vortex towards the suction side, which continually merges with the separated flow, as shown in Figure 7c. The boundary layer separation flow develops into the hairpin-like vortex near the trailing edge. Likewise, it is interesting to notice that in recent studies about several high-loaded compressors, the hairpin-like vortex has also been observed, with the usage of high-fidelity turbulence simulation tools [11,12,13]. Then, the scale of corner separation enlarges rapidly, as shown in Figure 7d. Hence, the suction side boundary layer massively separates, and the massive separation flow merges with the passage vortex and develops into the new separation vortex. During this period, the corner separation produces a series of large-scale vortices.
According to the DDES results at four time instants given in Figure 8, the hairpin-like vortex always appears in the junction region during the occurrence of corner separation. The hairpin vortex is a coherent structure in wall turbulence transport momentum [32], and it emerges because of perturbations of small upward motion, which is induced by differences in upward flowing velocities depending on the distance from the wall. Additionally, the leg ends of hairpin vortices could gradually converge, resulting in provoked eruptions and producing new hairpin vortices [33]. In the compressor cascade environment, as demonstrated in Figure 8a, the boundary layer separation flow rolls up due to the blockage of the strong adverse pressure gradient. The passage vortex and blade surface boundary layer block the downstream migration of both ends of the separation flow. As a result, the body of separation flow rises up and sheds faster than the legs, as shown in Figure 8b. Thus, the separation flow gradually develops into the vortex like a hairpin, as shown in Figure 8c,d.
To figure out the influence of the hairpin-like vortex during the corner separation, the instantaneous skin friction lines are examined during the appearance of hairpin-like vortex, as shown in Figure 9. The skin friction lines demonstrate the range of the separation [3]. Because of the blockage caused by strong adverse pressure gradient, the skin friction line continually rises up along the blade surface. Therefore, the range of the boundary layer separation continually enlarges. There exists a peak of the friction line near the trailing edge. The position of the peak suggests the scale of the corner separation. With the evolution of separation flow, the peak of the friction line slowly rises up. When the hairpin-like vortex appears and sheds, the peak of the friction line rapidly rises up, and the scale of the corner separation sharply enlarges. After this period, the scale of corner separation stops enlarging, while the separation is already quite strong, and massive separation flows develop in the new separation vortex. Thus, the appearance of the hairpin-like vortex could be a signal of the occurrence of mature corner separation.
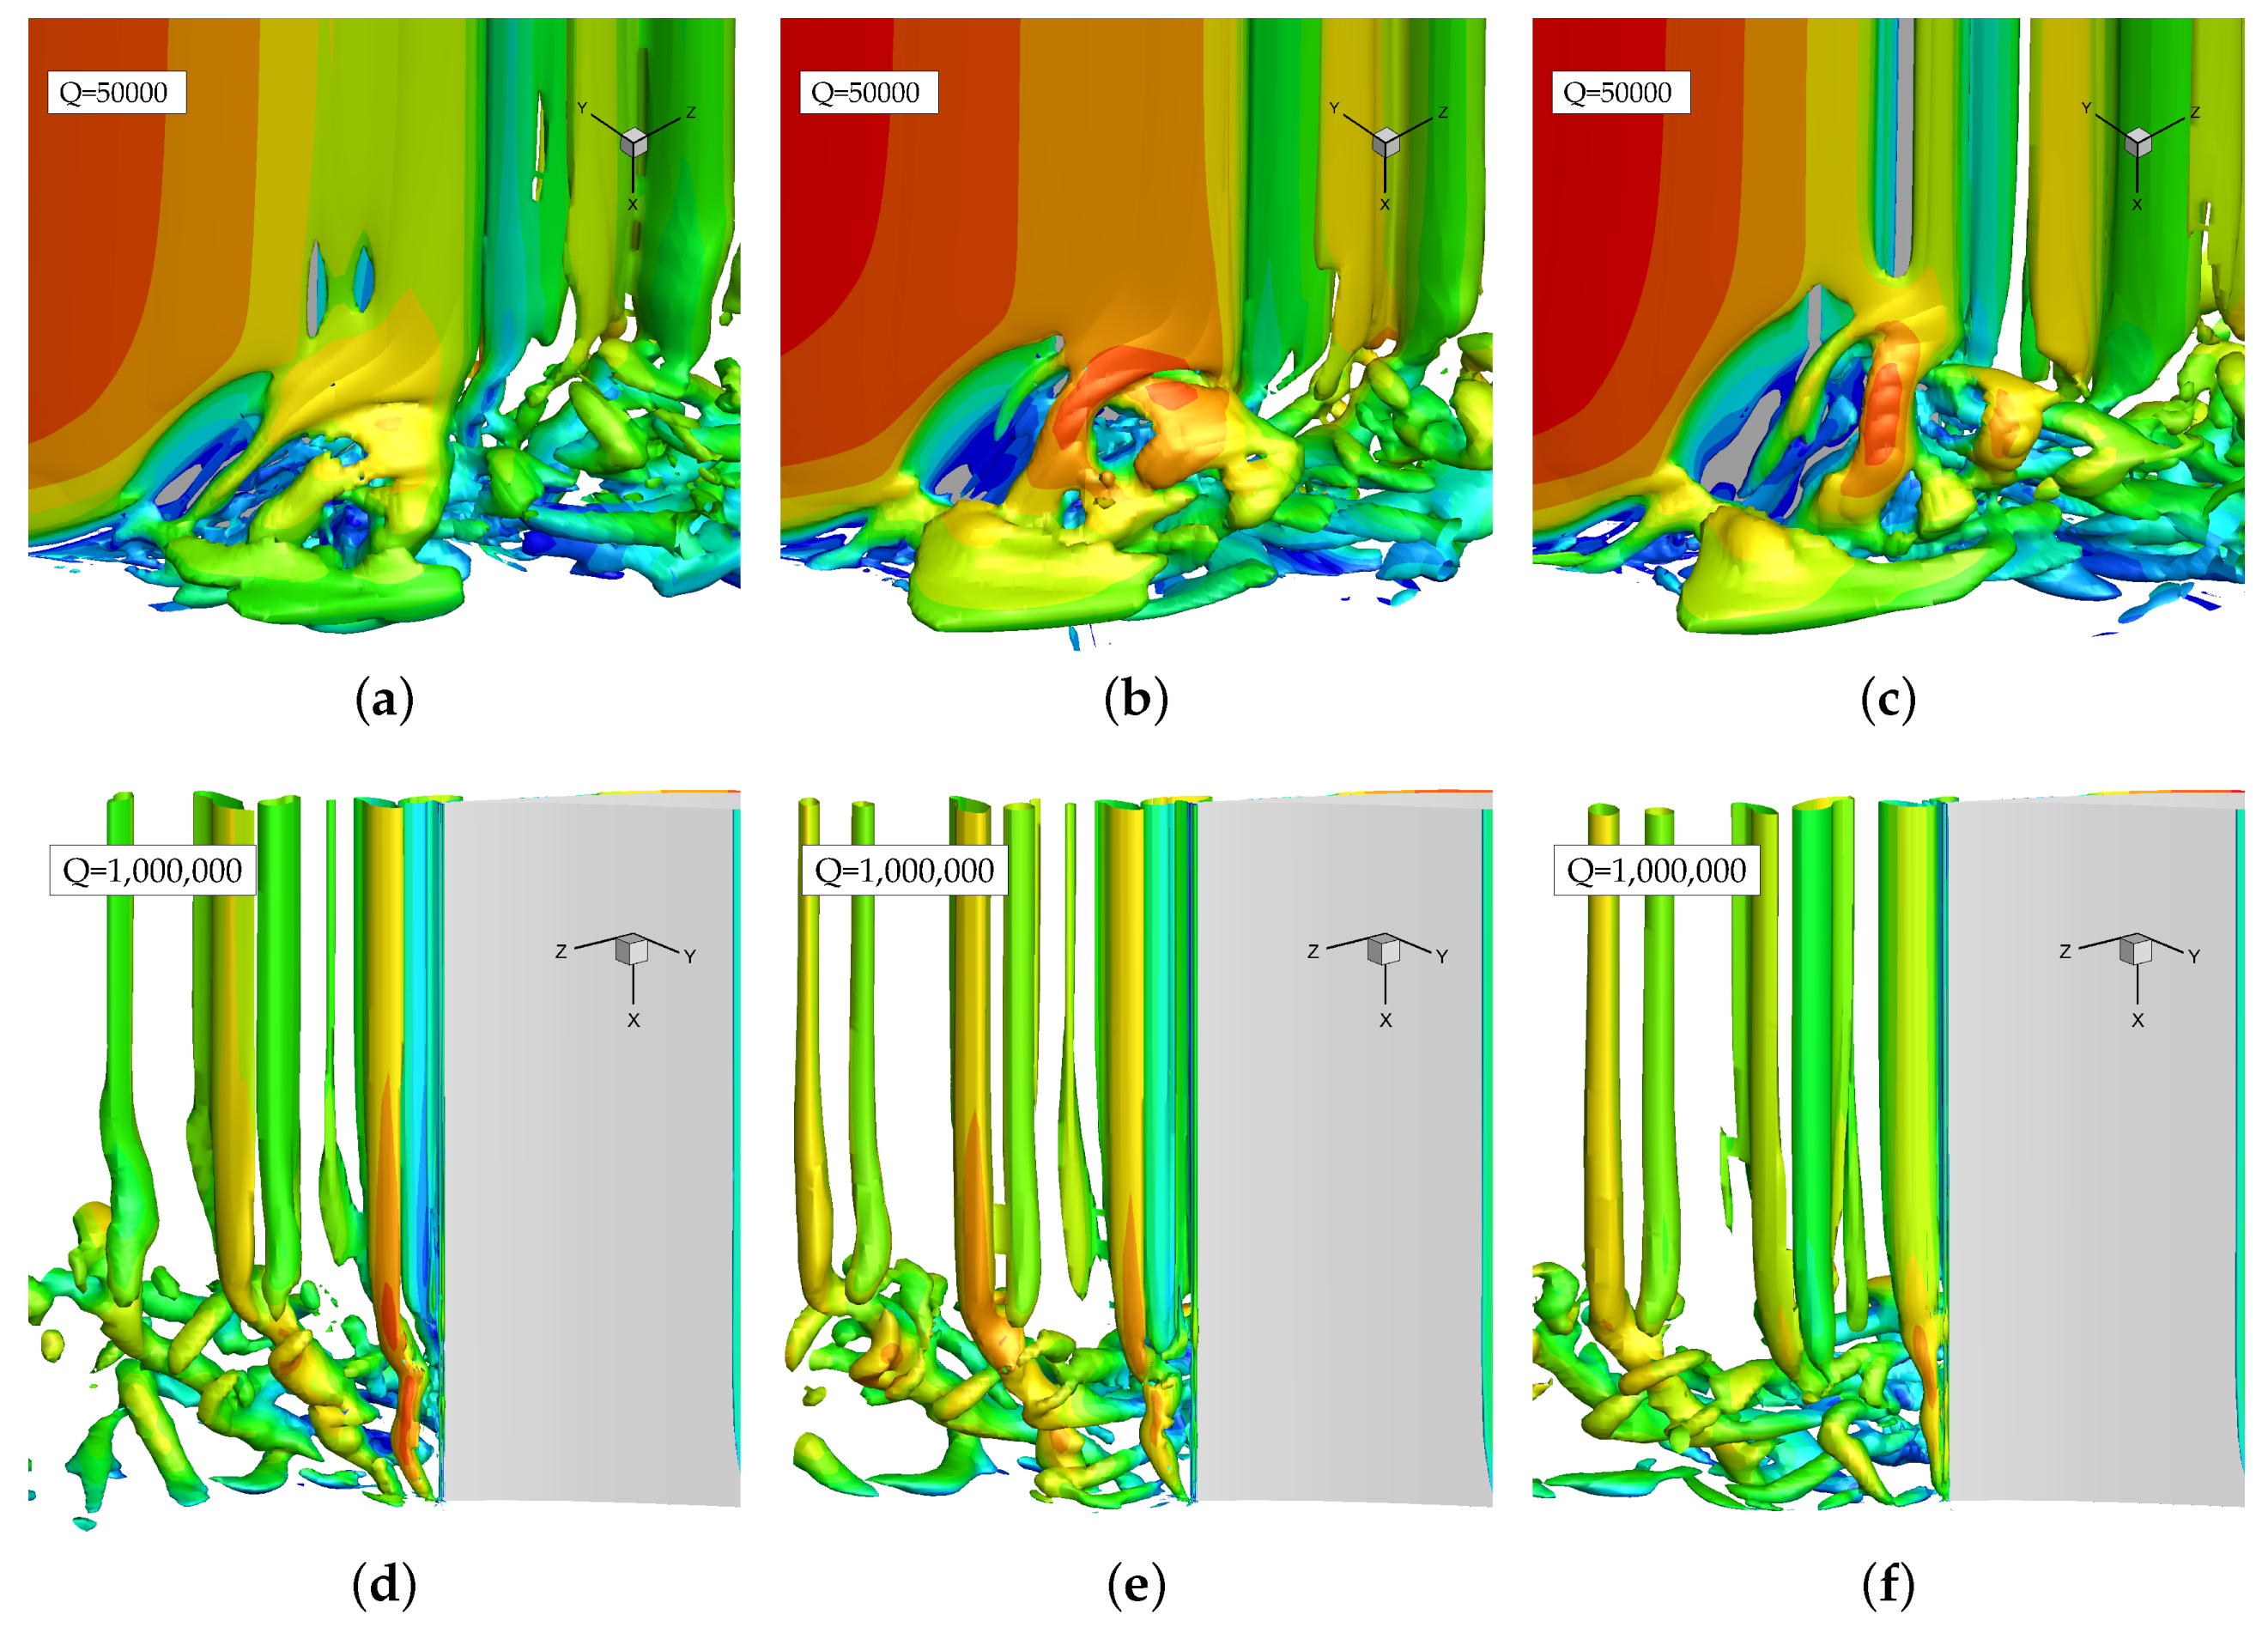
The interaction between the corner separation and wake-shedding vortices is remarkably different before and after the appearance of the hairpin-like vortex. The Q isosurfaces at three time instants before the emergence of hairpin-like vortex are given in Figure 10, and another three time instants after the appearance of hairpin-like vortex are given in Figure 11 for comparison. The Q isosurfaces are rendered by the Mach number to demonstrate the local velocity. As given in Figure 10, the corner separation interacts with the wake vortices before the hairpin-like vortex appears, and according to Figure 9, the size of the separation region is relatively smaller. In this paper, this period is called the “immature corner separation”. The boundary layer separation flow gradually merges with the passage vortex and develops into the hairpin-like vortex. As a consequence, the range of separation gradually enlarges, and the boundary separation flow does not fully develop in the separation vortex. The passage vortex is the main secondary flow at the bottom of corner area, as shown in Figure 10a–c. On the one hand, the passage vortex merges with the boundary separation flow, producing the hairpin-like vortex. On the other hand, the passage vortex interacts with shedding wake vortex. With the merging of passage vortex, the shedding of the wake is delayed near the corner area. Naturally, the interaction is not strong, so only a small area of wakes is influenced. The passage vortex continually merges with the shedding wake vortex and makes it deform, as shown in Figure 10d–f. Hence, before the corner separation matures, the interaction between the passage vortex and the wake vortex dominates.
Figure 11 shows that the corner separation interacts with the wake vortices after the hairpin-like vortex appears. In this paper, this period is called the “large-scale (mature) corner separation”. During this period, the strong separation stops enlarging further, and massive separation flow develops in the new separation vortex. As a result, the separation vortex is the main secondary flow in the corner area, as shown in Figure 11a–c. The two legs of the separation vortex interact with the passage vortex and the wake vortex, respectively. The passage vortex almost totally merges with the near-end wall leg of the separation vortex. Therefore, there exists a backflow area at the bottom of the corner area, as shown in Figure 11b,c. Additionally, the other leg of the separation vortex interacts with the shedding-wake vortex and makes them deform and break into a series of small-scale vortices, as shown in Figure 11e,f. The separation vortex itself also deforms and dissipates due to the interaction with the passage vortex and wake-shedding vortex. Compared to the situation where the hairpin-like vortex does not appear, the interaction between the separation vortex and wake vortex is much stronger, and a larger area is influenced. Hence, after the corner separation matures, the interaction between the separation vortex and the wake vortex dominates the flow in the corner area.
3.3. Turbulence Characteristics
The unsteady interaction between the corner separation and the shedding wake vortices would definitely influence the turbulence characteristics. Both the separation vortex and wake vortex experience strong shear and deformation, especially near the wake area. In this part, the distributions of Reynolds stresses are given and analyzed.
For convenience, a rotated Cartesian coordinate system is formed, as given in Figure 12d. Note that in the new coordinate system, s denotes the streamwise direction, n the wall-normal direction and r the radial direction. The distributions of normal Reynolds stresses are given through Figure 12a–c.
It is clear that and are larger than the normal Reynolds stress . The Reynolds stress is closely related to turbulent momentum transport. Therefore, the radial velocity fluctuation is relatively weak, while the fluctuation of stream-wise and wall-normal velocities is relatively strong. The turbulence characteristics are different between the corner area and wake area. The normal Reynolds stresses and are dominant at the wake area, while the normal Reynolds stress is dominant in the corner area, especially at the outer edge. Because the high-speed mainstream interacts strongly with the low-speed boundary layer separation flow, the streamwise Reynolds stress is strong at the outer edge of the corner area. The separation vortex interacts with the wake vortex more fiercely in the wake area than in the corner area, so the turbulent momentum transport in the wall-normal and radial directions at the wake are stronger.
3.4. Loss Analysis
The strong interaction between the corner separation and wake vortices generates considerable losses. The entropy generation rate is applied in this paper to quantitatively measure the losses. The local entropy generation due to irreversible processes includes thermal loss and viscous loss. Based on the above vortical analysis and turbulence characteristic analysis, entropy analysis is conducted from two aspects: the time-averaged entropy analysis and the instantaneous entropy analysis. Compared to the viscous entropy generation rate, in compressors, the thermal entropy generation rate is quite small and, thus, can be neglected [9]. The viscous entropy generation rate per unit volume is defined as:
where is the viscosity coefficient and the strain rate tensor. The dimensionless viscous entropy generation rate is defined as:
where , , are the inlet temperature, density and velocity, respectively. is the axial chord.
3.4.1. Time-Averaged Entropy Analysis
In order to capture overall viscous losses information, the time-averaged entropy generation rate is analyzed, and this parameter is defined as:
where T is the sample length. The time-averaged dimensionless viscous entropy generation rate is defined in a similar manner.
Figure 13 shows the distribution of time-averaged non-dimensional viscous entropy generation rate . The span represents the distribution out of the corner area; the span and span represent the distributions around the corner area. Compared to span, the viscous losses of span and span are larger at the corner area and the wake area, especially near the wake area. That is the consequence of the corner separation. Obviously, losses are extensively generated at the boundary layer area, the outer edge of the corner area and the wake area. The interaction between boundary layer separation flow and passage vortex causes the main viscous loss near the outer edge of the corner area. Meanwhile, the interaction between separation vortex and wake vortex causes significant viscous loss at the wake area.
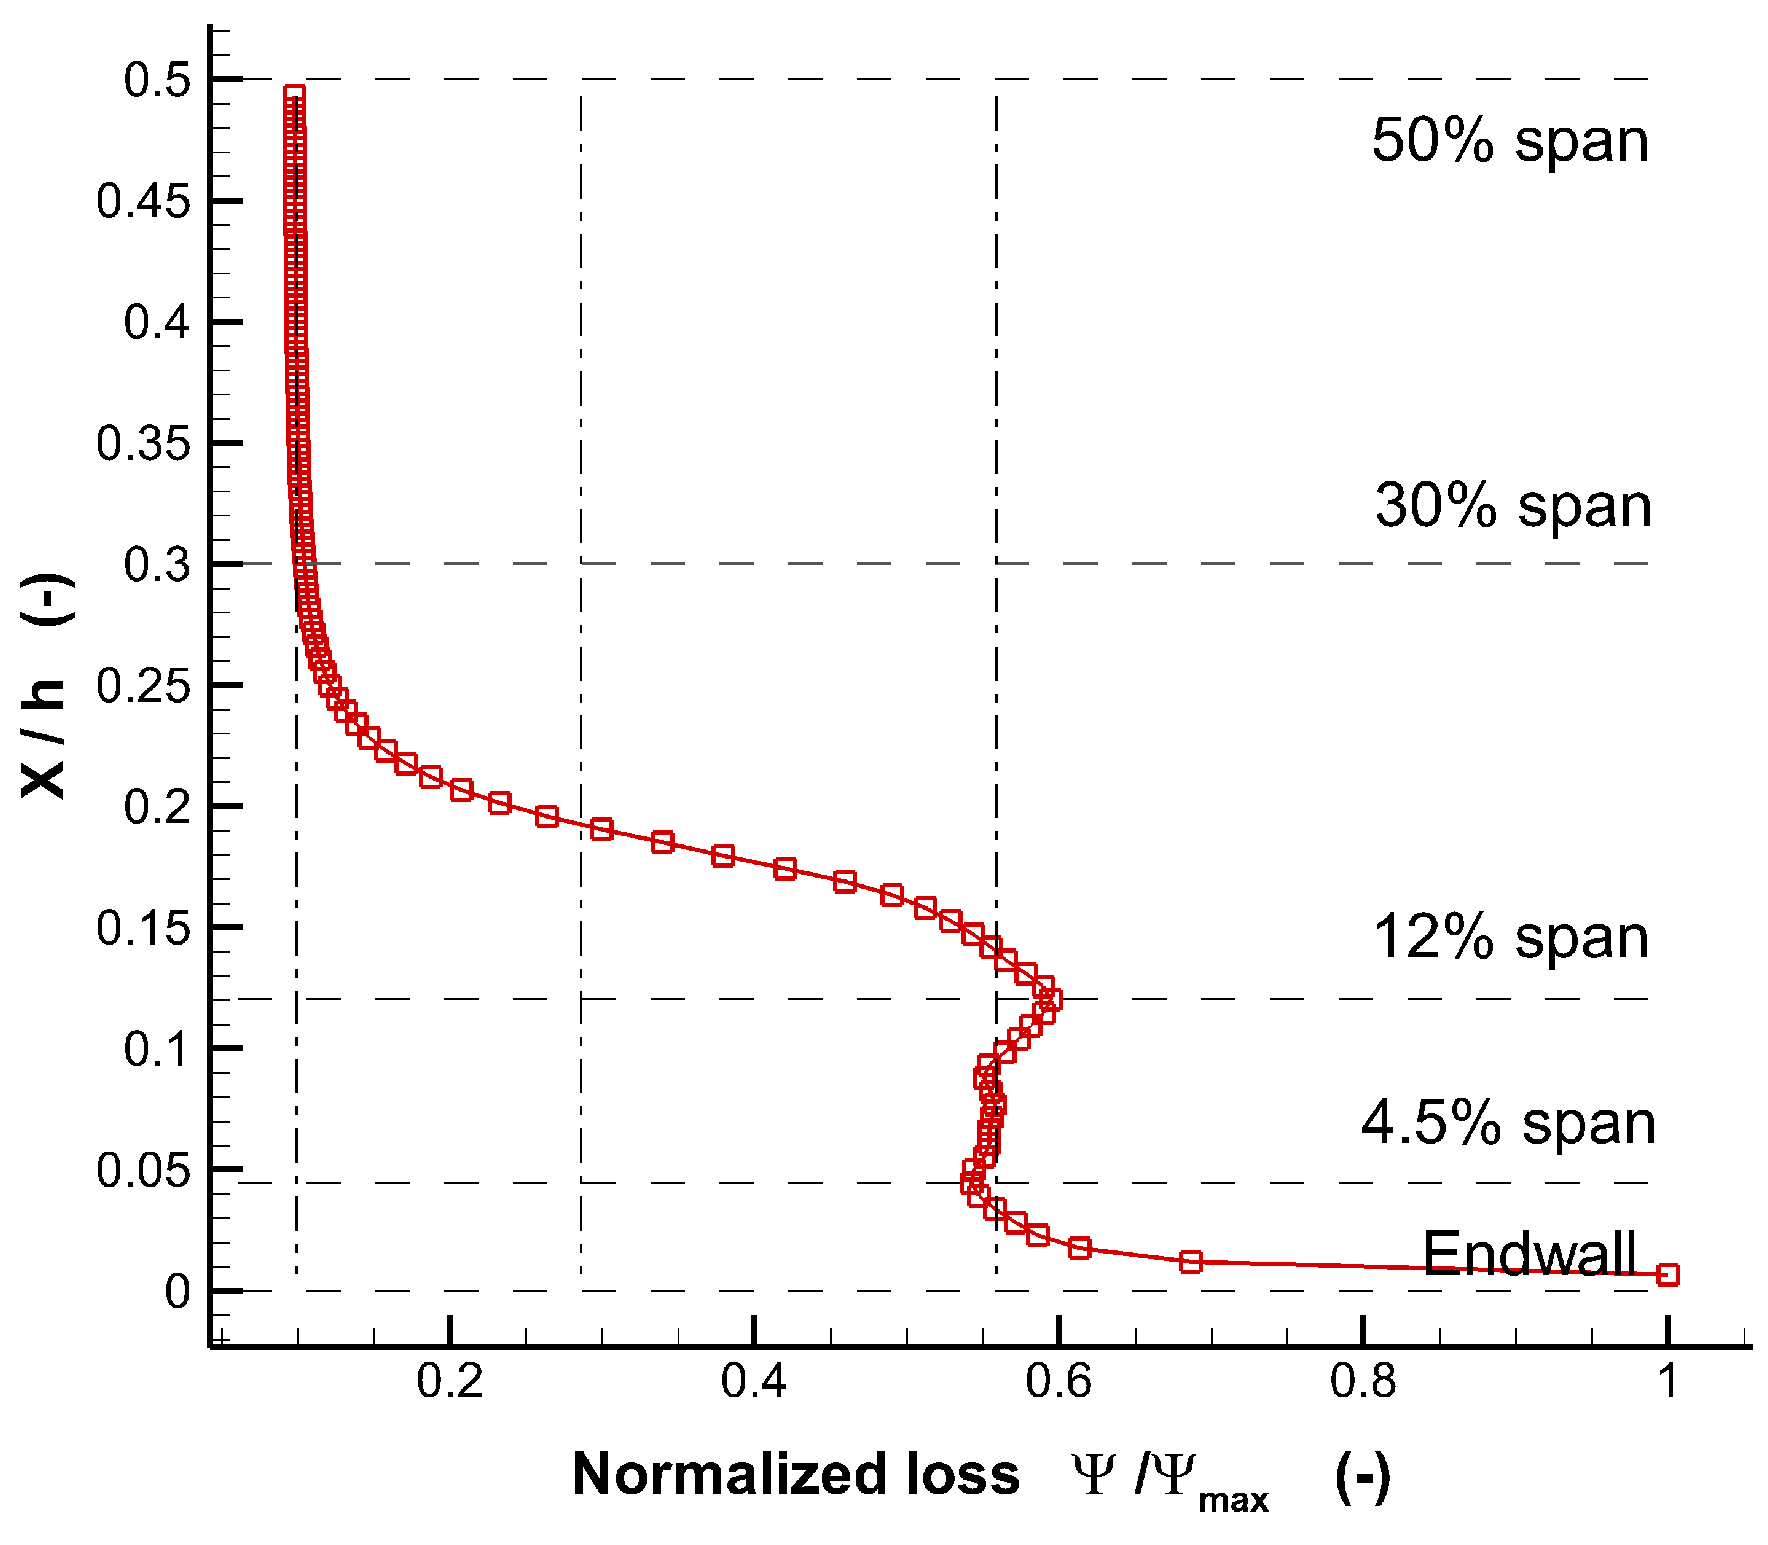
In order to quantitatively analyze the irreversible loss caused by the interaction between the corner separation and the wake vortex, the mass flow-averaged entropy generation rate is defined as:
and its distribution along the radial direction is given in Figure 14; also note that in Figure 14, the abscissa axis is normalized. The represents the end wall, and the represents the mid-span of the cascade. According to the flow structures discussed above and Figure 14, the distribution of can be divided into four parts, which respectively represent the losses from different flow structures. The first part, 30–50% span, represents the loss from the wake vortex without the influence of the separation vortex; the second part, 12–30% span, represents the losses from the wake vortex and separation vortex; the third part, 4.5–12% span, represents the losses from the wake vortex, separation vortex and passage vortex; the last part, 0–5.4% span, represents the losses mainly from the wake vortex, passage vortex and end wall boundary layer. The loss from the wake vortex without the influence of the separation vortex is small, while the loss increases rapidly with the influence of the separation vortex, and the interaction significantly increases the loss. The influence of corner separation can reach up to span. There exists a small peak at span, where the interaction between the separation vortex and wake vortex is the strongest. The loss in the third part keeps at a high value and is nearly constant. This indicates that the separation vortex-wake vortex interaction and the passage vortex-wake shedding interaction throughout this region are fully developed. Because of the viscous friction from the end wall, the loss increases rapidly in the fourth part. To sum up, the losses from passage vortex and wake vortex dominate at about 0– span, and the covering range enlarges to span, when considering the influence of the interaction between the separation vortex and wake vortex.
To weigh the contributions of the separation vortex, passage vortex and wake vortex, the dimensionless viscous entropy generation rate at three slices will be discussed, and their positions are given in Figure 15.
The distribution of on the – slice is given in Figure 16a.
Figure 16b gives the distributions of along the five spanwise lines. According to the analysis of vortical structures above, B, C and D can approximately represent the viscous entropy generation rate distributions of the wake area, the separation vortex area and the passage vortex area, respectively. The distributions of along A and E are given here for contrast. It is clear the loss from the wake vortex is larger than the losses from the separation vortex and passage vortex, especially around the corner area. Comparing A and E, along B, C and D are much larger below about span, because the losses mainly come from the separation vortex, passage vortex and wake vortex, and the interaction increases the loss around the corner area. At the position C, the loss has a peak at about span; while at the position D, the loss has a peak at about span. Position C represents that the loss mainly comes from the separation vortex, and position D indicates that the loss mainly comes from the passage vortex. Therefore, in the corner area, the separation vortex causes the main loss at about span, while the passage vortex causes the main loss at about span. At Position B, the effects from several mechanisms co-exist. Above span, the loss mainly comes from the wake vortex. Below span, the wake vortex together with the interaction between separation vortex and wake, also the interaction between passage vortex and wake vortex results in the rapidly increased loss, which reaches a peak at span. Moving closer to the end wall, the loss at Position B increases again because of the additional contribution from the end wall friction. Hence, the loss from the wake vortex dominates in the corner area, though the passage vortex and the separation vortex also cause considerable losses. The loss from the wake vortex increases rapidly due to the influence of the passage vortex and separation vortex. The covering range of high-loss area is enlarged mainly by the influence of separation vortex.
3.4.2. Instantaneous Entropy Analysis
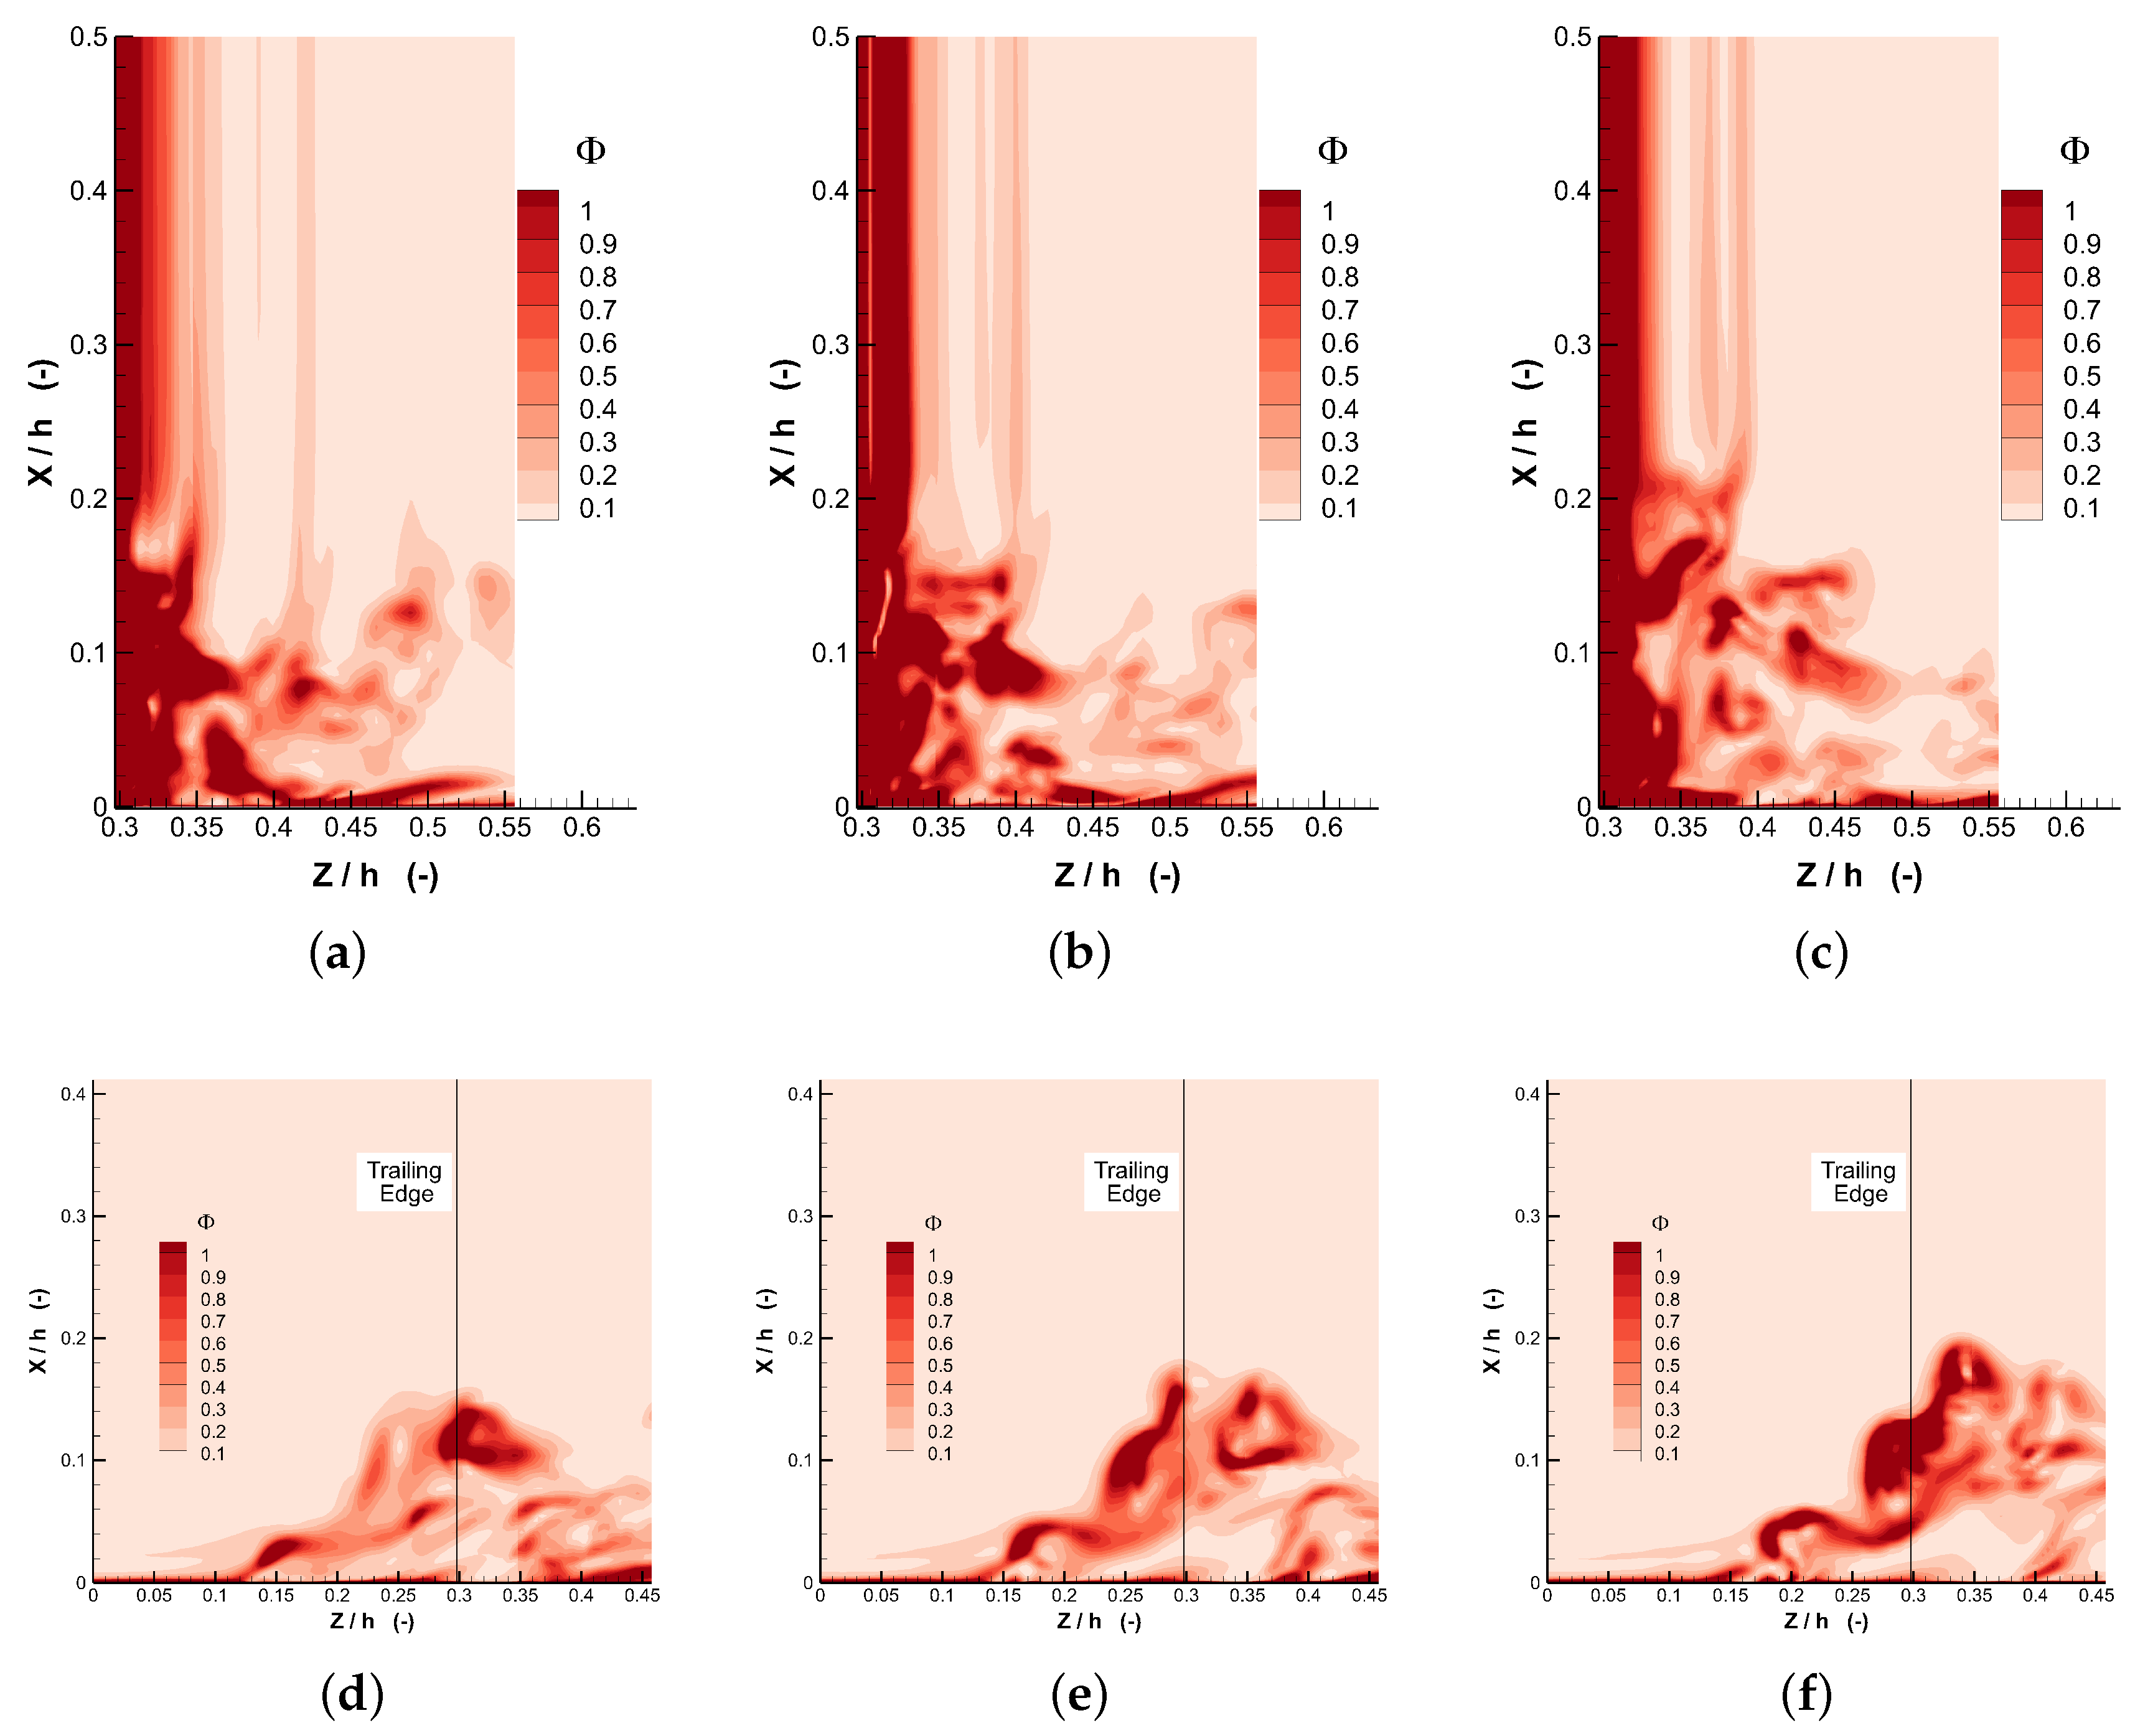
The overall loss information has been obtained, and the main contributors are figured out in the former section. This section is aimed at analyzing the instantaneous loss during the corner separation process. The instantaneous entropy generation rate distributions on slice – and slice – are analyzed. The locations of – and – are given in Figure 15b, with the former demonstrates the loss along the wake vortex, and the latter demonstrates the loss along the separation vortex.
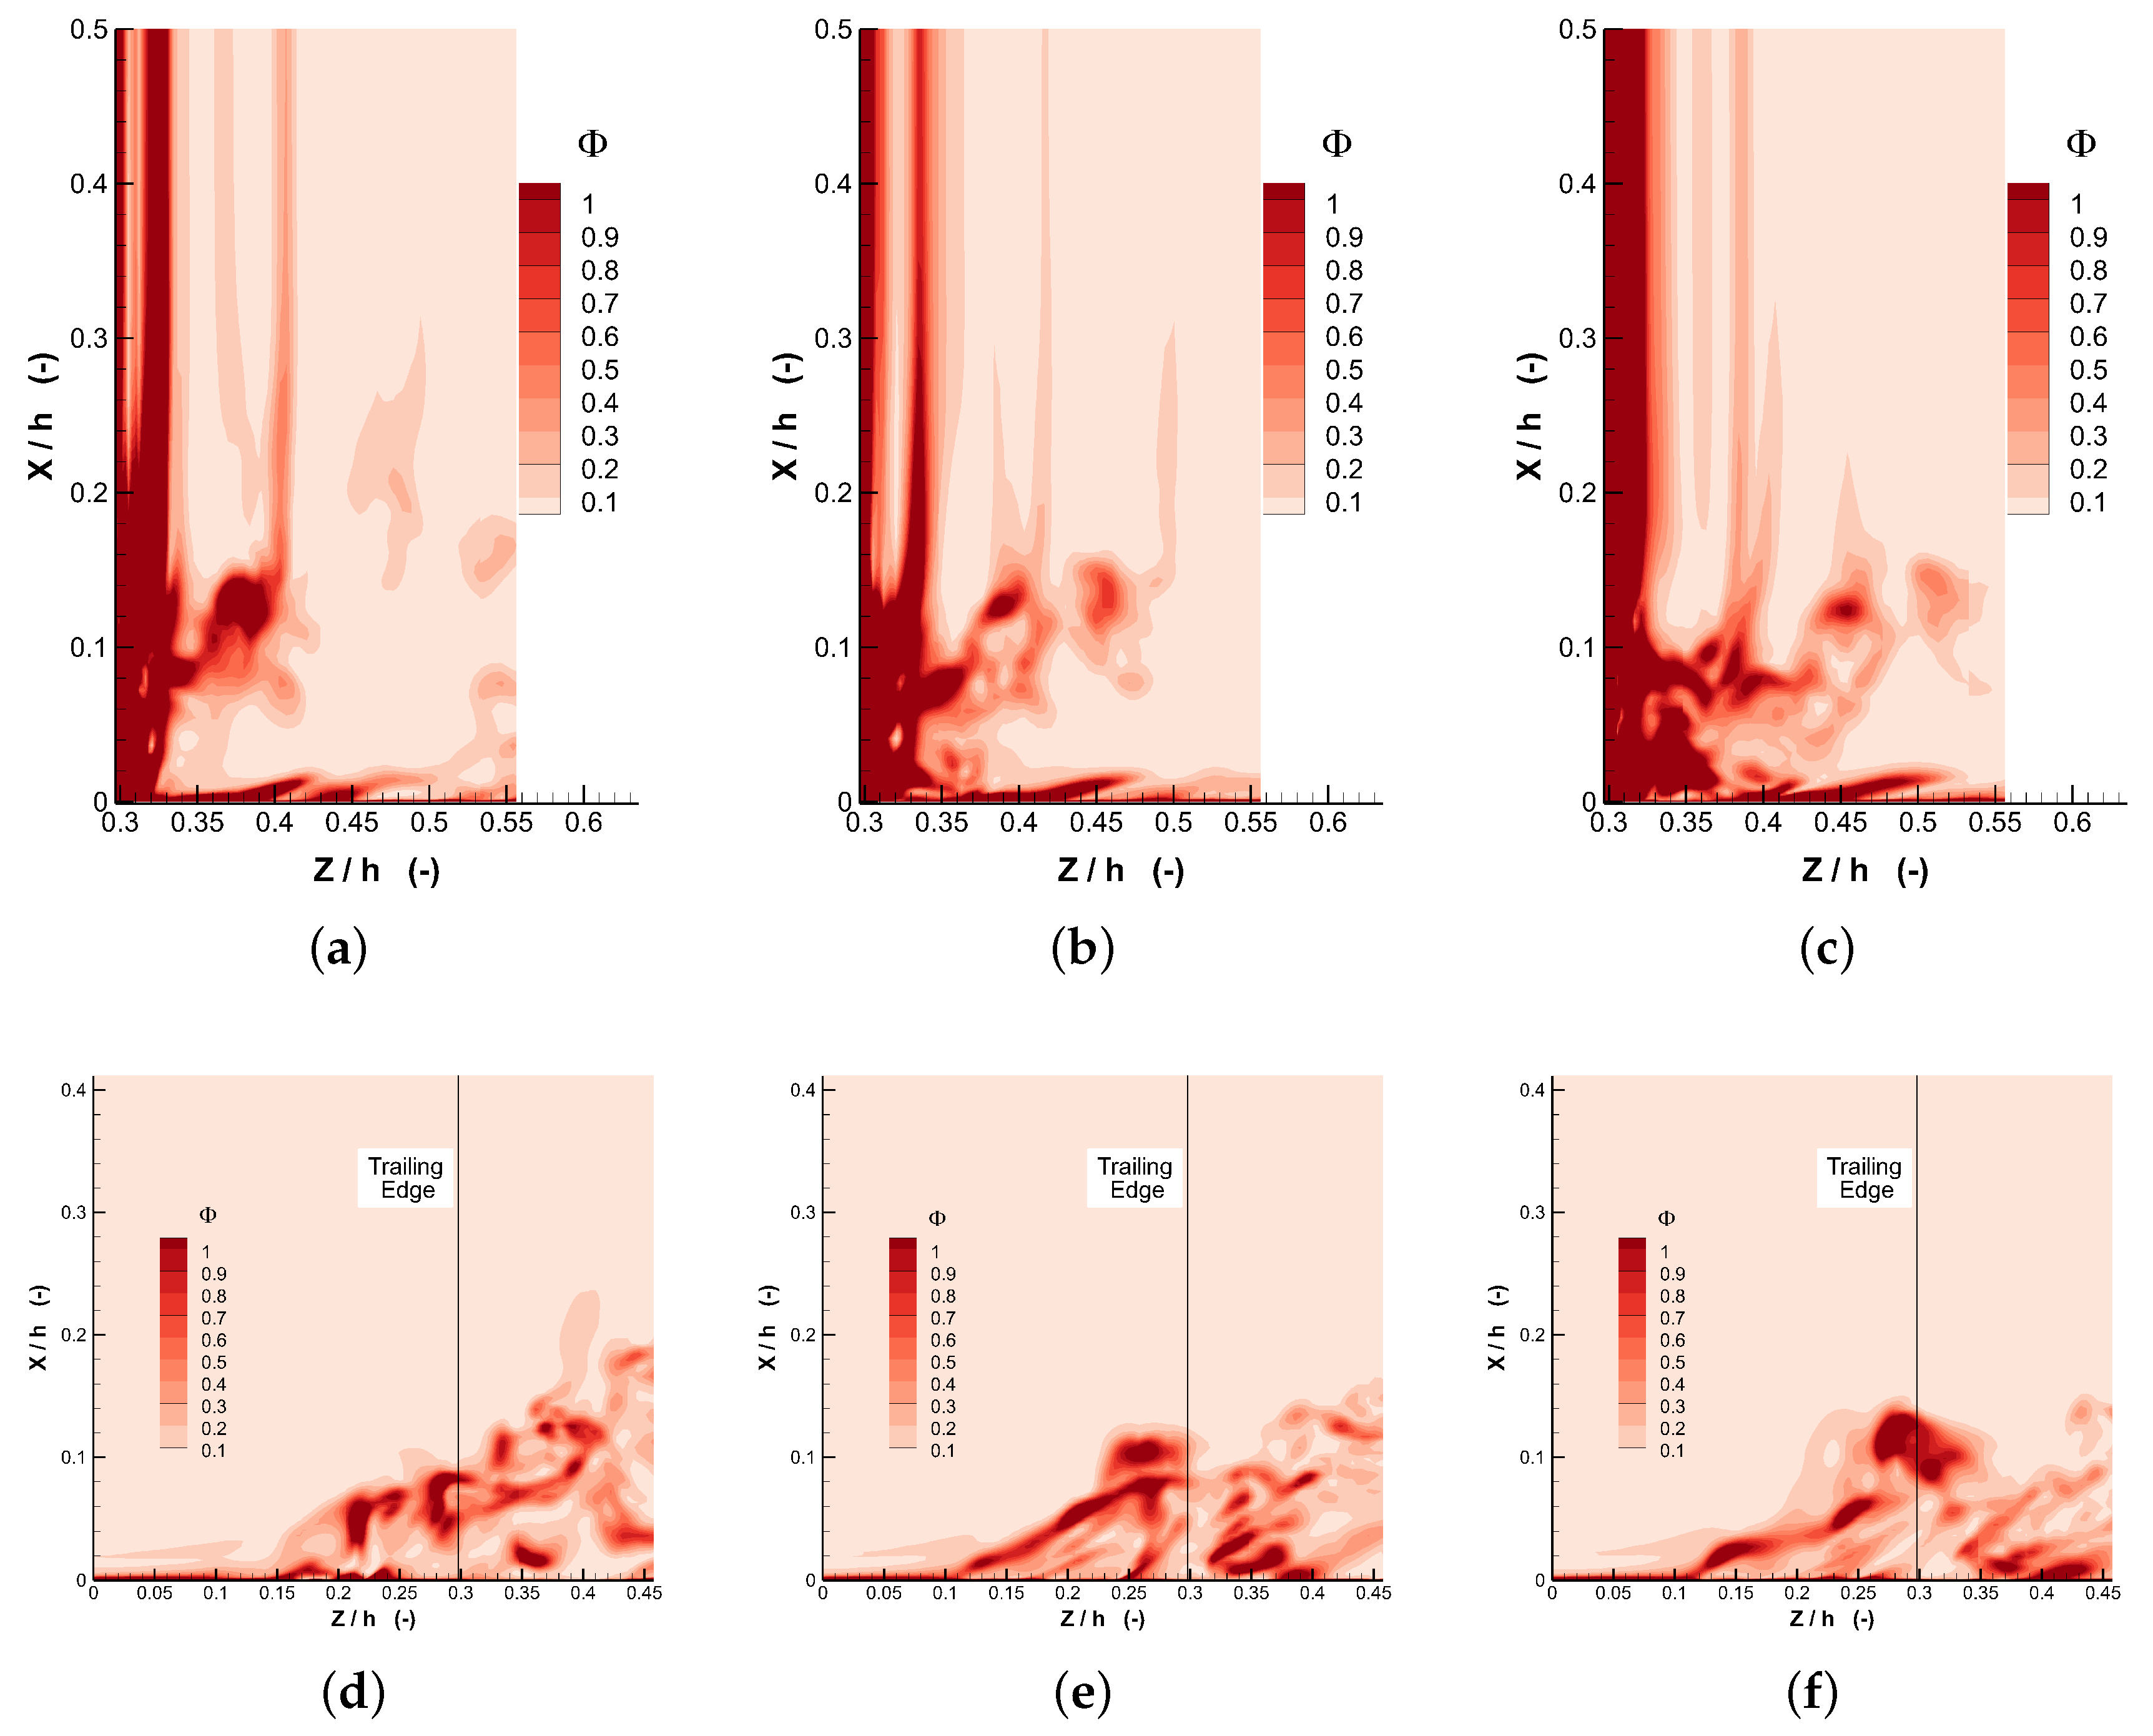
The distribution of before the appearance of the hairpin-like vortex is presented in Figure 17. During this period, the passage vortex is the main secondary flow at the bottom of corner area. Therefore, the loss of the corner area dominates below the span, and the high-loss area gradually rises up with the development of separation flow, as shown in Figure 17d–f. The loss from the wake vortex decreases rapidly after shedding, while the loss from the corner area decreases slowly, and the high-loss area is below about span, as shown in Figure 17a–c. As discussed above, during this period, the passage vortex continually merges with the wake vortex, which causes additional loss in the wake area. With the blockage of the passage vortex, the pressure side wake vortex deforms in the corner area near end wall, which causes that the loss distribution below the span. Therefore, the interaction between the passage vortex and wake vortex causes significant additional loss in the corner area before the corner separation matures.
The distribution of after the appearance of the hairpin-like vortex is given in Figure 18. With the separation flow developing in the hairpin-like vortex, the large-scale corner separation occurs. The separation vortex is the main secondary flow above the corner area. The high-loss area enlarges rapidly and gradually rises up in the corner area, as shown in Figure 18d–f. During this period, the passage vortex almost totally merges with separation vortex, while the backflow in this area does not result in obvious viscous loss. In the wake area, the high-loss area enlarges up to 20% span, as shown in Figure 18a–c. During this period, the legs of the separation vortex strongly interact with the wake vortex and make the wake vortex break down, which causes the enlargement of the high-loss area. Therefore, the interaction between separation vortex and wake vortex causes significant additional loss in the corner area after the corner separation matures.
4. Conclusions
The corner separation in a linear compressor cascade is studied with both RANS and DDES approaches. The three-dimensional vortical structures, turbulence characteristics and losses are then analyzed. The main conclusions are as follows:
- This work demonstrates the feasibility of simulating compressor cascade with corner separation by DDES. The DDES successfully predicts the three-dimensional unsteady corner separation and captures rich flow structures. The RANS prematurely predicts the corner separation and overestimates the total pressure loss coefficient. DDES results agree well with the experiment and are systematically better than the RANS results.
- The mechanisms of the corner separation are further investigated based on the high-resolution flow structures. The development and role of the hairpin-like vortex are revealed. The hairpin-like vortex comes from the emerging of the boundary layer separation and the passage vortex, and the hairpin-like vortex lifts the separation line in the corner area as it develops. The interaction between the corner separation and wake shedding vortices is remarkably different before and after the appearance of the hairpin-like vortex. The appearance of the hairpin-like vortex could be a signal of large-scale corner separation.
- The turbulence characteristics near the corner area and wake area are studied. The interactions between the different secondary flows enhance the turbulence intensity, however with different effects on the turbulent momentum transport. The normal Reynolds stresses and dominate near the wake area, while the normal Reynolds stress dominates near the corner area.
- With entropy analysis, the overall losses generation information is obtained, and the losses are related to the flow structures that generate them. The majority of loss comes from the bottom span, especially the bottom span. The high-loss region can be divided into four parts according to their contributors, and the contributions of different secondary flows are revealed. The corner separation vortices increase the loss magnitude and enlarge the high-loss region due to its interaction with the wake vortices.
- The instantaneous entropy analysis indicates that the loss distributions vary obviously before and after the appearance of the hairpin-like vortex. This behavior of loss is the same as that for the coherent flow structure, and it is the consequence of the interaction between separation and wake vortices. The interaction between the passage vortex and wake vortex is the main cause of the losses when the massive corner separation has not yet been triggered (the hairpin-like vortex has not shown up); however, when the massive corner separation occurs, the influence of the interaction between the separation vortex and wake vortex becomes dominant, and an enlarged region is affected.
Acknowledgments
Lipeng Lu of Beihang University kindly provided the cascade information. This study is supported by the National Natural Science Foundation of China (Project Grant No. 51506107, Project Grant No. 51476082 and Key Project Grant No. 51136003).
Author Contributions
Xinrong Su developed the in-house CFD code. Hao Wang carried out the simulations and the analysis. Dun Lin, Xinrong Su and Xin Yuan provided insightful discussions. Hao Wang and Dun Lin wrote the paper. Xinrong Su and Xin Yuan refined the paper. All authors have read and approved the final manuscript.
Conflicts of Interest
The authors declare no conflict of interest.
References
- Lei, V.M.; Spakovszky, Z.S.; Greitzer, E.M. A criterion for axial compressor hub-corner stall. J. Turbomach. Trans. ASME 2008, 130, 031006. [Google Scholar] [CrossRef]
- Gbadebo, S.A.; Hynes, T.P.; Cumpsty, N.A. Influence of surface roughness on three-dimensional separation in axial compressors. In Proceedings of the ASME Turbo Expo 2004: Power for Land, Sea, and Air, Vienna, Austria, 14–17 June 2004; pp. 471–481. [Google Scholar]
- Gbadebo, S.A.; Cumpsty, N.A.; Hynes, T.P. Three-Dimensional Separations in Axial Compressors. J. Turbomach. 2005, 127, 331–339. [Google Scholar] [CrossRef]
- Gbadebo, S.A.; Cumpsty, N.A.; Hynes, T.P. Interaction of tip clearance flow and three-dimensional separations in axial compressors. J. Turbomach. 2007, 129, 679–685. [Google Scholar] [CrossRef]
- Wei, M.; Ottavy, X.; Lipeng, L.; Leboeuf, F.; Feng, G. Experimental study of corner stall in a linear compressor cascade. Chin. J. Aeronaut. 2011, 24, 235–242. [Google Scholar]
- Ma, W.; Ottavy, X.; Lu, L.; Leboeuf, F.; Gao, F. Experimental investigations of corner stall in a linear compressor cascade. In Proceedings of the ASME 2011 Turbo Expo: Turbine Technical Conference and Exposition, Vancouver, BC, Canada, 6–10 June 2011; pp. 39–51. [Google Scholar]
- Wei, M.; Xavier, O.; Lipeng, L.; Francis, L. Intermittent corner separation in a linear compressor cascade. Exp. Fluids 2013, 54, 1546. [Google Scholar] [CrossRef]
- Gand, F.; Deck, S.; Brunet, V.; Sagaut, P. Flow dynamics past a simplified wing body junction. Phys. Fluids 2010, 22, 115111. [Google Scholar] [CrossRef]
- Scillitoe, A.D.; Tucker, P.G.; Adami, P. Numerical Investigation of Three-Dimensional Separation in an Axial Flow Compressor: The Influence of Freestream Turbulence Intensity and Endwall Boundary Layer State. J. Turbomach. 2017, 139, 021011. [Google Scholar] [CrossRef]
- Gao, F.; Zambonini, G.; Boudet, J.; Ottavy, X.; Lu, L.; Shao, L. Unsteady behavior of corner separation in a compressor cascade: Large eddy simulation and experimental study. Proc. Inst. Mech. Eng. Part A J. Power Energy 2015, 229, 508–519. [Google Scholar] [CrossRef]
- Gao, F.; Ma, W.; Zambonini, G.; Boudet, J.; Ottavy, X.; Lu, L.; Shao, L. Large-eddy simulation of 3-D corner separation in a linear compressor cascade. Phys. Fluids 2015, 27, 085105. [Google Scholar] [CrossRef]
- Liu, Y.; Yan, H.; Lu, L. Investigation of corner separation in a linear compressor cascade using DDES. In Proceedings of the ASME Turbo Expo 2015: Turbine Technical Conference and Exposition, Montreal, QC, Canada, 15–19 June 2015; p. V02AT37A029. [Google Scholar]
- Yangwei, L.; Hao, Y.; Lipeng, L.; Qiushi, L. Investigation of Vortical Structures and Turbulence Characteristics in Corner Separation in a Linear Compressor Cascade Using DDES. J. Fluids Eng. 2017, 139, 021107. [Google Scholar]
- Wang, Z.N.; Yuan, X. Unsteady mechanisms of compressor corner separation over a range of incidences based on hybrid LES/RANS. In Proceedings of the ASME Turbo Expo 2013: Turbine Technical Conference and Exposition, San Antonio, TX, USA, 3–7 June 2013; p. V06AT35A030. [Google Scholar]
- Denton, J.D. Loss Mechanisms in Turbomachines. J. Turbomach. Trans. ASME 1993, 115, 621–656. [Google Scholar] [CrossRef]
- Winterbone, D.; Turan, A. Advanced Thermodynamics for Engineers; Butterworth-Heinemann: Oxford, UK, 2015. [Google Scholar]
- Dixon, S.L.; Hall, C. Fluid Mechanics and Thermodynamics of Turbomachinery; Butterworth-Heinemann: Oxford, UK, 2013. [Google Scholar]
- Rathakrishnan, E. Fundamentals of Engineering Thermodynamics; PHI Learning Pvt. Ltd.: New Delhi, India, 2005. [Google Scholar]
- Herwig, H.; Schmandt, B. How to determine losses in a flow field: A paradigm shift towards the second law analysis. Entropy 2014, 16, 2959–2989. [Google Scholar] [CrossRef]
- Zlatinov, M.B.; Tan, C.S.; Montgomery, M.; Islam, T.; Harris, M. Turbine hub and shroud sealing flow loss mechanisms. J. Turbomach. 2012, 134, 061027. [Google Scholar] [CrossRef]
- Lin, D.; Yuan, X.; Su, X. Local Entropy Generation in Compressible Flow through a High Pressure Turbine with Delayed Detached Eddy Simulation. Entropy 2017, 19, 29. [Google Scholar] [CrossRef]
- Su, X.; Yuan, X. Improved compressor corner separation prediction using the quadratic constitutive relation. Proc. Inst. Mech. Eng. Part A J. Power Energy 2017, 1–13. [Google Scholar] [CrossRef]
- Spalart, P.R.; Deck, S.; Shur, M.; Squires, K.; Strelets, M.K.; Travin, A. A new version of detached-eddy simulation, resistant to ambiguous grid densities. Theor. Comput. Fluid Dyn. 2006, 20, 181–195. [Google Scholar] [CrossRef]
- Ma, W.; Gao, F.; Ottavy, X.; Lu, L.; Wang, A. Numerical Investigation of Intermittent Corner Separation in a Linear Compressor Cascade. In Proceedings of the ASME Turbo Expo 2016: Turbomachinery Technical Conference and Exposition, Seoul, Korea, 13–17 June 2016; p. V02AT37A035. [Google Scholar]
- Su, X.; Yamamoto, S.; Yuan, X. On the accurate prediction of tip vortex: effect of numerical schemes. In Proceedings of the ASME Turbo Expo 2013: Turbine Technical Conference and Exposition, San Antonio, TX, USA, 3–7 June 2013; p. V06BT37A013. [Google Scholar]
- Su, X.; Sasaki, D.; Nakahashi, K. On the efficient application of Weighted Essentially Nonoscillatory scheme. Int. J. Numer. Methods Fluids 2013, 71, 185–207. [Google Scholar] [CrossRef]
- Gou, J.; Zhang, Y.; Su, X.; Yuan, X. Numerical investigation on the effects of real industrial bleeding geometry in a high-speed compressor stage. J. Mech. Sci. Technol. 2016, 30, 5275–5286. [Google Scholar] [CrossRef]
- Gou, J.; Yuan, X.; Su, X. Adaptive mesh refinement method based investigation of the interaction between shock wave, boundary layer, and tip vortex in a transonic compressor. Proc. Inst. Mech. Eng. Part G J. Aerosp. Eng. 2017, 1–22. [Google Scholar] [CrossRef]
- Spalart, P.R.; Allmaras, S.R. A one-equation turbulence model for aerodynamics flows. La Recherche Aérospatiale 1992, 439, 5–21. [Google Scholar]
- Spalart, P.; Jou, W.; Strelets, M.; Allmaras, S. Comments on the feasibility of LES for wings, and on a hybrid RANS/LES approach. Adv. DNS/LES 1997, 1, 4–8. [Google Scholar]
- Wilcox, D.C. Turbulence Modeling for CFD; DCW Industries: La Canada, CA, USA, 1998; Volume 2. [Google Scholar]
- Adrian, R.J. Hairpin vortex organization in wall turbulence a. Phys. Fluids 2007, 19, 041301. [Google Scholar] [CrossRef]
- Haidari, A.; Smith, C. The generation and regeneration of single hairpin vortices. J. Fluid Mech. 1994, 277, 135–162. [Google Scholar] [CrossRef]
Figure 1.
The computational grid: (a) mesh topology; (b) mesh details.

Figure 2.
Comparison of between RANS, Delayed Detached Eddy Simulation (DDES) and experimental [5] results. (a) , mid-span; (b) , near end wall.
Figure 2.
Comparison of between RANS, Delayed Detached Eddy Simulation (DDES) and experimental [5] results. (a) , mid-span; (b) , near end wall.
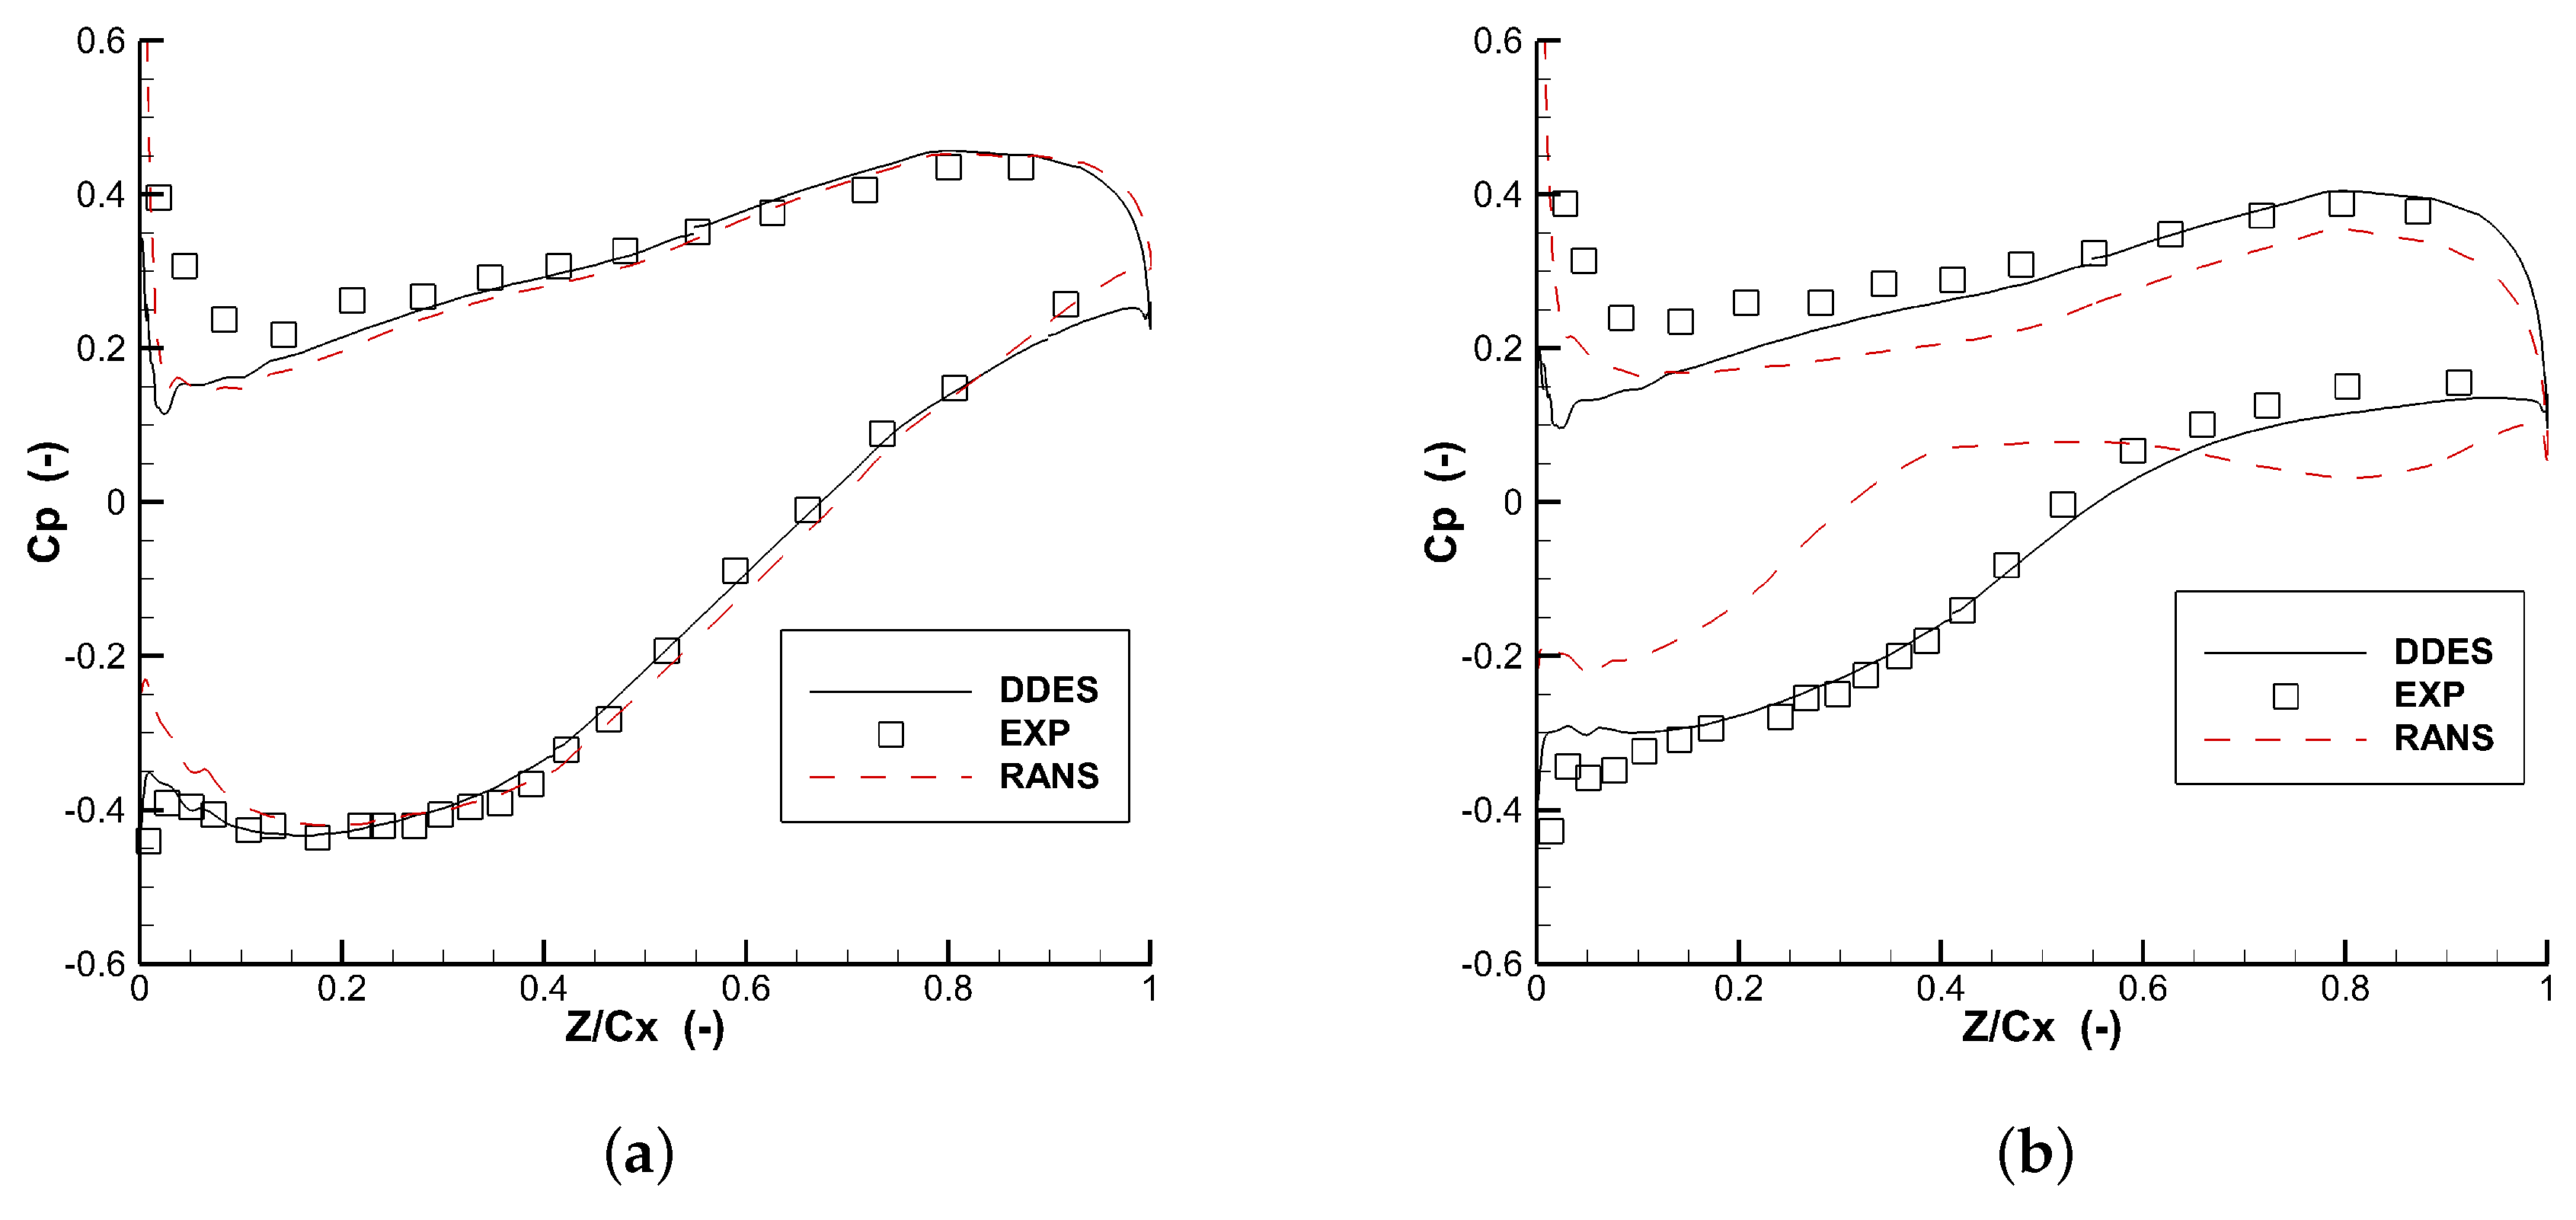
Figure 3.
Comparison of predicted total pressure loss coefficient with experiment at the position of axial chord downstream from the trailing edge.
Figure 3.
Comparison of predicted total pressure loss coefficient with experiment at the position of axial chord downstream from the trailing edge.
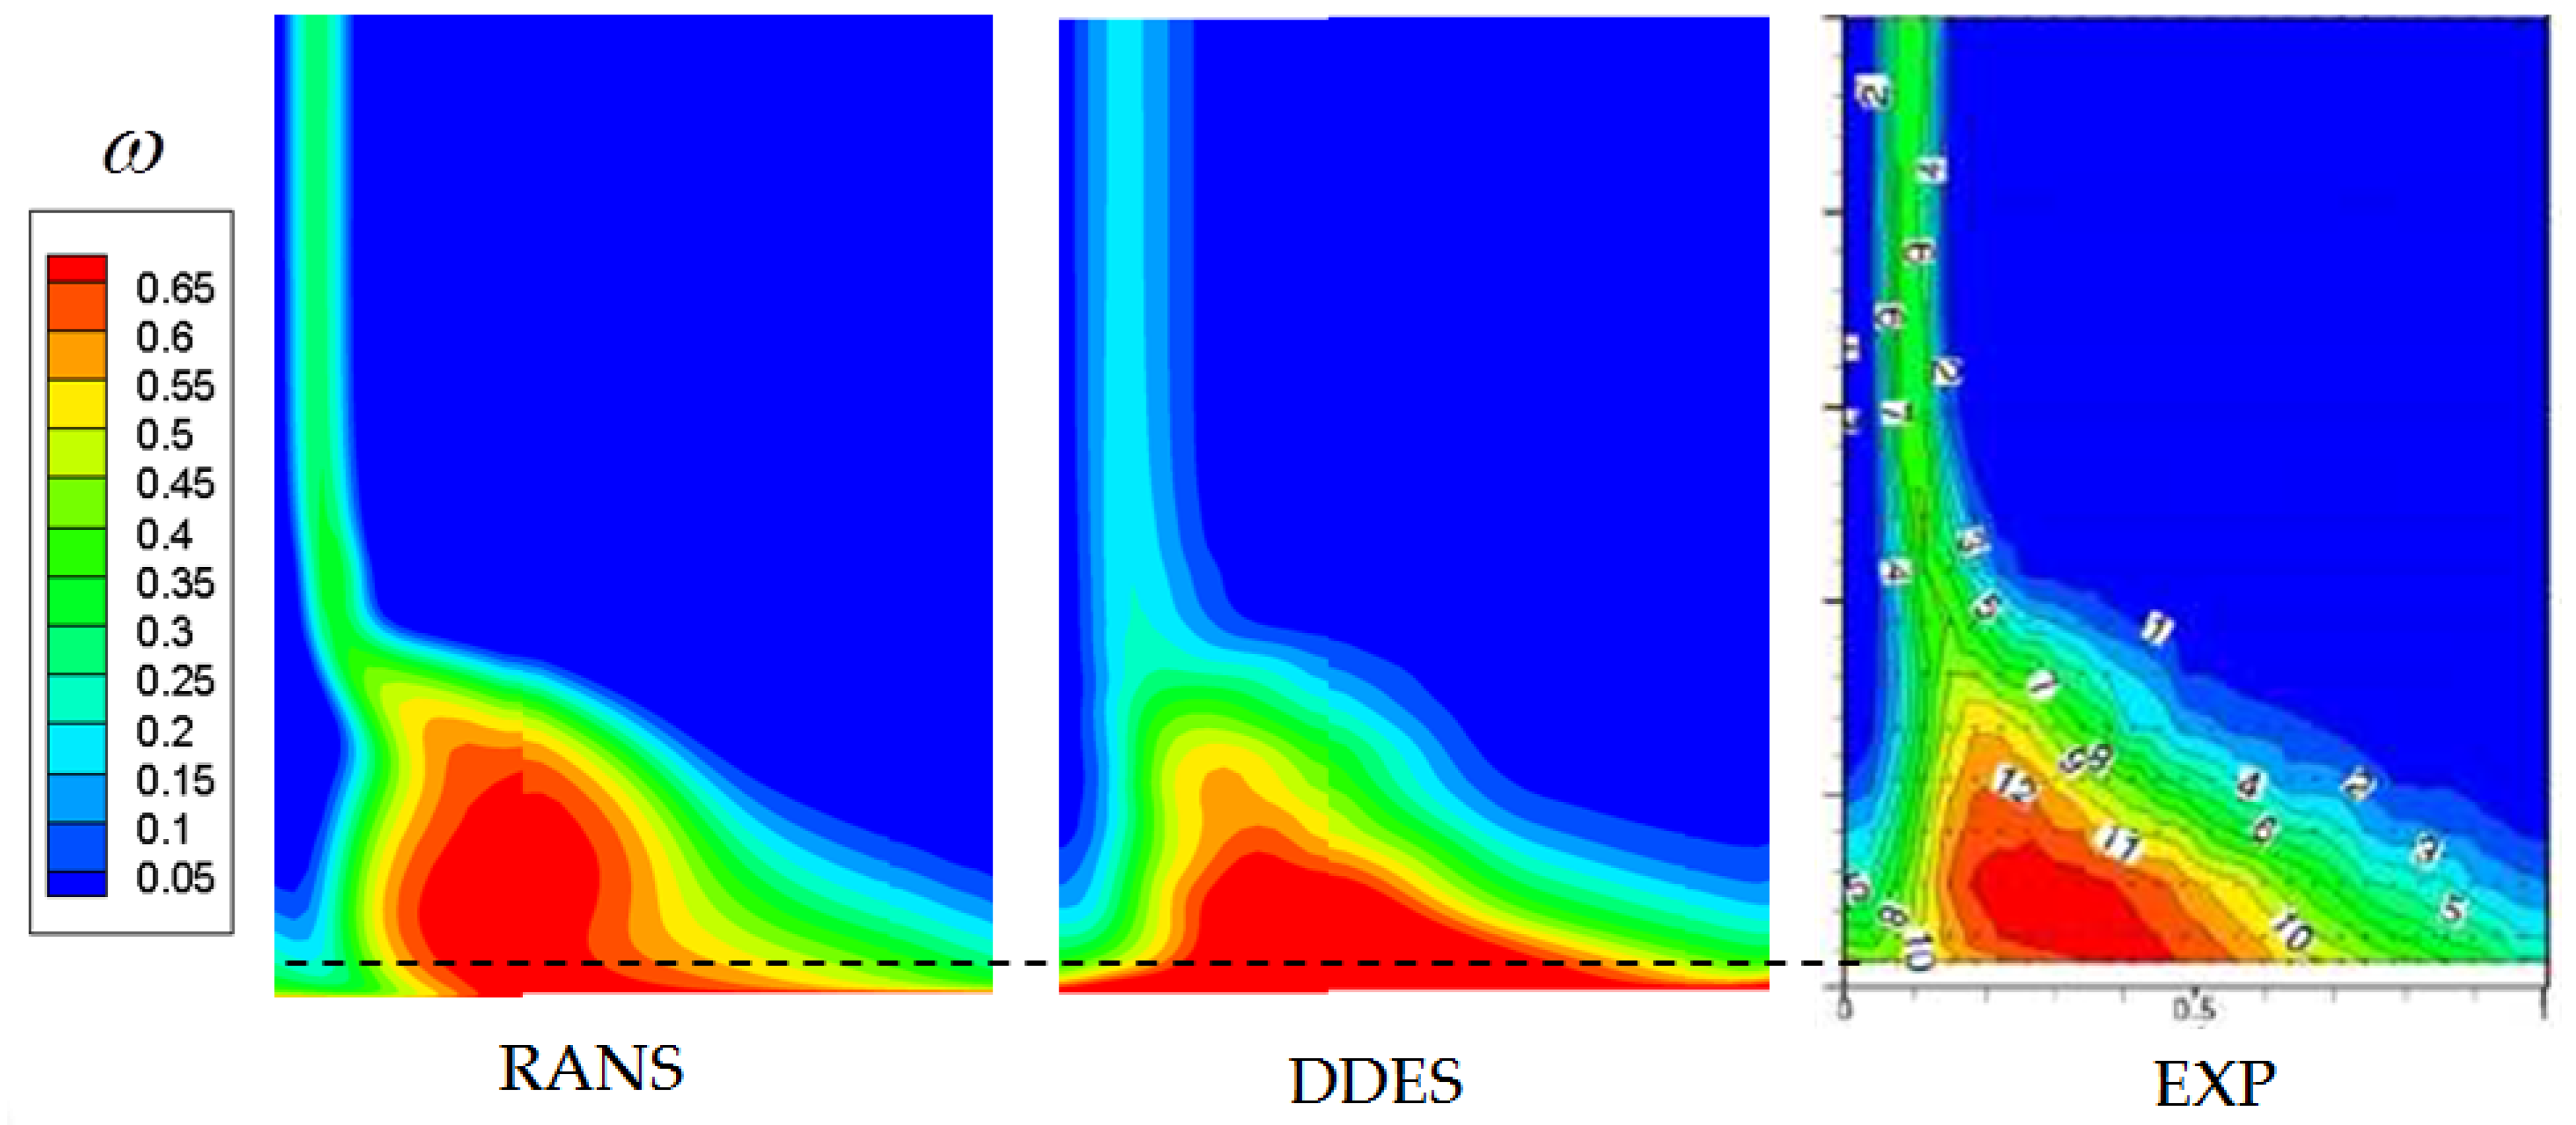
Figure 4.
The pitchwise-mass-averaged total pressure loss coefficient at axial chord downstream from the trailing edge: DDES and experiment results [6].
Figure 4.
The pitchwise-mass-averaged total pressure loss coefficient at axial chord downstream from the trailing edge: DDES and experiment results [6].
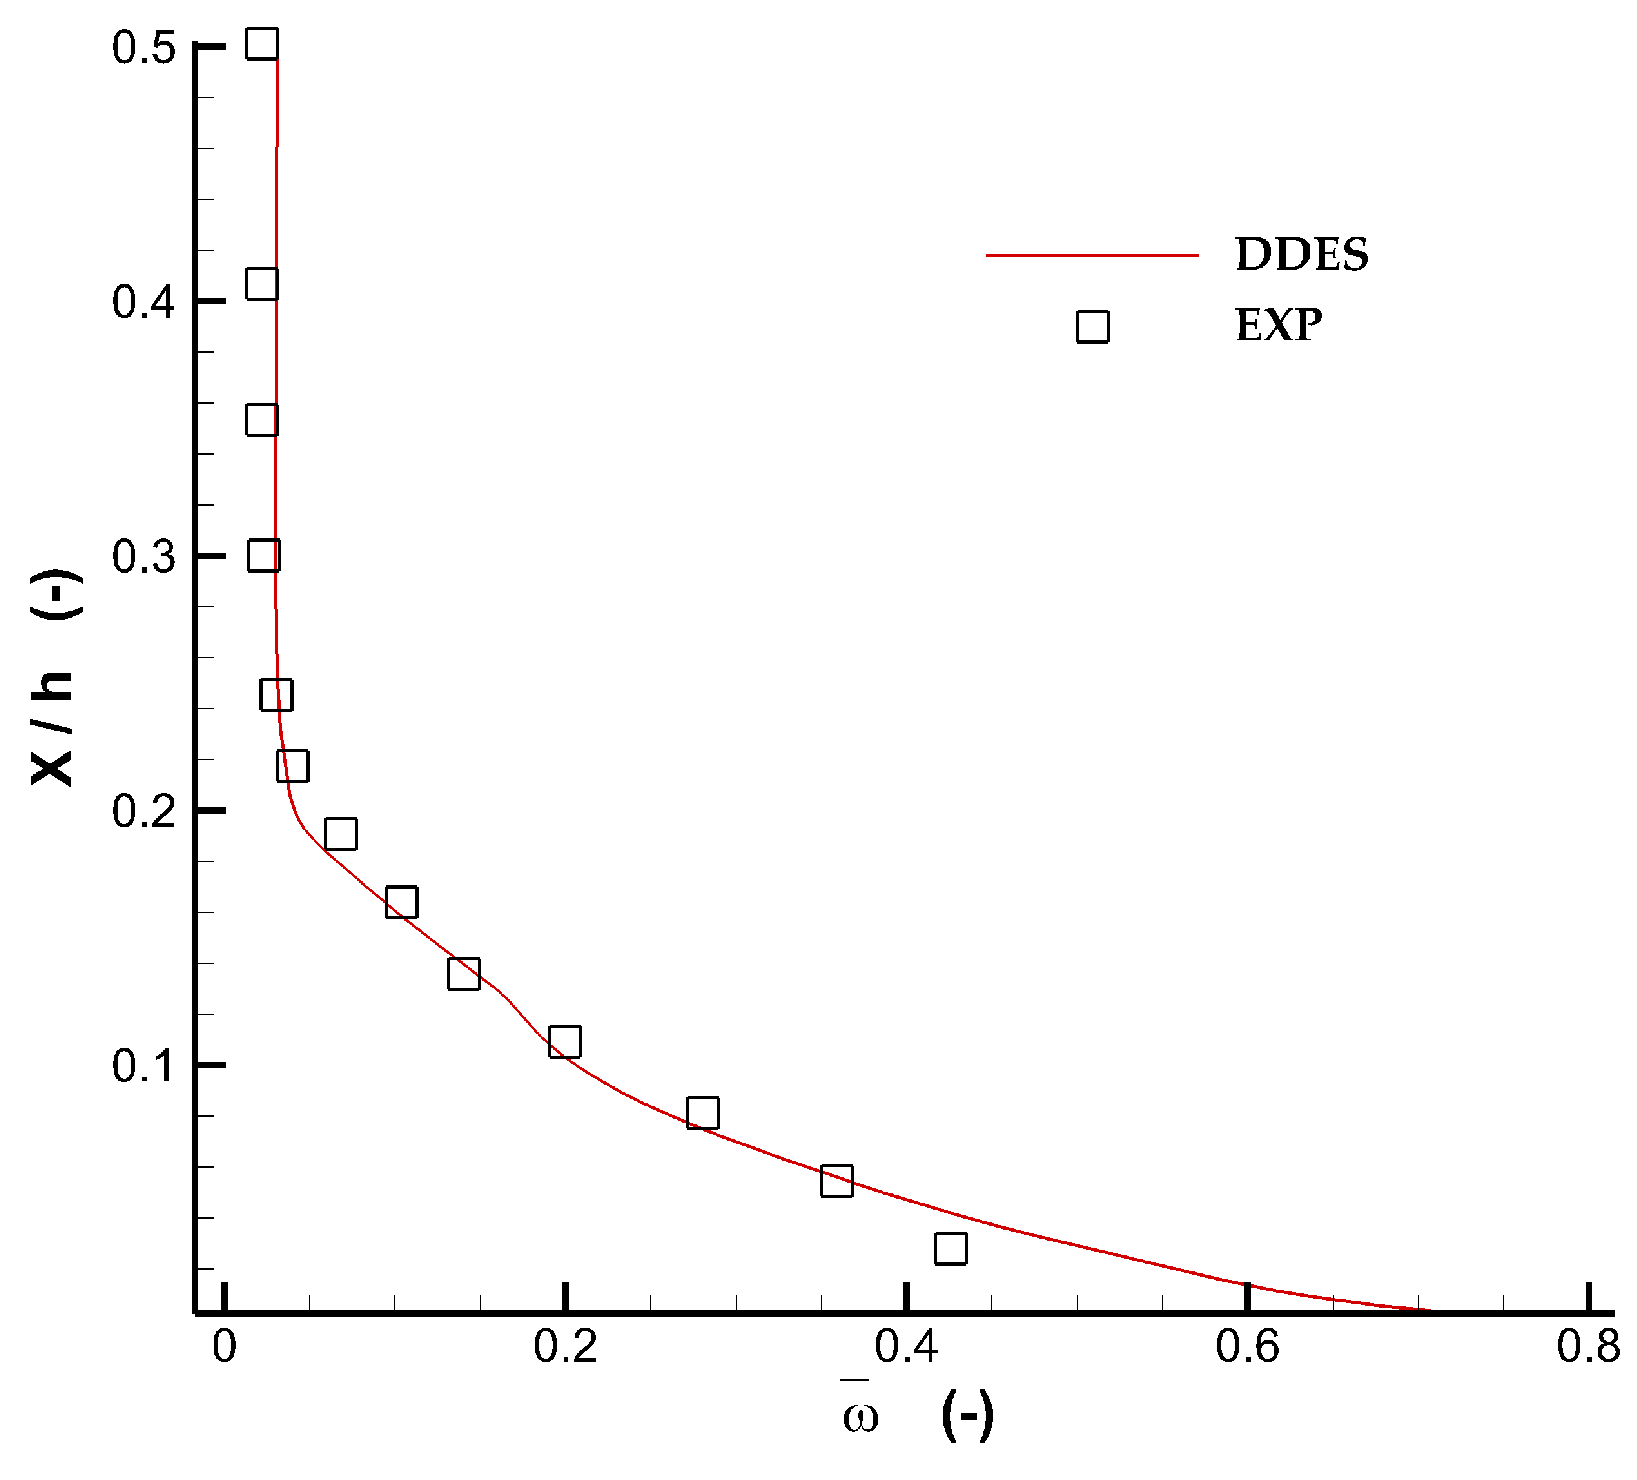
Figure 5.
The power spectral density of velocity fluctuations at a point near the trailing edge; Point A is at 5.4% span.
Figure 5.
The power spectral density of velocity fluctuations at a point near the trailing edge; Point A is at 5.4% span.

Figure 6.
Instantaneous three dimensional vortical structures represented by 50,000 isosurface.

Figure 7.
The development of corner separation, isosurface of 50,000 contoured with the Mach number. is the period of wake shedding vortices. (a) ; (b) ; (c) ; (d) .
Figure 7.
The development of corner separation, isosurface of 50,000 contoured with the Mach number. is the period of wake shedding vortices. (a) ; (b) ; (c) ; (d) .
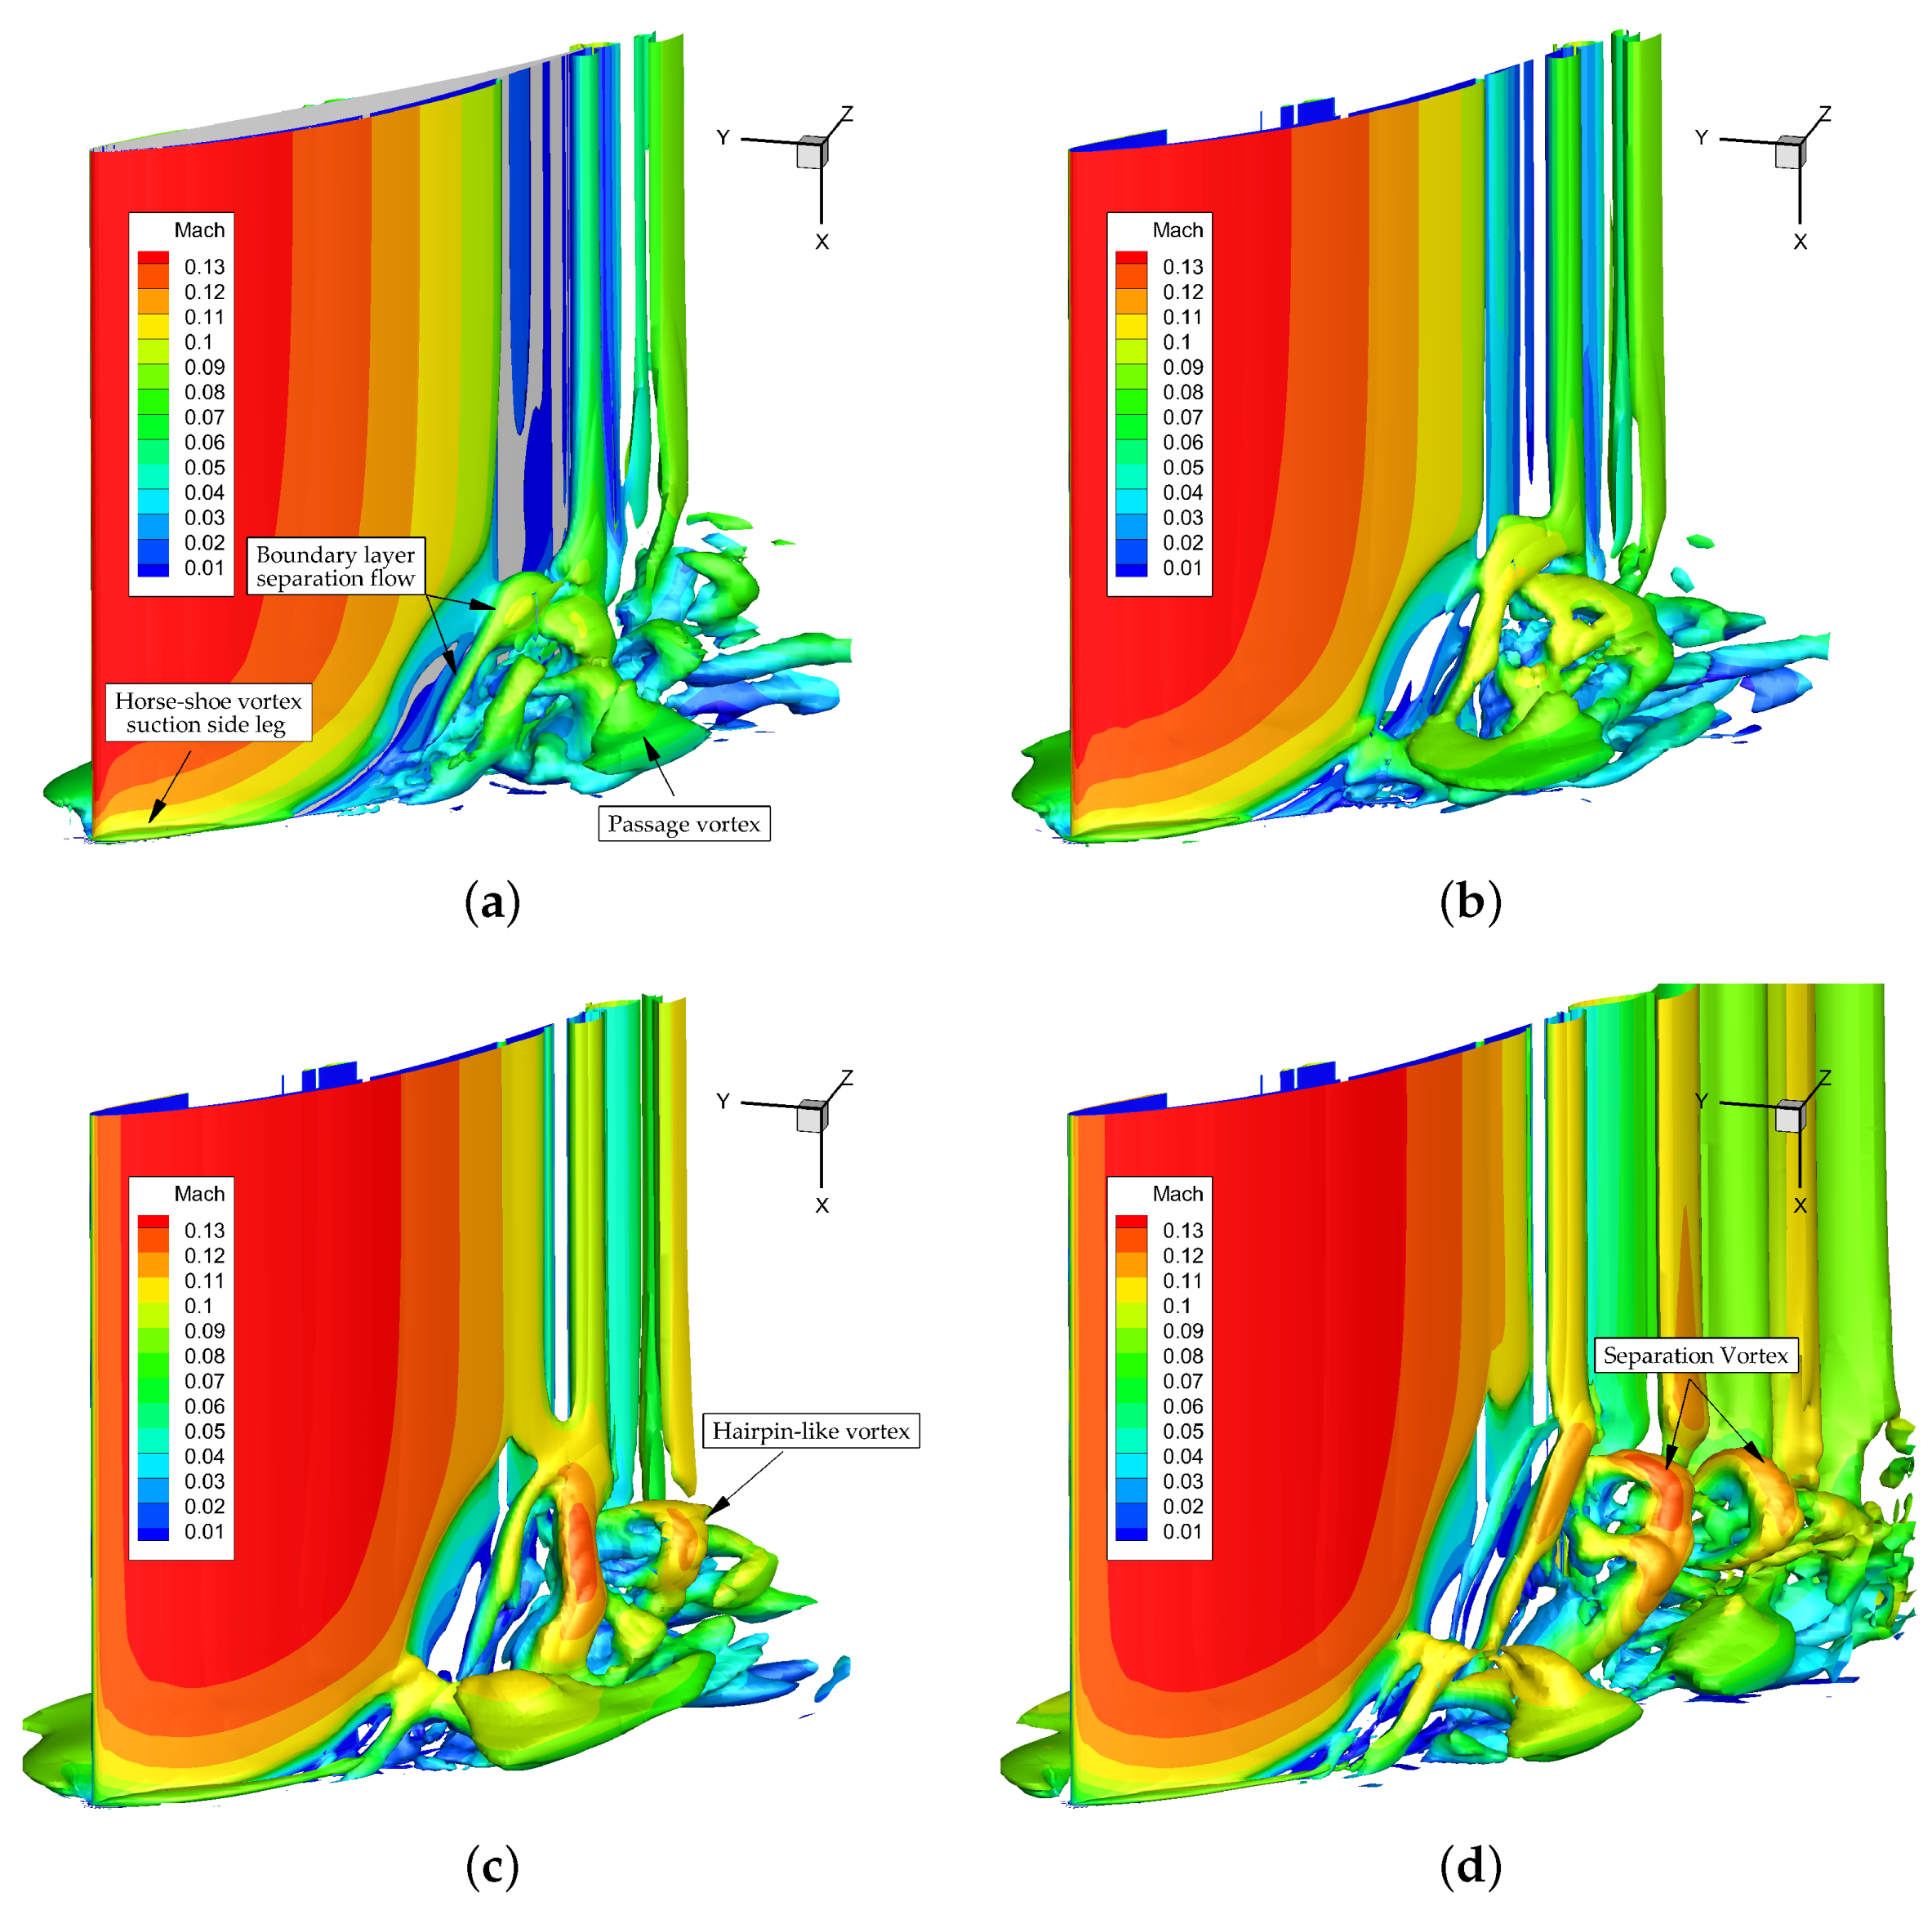
Figure 8.
The process of boundary layer separation flow developing in the hairpin-like vortex, isosurface of 4,000,000. (a) ; (b) ; (c) ; (d) .
Figure 8.
The process of boundary layer separation flow developing in the hairpin-like vortex, isosurface of 4,000,000. (a) ; (b) ; (c) ; (d) .

Figure 9.
Instantaneous skin friction lines during the corner separation. (a) ; (b) ; (c) ; (d) .
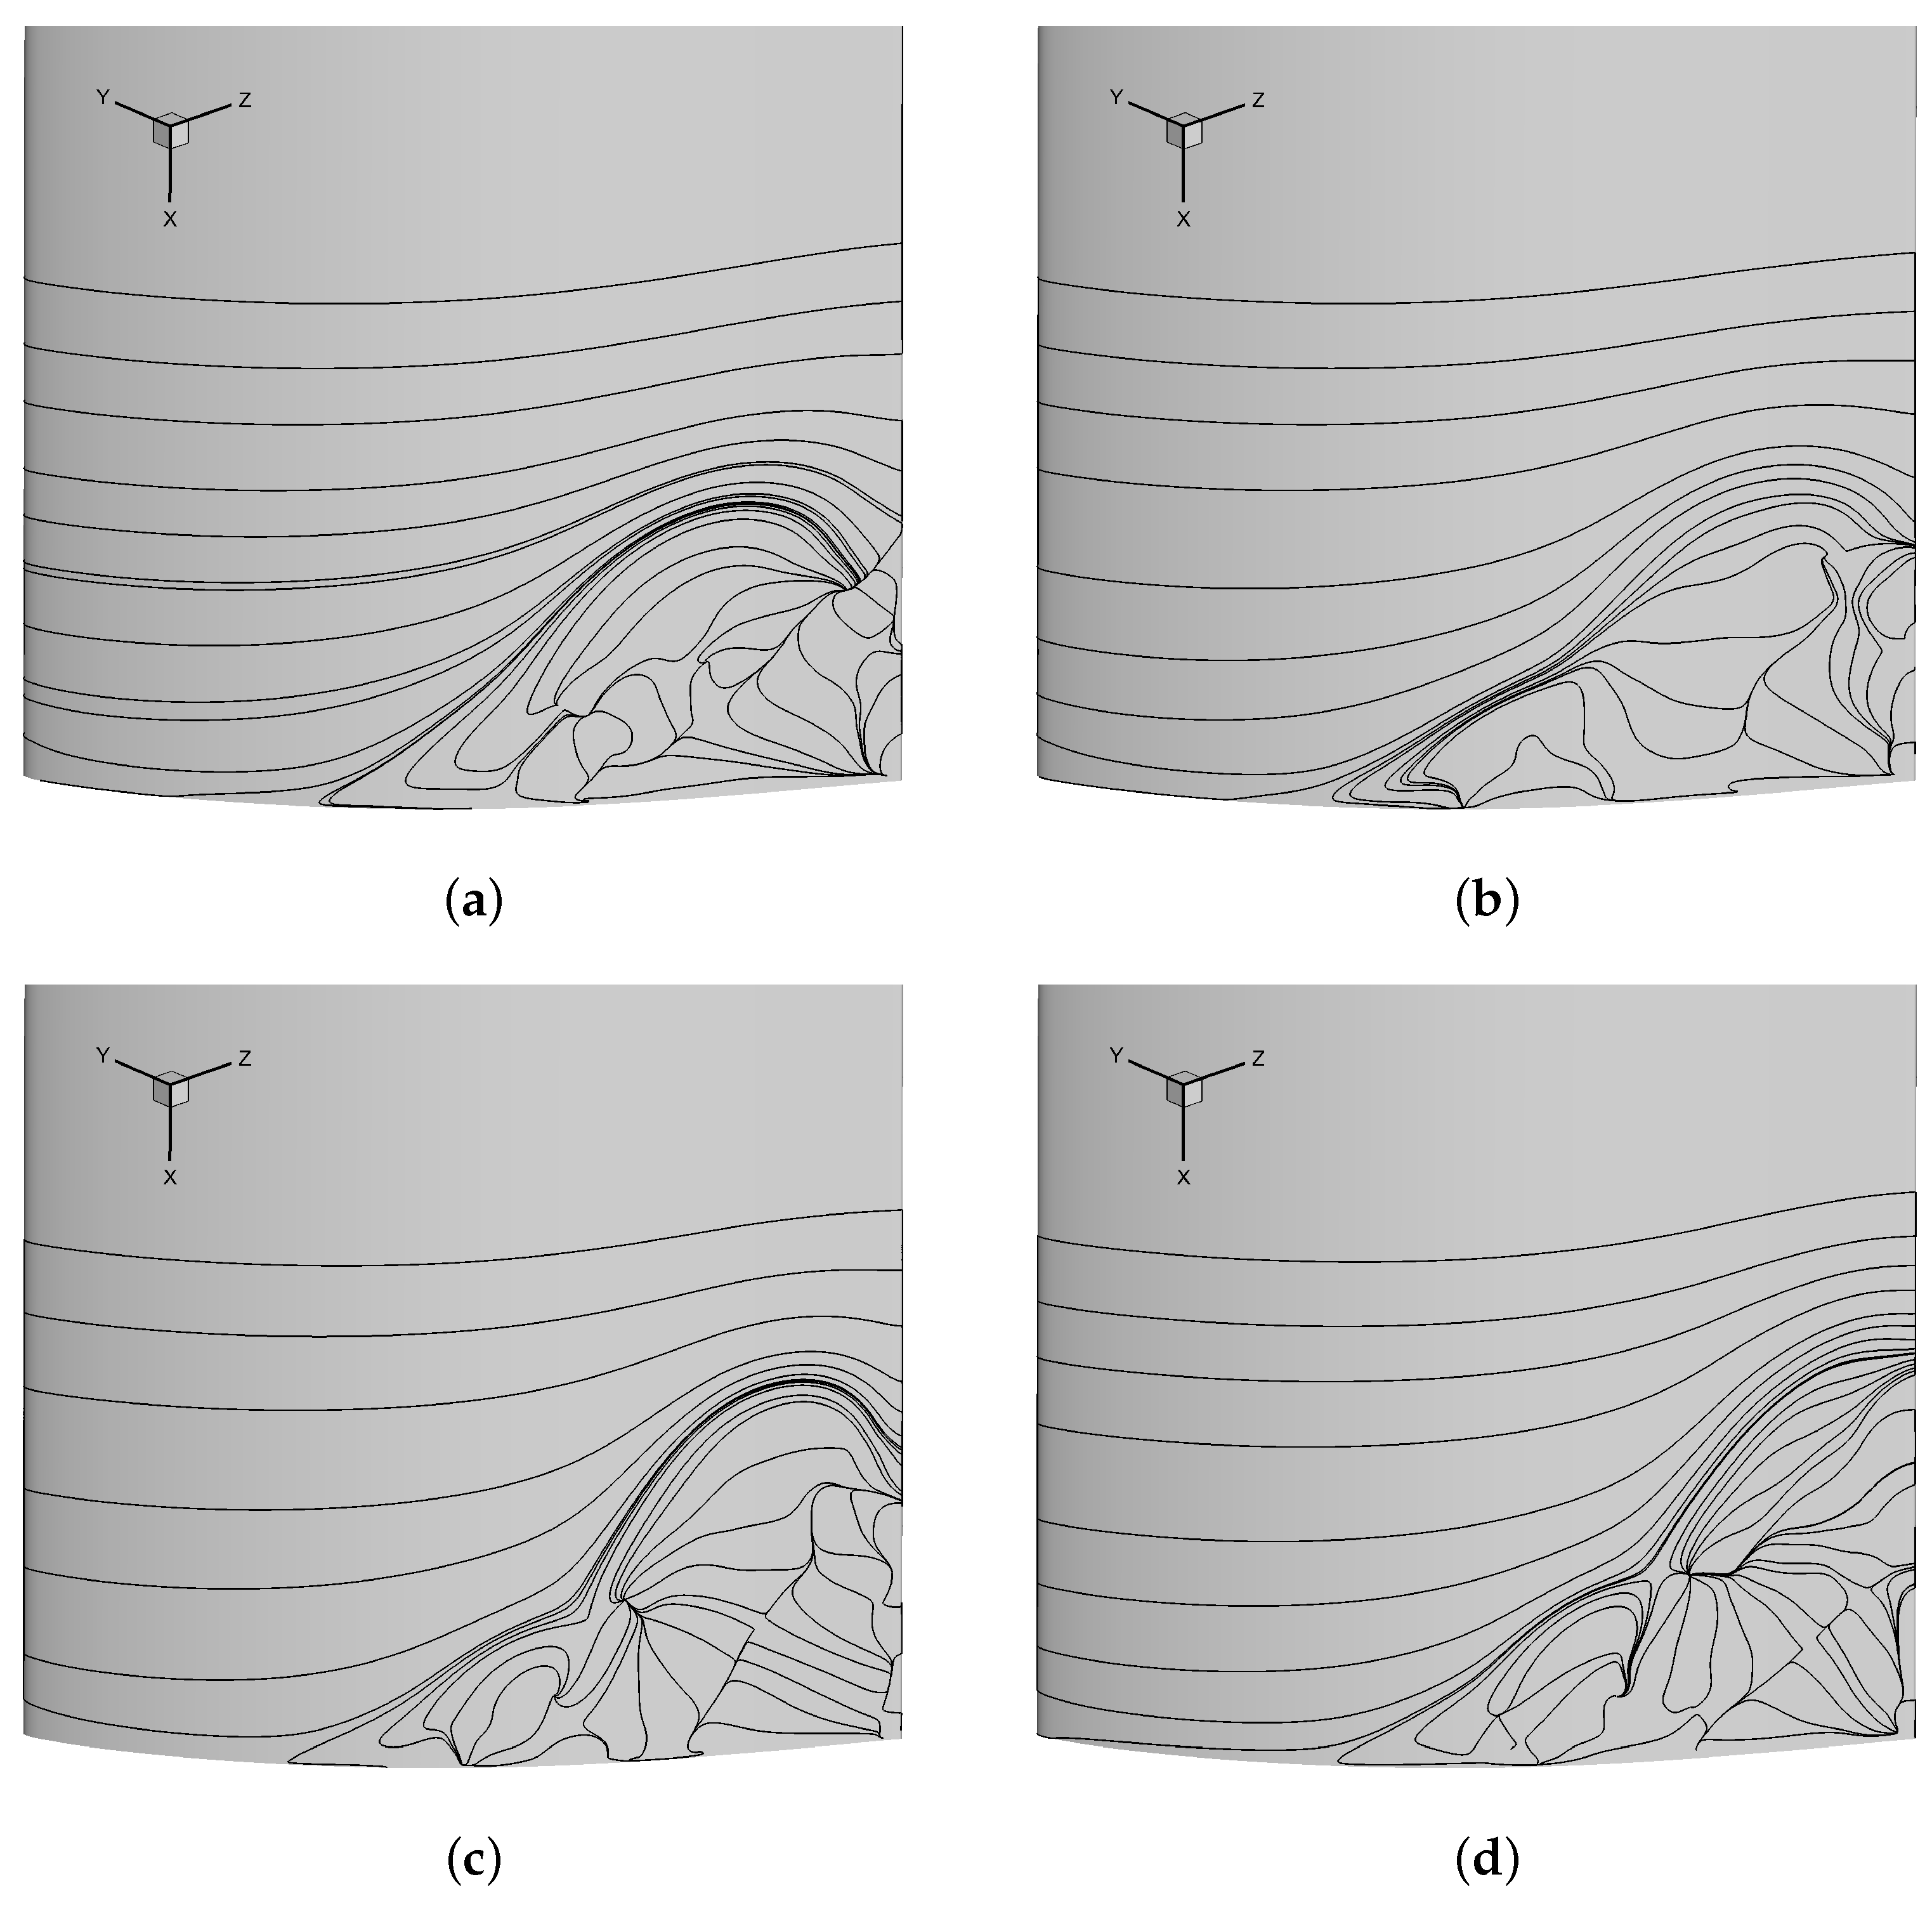
Figure 10.
The interaction between corner separation and wake vortices at three time instants before the hairpin-like vortex appears. (a) , suction side; (b) , suction side; (c) , suction side; (d) , pressure side; (e) , pressure side; (f) , pressure side.
Figure 10.
The interaction between corner separation and wake vortices at three time instants before the hairpin-like vortex appears. (a) , suction side; (b) , suction side; (c) , suction side; (d) , pressure side; (e) , pressure side; (f) , pressure side.

Figure 11.
The interaction between corner separation and wake vortices at three time instants after the hairpin-like vortex appears. (a) , suction side; (b) , suction side; (c) , suction side; (d) , pressure side; (e) , pressure side; (f) , pressure side.
Figure 11.
The interaction between corner separation and wake vortices at three time instants after the hairpin-like vortex appears. (a) , suction side; (b) , suction side; (c) , suction side; (d) , pressure side; (e) , pressure side; (f) , pressure side.
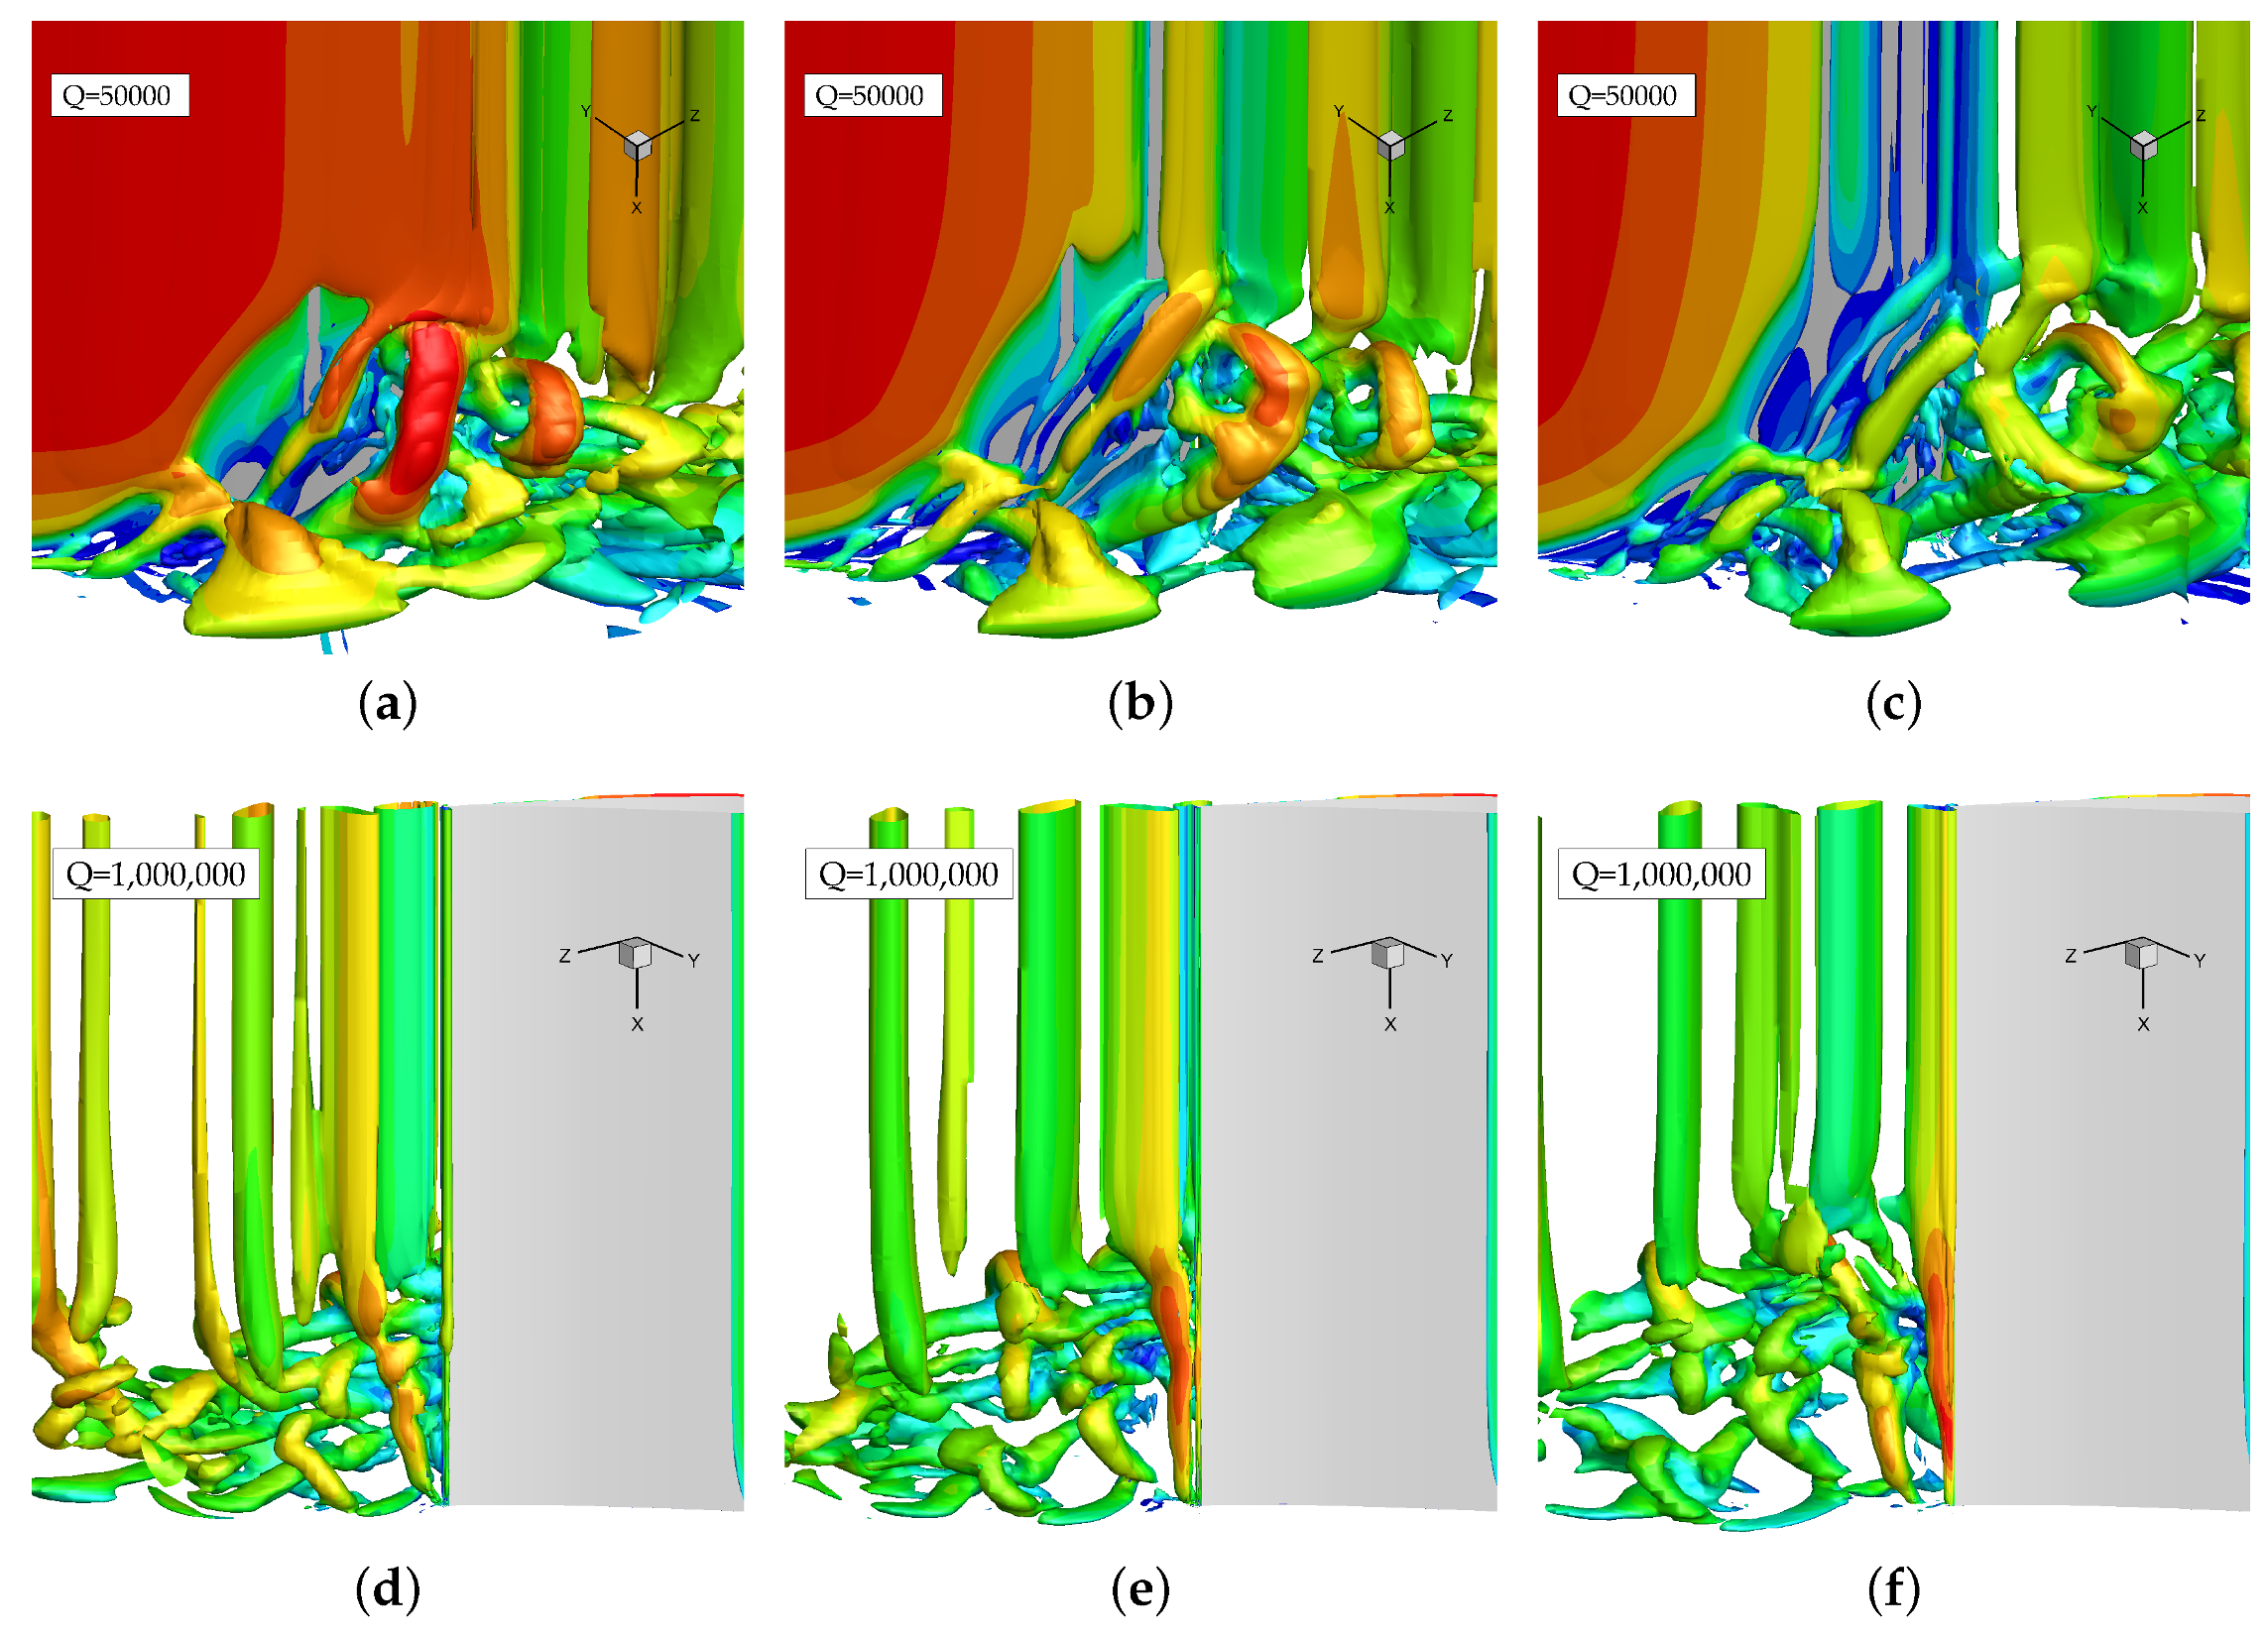
Figure 12.
Distributions of the normal Reynolds stress components at spanwise surface. (a) Contours of Reynolds stress ; (b) Contours of Reynolds stress ; (c) Contours of Reynolds stress ; (d) The rotated Cartesian coordinates.
Figure 12.
Distributions of the normal Reynolds stress components at spanwise surface. (a) Contours of Reynolds stress ; (b) Contours of Reynolds stress ; (c) Contours of Reynolds stress ; (d) The rotated Cartesian coordinates.
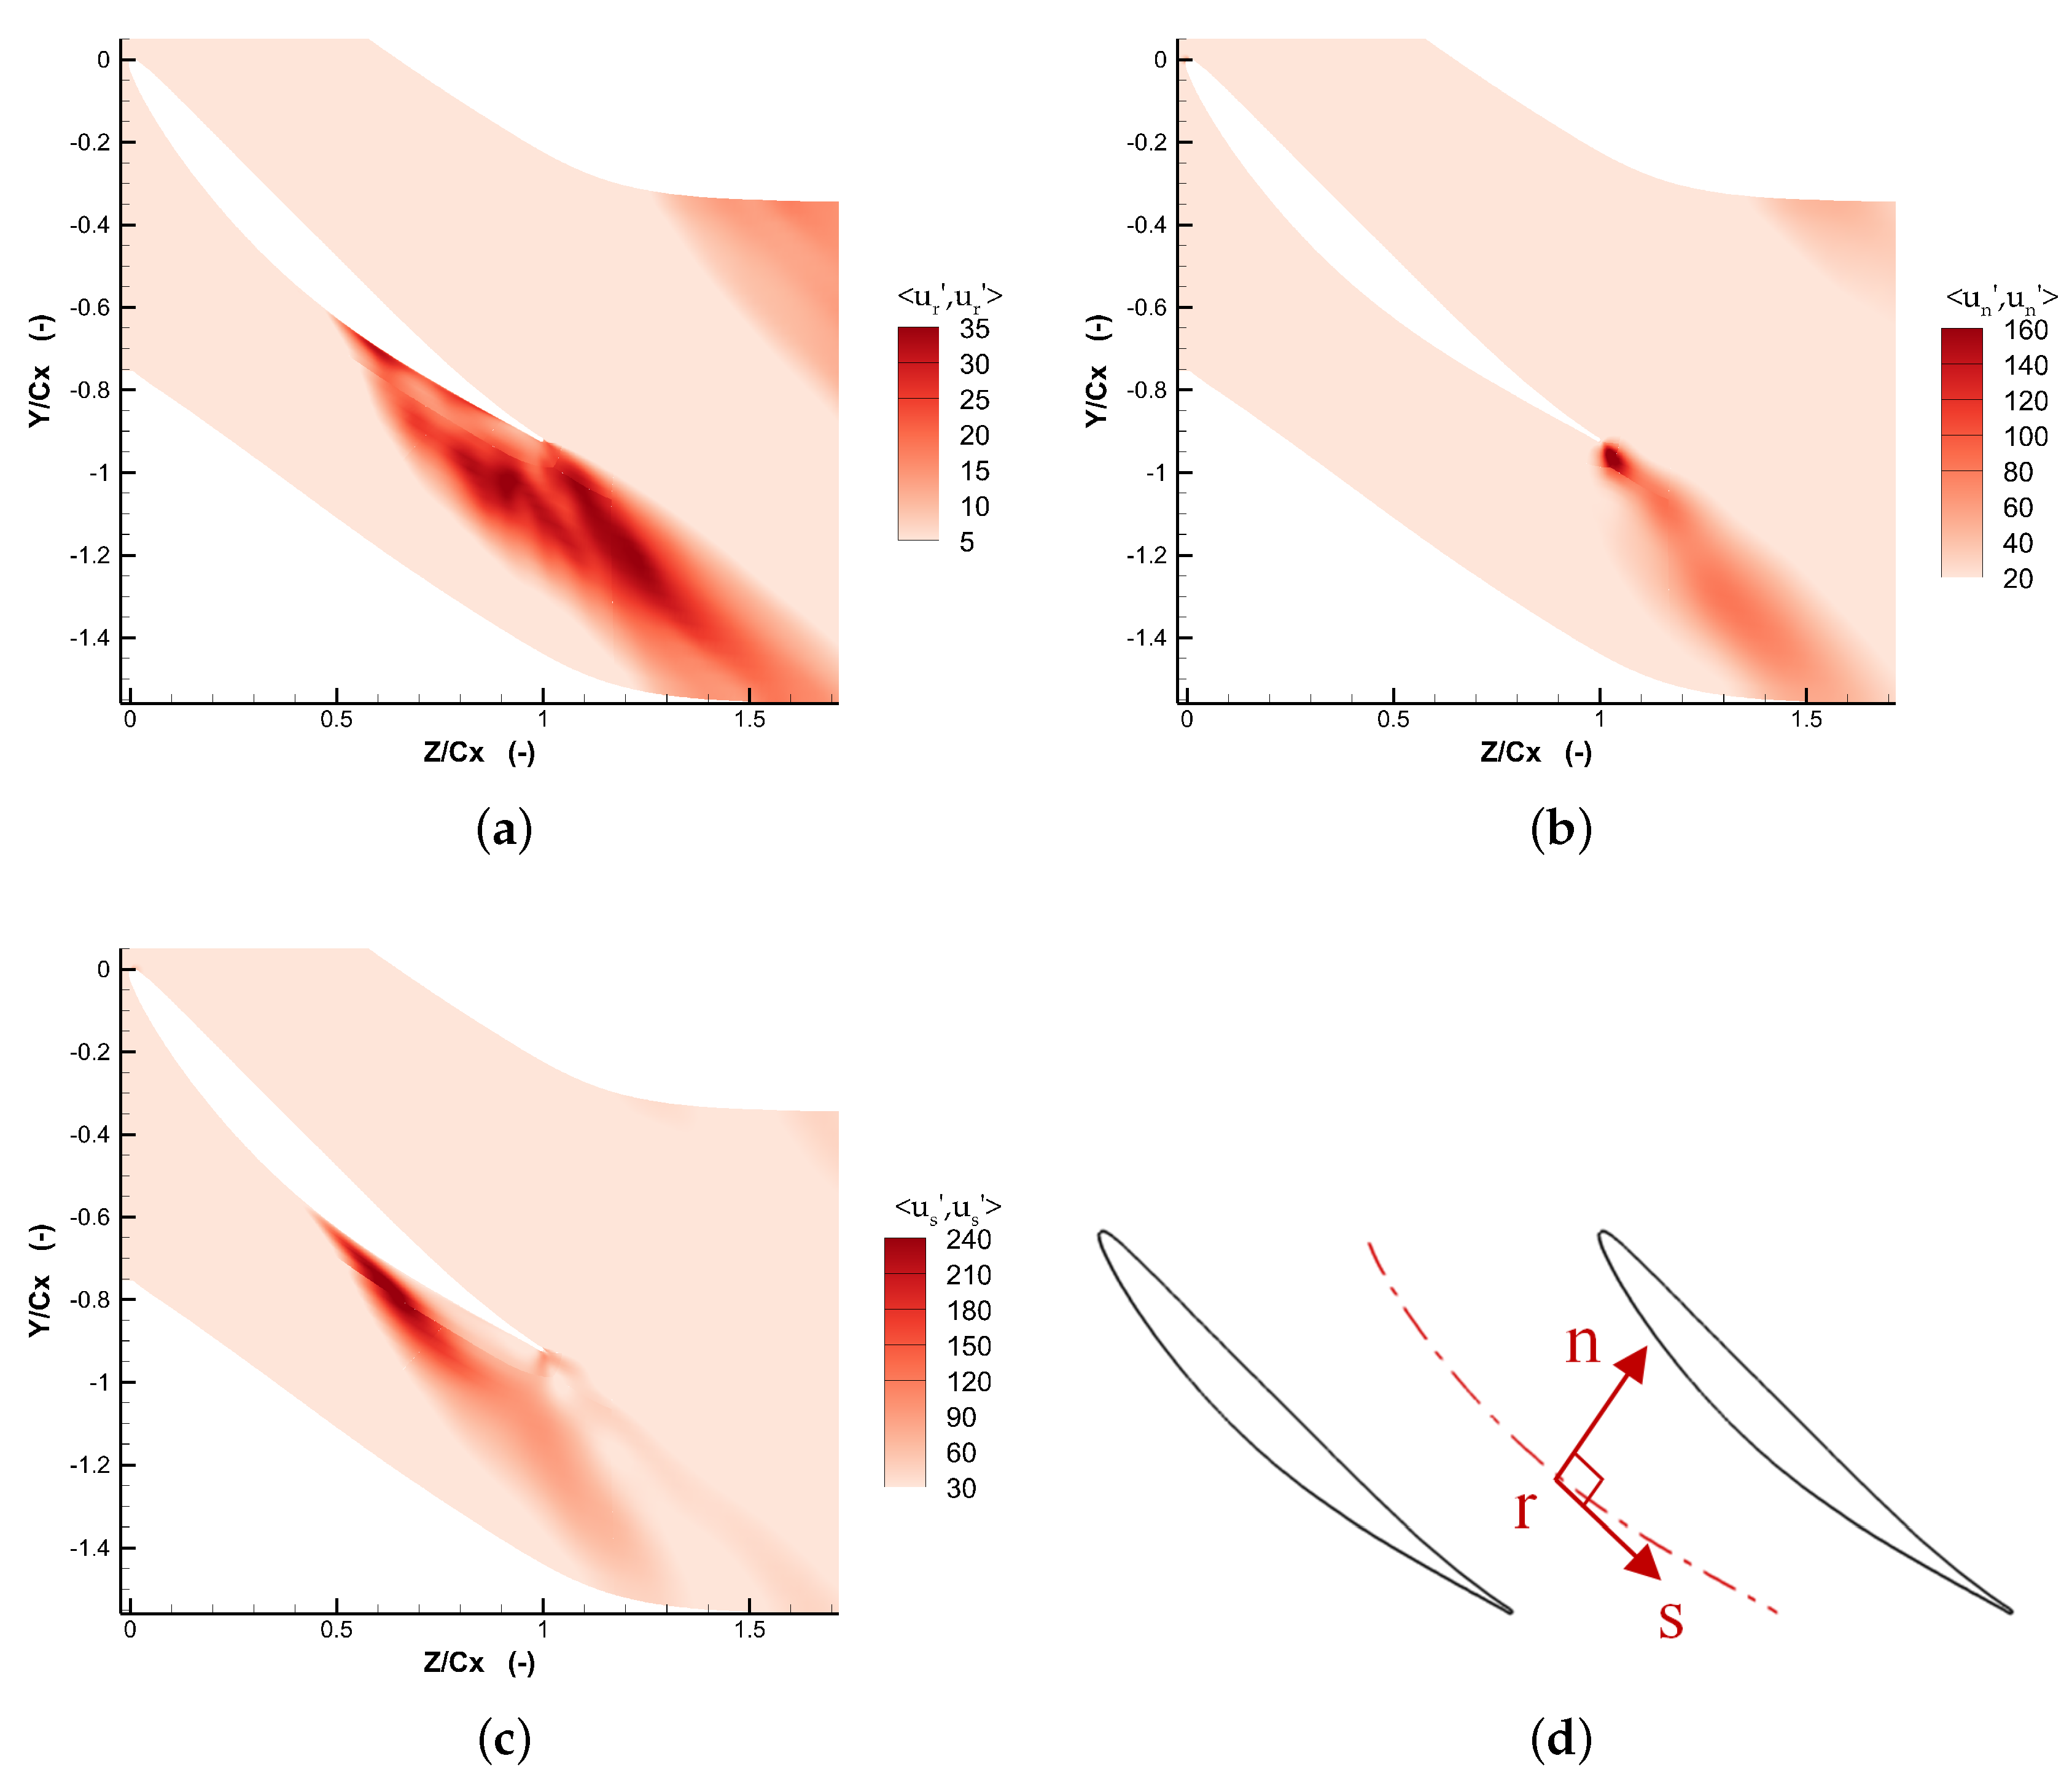
Figure 13.
Contours of the time-averaged dimensionless viscous entropy generation rate at three spanwise positions. (a) span; (b) span; (c) span.
Figure 13.
Contours of the time-averaged dimensionless viscous entropy generation rate at three spanwise positions. (a) span; (b) span; (c) span.
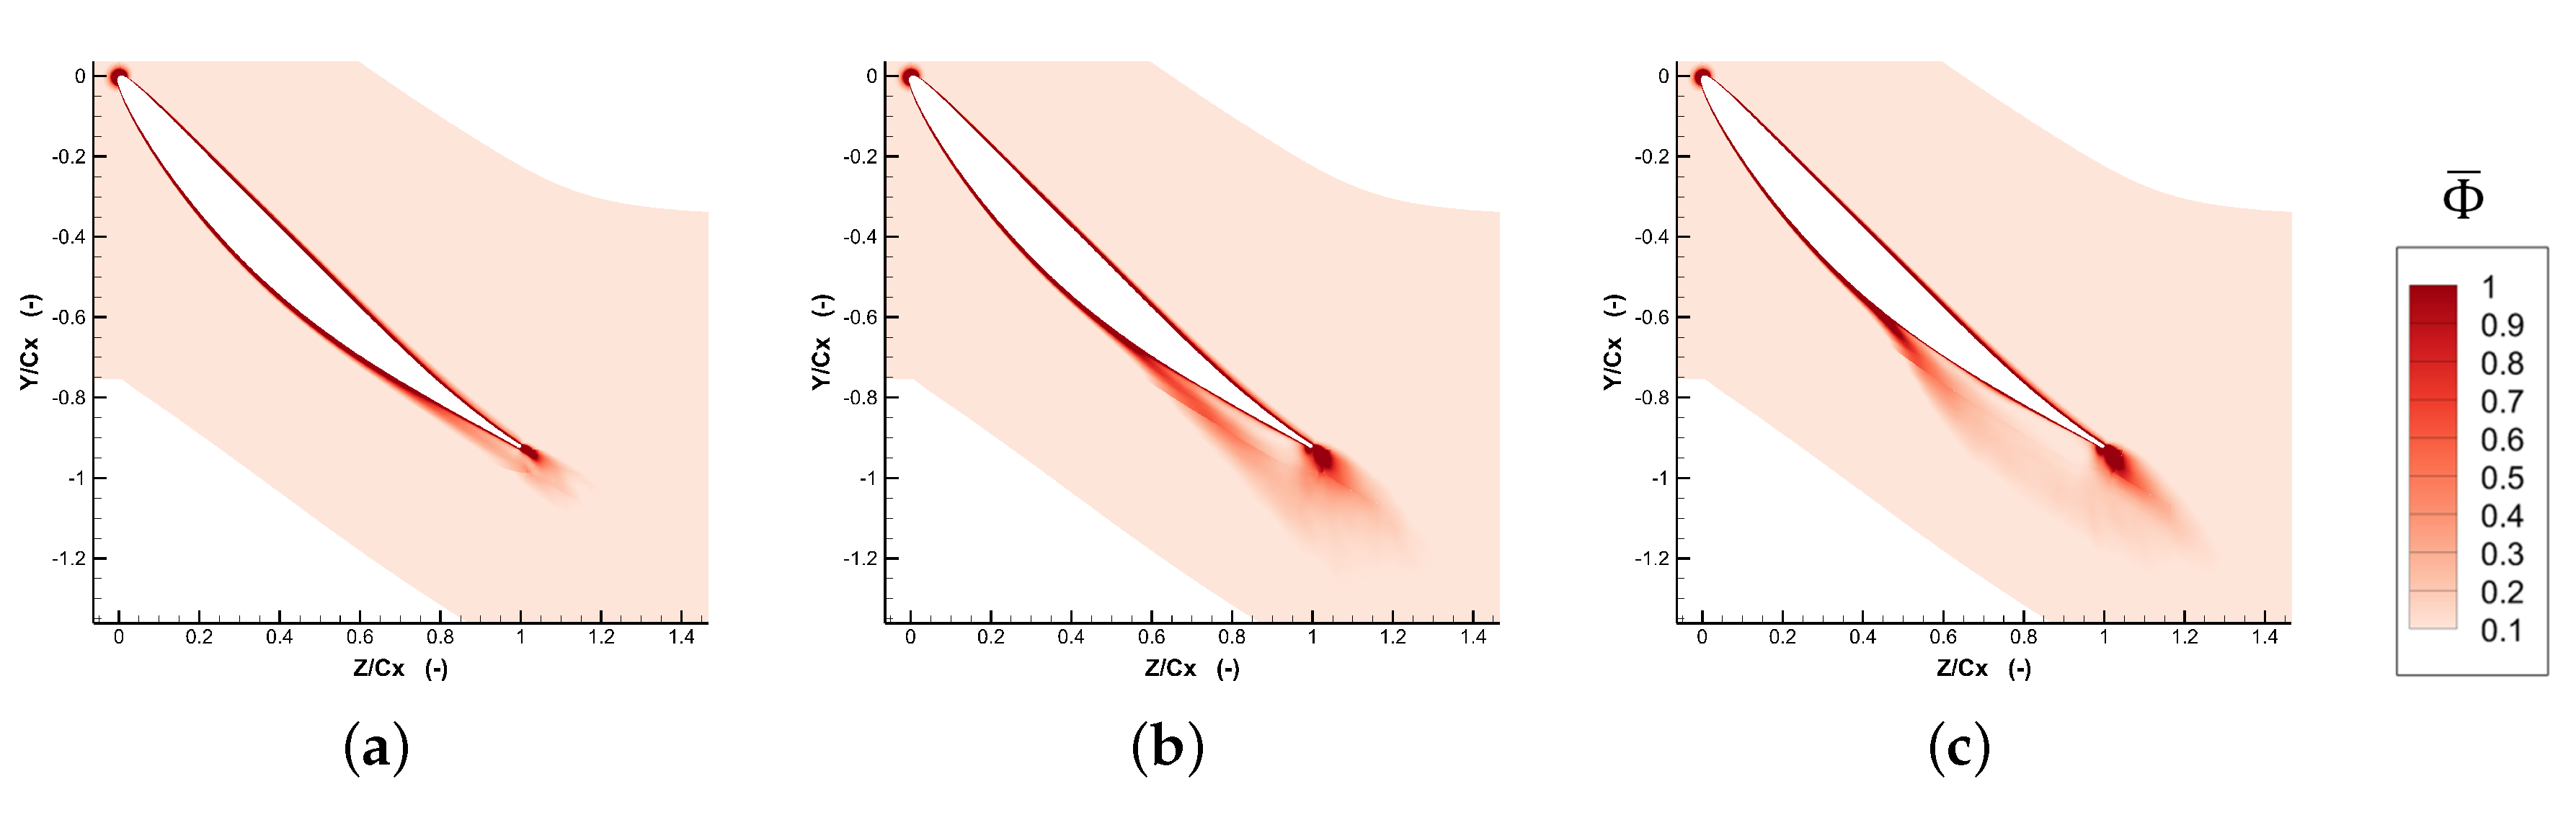
Figure 14.
Distribution of mass flow averaged entropy generate rate along the radial direction.

Figure 15.
The location of the slices –, – and –. The distributions of along five spanwise Lines A, B, C, D and E are extracted, and their positions are also given. Note that – and – slices are parallel to the cascade outlet. (a) Slice –; (b) Slice – and –.
Figure 15.
The location of the slices –, – and –. The distributions of along five spanwise Lines A, B, C, D and E are extracted, and their positions are also given. Note that – and – slices are parallel to the cascade outlet. (a) Slice –; (b) Slice – and –.
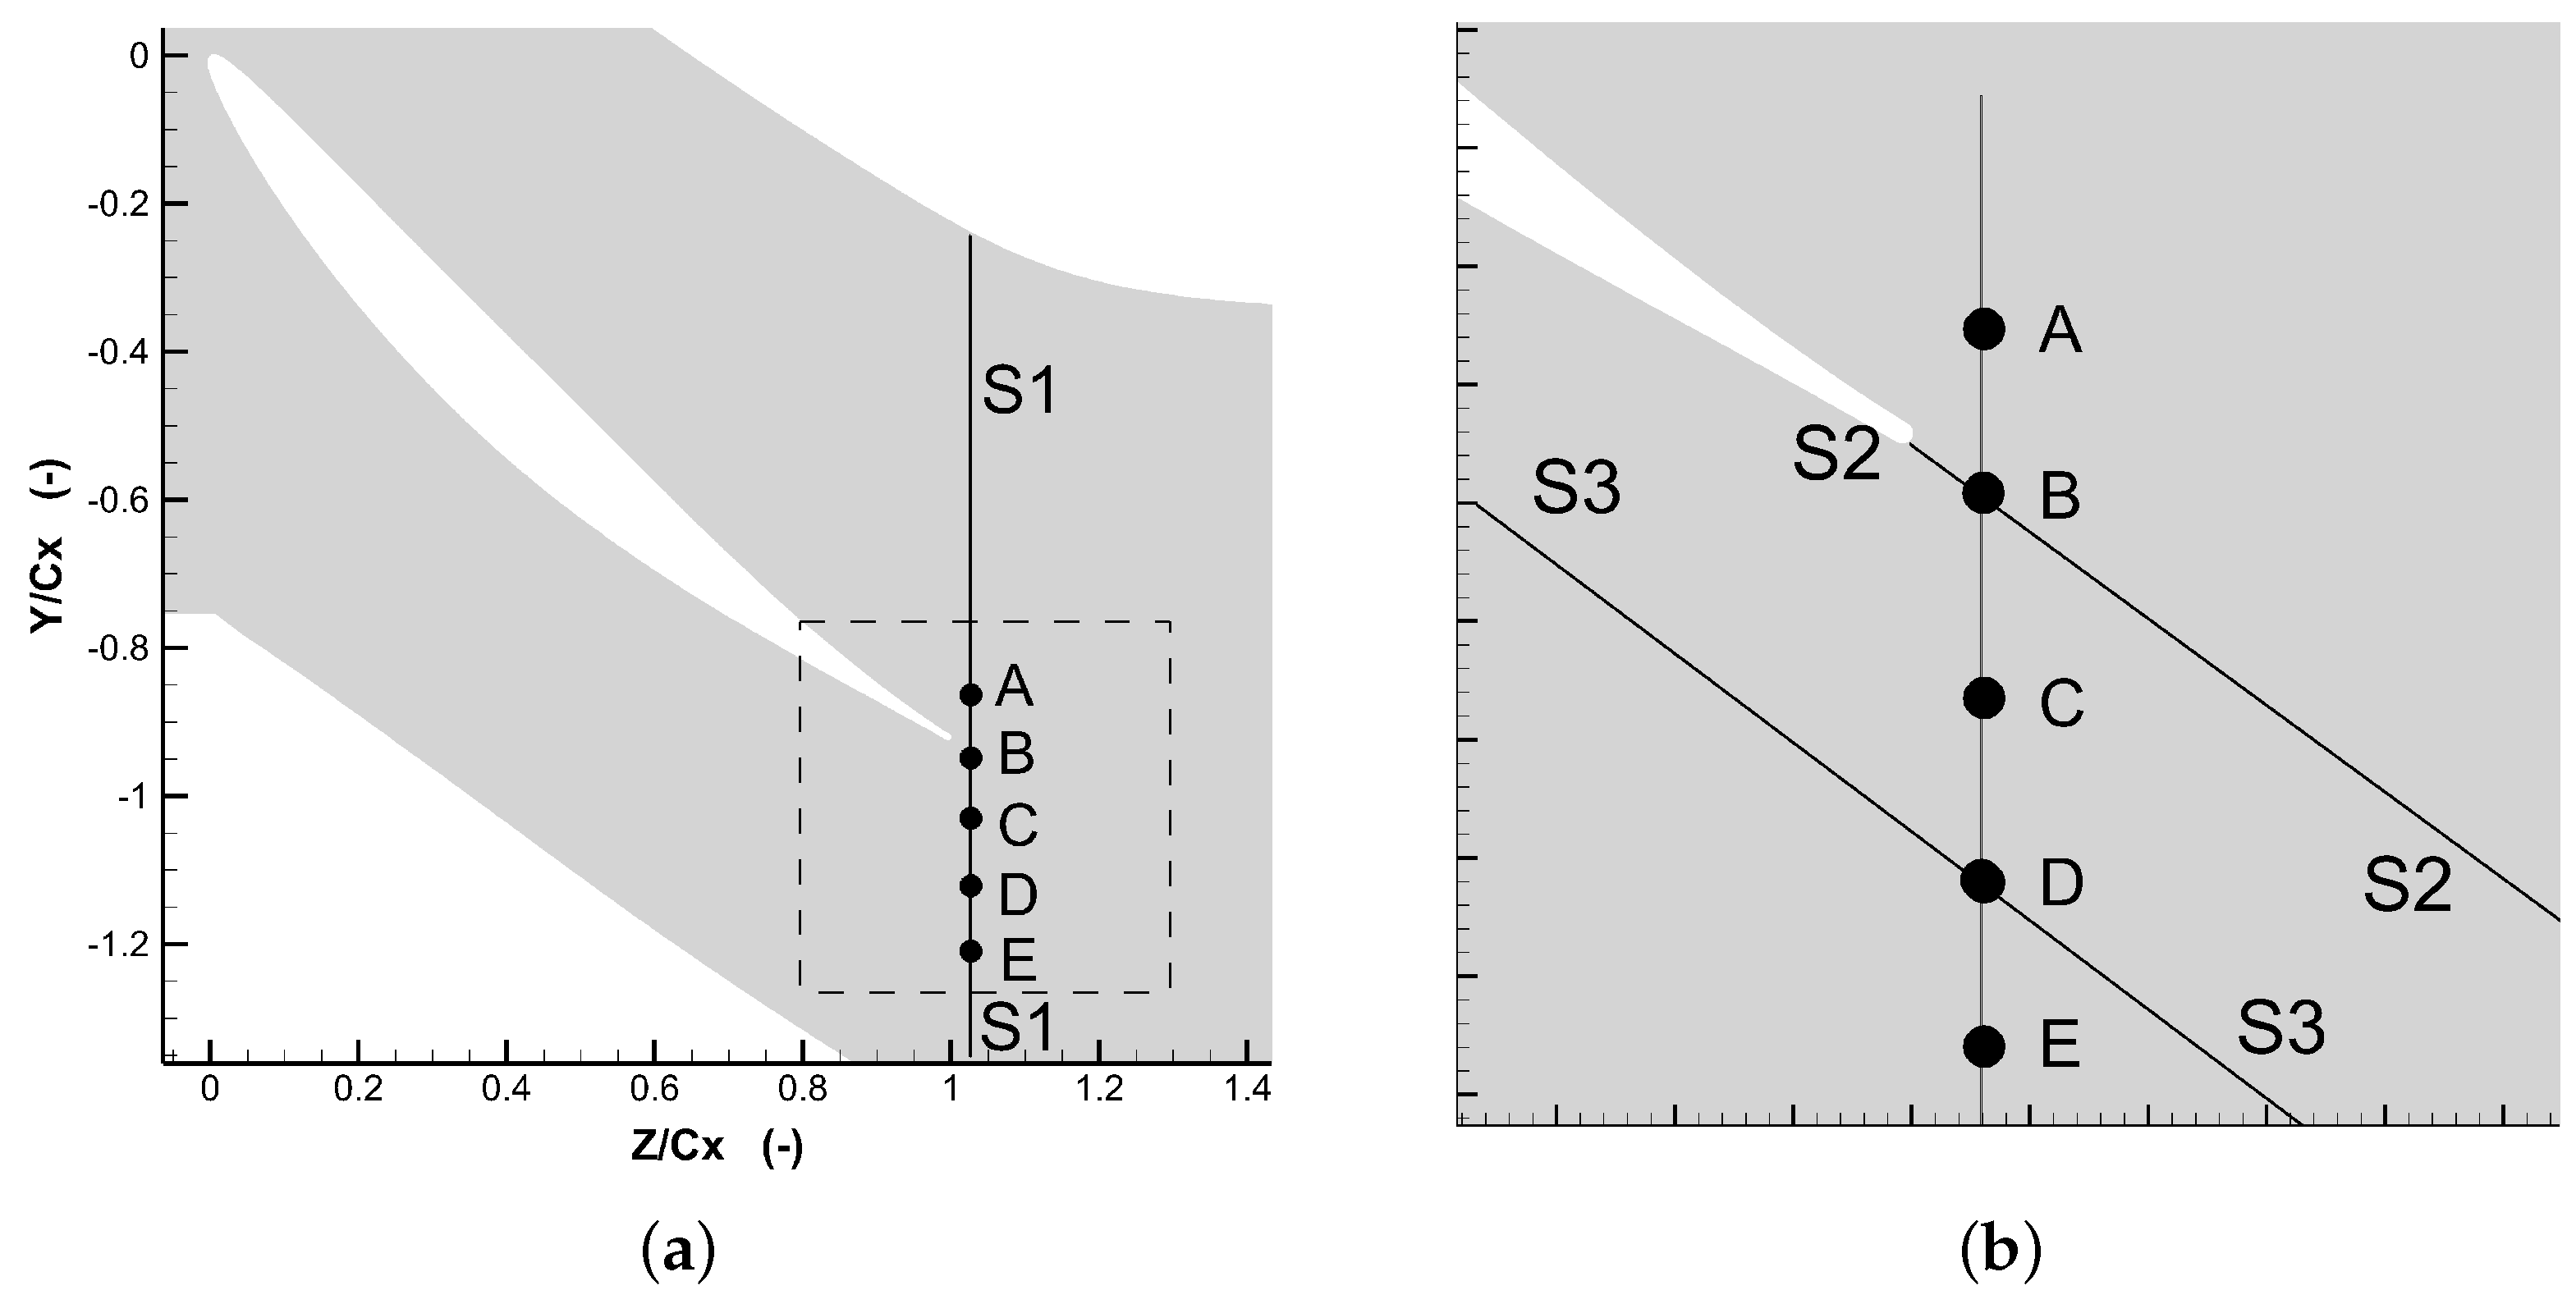
Figure 16.
The distribution of the time-averaged dimensionless viscous entropy generation rate on the slice –. (a) Distribution of on the – slice; (b) One-dimensional distributions of along five spanwise lines.
Figure 16.
The distribution of the time-averaged dimensionless viscous entropy generation rate on the slice –. (a) Distribution of on the – slice; (b) One-dimensional distributions of along five spanwise lines.
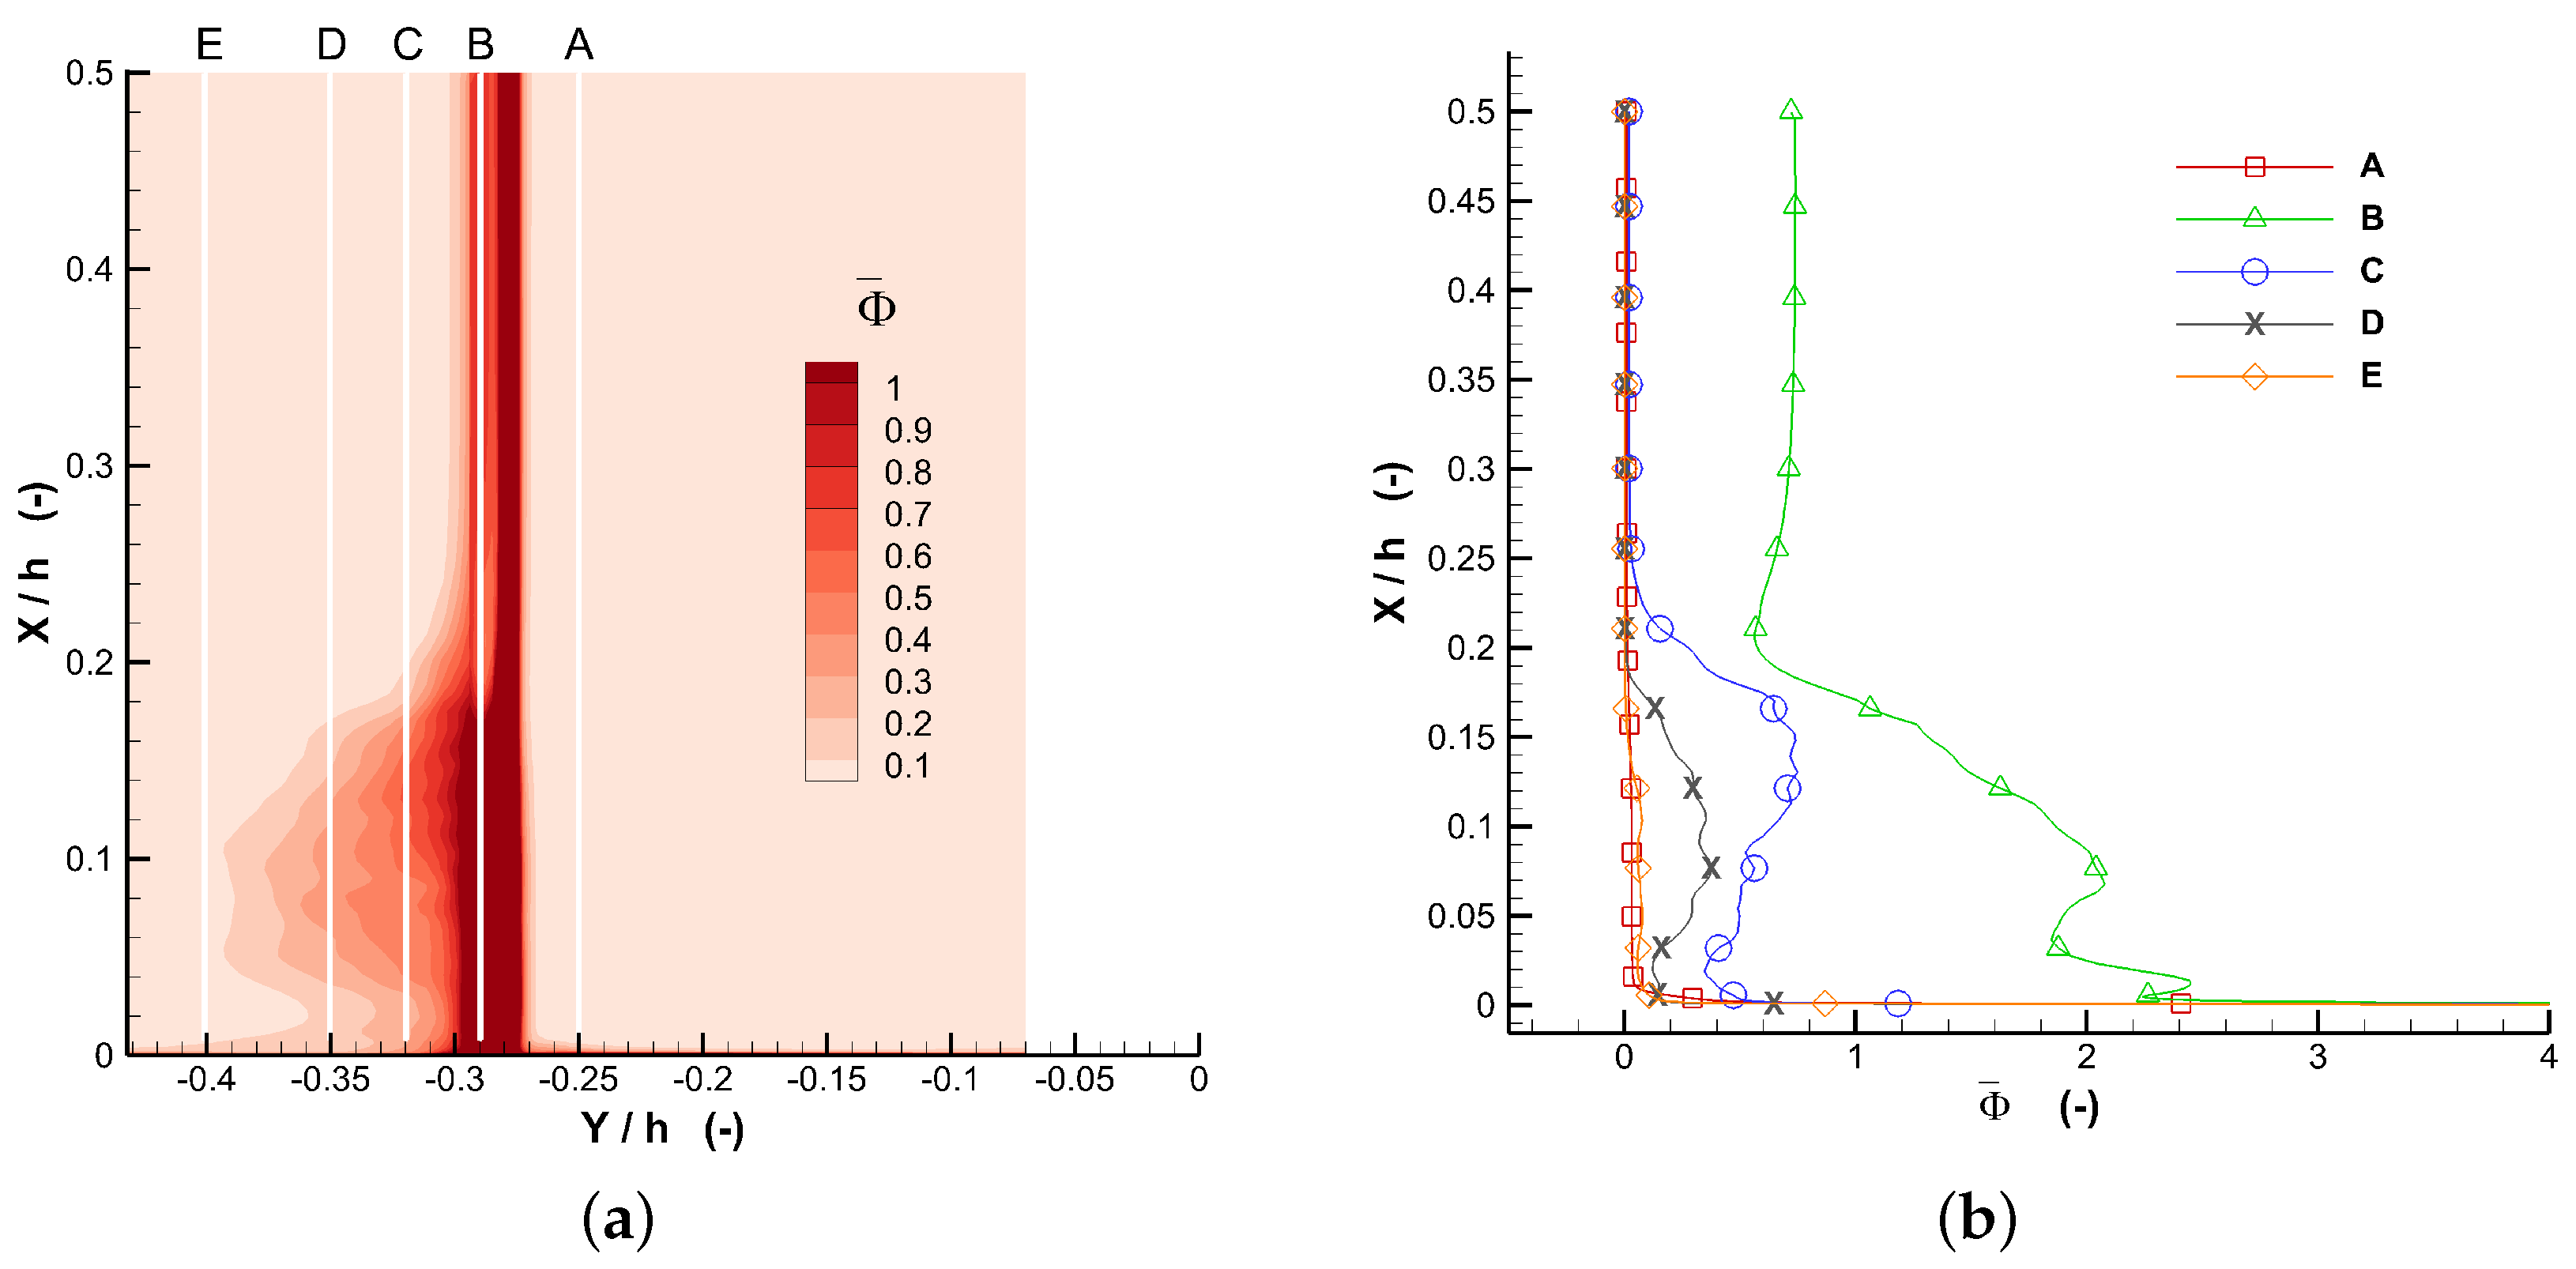
Figure 17.
Distributions of the instantaneous dimensionless viscous entropy generation rate at three time instants before the hairpin-like vortex appears. (a) , Slice –; (b) , Slice –; (c) , Slice –; (d) , Slice –; (e) , Slice –; (f) , Slice –.
Figure 17.
Distributions of the instantaneous dimensionless viscous entropy generation rate at three time instants before the hairpin-like vortex appears. (a) , Slice –; (b) , Slice –; (c) , Slice –; (d) , Slice –; (e) , Slice –; (f) , Slice –.

Figure 18.
The instantaneous dimensionless viscous entropy generation rate , after the hairpin-like vortex appears. (a) , Slice –; (b) , Slice –; (c) , Slice –; (d) , Slice –; (e) , Slice –; (f) , Slice –.
Figure 18.
The instantaneous dimensionless viscous entropy generation rate , after the hairpin-like vortex appears. (a) , Slice –; (b) , Slice –; (c) , Slice –; (d) , Slice –; (e) , Slice –; (f) , Slice –.

Table 1.
Geometrical and experimental parameters of the cascade.
| Parameter | Magnitude |
|---|---|
| Chord c (mm) | 150.0 |
| Pitch spacing s (mm) | 134.0 |
| Blade span h (mm) | 370.0 |
| Camber angle (degree) | |
| Stagger angle (degree) | |
| Design upstream flow angle (degree) | |
| Design downstream flow angle (degree) | |
| Incident angle i (degree) | 0 + 0.18 |
| Ma (-) | 0.1176 |
© 2017 by the authors. Licensee MDPI, Basel, Switzerland. This article is an open access article distributed under the terms and conditions of the Creative Commons Attribution (CC BY) license (http://creativecommons.org/licenses/by/4.0/).
Share and Cite
MDPI and ACS Style
Wang, H.; Lin, D.; Su, X.; Yuan, X. Entropy Analysis of the Interaction between the Corner Separation and Wakes in a Compressor Cascade. Entropy 2017, 19, 324. https://doi.org/10.3390/e19070324
AMA Style
Wang H, Lin D, Su X, Yuan X. Entropy Analysis of the Interaction between the Corner Separation and Wakes in a Compressor Cascade. Entropy. 2017; 19(7):324. https://doi.org/10.3390/e19070324
Chicago/Turabian StyleWang, Hao, Dun Lin, Xinrong Su, and Xin Yuan. 2017. "Entropy Analysis of the Interaction between the Corner Separation and Wakes in a Compressor Cascade" Entropy 19, no. 7: 324. https://doi.org/10.3390/e19070324
Note that from the first issue of 2016, this journal uses article numbers instead of page numbers. See further details here.