On Increased Arc Endurance of the Cu–Cr System Materials
by
 ,
,
Iosif S. Gershman
1,* ,
,
Eugeniy I. Gershman
1,
Alexander E. Mironov
1,
German S. Fox-Rabinovich
2 and
Stephen C. Veldhuis
2 1
Joint Stock Company Railway Research Institute, Moscow 107996, Russia
2
Department of Mechanical Engineering, McMaster University, Hamilton, ON L8S4L7, Canada
*
Author to whom correspondence should be addressed.
Entropy 2017, 19(8), 386; https://doi.org/10.3390/e19080386
Submission received: 4 July 2017
/
Revised: 22 July 2017
/
Accepted: 23 July 2017
/
Published: 27 July 2017
(This article belongs to the Special Issue Thermodynamics in Material Science)
Abstract
:The study deals with arc resistance of composite Cu–Cr system materials of various compositions. The microstructure of materials exposed to an electric arc was investigated. Despite varying initial chromium contents, the same structure was formed in the arc exposure zones of all the tested materials.
1. Introduction
Composites based on the Cu–W system are the main arc resistant material for arc-extinguishing contacts. Currently, tungsten content in arc resistant materials is as high as 80–90%. Tungsten is used in arc resistant materials due to its high melting point (3422 °C). Copper acts as a conducting and binding material in such composites. However, lately, a composite material based on the Cu–Cr system has been frequently used in arc-extinguishing contacts [1]. Composition of these materials ranges from 20 to 70% Cr [2]. The most common is the CuCr50 material containing 50% Cr. Since the melting point of chromium (1857 °C) is considerably lower than that of tungsten, it would be interesting to find out what happens when the Cu–Cr system materials are exposed to the electric arc. There is some analogy with high-entropic alloys. However, alloys of the Cu–Cr system do not belong to highly entropic alloys, since they contain only two elements and do not form a single solid solution [3].
There are plenty of papers dedicated to studies of the Cu–Cr system materials [4,5,6,7,8,9,10]. The data regarding arc resistance of these materials are rather contradictory. This is connected with the different testing conditions and with the fact that the materials tested were produced using different production processes. Many studies point out that early fusion of electrode surface helps to increase wear resistance and arc. Fusion can be artificial (for example, by means of electronic beams) [11] or natural (for example, resulting from flow of pre-breakdown current) [12,13]. The study [2] mentions self-organization processes during melting of surface layers. This self-organization is connected in [2] with the fact that adaptation of contact surface takes place, since melting promotes increasing wear resistance. The microstructure of the Cu–Cr system material after such melting complies with the phase diagram includes the formation of fine-dispersed chromium particles is observed on the contact surface [2]. The self-organization results in considerable decreasing of wear intensity [14]: for example, in the case of friction, this study will attempt to understand the self-organization mechanisms that take place during initial fusion of contacts made of the Cu–Cr system material.
2. Experimental
The Cu–Cr system materials of the following compositions were exposed to the influence of the electric arc: Cu–30%Cr; Cu–40%Cr; Cu–45%Cr; Cu–50%Cr. For preparation of mixtures, chromium powder (max. particle size—125 µm, min. chromium content—99.2%) and copper powder (max. particle size—100 µm, min. copper content—99.5%) were used.
The powders were mixed by means of mechanical alloying in a planetary high-energy mill. The drum is charged with 250 g of the powder mix and quasi-cylindrical grinding media (the mass ratio between the grinding media and the powder is 4:1). The processing takes place in argon atmosphere and lasts 1 h.
The resulting mixture was subjected to cold compacting at the pressure of 200 MPa during 2 min to achieve the density that would be equal to min. 70% of theoretical density. Agglomeration was carried out by passing the current through the compacted sample. The current was 1.5 kA, the exposure lasted 2 s. The resulting samples were cylinders, 10 mm in diameter, 8 mm high. Density and specific conductivity of the samples were measured.
Properties of the samples are shown in Table 1. The tests by exposure to the electric arc were carried out in order to measure the volume loss of contacts. Anode and cathode materials were the same. The distance between the contacts was 10 mm. The arc current was 2.4–2.5 kA DC. Arc burning time was 180 ms. Characteristic dependence of the arc current and voltage on the arc burning time is shown in Figure 1. After exposure to the arc, the weight and volume losses of the contacts were measured, and microstructural studies by means of SEM with microanalyzer were carried out.
3. Results and Discussion
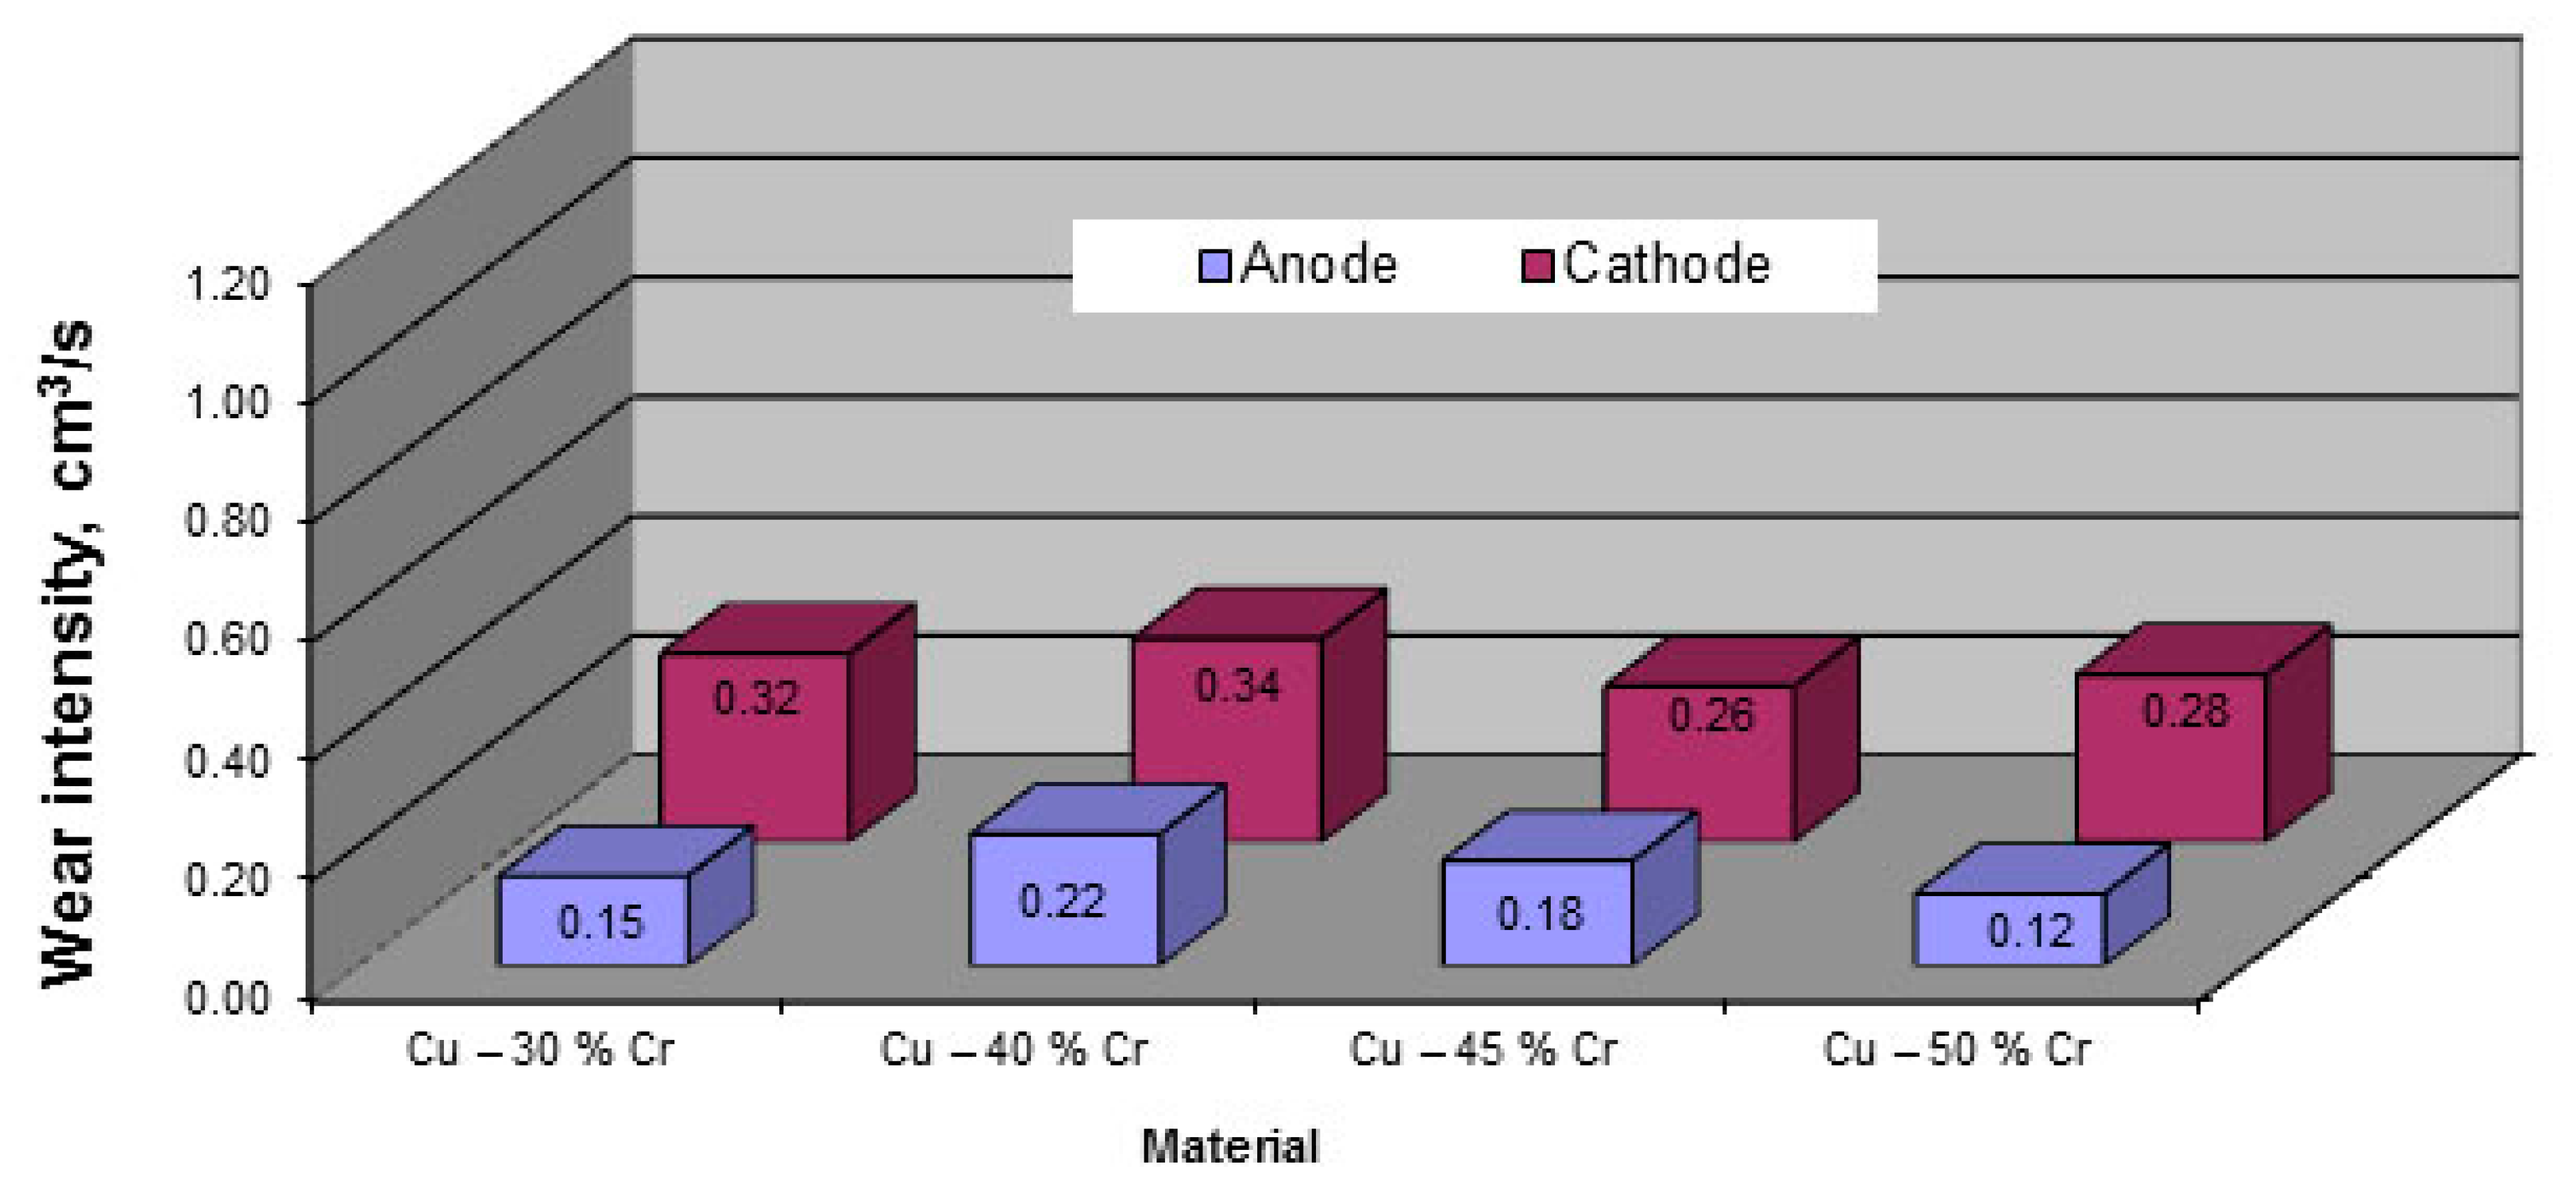
Wear intensity of the Cu–Cr system based materials resulting from exposure to the electric arc is shown in Figure 2.
It follows from Figure 2 that the anode subjected to the electric arc loses less volume compared to the cathode. The Cu–50%Cr material shows the lowest anode wear and the lowest accumulated wear of the anode and cathode. The Cu–45%Cr material shows the lowest cathode wear.
A pair of electric contacts is replaced when either of the contacts reaches the maximum level of wear. That’s why cathode wear is the limiting factor. Therefore, a pair of contacts made of the Cu–45%Cr material would be the most lasting one.
4. Microstructural Studies
Microstructural studies were carried out by means of SEM with microanalyzer. The studies involved surfaces located perpendicularly to the surface exposed to the electric arc.
Results of structural studies of the Cu–Cr system material after exposure to the electric arc have shown that three characteristic zones can be selected in that material:
- exposure zone of the electric arc;
- copper depleted zone (enriched with chromium);
- original material zone.
These three zones can be seen in Figure 3, which shows the microstructure of the Cu–45%Cr material after exposure to the electric arc.
The surface exposed to the electric arc is located in the plane perpendicular to the plane of the figure, in its top section. The top section of Figure 3 shows the zone that was crystallized after melting caused by exposure to the electric arc (exposure zone of the electric arc). The middle section of Figure 3 shows the zone enriched with chromium. The bottom section of Figure 3 shows the zone containing the original material structure (original material zone).
The exposure zone of the electric arc is a fine-dispersed mixture of copper and chromium, or of the respective solid solutions based thereof, with the uniform distribution of components. The depth of this zone ranged from 30 to 1000 µm depending on the position of a drop on the arc burning surface. This zone was formed as a result of melting caused by the electric arc and subsequent solidification. The zone has a clear boundary separating it from the rest of the material.
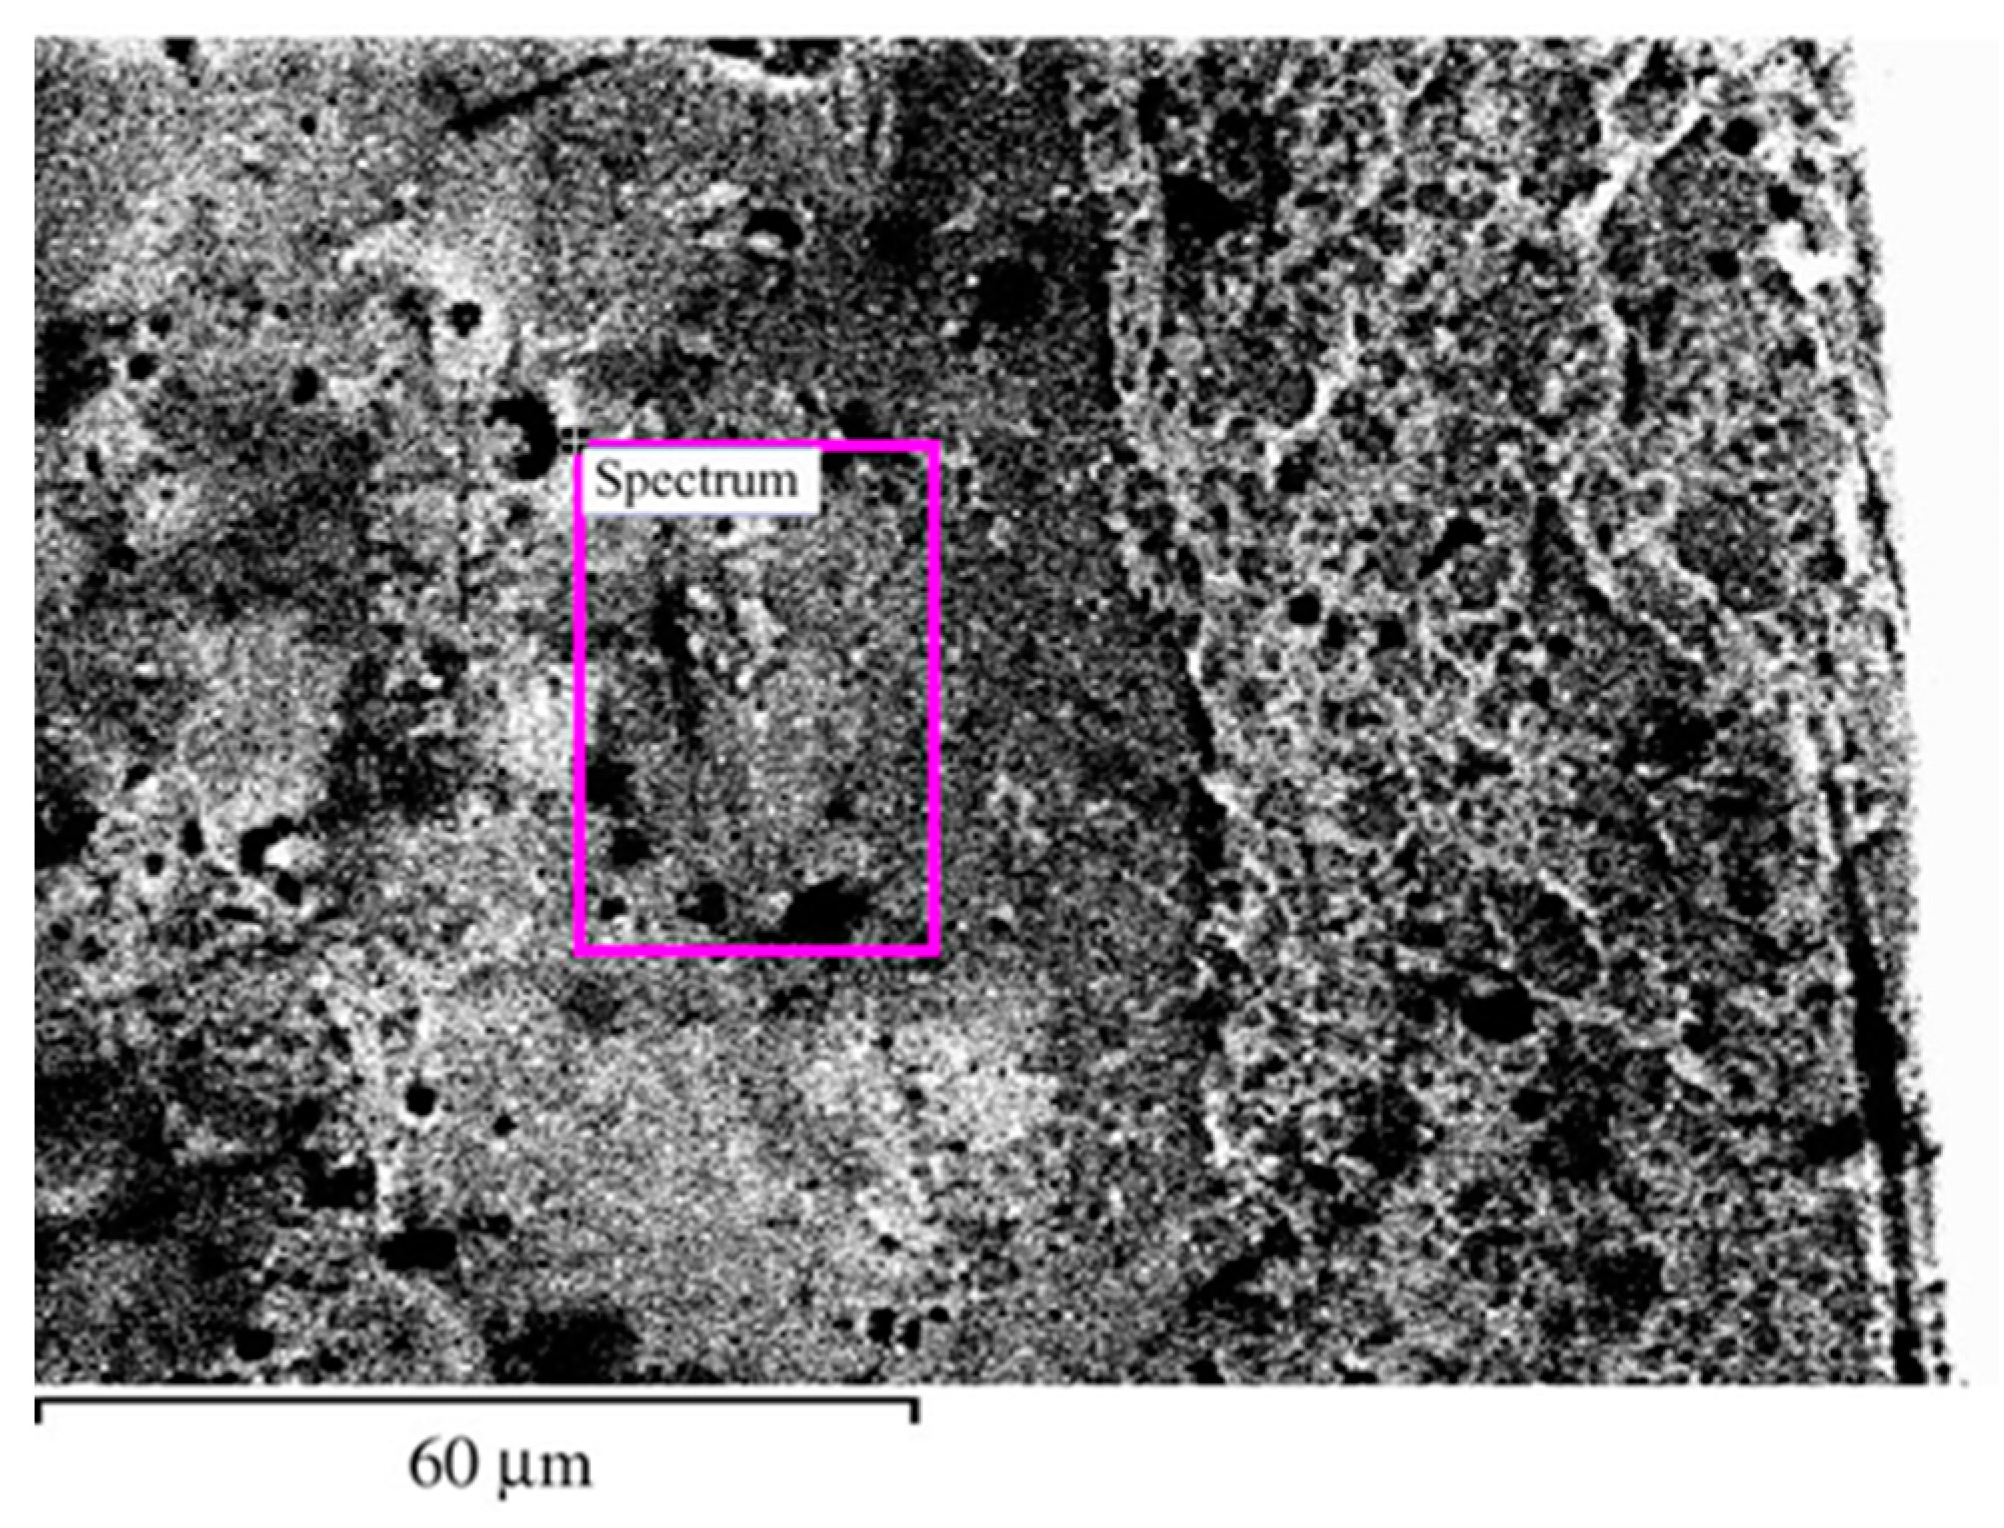
Figure 4 shows the zone enriched with chromium, in which the chemical composition was evaluated. This zone contains 93% Cr and 7% Cu.
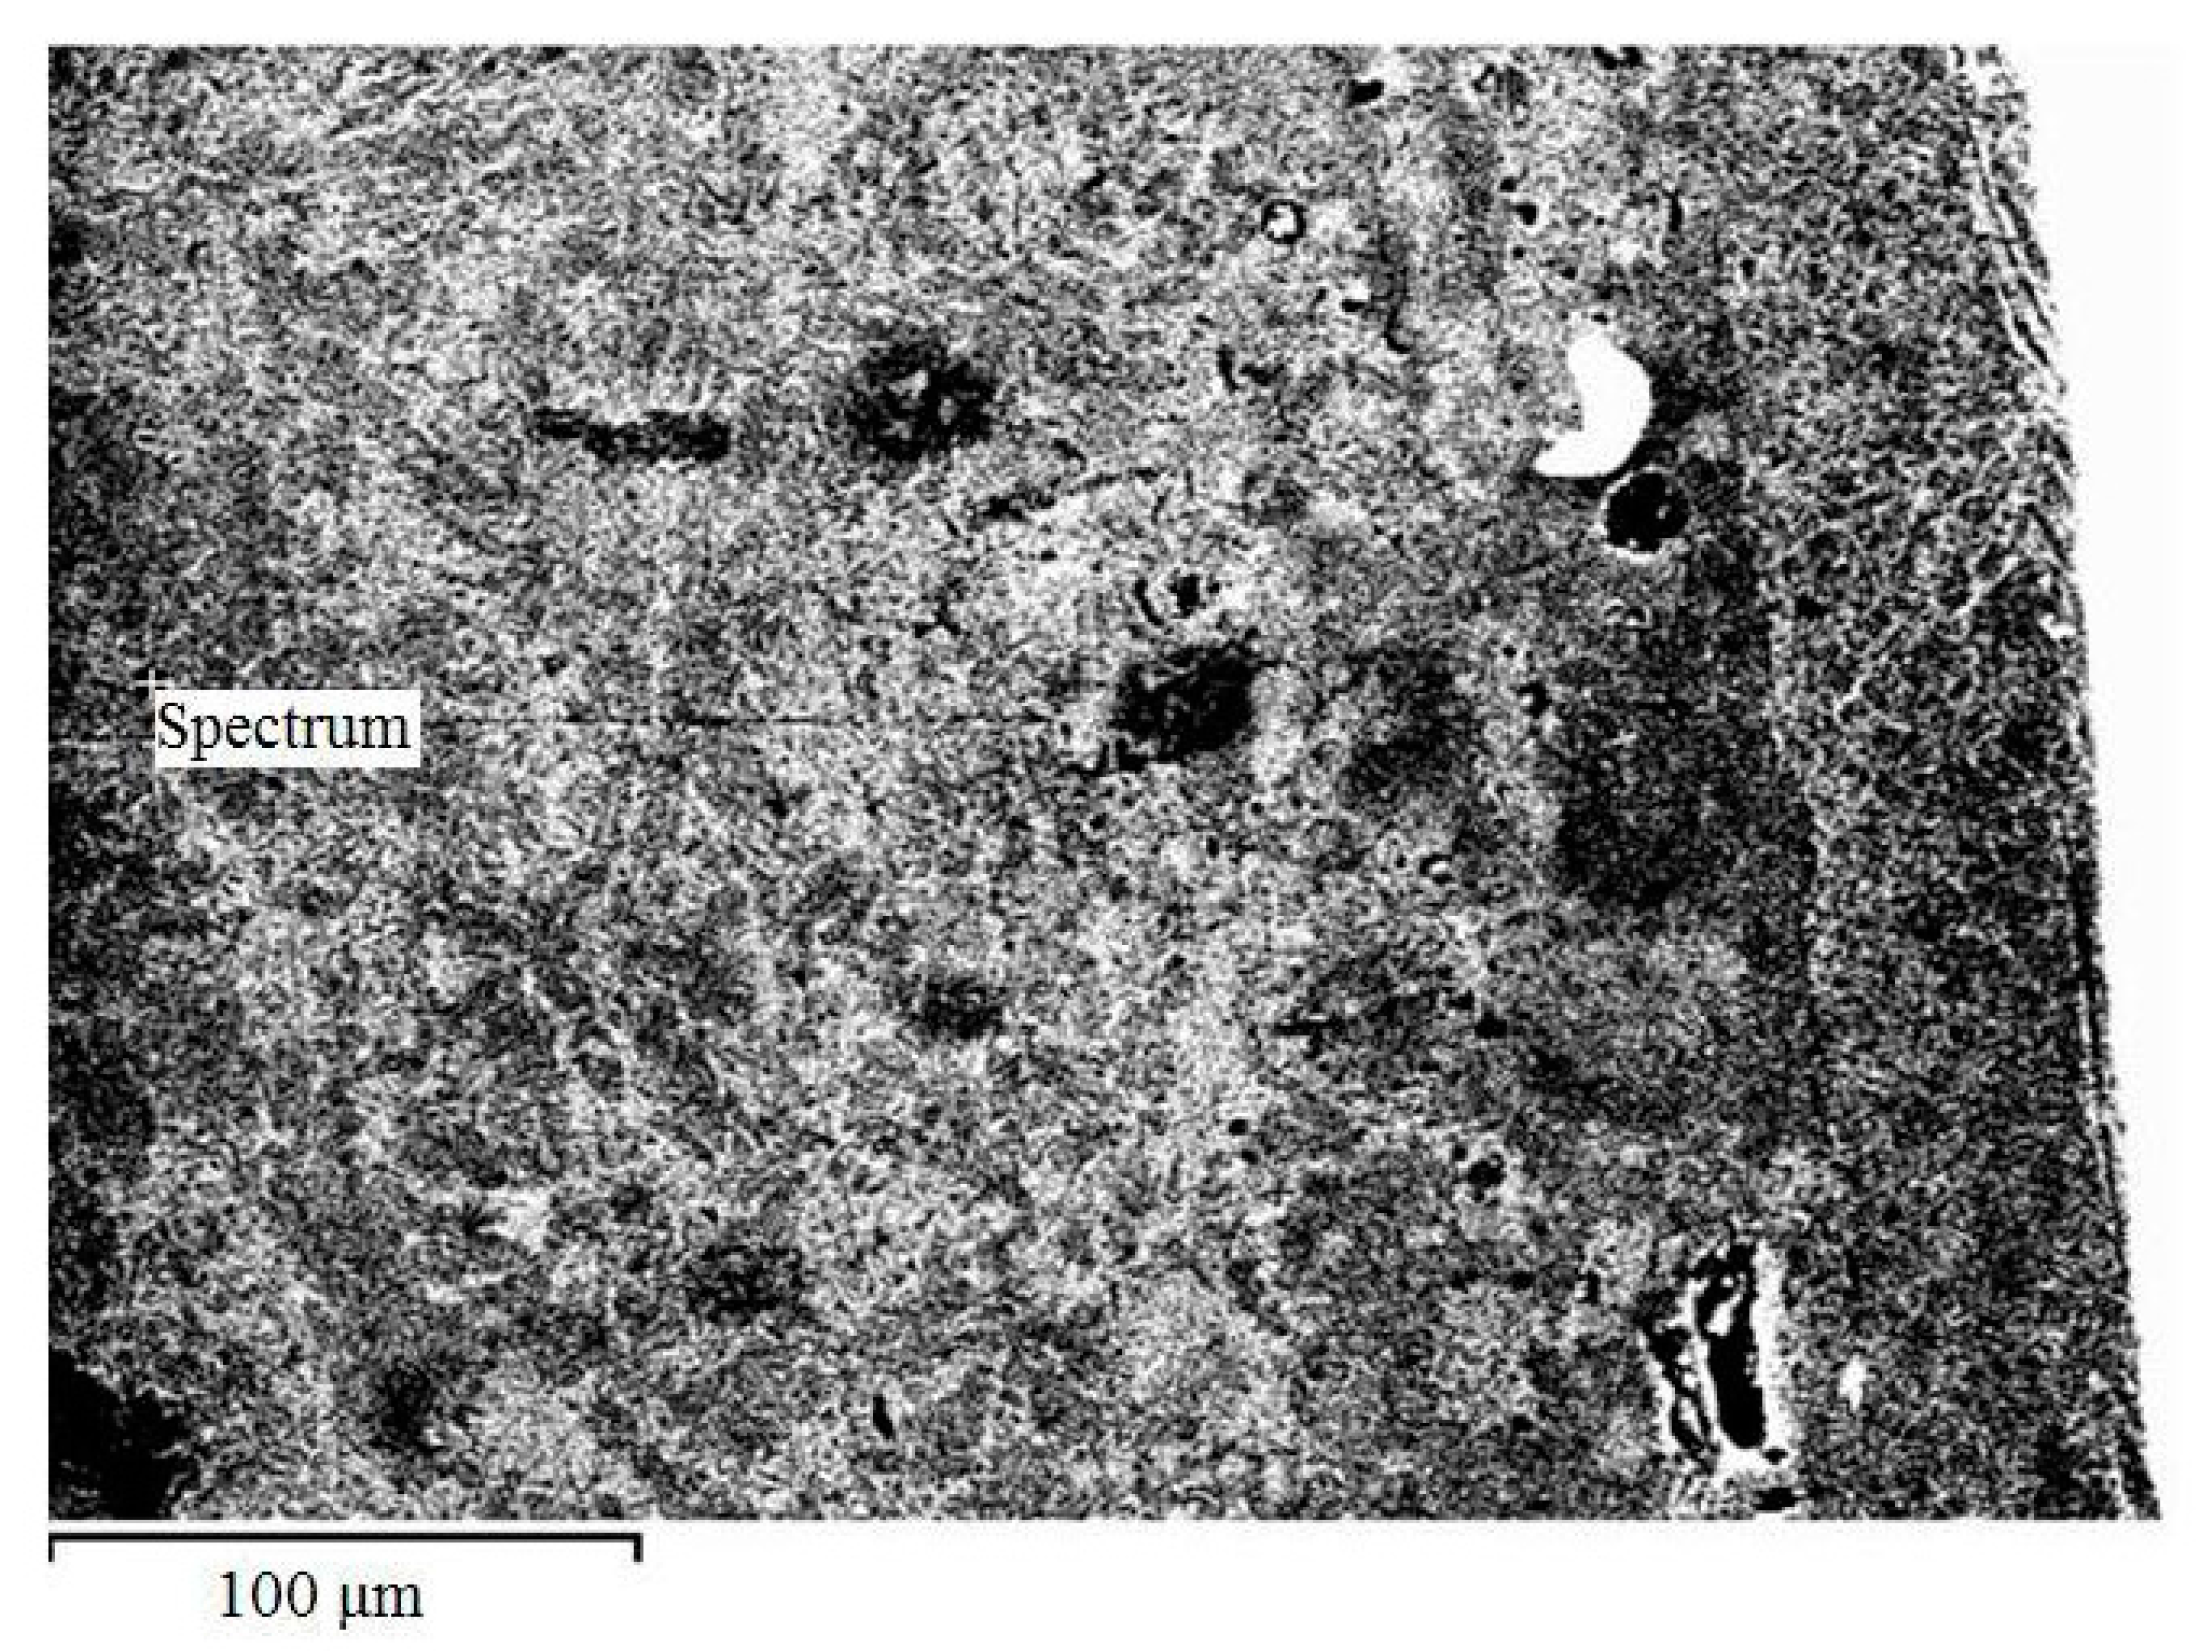
The original material at the distance of 250 microns from the zone enriched with chromium contained 56% Cu and 44% Cr (Figure 5). The arc exposure zone contained 50–57% Cr and 43–50% Cu (the area shown in Figure 6 contains 53% Cr and 47% Cu). Figure 7 shows the dependence of the chromium, copper, and oxygen content on the distance from the surface of the arc exposure for Cu–45%Cr material. In Figure 7, the arc exposure zone is located on the left. Its depth is approximately 90 microns. The zone enriched with chromium is located at the depth from 90 to 170 microns. The original material zone is located in the Figure on the right, at the depth from 170 to 300 microns.
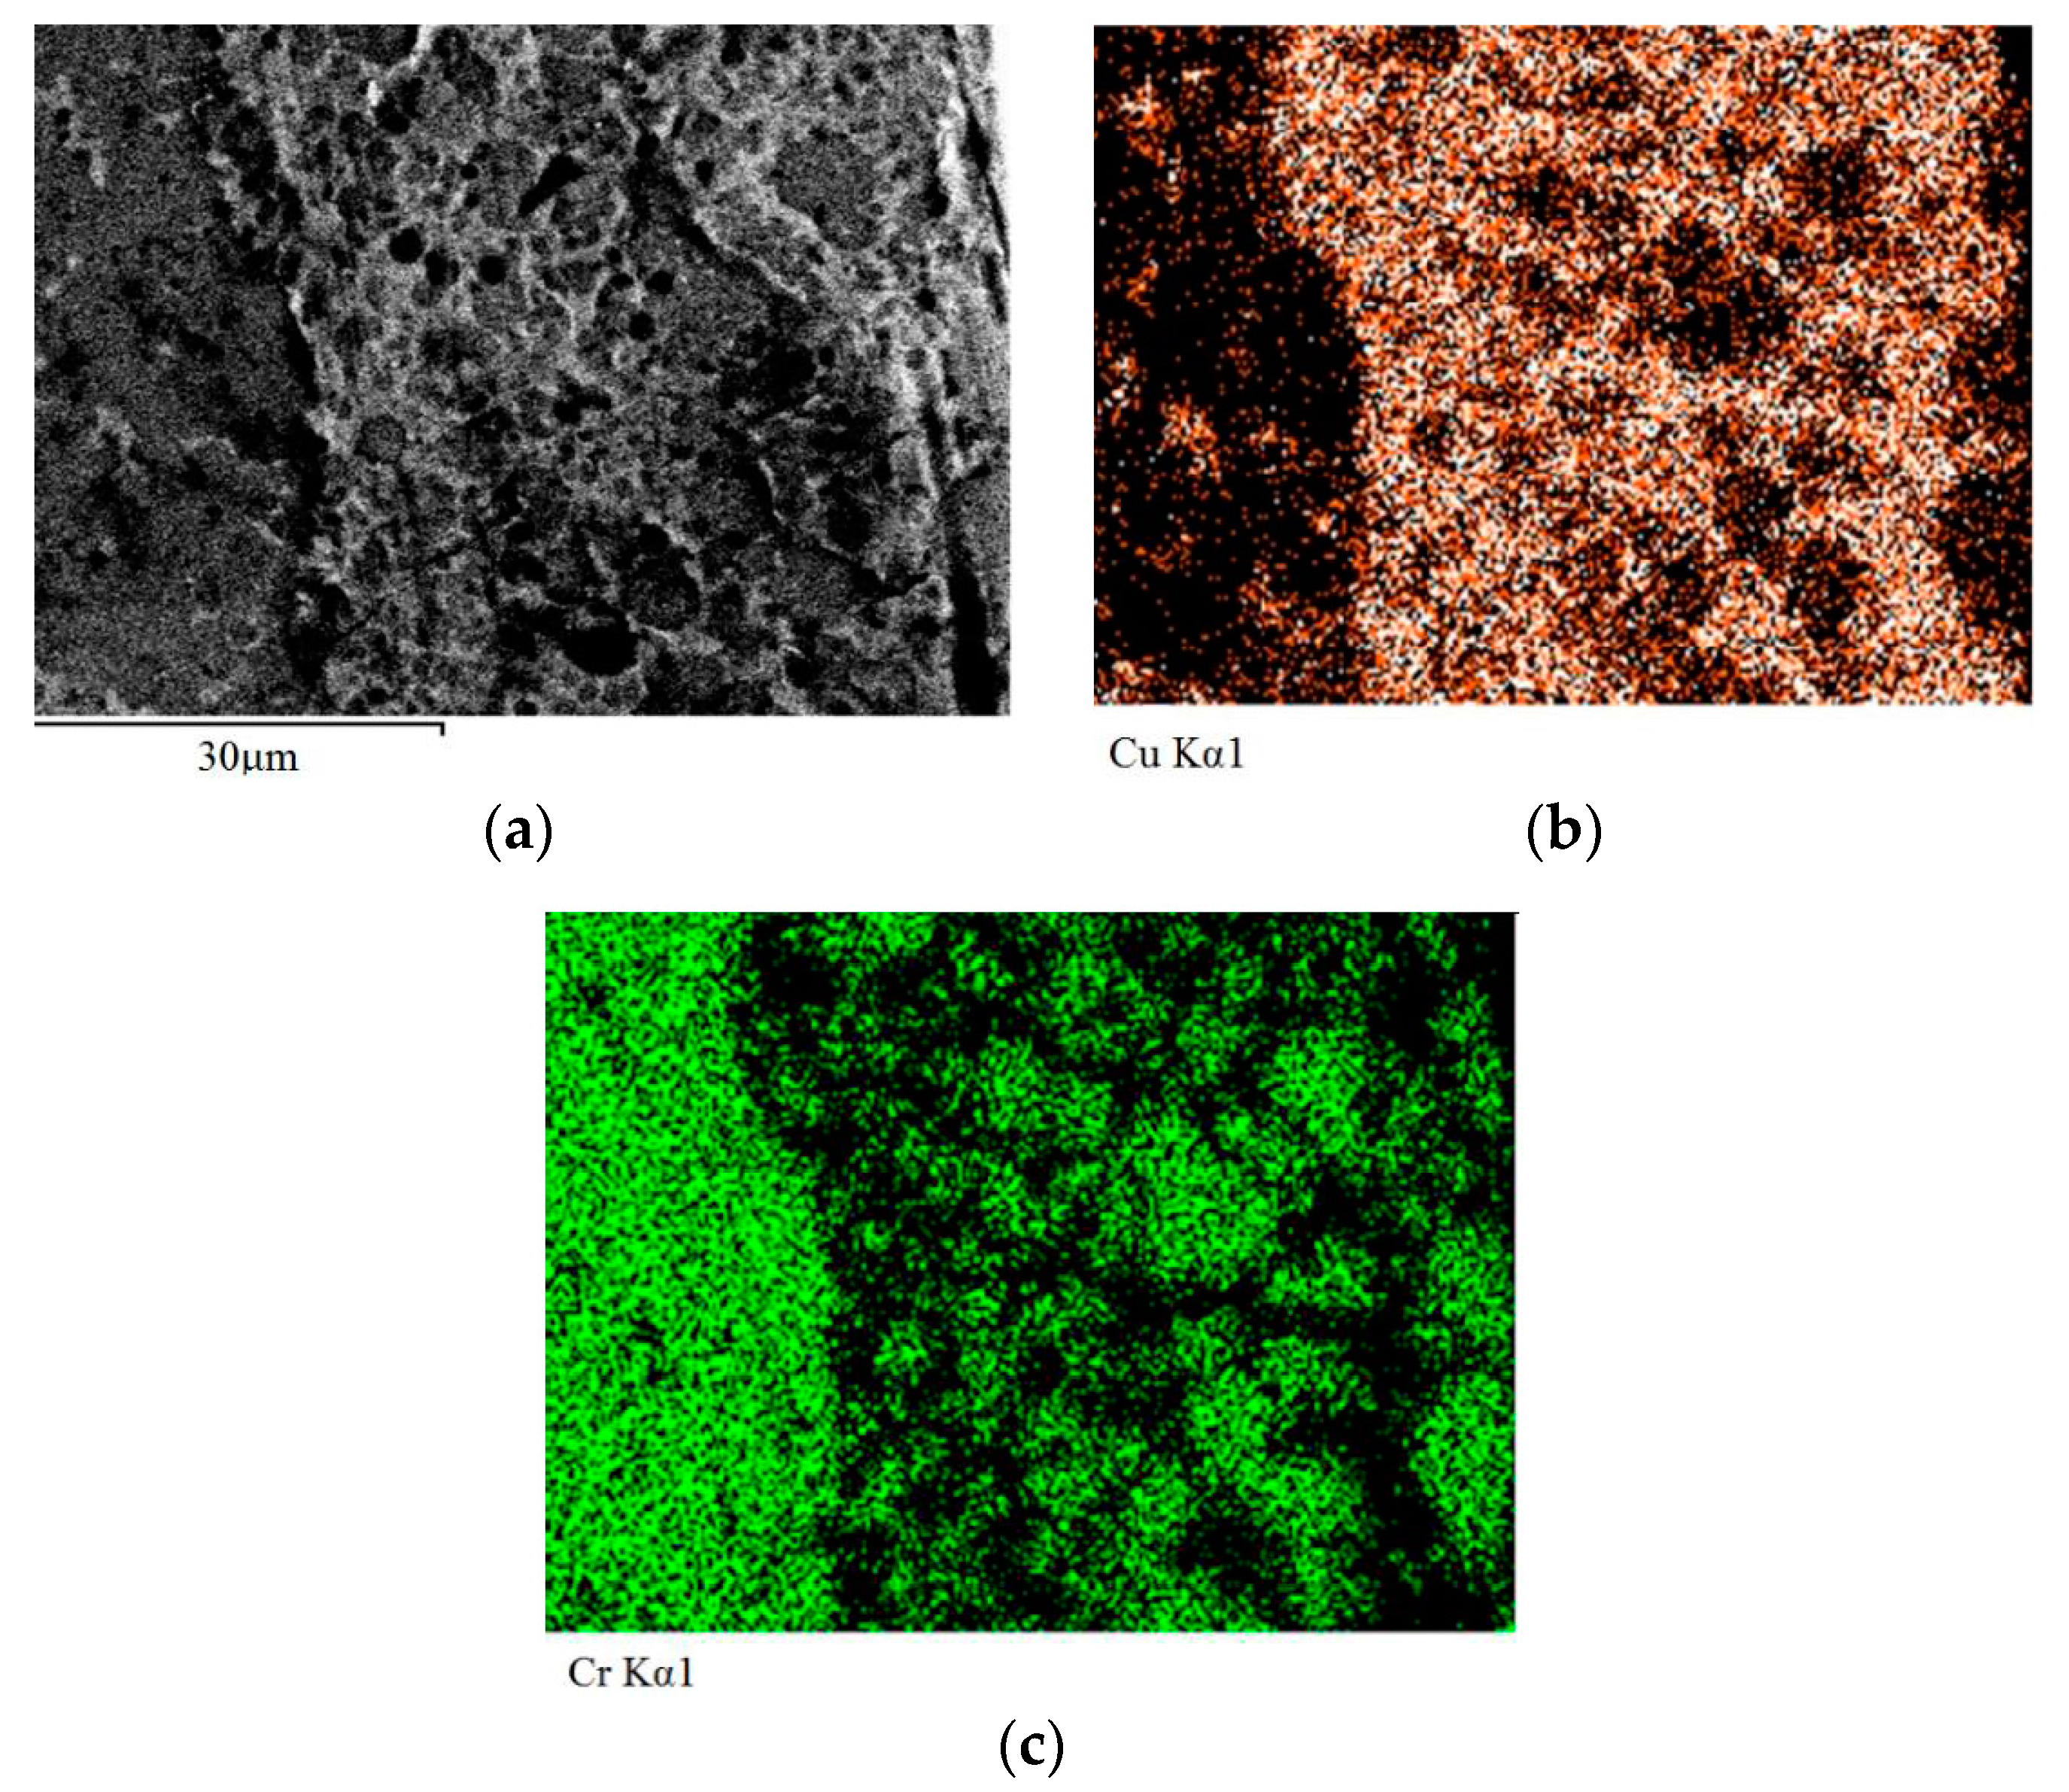
Figure 8a–c show distribution maps of copper and chromium in the zone enriched with chromium and in the adjacent arc exposure zone.
In Figure 8а, the arc exposure zone is located on the right. Figure 8 shows a sharp boundary between the arc exposure zone and the zone enriched with chromium
Figure 7 and Figure 8 demonstrate that chromium content increases and copper content decreases near the exposure surface of the electric arc. Studies of the arc exposure surface have shown that it is enriched with chromium and, consequently, depleted of copper.
The electric arc exposure surface of and results of chemical analysis are shown in Figure 9 and in Table 2, respectively. The chemical analysis was carried out by means of SEM microanalyzer.
It follows from Table 2 that the arc exposure surface is enriched with chromium and depleted of copper. A similar structure was observed in the Cu–30%Cr material after exposure to the electric arc.
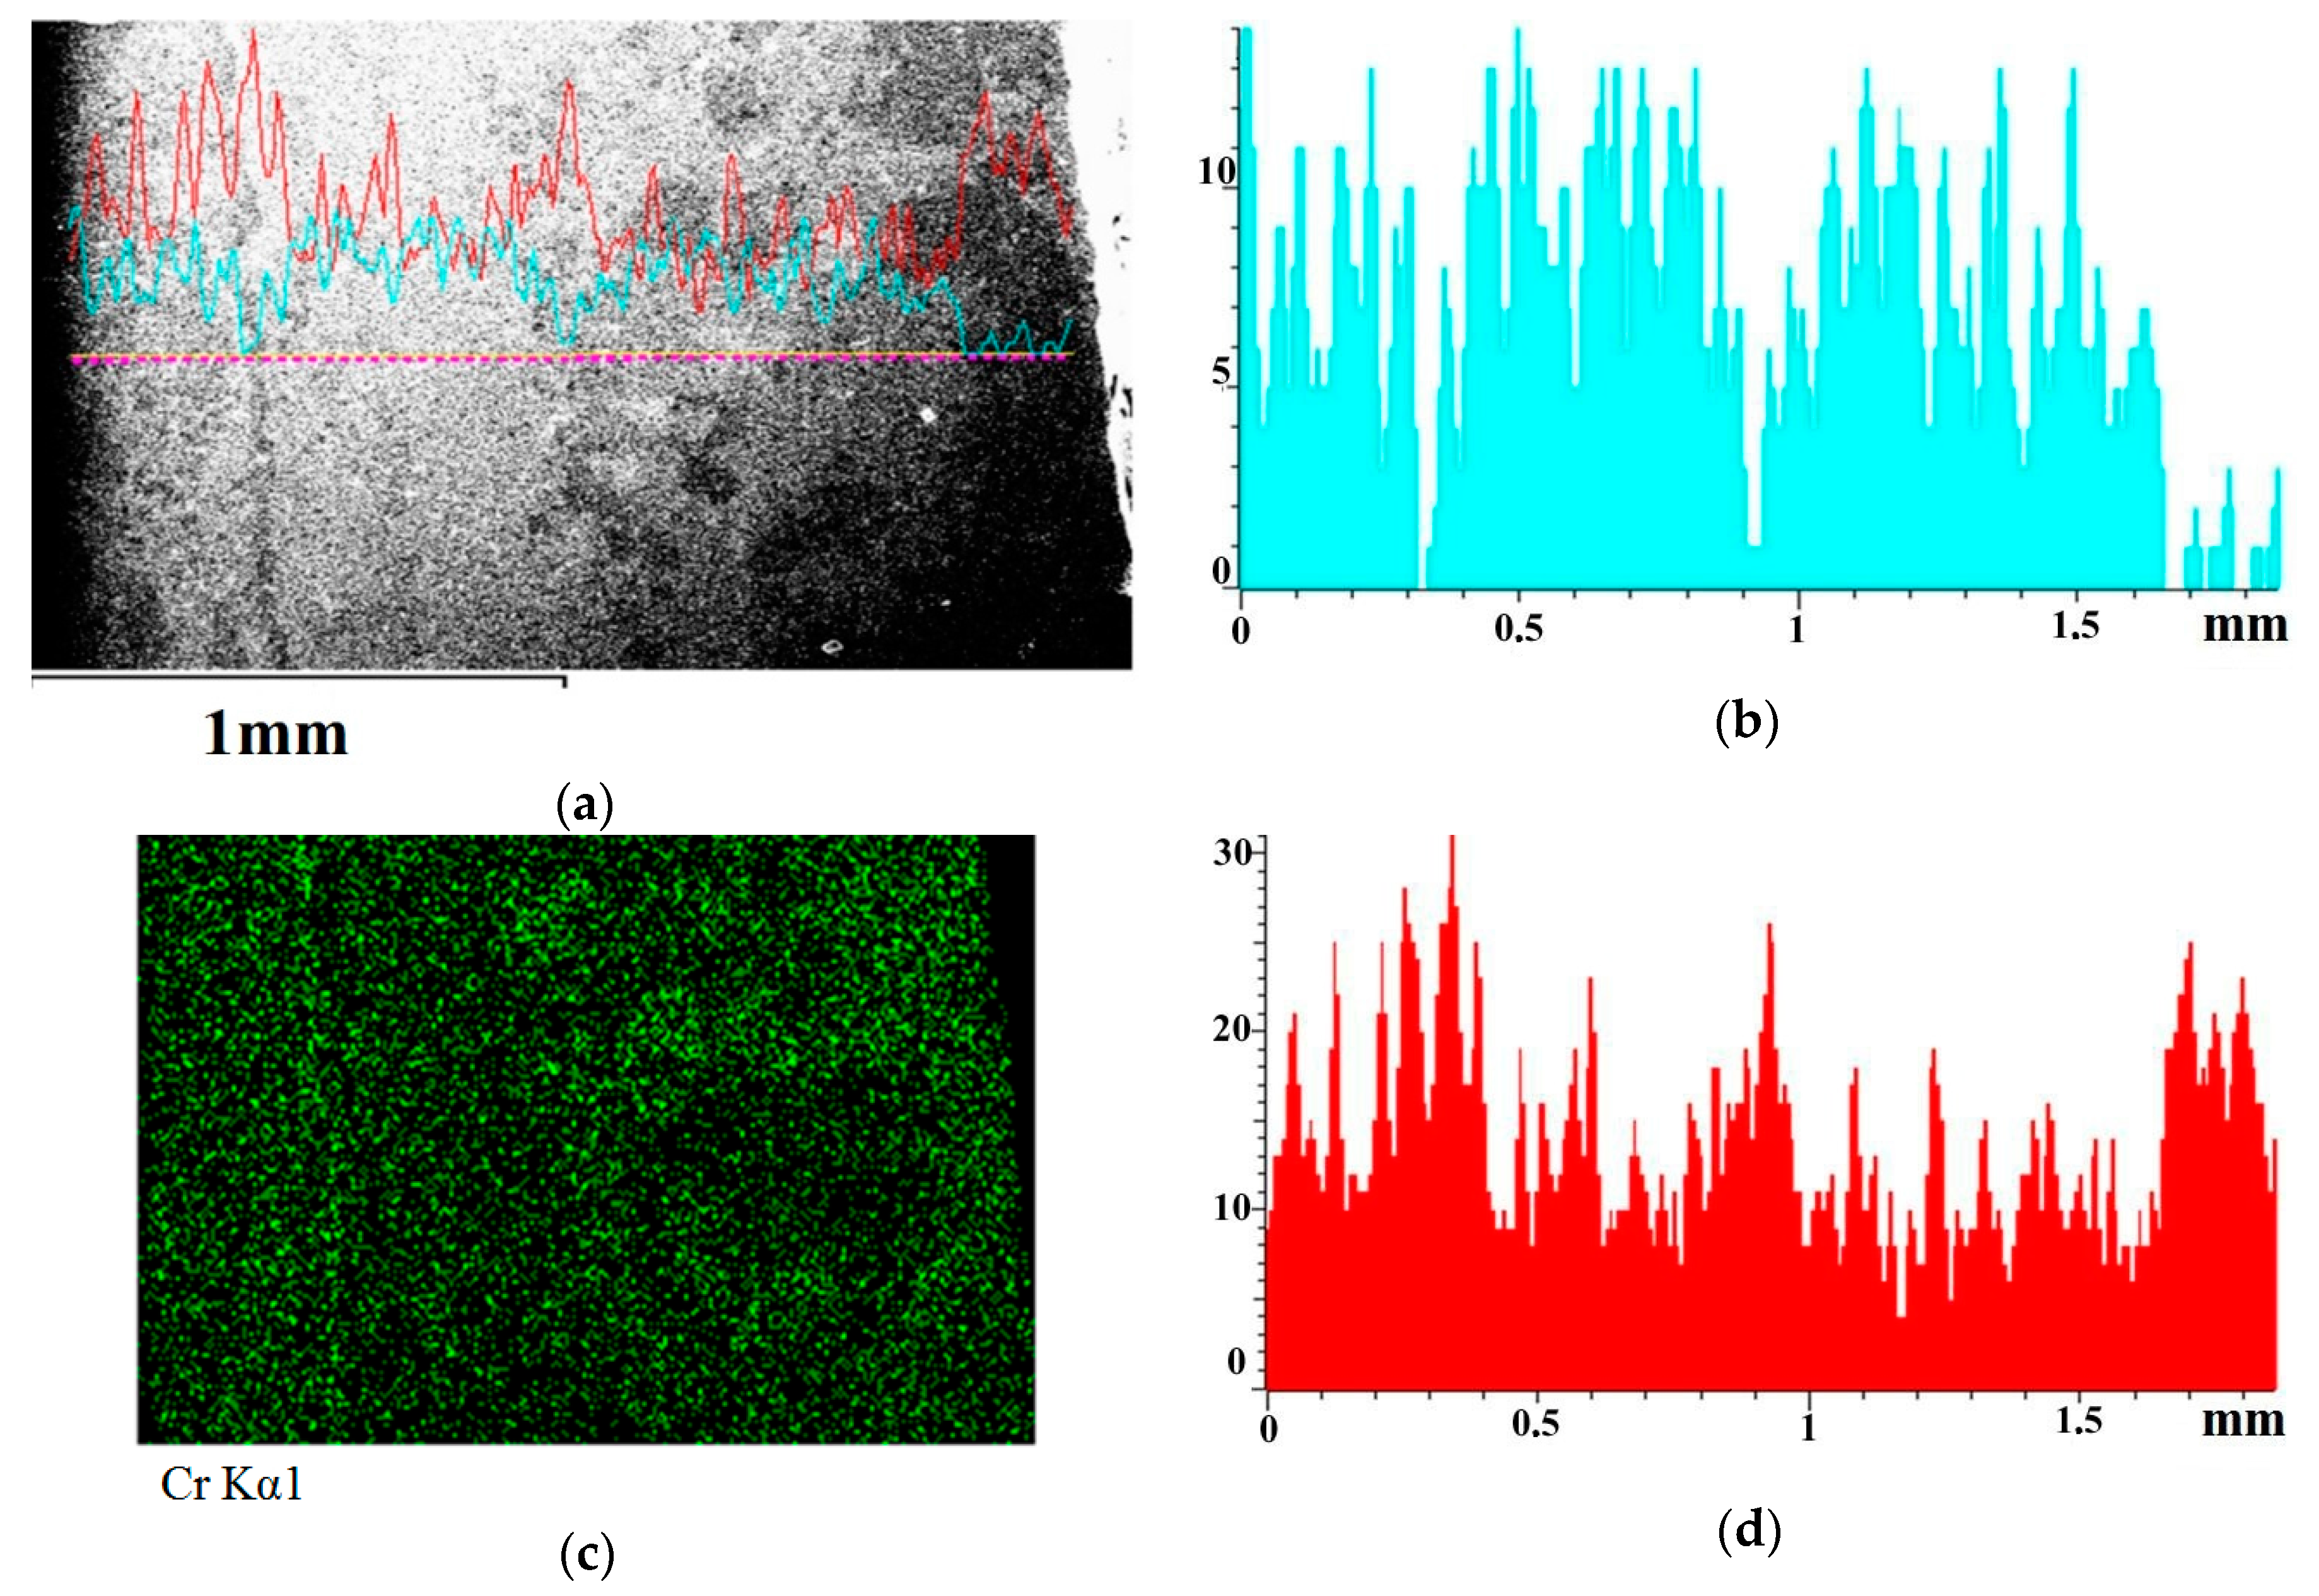
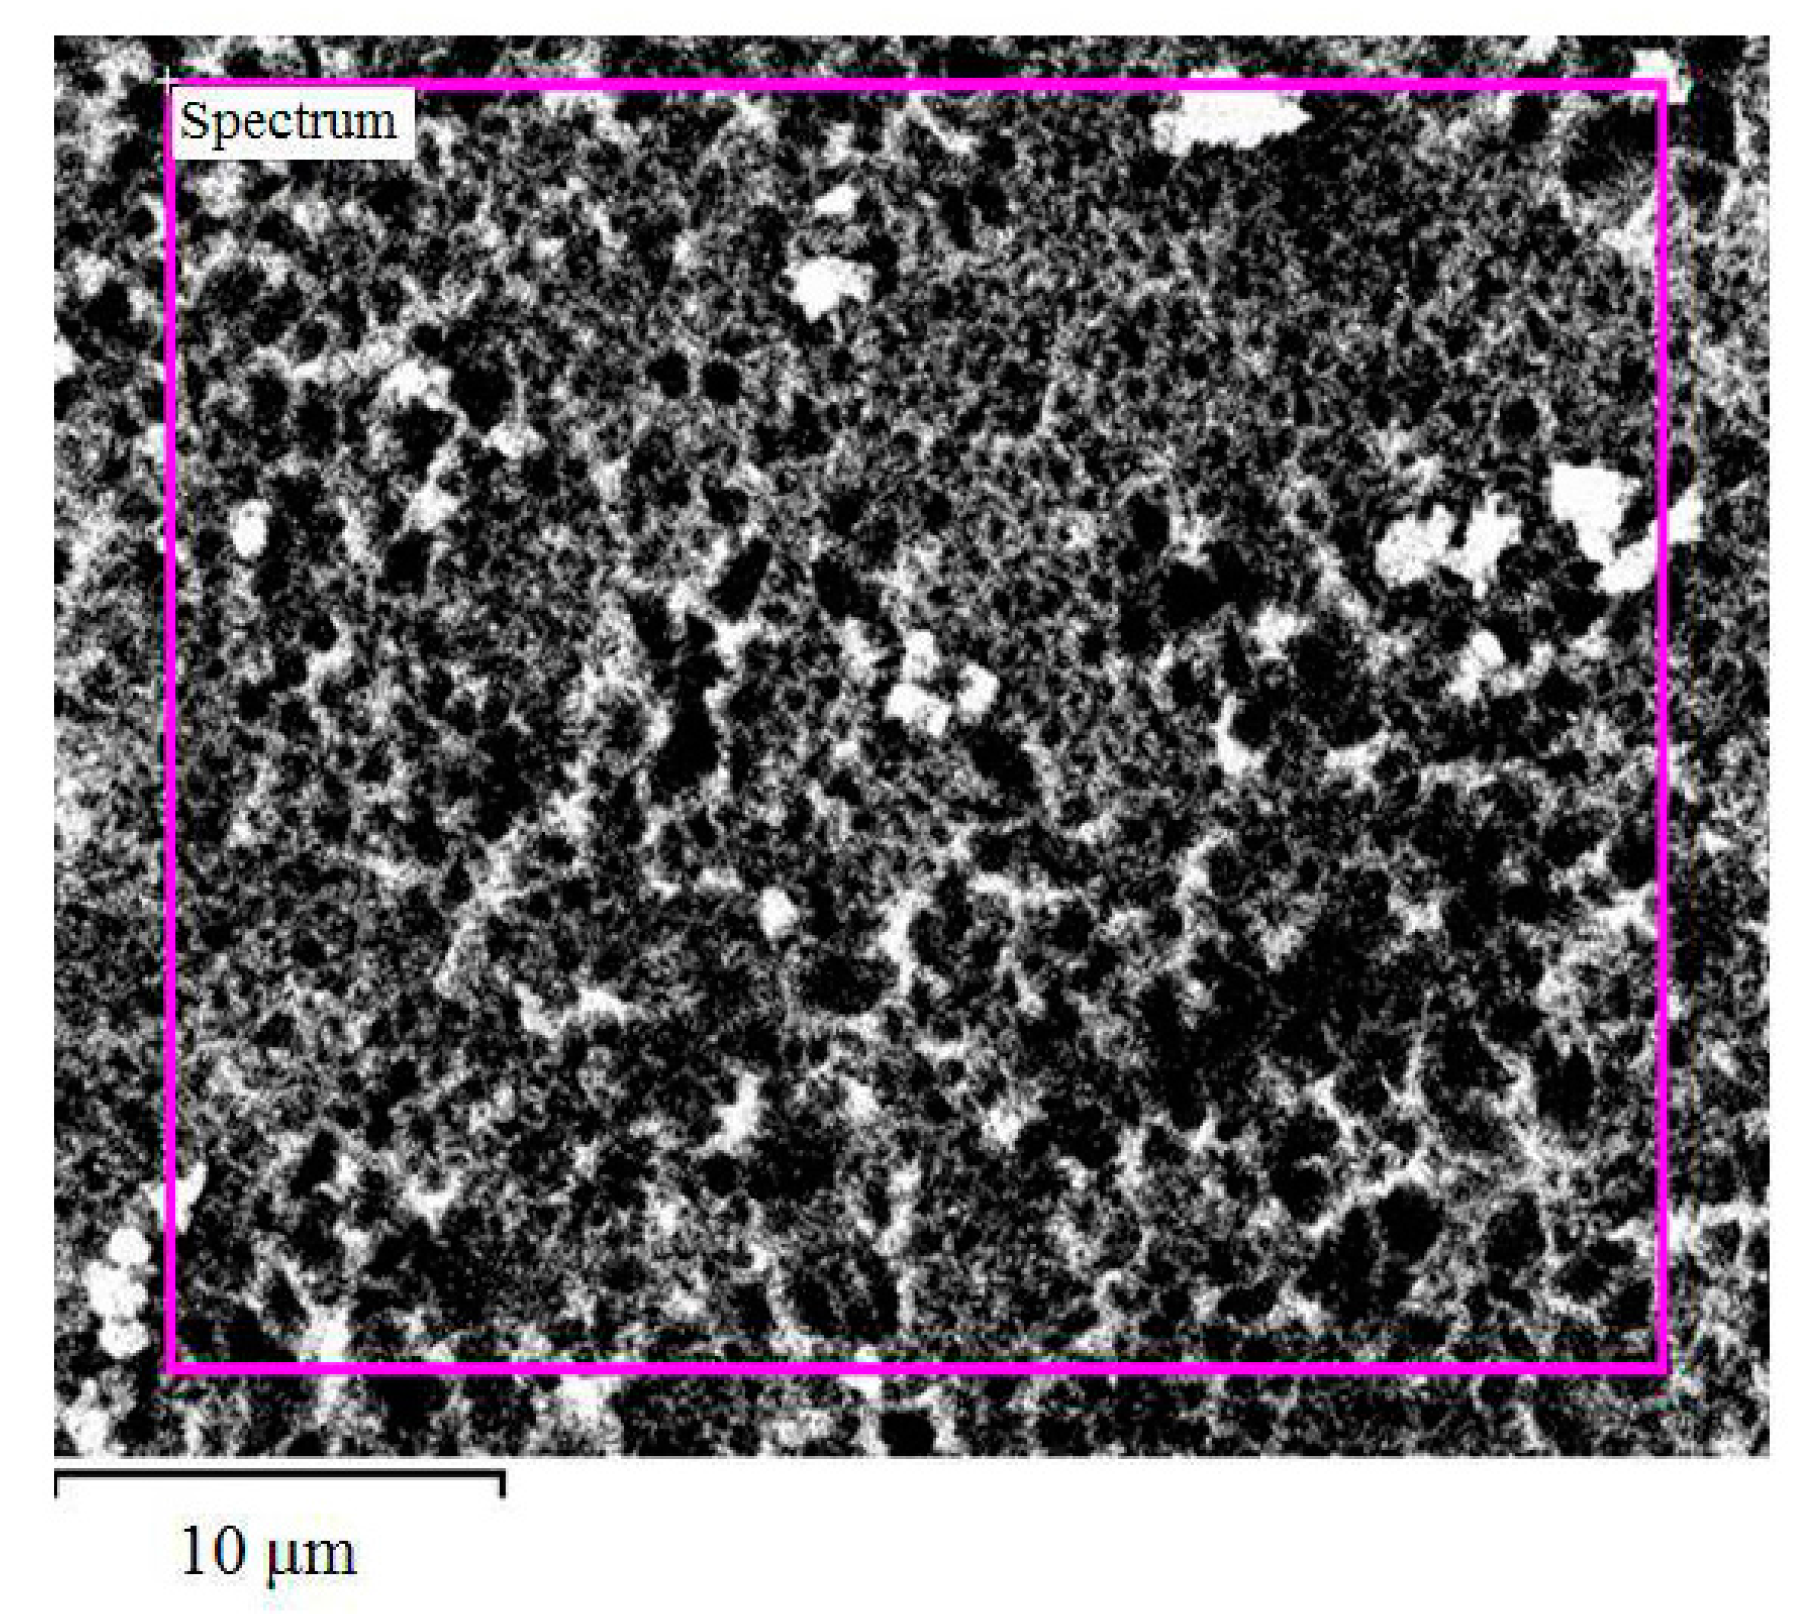
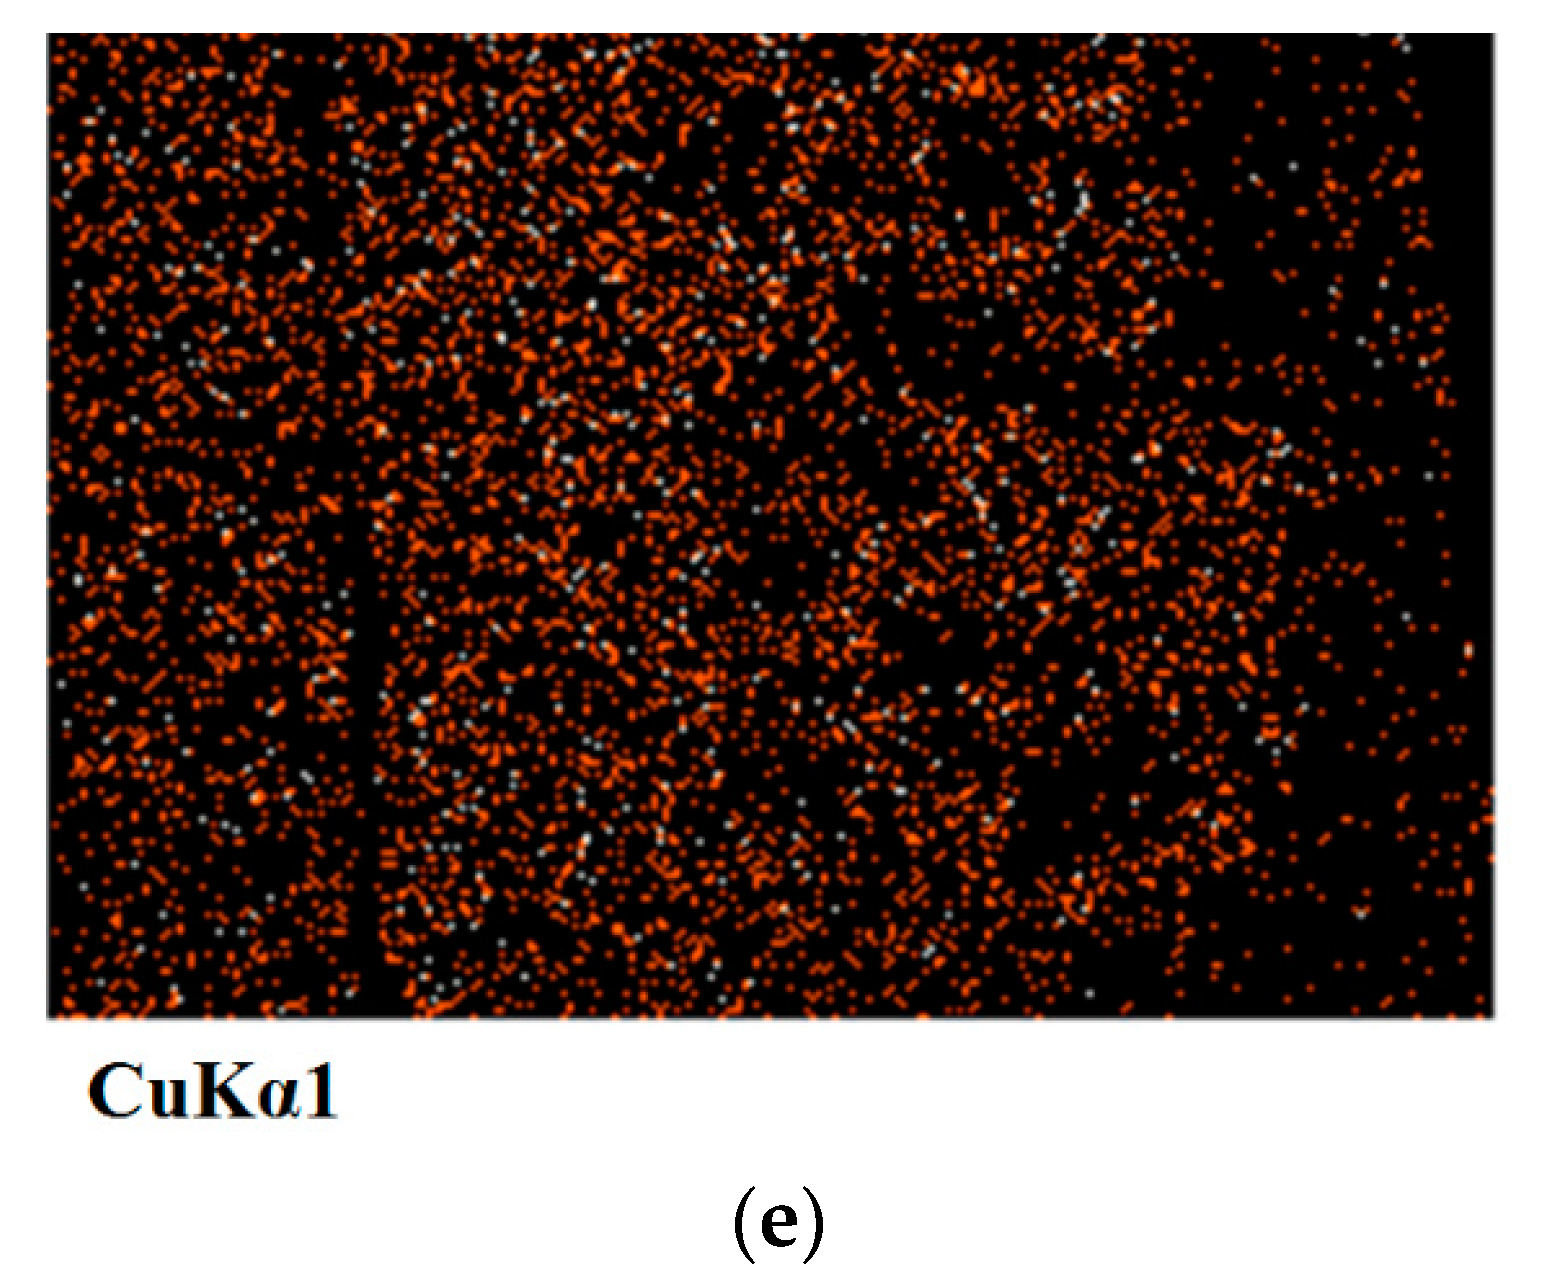
Figure 10 shows the structure of the Cu–30%Cr material adjacent to the arc exposure surface, depth distribution of chromium and copper as well as distribution maps of copper and chromium. Figure 10a shows a relatively thin boundary between the original structure and the zone melted as a result of exposure to the arc. The boundary is a 30–50 µm wide streak enriched with chromium. This streak is marked with an arrow in Figure 10a. It follows from Figure 10a,c that the streak is enriched with chromium and that it contains virtually no copper. To the right of this strip, there is the arc exposure zone, approximately 1.8 mm wide, and to the left there is the original material. Near the arc exposure surface (in Figure 10a—on the right), there is a 200–250 µm wide zone enriched with chromium. This is evidenced by the distribution maps of chemical elements. The chromium content (Figure 10a) in the fine-dispersed part of the arc exposure zone is 43–57% by weight, the rest is copper.
The results of microstructural studies of the Cu–30%Cr and Cu–45%Cr materials show that the electric arc exposure zone is a fine-dispersed mixture in which chromium and copper are uniformly distributed. The chromium content in the mixture ranges from 43 to 57%. This composition of solidified fine-dispersed mix is typical of all the tested materials. This mixture results from melting caused by exposure to the electric arc and subsequent solidification. The fine-dispersed mixture is restricted on the outside and inside with chromium rich zones (their chromium content exceeds 90%). The outer chromium rich zone separates the fine-dispersed mixture from the arc exposure surface. The inner chromium rich zone separates the fine-dispersed mixture from the original material. This structure and composition of the electric arc exposure zone are typical of all the tested materials.
According to the equilibrium state diagram Cu–Cr [15,16], solid particles of chromium (melting point 1863 °C) are the first to appear during crystallization of the Cu–Cr melt. In case of the molten Cu–45%Cr, crystallization of primary particles of chromium begins at the temperature of about 1720 °C, and in case of the molten Cu–30%Cr—at the temperature of about 1600 °C. The primary chromium particles depose from the melt until it reaches the eutectic temperature (1076.6 °C). At the eutectic temperature, there occurs simultaneous crystallization of secondary chromium and of the copper based solid solution containing maximum 1% chromium. The eutectic alloy contains about 1.5% chromium; the rest is the copper-based solid solution. Therefore, in the case of equilibrium crystallization, the structure of the solidified alloy consists of primary chromium particles that are distributed uniformly within the eutectic.
The solidified areas that were melted via exposure to the electric arc have two principal differences from an alloy of the Cu–Cr system that solidified under equilibrium conditions. The first difference is the non-uniform distribution of primary chromium. The primary chromium forms two walls. One chromium wall is located near the exposure surface of the electric arc, the second chromium wall separates the arc exposure zone from the original material. The second difference is the increased chromium content of the fine-dispersed mix in the arc exposure zone compared to the original alloy.
Overall, increasing of the chromium content in the exposure zone of the electric arc is explained by the fact that melting point of copper is lower than that of chromium, so evaporation and spattering of copper are more intense compared to chromium.
The formation of the chromium walls is explained by the fact that once burning the electric arc stops, the heat is removed from to the surface into the environment and inside the material. Therefore, the temperature near the surface and inside the material is lower than in the arc exposure zone. Chromium is the first to crystallize in the lower temperature areas. After formation of the chromium walls, the melt between these walls is crystallized.
The resulting structure in the exposure zone of the electric arc is characterized by a nonuniform distribution of chromium; hence, this structure has a lower entropy compared to the structure where chromium is distributed in a uniform manner. In view of this, it would be safe to assume that self-organization took place in the system [14,17].
The chromium wall located near the arc exposure surface contains about 26% oxygen (Table 1). This wall therefore contains plenty of chromium oxide. Chromium oxide Cr2O3 has a high melting point (2435 °C), so it can resist the exposure to the electric arc better than the Cu–45%Cr alloy. The fine-dispersed mixture located between the two chromium walls contains more chromium than the original material. According to the equilibrium state diagram Cu–Cr, when the chromium content exceeds 50% by weight, the initial melting point of the alloy reaches the maximum value for alloys containing 0 to 80% chromium by weight (1767 °C). This is the temperature of eutectic transformation, so it remains unchanged as the chromium content changes from 50 to 80% by weight. The inner chromium wall protects the original material from thermal exposure of the electric arc. In case of repeated exposure to the electric arc, the melting of the resulting structure would require much more energy than during the first exposure. Therefore, alloys of the Cu–Cr system are adapted to exposure to the electric arc.
Similarly [14], entropy change of the electric arc exposure zone consists of the following main components:
ΔSea—part of the entropy flow caused by exposure to the electric arc excluding the mass exchange with the environment, including the wear;
ΔSih—part of the entropy production excluding the mass transfer and chemical reactions (mostly heat flow and current);
ΔSim—part of the entropy production related to the mass transfer and chemical reactions;
ΔSem—part of the entropy flow related to the mass exchange with the environment.
ΔSeо—part of the entropy flow caused by the flow of oxygen from the environment into the arc exposure zone;
ΔSeCuCr—part of the entropy flow caused by the flow of chromium and copper from the electric arc exposure zone to the environment (the wear).
The last member in the right-hand section (1) is preceded by with a minus, since copper and chromium depart from the electric arc exposure zone into the environment with their entropy.
Entropy change of the electric arc exposure zone (ΔS) is as follows:
Entropy change rate of the electric arc exposure zone is as follows:
The value (3) in stationary condition can be expressed as follows:
Hence,
The first two members of the right-hand section of (5) depend on the power of the electric arc. If the arc power does not change, these members may be regarded as unchanged.
When the nonequilibrium structure shown in Figure 3 is formed, its entropy will be less than the entropy of the equilibrium structure with uniform distribution of copper and chromium. All other things being equal, the entropy production of nonequilibrium structure formation (Figure 1) will be less than the entropy production of equilibrium structure formation, i.e.,
The value consists of two main parts connected with the mass transfer and chemical reactions. During exposure to the electric arc, the chemical reaction of chromium oxidation takes place. Oxidation of chromium is a self-induced process producing positive entropy. The negative contribution into may be caused by entropy production of the mass transfer, since the resulting structure is nonequilibrium.
Due to additivity of entropy, the value is proportional to wear intensity. It follows from (5) and (6) that during formation of the nonequilibrium structure (Figure 1), material wear intensity when exposed to the electric arc will be less than in case of formation of the equilibrium structure.
Mention should be made of one more feature of formation of nonequilibrium structure under the influence of the electric arc. After formation of the nonequilibrium structure (Figure 3), material loss intensity during repeated exposures to the electric arc will be several times less than during the first exposure. This is because, in case of repeated exposures, oxidation will only cover the part of chromium that will replenish the external wall. Therefore, oxidation will involve considerably less chromium than during the first exposure. Accordingly, entropy production related to oxidation will decrease. The same applies to entropy production of the mass transfer. Reduced entropy production in case of repeated exposures to the electric arc compared to the first exposure leads to a lower intensity of material loss in case of repeated exposures.
Therefore, adaptation of the Cu–Cr system alloys to the influence of the electric arc takes place via self-organization followed by formation of the nonequilibrium structure with non-uniform distribution of chromium.
5. Conclusions
The paper studied the influence of the electric arc on the Cu–Cr alloys containing 30–50% chromium by weight as well as the structure that was formed in the electric arc exposure zone. The structure appearing in the electric arc exposure zone is identical for all the tested alloys. The resulting structure consists of two chromium walls, one of which is located near the surface, and the other separates the arc exposure zone from the original material. Between these walls, there appears a fine-dispersed mixture with a higher content of chromium compared to the original alloys. The resulting structure is strongly nonequilibrium. Therefore, it results from the adaptation and self-organization of the Cu–Cr system alloys.
Acknowledgments
The work has been supported by grant of the Russian Science Foundation No. 14-19-01033 (Microstructure studies) and 15-19-00217 (Introduction, Experiment, Results and Discussion, Conclusions).
Author Contributions
Iosif S. Gershman performed the study conception and design, analyzed the data, and wrote the manuscript together with German S. Fox-Rabinovich and Stephen C. Veldhuis. Eugeniy I. Gershman conceived and designed the experiments. Alexander E. Mironov performed the experiments and the materials characterization. All authors have read and approved the final manuscript.
Conflicts of Interest
The authors declare no conflict of interest.
References
- Li, W.P.; Thomas, R.L.; Kirkland, S.R. Effect of Cr content on the interruption ability of CuCr contact materials. IEEE Trans. Plasma Sci. 2001, 29, 380–383. [Google Scholar]
- Durakov, V.G.; Gnyusov, S.F.; Dampilon, B.V.; Dekhonova, S.Z.; Ubiennykh, B.I. Microstructure and properties of vacuum electron beam facing CuCr25 contact material. In Proceedings of the 25th International Symposium on Discharges and Electrical Insulation in Vacuum, Tomsk, Russia, 2–7 September 2012; Volume 2, pp. 525–528. [Google Scholar]
- Pogrebnjak, A.D.; Bagdasaryan, A.A.; Yakushchenko, I.V.; Beresnev, V.M. The structure and properties of high-entropy alloys and nitride coatings based on them. Russ. Chem. Rev. 2014, 87, 1027. [Google Scholar] [CrossRef]
- Sauvage, X.; Jessner, P.; Vurpillot, F.; Pippan, R. Nanostructure and properties of a Cu–Cr composite processed by severe plastic deformation. Scr. Mater. 2008, 58, 1125–1128. [Google Scholar] [CrossRef]
- Kong, G.; Liu, Z.; Wang, D.; Rong, M. High-Current Vacuum Arc: The Relationship between Anode Phenomena and the Average Opening Velocity of Vacuum Interrupter. IEEE Trans. Plasma Sci. 2010, 39, 1370–1378. [Google Scholar] [CrossRef]
- Zhang, C.; Yang, Z.; Wang, Y.; Ding, B. Properties of nanocrystalline CuCr50 contact material. Adv. Eng. Mater. 2005, 7, 1114–1117. [Google Scholar] [CrossRef]
- Wang, Y.; Zhang, C.; Zhang, H.; Ding, B.; Lu, K. Effect of the microstructure of electrode materials on arc cathode spot dynamics. J. Phys. D Appl. Phys. 2003, 36, 2649–2654. [Google Scholar] [CrossRef]
- Wang, Y.; Song, X.; Sun, Z.; Zhou, X.; Guo, J. The solidification of CuCr alloys under various cooling rates. Mater. Sci. Pol. 2007, 25, 199–207. [Google Scholar]
- Zhang, C.; Yang, Z.; Ding, B. Low Electrode Erosion Rate of Nanocrystalline CuCr50 Alloy in Vacuum. Mod. Phys. Lett. B 2006, 20, 1329–1334. [Google Scholar] [CrossRef]
- Wei, X.; Wang, J.; Yang, Z.; Sun, Z.; Yu, D.; Song, X.; Ding, B.; Yang, S. Liquid phase separation of Cu–Cr alloys during the vacuum breakdown. J. Alloys Compd. 2011, 509, 7116–7120. [Google Scholar] [CrossRef]
- Zhou, Z.; Wang, Y.; Gao, J.; Kolbe, M. Microstructure of rapidly solidified Cu–25 wt. % Cr alloys. Mater. Sci. Eng. A 2005, 398, 318–322. [Google Scholar] [CrossRef]
- Okubo, H.; Yasuoka, T.; Kato, T.; Kato, K. Electrode Conditioning Mechanism Based on Pre-breakdown Current under Non-Uniform Electric Field in Vacuum. In Proceedings of the 23rd International Symposium on Discharges and Electrical Insulation in Vacuum, Bucharest, Romania, 15–19 September 2008; pp. 13–16. [Google Scholar]
- Cheng, J.; Zhang, H.; Yang, Z.; Ding, B. Microstructure of Rehandled Layer on the Surface of Nano-CuCr Alloy. In Proceedings of the 7th National Conference on Functional Materials and Applications, Changsha, China, 16–18 October 2010; pp. 1350–1353. [Google Scholar]
- Gershman, I.; Gershman, E.I.; Mironov, A.E.; Fox-Rabinovich, G.S.; Veldhuis, S.C. Application of the Self-Organization Phenomenon in the Development of Wear Resistant Materials—A Review. Entropy 2016, 18, 385. [Google Scholar] [CrossRef]
- Chakrabarti, D.J.; Laughlin, D.E. The Cr–Cu (Chromium–Copper) System. Bull. Alloy Phase Diagr. 1984, 5, 59–68. [Google Scholar] [CrossRef]
- Zhou, Z.; Gao, J.; Li, F.; Wang, Y.; Kolbe, M. Experimental determination and thermodynamic modeling of phase equilibria in the Cu–Cr system. J. Mater. Sci. 2011, 46, 7039–7045. [Google Scholar] [CrossRef]
- Glansdorff, P.; Prigogine, I. Thermodynamics Theory of Structure, Stability and Fluctuations; Wiley: London, UK, 1971. [Google Scholar]
Figure 1.
Characteristic dependence of the arc current and voltage on the arc burning time.
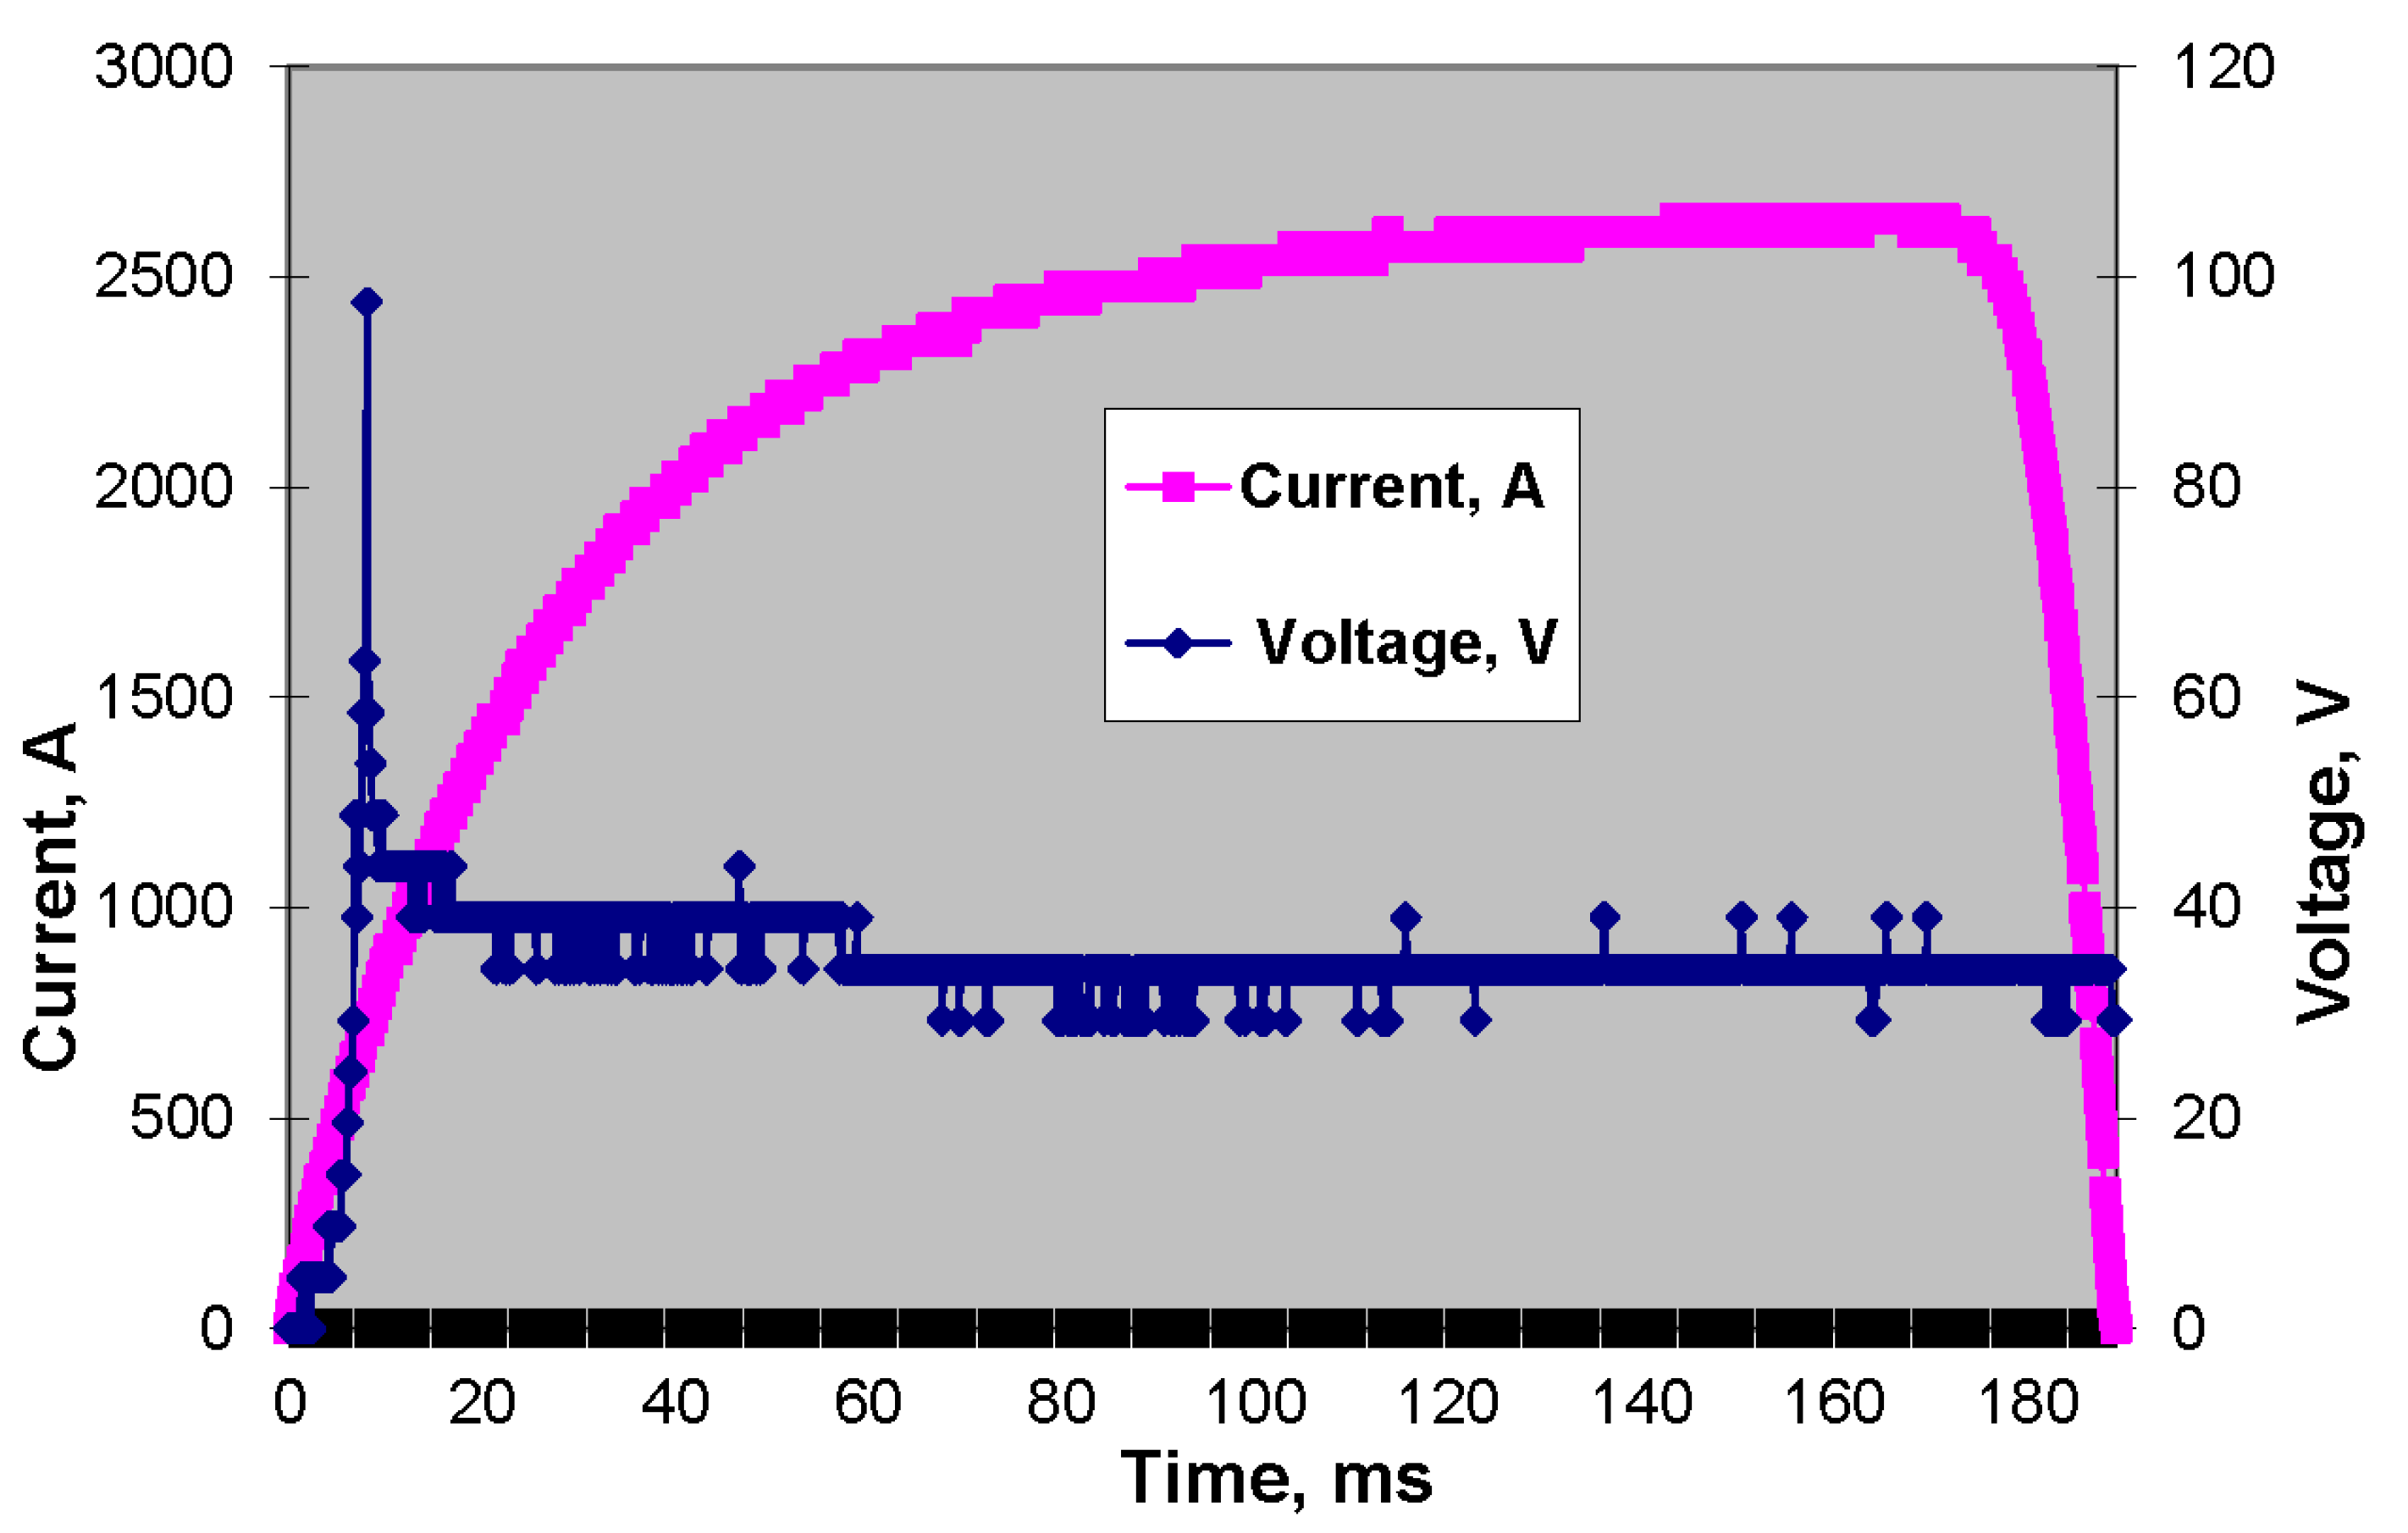
Figure 2.
Wear intensity of the Cu–Cr system based materials resulting from exposure to the electric arc.
Figure 2.
Wear intensity of the Cu–Cr system based materials resulting from exposure to the electric arc.

Figure 3.
Three characteristic zones within the structure of the Cu–45%Cr material after exposure to the electric arc (X320): 1—exposure zone of the electric arc; 2—zone enriched with chromium; 3—original material zone.
Figure 3.
Three characteristic zones within the structure of the Cu–45%Cr material after exposure to the electric arc (X320): 1—exposure zone of the electric arc; 2—zone enriched with chromium; 3—original material zone.
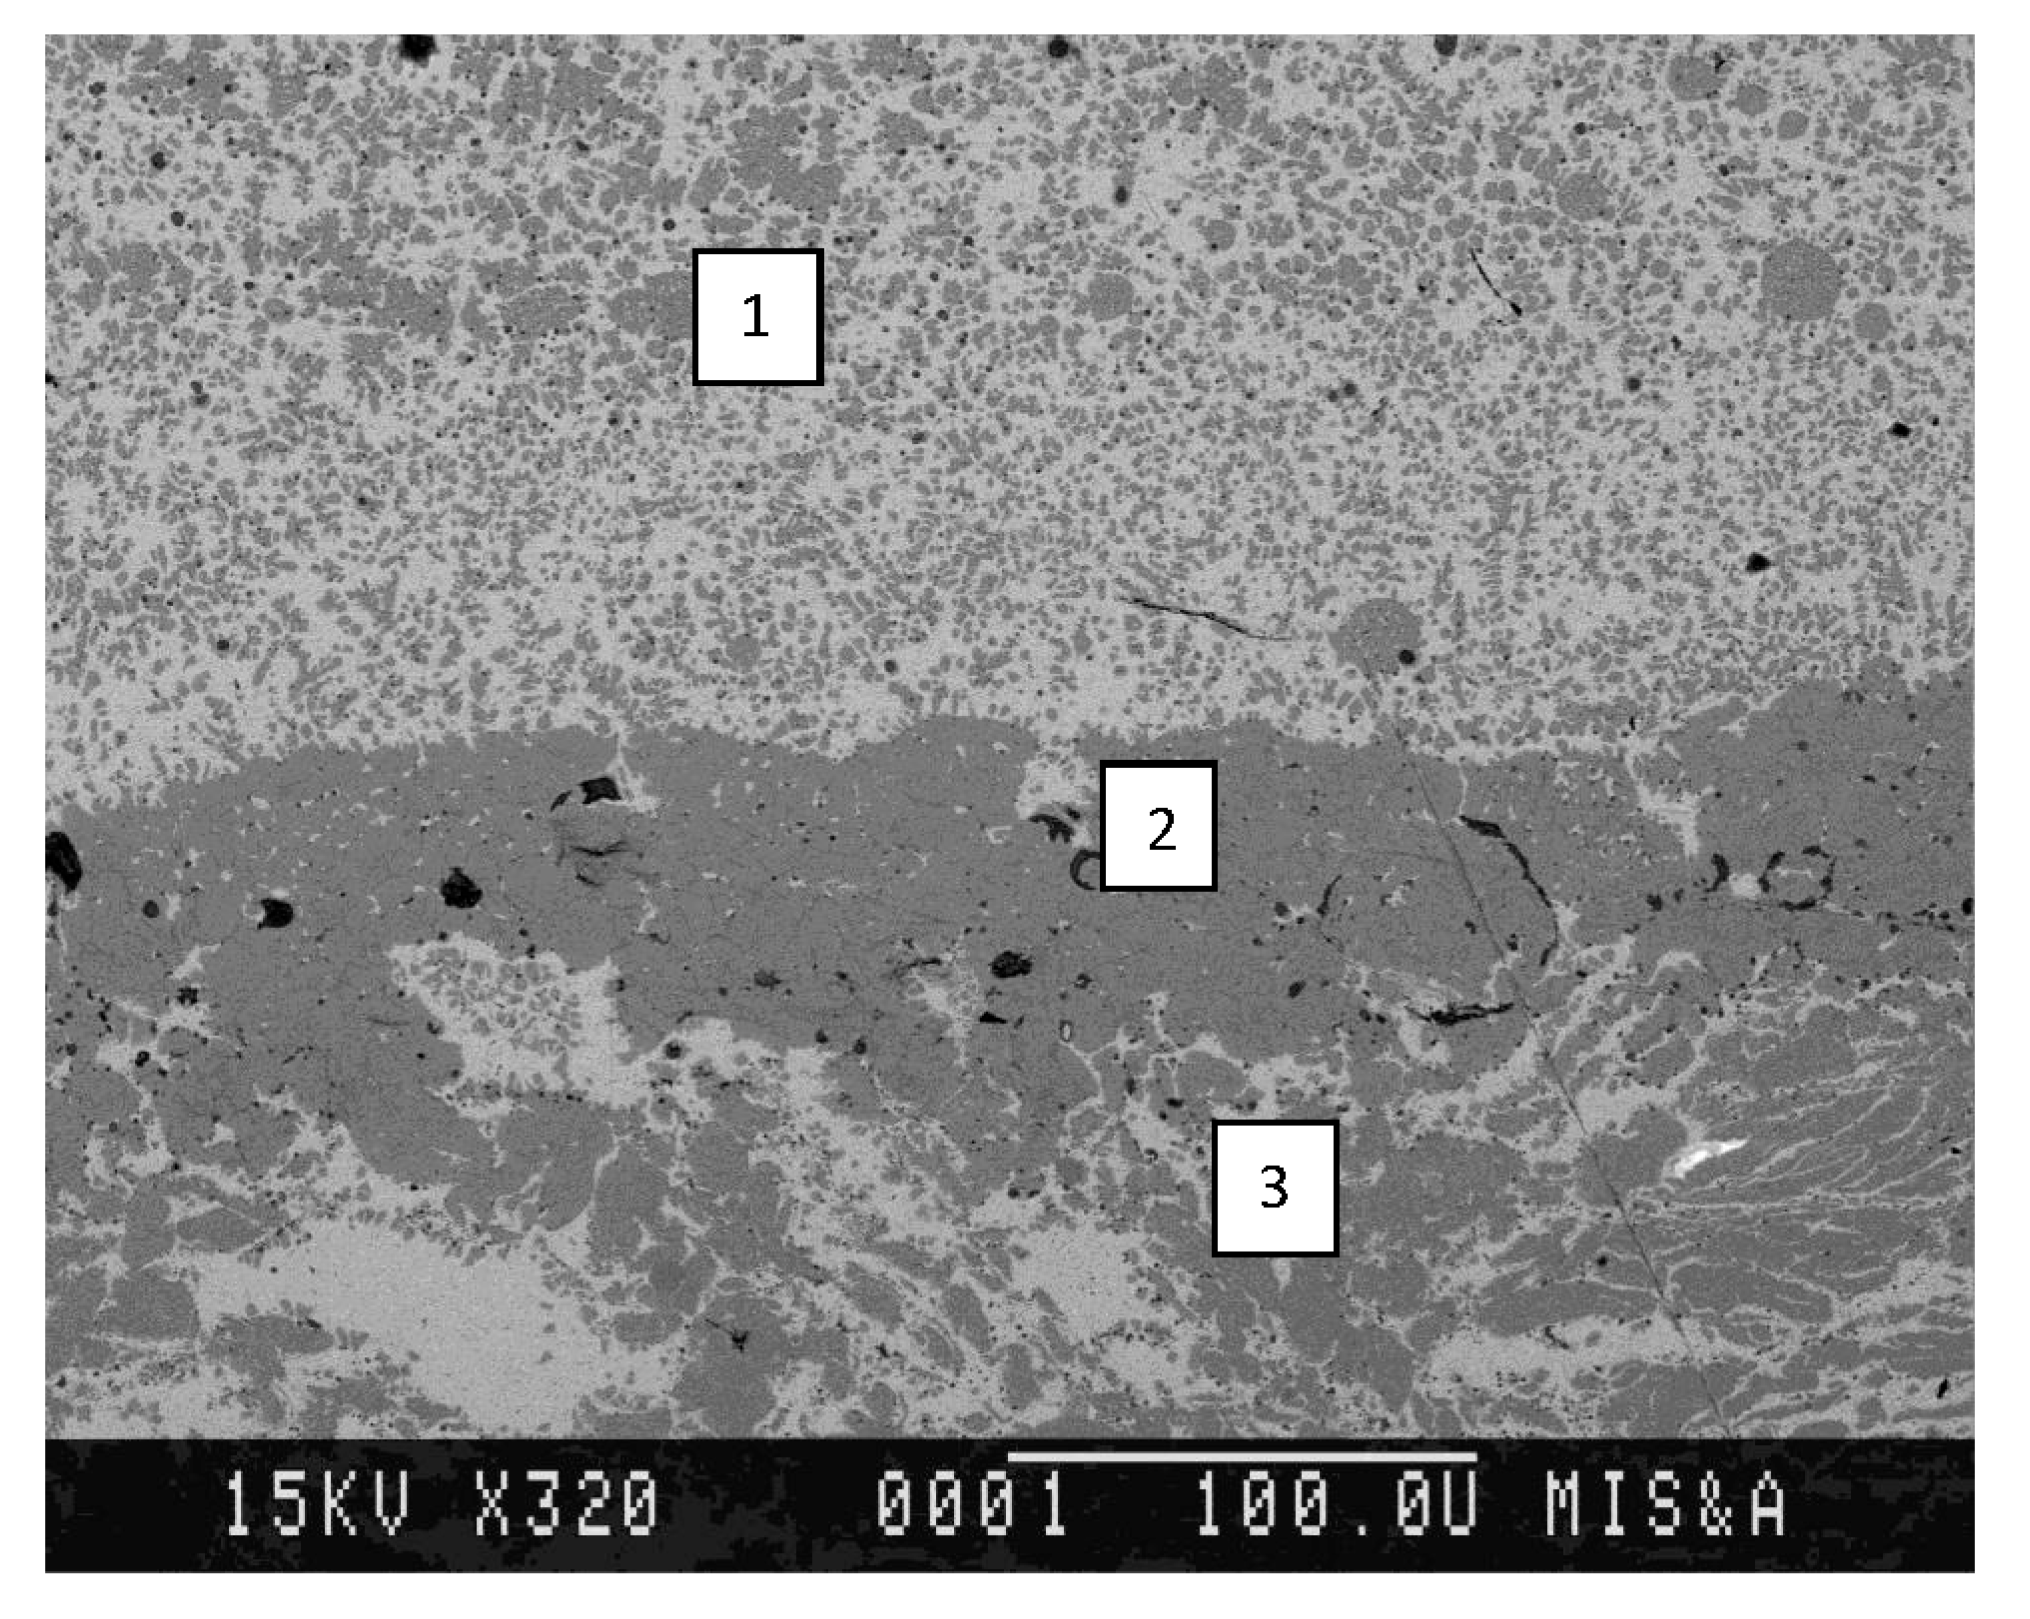
Figure 4.
Evaluation area of the chemical composition of the zone enriched with chromium. On the right, there is the exposure zone of the electric arc; on the left is the original material zone.
Figure 4.
Evaluation area of the chemical composition of the zone enriched with chromium. On the right, there is the exposure zone of the electric arc; on the left is the original material zone.

Figure 5.
Evaluation area of the original material composition at the distance of 250 μm from the zone enriched with chromium.
Figure 5.
Evaluation area of the original material composition at the distance of 250 μm from the zone enriched with chromium.

Figure 6.
Composition evaluation area of the arc exposure zone.
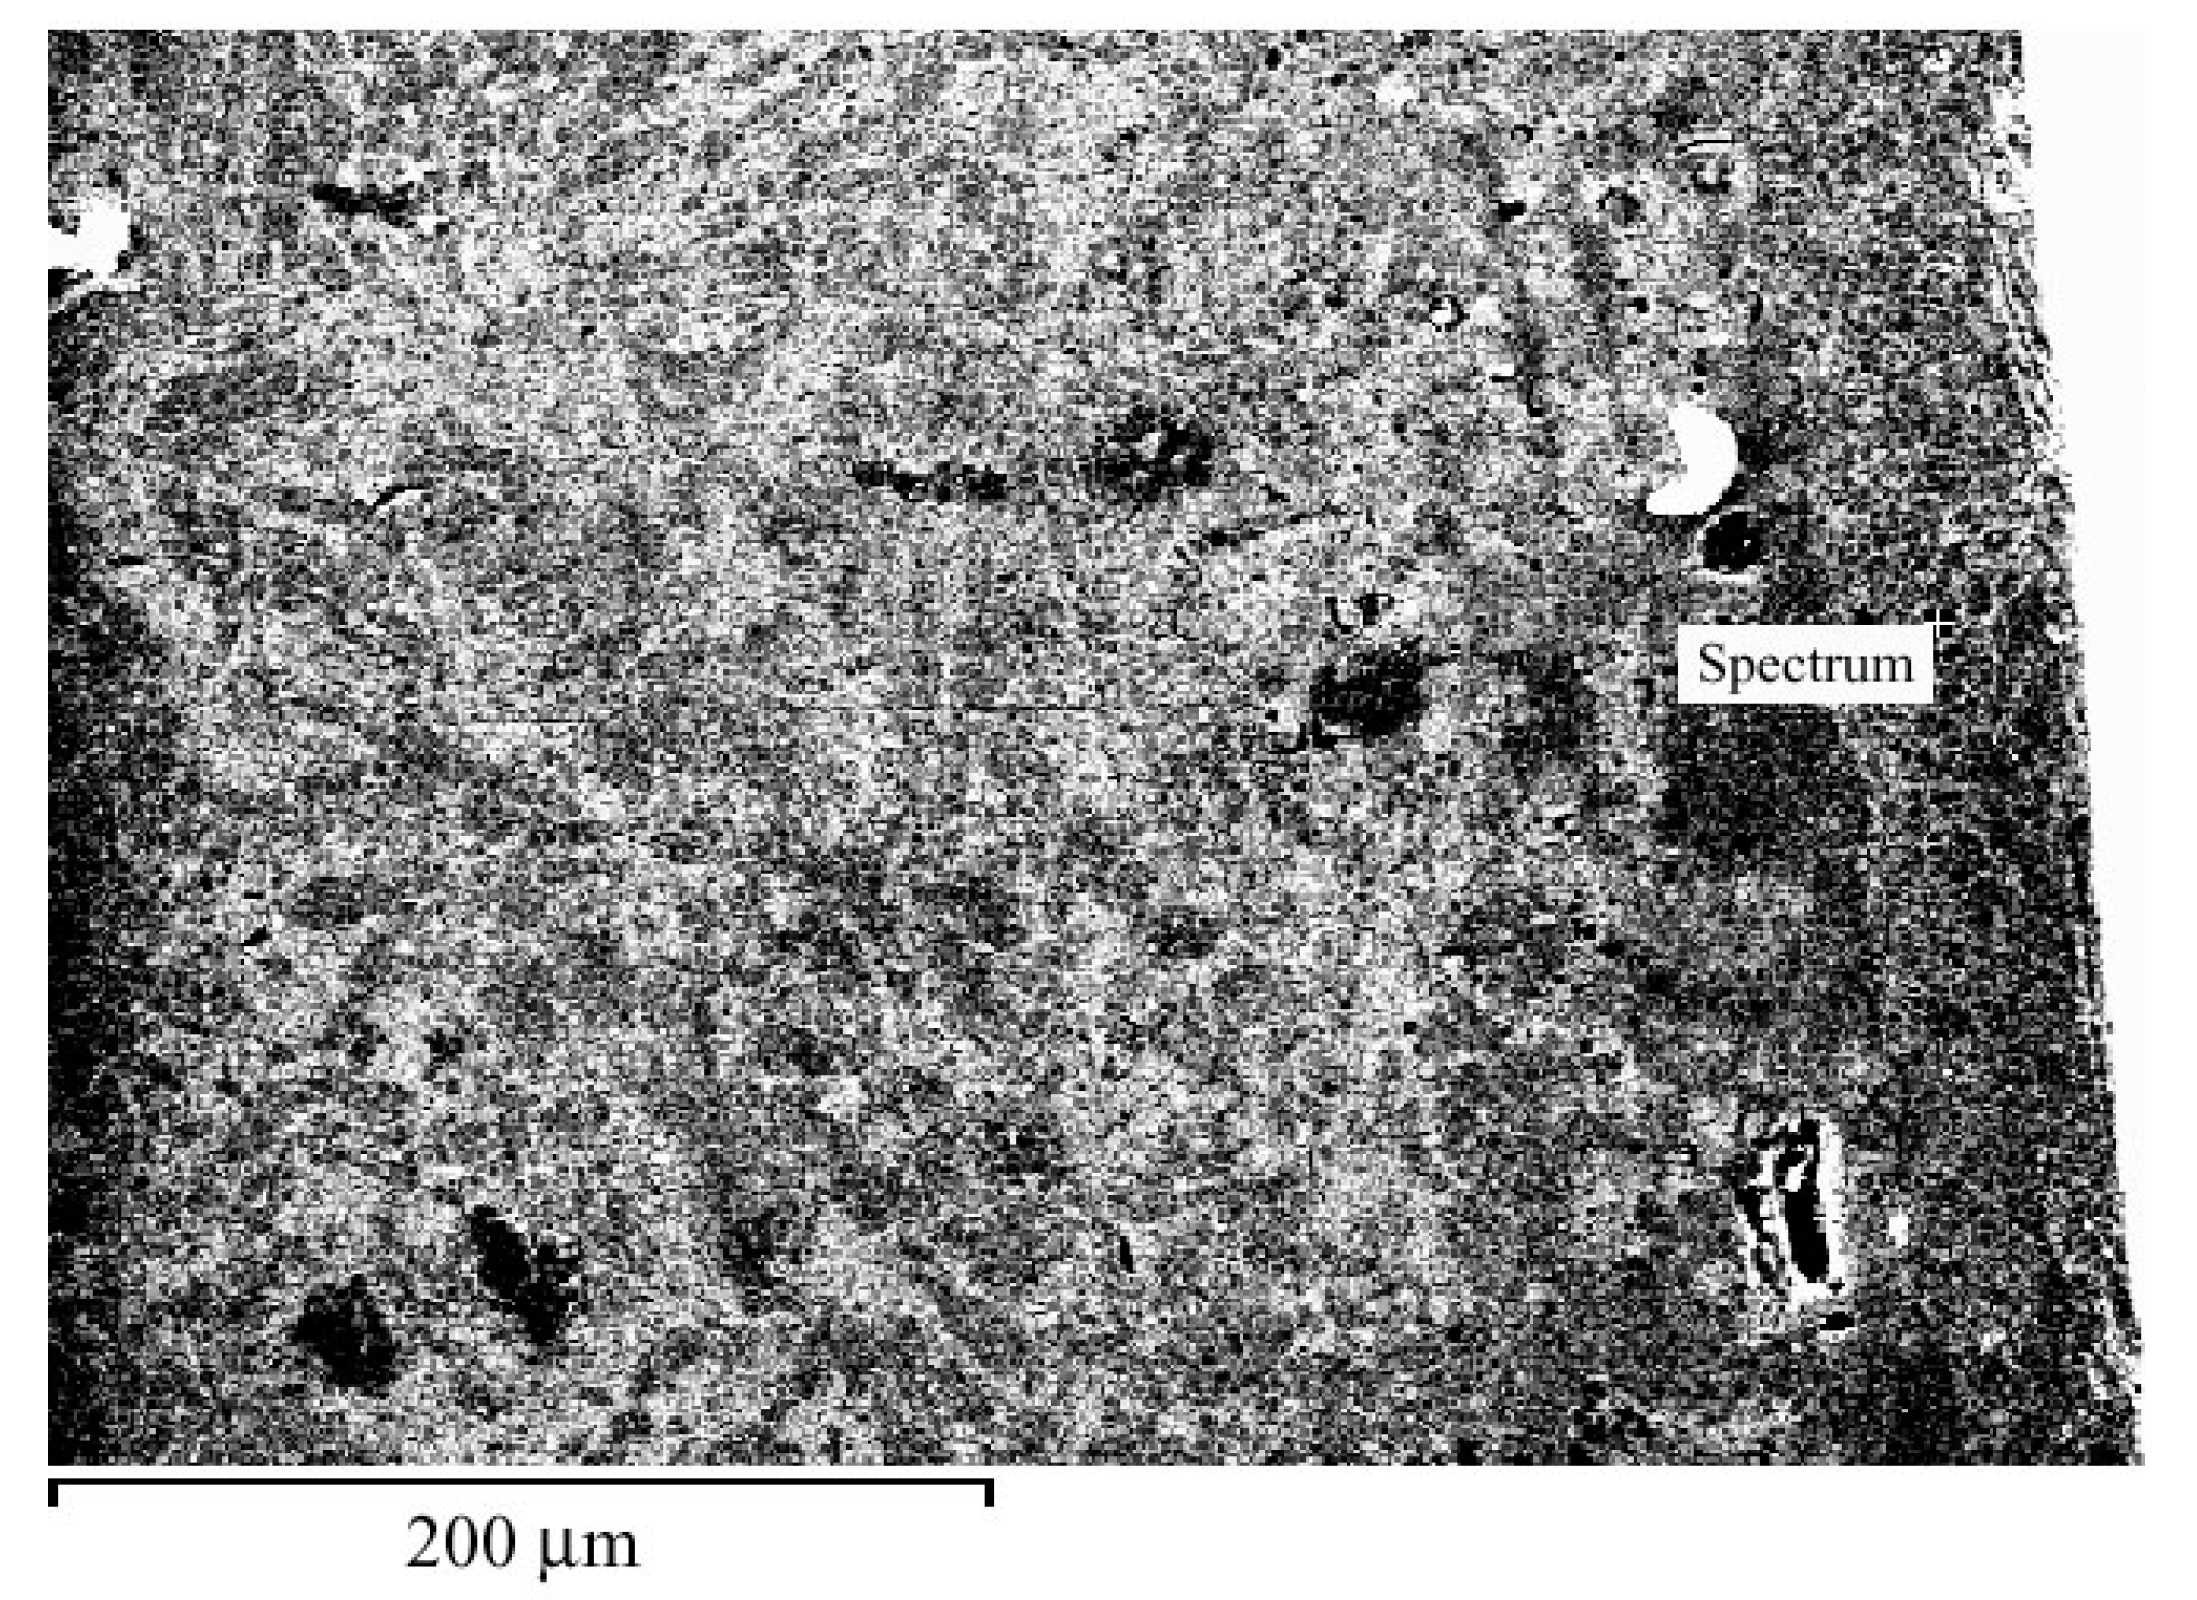
Figure 7.
The structure of the Cu–45%Cr material after (a) exposure to the electric arc and (b) dependence of the chromium, copper, and oxygen content on the distance from the surface of the arc exposure.
Figure 7.
The structure of the Cu–45%Cr material after (a) exposure to the electric arc and (b) dependence of the chromium, copper, and oxygen content on the distance from the surface of the arc exposure.
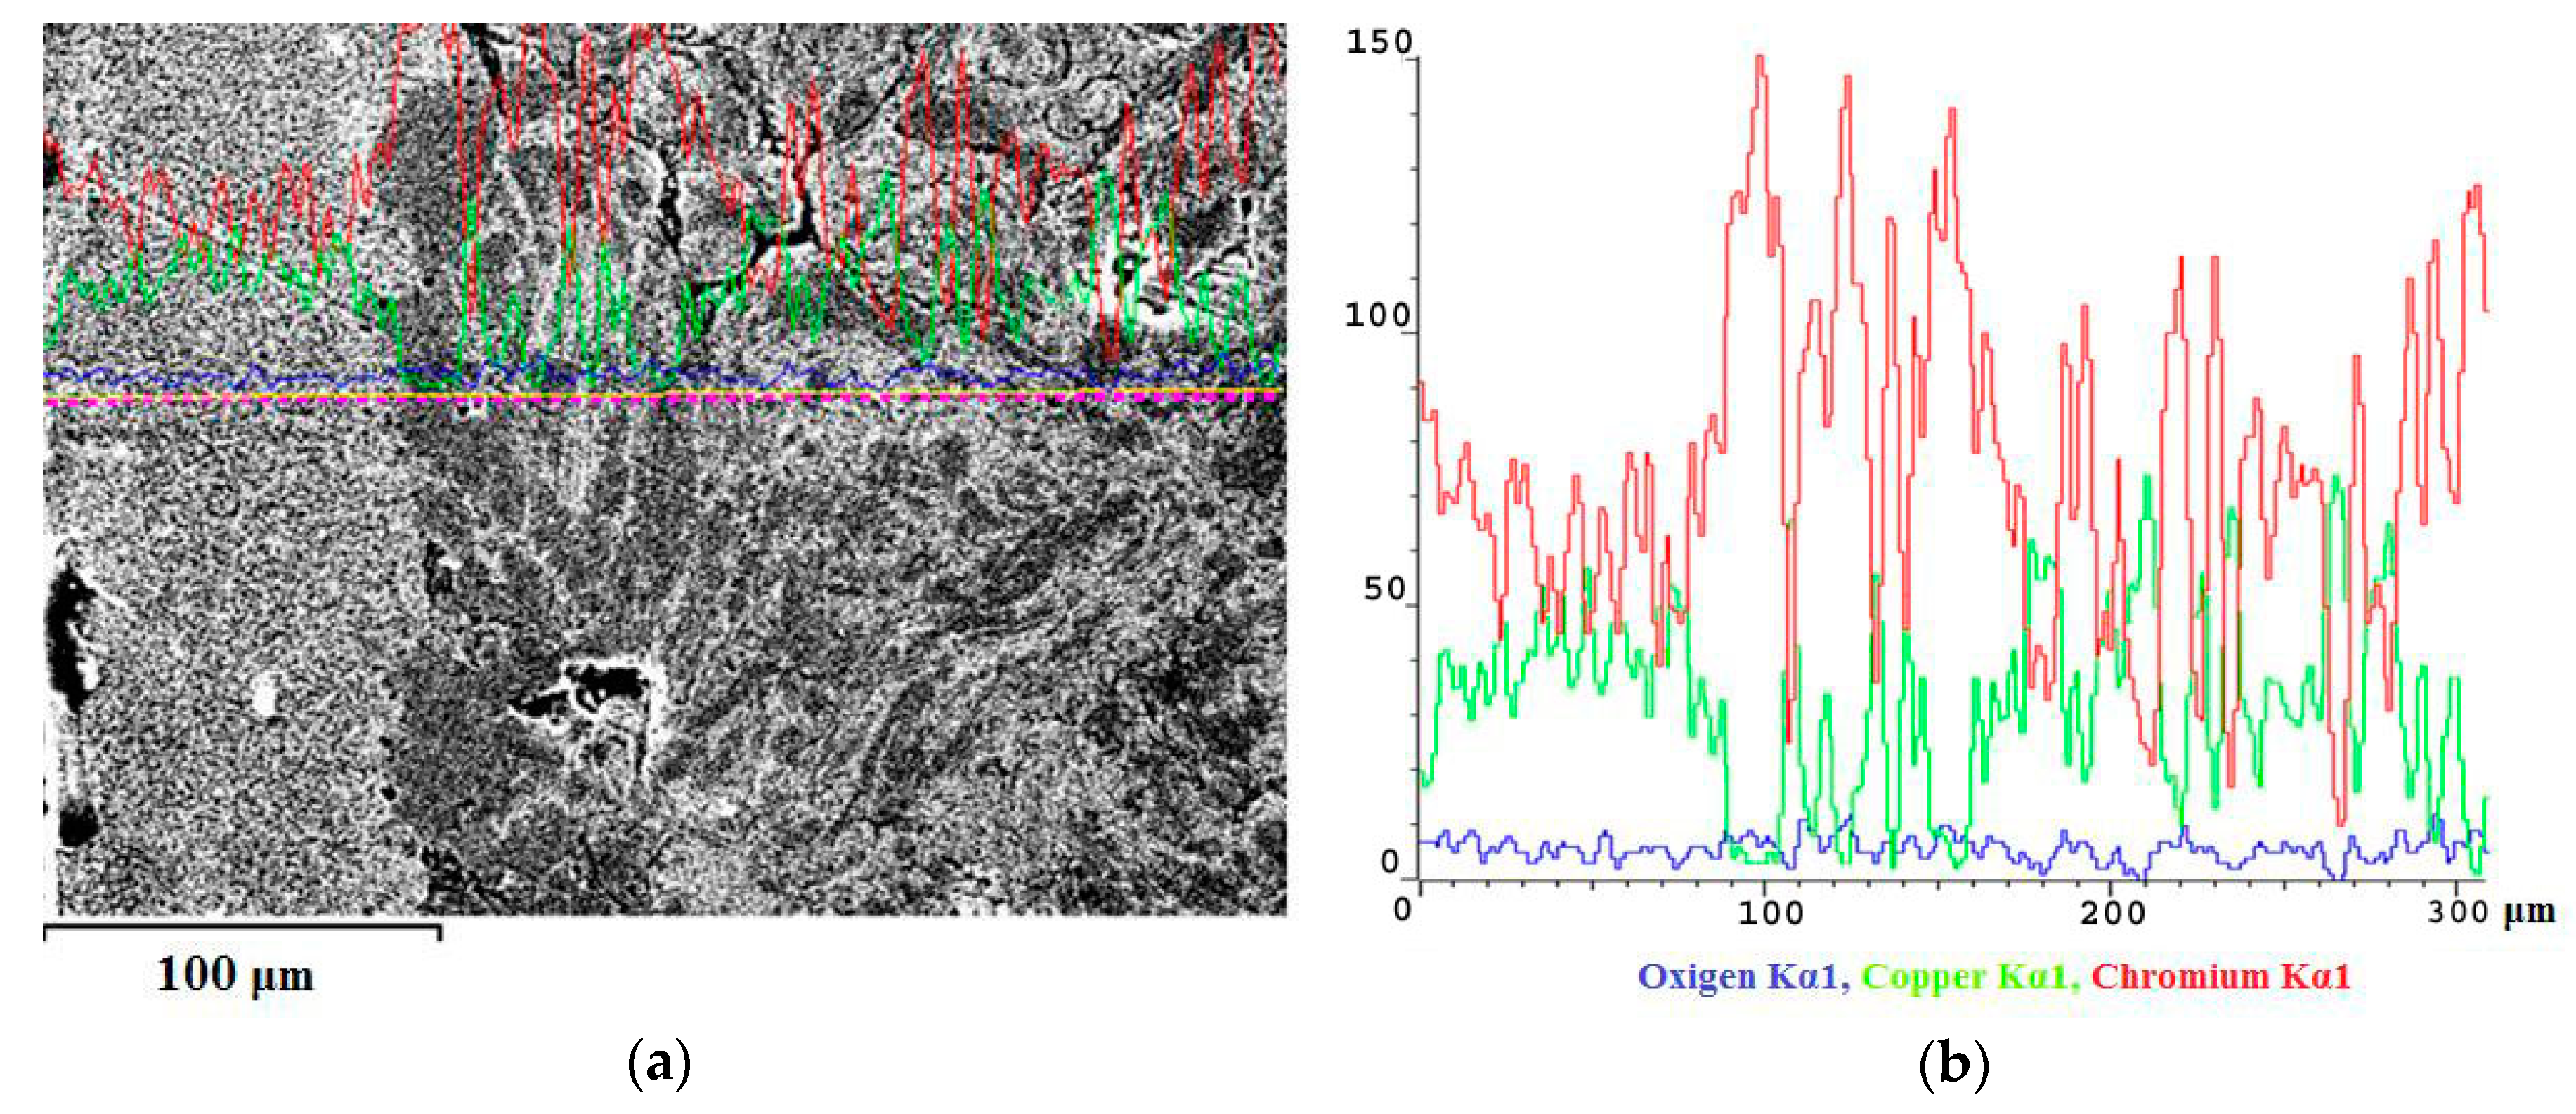
Figure 8.
The zone enriched with chromium and (а) the adjacent arc exposure zone; (b) Distribution maps of copper and (c) chromium.
Figure 8.
The zone enriched with chromium and (а) the adjacent arc exposure zone; (b) Distribution maps of copper and (c) chromium.

Figure 9.
Surface of the Cu–45%Cr material after exposure to the arc, on which (surface) the elemental composition was evaluated.
Figure 9.
Surface of the Cu–45%Cr material after exposure to the arc, on which (surface) the elemental composition was evaluated.

Figure 10.
Structure of the Cu–30%Cr material adjacent to the (а) arc exposure surface; (b) depth distribution of copper; (c) distribution map of chromium; (d) depth distribution of chromium and (e) map of copper. The arc exposure surface is located on the right in the figures.
Figure 10.
Structure of the Cu–30%Cr material adjacent to the (а) arc exposure surface; (b) depth distribution of copper; (c) distribution map of chromium; (d) depth distribution of chromium and (e) map of copper. The arc exposure surface is located on the right in the figures.


Table 1.
Properties of the Cu–Cr system materials.
| Material | Specific Conductivity, MS/m | Density, g/cm3 | % of Theoretical Density | |
|---|---|---|---|---|
| Actual | Theoretical | |||
| Cu–20%Cr | 18.8 | 7.93 | 8.53 | 92.99 |
| Cu–30%Cr | 16.0 | 8.01 | 8.33 | 96.18 |
| Cu–40%Cr | 15.9 | 7.72 | 8.15 | 94.74 |
| Cu–45%Cr | 15.0 | 7.60 | 8.06 | 94.33 |
| Cu–50%Cr | 14.8 | 7.56 | 7.97 | 94.81 |
Table 2.
Elementary composition of the surface area as shown in Figure 9.
Table 2.
Elementary composition of the surface area as shown in Figure 9.
| Element | Content, % by Weight |
|---|---|
| Cu | 30 |
| Cr | 44 |
| O | 26 |
© 2017 by the authors. Licensee MDPI, Basel, Switzerland. This article is an open access article distributed under the terms and conditions of the Creative Commons Attribution (CC BY) license (http://creativecommons.org/licenses/by/4.0/).
Share and Cite
MDPI and ACS Style
Gershman, I.S.; Gershman, E.I.; Mironov, A.E.; Fox-Rabinovich, G.S.; Veldhuis, S.C. On Increased Arc Endurance of the Cu–Cr System Materials. Entropy 2017, 19, 386. https://doi.org/10.3390/e19080386
AMA Style
Gershman IS, Gershman EI, Mironov AE, Fox-Rabinovich GS, Veldhuis SC. On Increased Arc Endurance of the Cu–Cr System Materials. Entropy. 2017; 19(8):386. https://doi.org/10.3390/e19080386
Chicago/Turabian StyleGershman, Iosif S., Eugeniy I. Gershman, Alexander E. Mironov, German S. Fox-Rabinovich, and Stephen C. Veldhuis. 2017. "On Increased Arc Endurance of the Cu–Cr System Materials" Entropy 19, no. 8: 386. https://doi.org/10.3390/e19080386
Note that from the first issue of 2016, this journal uses article numbers instead of page numbers. See further details here.