Thermal Transport and Entropy Production Mechanisms in a Turbulent Round Jet at Supercritical Thermodynamic Conditions


Institute of Energy and Power Plant Technology, Technische Universität Darmstadt, Darmstadt 64287, Germany
*
Author to whom correspondence should be addressed.
Entropy 2017, 19(8), 404; https://doi.org/10.3390/e19080404
Submission received: 1 July 2017
/
Revised: 29 July 2017
/
Accepted: 2 August 2017
/
Published: 5 August 2017
(This article belongs to the Section Thermodynamics)
Abstract
:In the present paper, thermal transport and entropy production mechanisms in a turbulent round jet of compressed nitrogen at supercritical thermodynamic conditions are investigated using a direct numerical simulation. First, thermal transport and its contribution to the mixture formation along with the anisotropy of heat fluxes and temperature scales are examined. Secondly, the entropy production rates during thermofluid processes evolving in the supercritical flow are investigated in order to identify the causes of irreversibilities and to display advantageous locations of handling along with the process regimes favorable to mixing. Thereby, it turned out that (1) the jet disintegration process consists of four main stages under supercritical conditions (potential core, separation, pseudo-boiling, turbulent mixing), (2) causes of irreversibilities are primarily due to heat transport and thermodynamic effects rather than turbulence dynamics and (3) heat fluxes and temperature scales appear anisotropic even at the smallest scales, which implies that anisotropic thermal diffusivity models might be appropriate in the context of both Reynolds-averaged Navier–Stokes (RANS) and large eddy simulation (LES) approaches while numerically modeling supercritical fluid flows.

1. Introduction
In various industrial applications, trans- and supercritical thermodynamic conditions are favored, like in propulsion rocket engines, gas turbines, diesel engines, supercritical steam generators in power plants, refrigerating systems with supercritical , supercritical drying and cleaning, etc. [1,2,3,4]. The main reasons to operate under such extreme conditions are to increase the thermal efficiency of processes, to reach higher specific energy conversion rates or to enhance heat and mass transport. This is mainly achieved at pressures and temperatures exceeding the critical point.
Above the critical point, fluid properties differ significantly from that of a perfect gas, and distinct liquid and gas phases do not exist (surface tension vanishes). When crossing the so-called pseudo-critical temperature, thermodynamic and fluid transport properties undergo a transition from a liquid-like to a vapor-like character. In the literature, this process is known as pseudo-boiling [5], and it resembles subcritical vaporization. However, in contrast to subcritical conditions, the isothermal vaporization is replaced by a continuous non-equilibrium process at supercritical pressures. High pressure real fluid effects merely distribute the latent heat over a finite temperature interval, and the thermal energy supplied is used to increase the temperature and overcome molecular forces simultaneously [5].
Within this narrow thermodynamic condition range, where the transport and thermodynamic properties vary significantly, the changes of the entropy generation rate are large, due to the irreversibility of thermofluid processes evolving, which is known as a natural consequence of the properties of the material. In a thermofluid system, the entropy production manifests itself essentially as a loss of degrees of freedom in the description of the laminar flow system behavior, as well as the turbulence structure of the flow in the fluid, since in both cases, one deals with the parameterization of the processes taking place on the micro- or meso-scale, which are not resolved by the balance laws [6]. The consideration of the second law of thermodynamics along with the entropy generation appears therefore useful in order to delineate favorable locations of handling while determining the causes of irreversibilities [7], also for supercritical thermodynamic conditions.
Bejan [7,8] carried out an extensive theoretical work based on the minimization of entropy generation in fluid flow processes and showed that the entropy generation rate could be used as an effective tool for the optimum design of thermal systems. Som et al. [9] reviewed the earliest studies on thermodynamic irreversibility and exergy analysis in the process of the combustion of gaseous, liquid and solid fuels. In natural and mixed convection system flow, Oztop et al. [10] reviewed the entropy generation exploitation, while other authors focused on laminar and turbulent forced convection (see [11]). A recent review by Sciacovelli et al. [12] provided a good documented report of contributions to the theory and application of entropy generation analysis to different types of engineering systems. Especially, focus was put on contributions oriented toward the use of entropy generation analysis as a tool for the design and optimization of engineering systems. Further, the second law of thermodynamics has also been introduced by Ahmadi [13] and Sadiki et al. [6,14] as a tool to formulate thermodynamically-consistent turbulence models.
Regarding second law analyses in turbulent supercritical flows, Sierra-Pallares et al. [15] performed Reynolds-averaged Navier–Stokes (RANS) simulations to track the areas of irreversibility in trans- and supercritical injection of cryogenic fluids while using different Prandtl numbers in the turbulence models under evaluation. Within this study, it is shown that entropy production rates in cryogenic injection are dominated by heat transport effects and not by viscous dissipation. Other researchers applied direct numerical simulations (DNS) [16] and large eddy simulations (LES) [17] to examine entropy generation rates in supercritical transitional mixing layers. The authors provided entropy production rates arising from viscous stress, species mass fluxes and heat fluxes and showed that the entropy production rates are fundamentally different from their subcritical counterpart.
Focusing essentially on turbulence modeling in supercritical flows, Sierra-Pallares et al. [18] undertook a RANS study to assess turbulence models by discerning which is the most suitable choice when dealing with supercritical fluids. Studies related to LES have been reported in [19,20]. Thereby, the subgrid scale (SGS) models applied have been developed for subcritical flow conditions. The question is to what extent these SGS models are suitable for supercritical fluids [21,22,23]. Despite some attempts at addressing this issue, a satisfactory answer is still open due to the lack of valuable experimental data at such extreme thermodynamic conditions or comprehensive required DNS data under realistic operating conditions.
Regarding numerical benchmarks for supercritical flows, Ruiz et al. [24] performed a two-dimensional DNS to provide a validation test case for high Reynolds number supercritical flows with large density gradients in simple mixing layer configurations containing the essential features of real devices (geometry, thermodynamics and hydrodynamics). In the case of wall flows and heat transfer under trans- and supercritical conditions, Kawai [25] used a three-dimensional DNS to gain more insight into the turbulent boundary layer phenomena at supercritical pressure and the turbulent heat transfer characteristics. Within this study, the author provided mean velocity profiles, Reynolds stresses, budget terms of the turbulent kinetic energy, etc. Focusing on high-pressure single species fluid jets, Ries et al. [26] performed recently a three-dimensional DNS of the turbulent flow field in a round jet of cryogenic nitrogen, which mimics the experiment by Mayer et al. [27] in terms of geometry, thermodynamics and hydrodynamics, but at a reduced Reynolds number. A comprehensive dataset for model development and validation could then be generated (see [26]).
The present paper extends the previous study by Ries et al. [26] in investigating the thermal transport and entropy production mechanisms in the same supercritical fluid system (a turbulent round jet of compressed nitrogen at supercritical thermodynamic conditions) with three specific objectives. First, the physical mechanisms, which govern the thermal transport and its contribution to the fuel disintegration and mixture formation, are explored. Secondly, the anisotropy of heat fluxes and temperature scales is analyzed to evaluate the suitability of some existing modeling approaches. Thirdly, the entropy production during thermofluid processes evolving in the supercritical flow is analyzed in order to identify the causes of irreversibilities and to display advantageous locations of handling along with the process regimes favorable to mixing.
The paper is organized as follows. Section 2 outlines the thermodynamic principles at supercritical conditions and the governing equations employed. In particular, the second law of thermodynamics in the form of entropy transport equation including entropy production rates is introduced. Next, the configuration and numerical procedure is briefly described in Section 3. The achieved results are presented and discussed in Section 4. Finally, some concluding remarks are given in Section 5.
2. Thermophysical Formulation
In this section, governing equations, thermodynamic models and entropy principle applied in the present study are introduced and evaluated for fluid flow at supercritical thermodynamic conditions.
2.1. Balance Equations
In the case of incompressible fluid flow with variable physical properties and no body force (gravitational or electromagnetic force), the balances of mass density , momentum and sensible enthalpy h are:
where is the velocity, p the hydrodynamic pressure, the viscous stress tensor and the heat flux. Assuming Navier–Stokes–Fourier fluid, the viscous stress tensor is given as:
where is the molecular viscosity. The heat flux is expressed by:
where is the thermal conductivity and the heat capacity of the fluid.
2.2. Thermodynamic and Transport Models
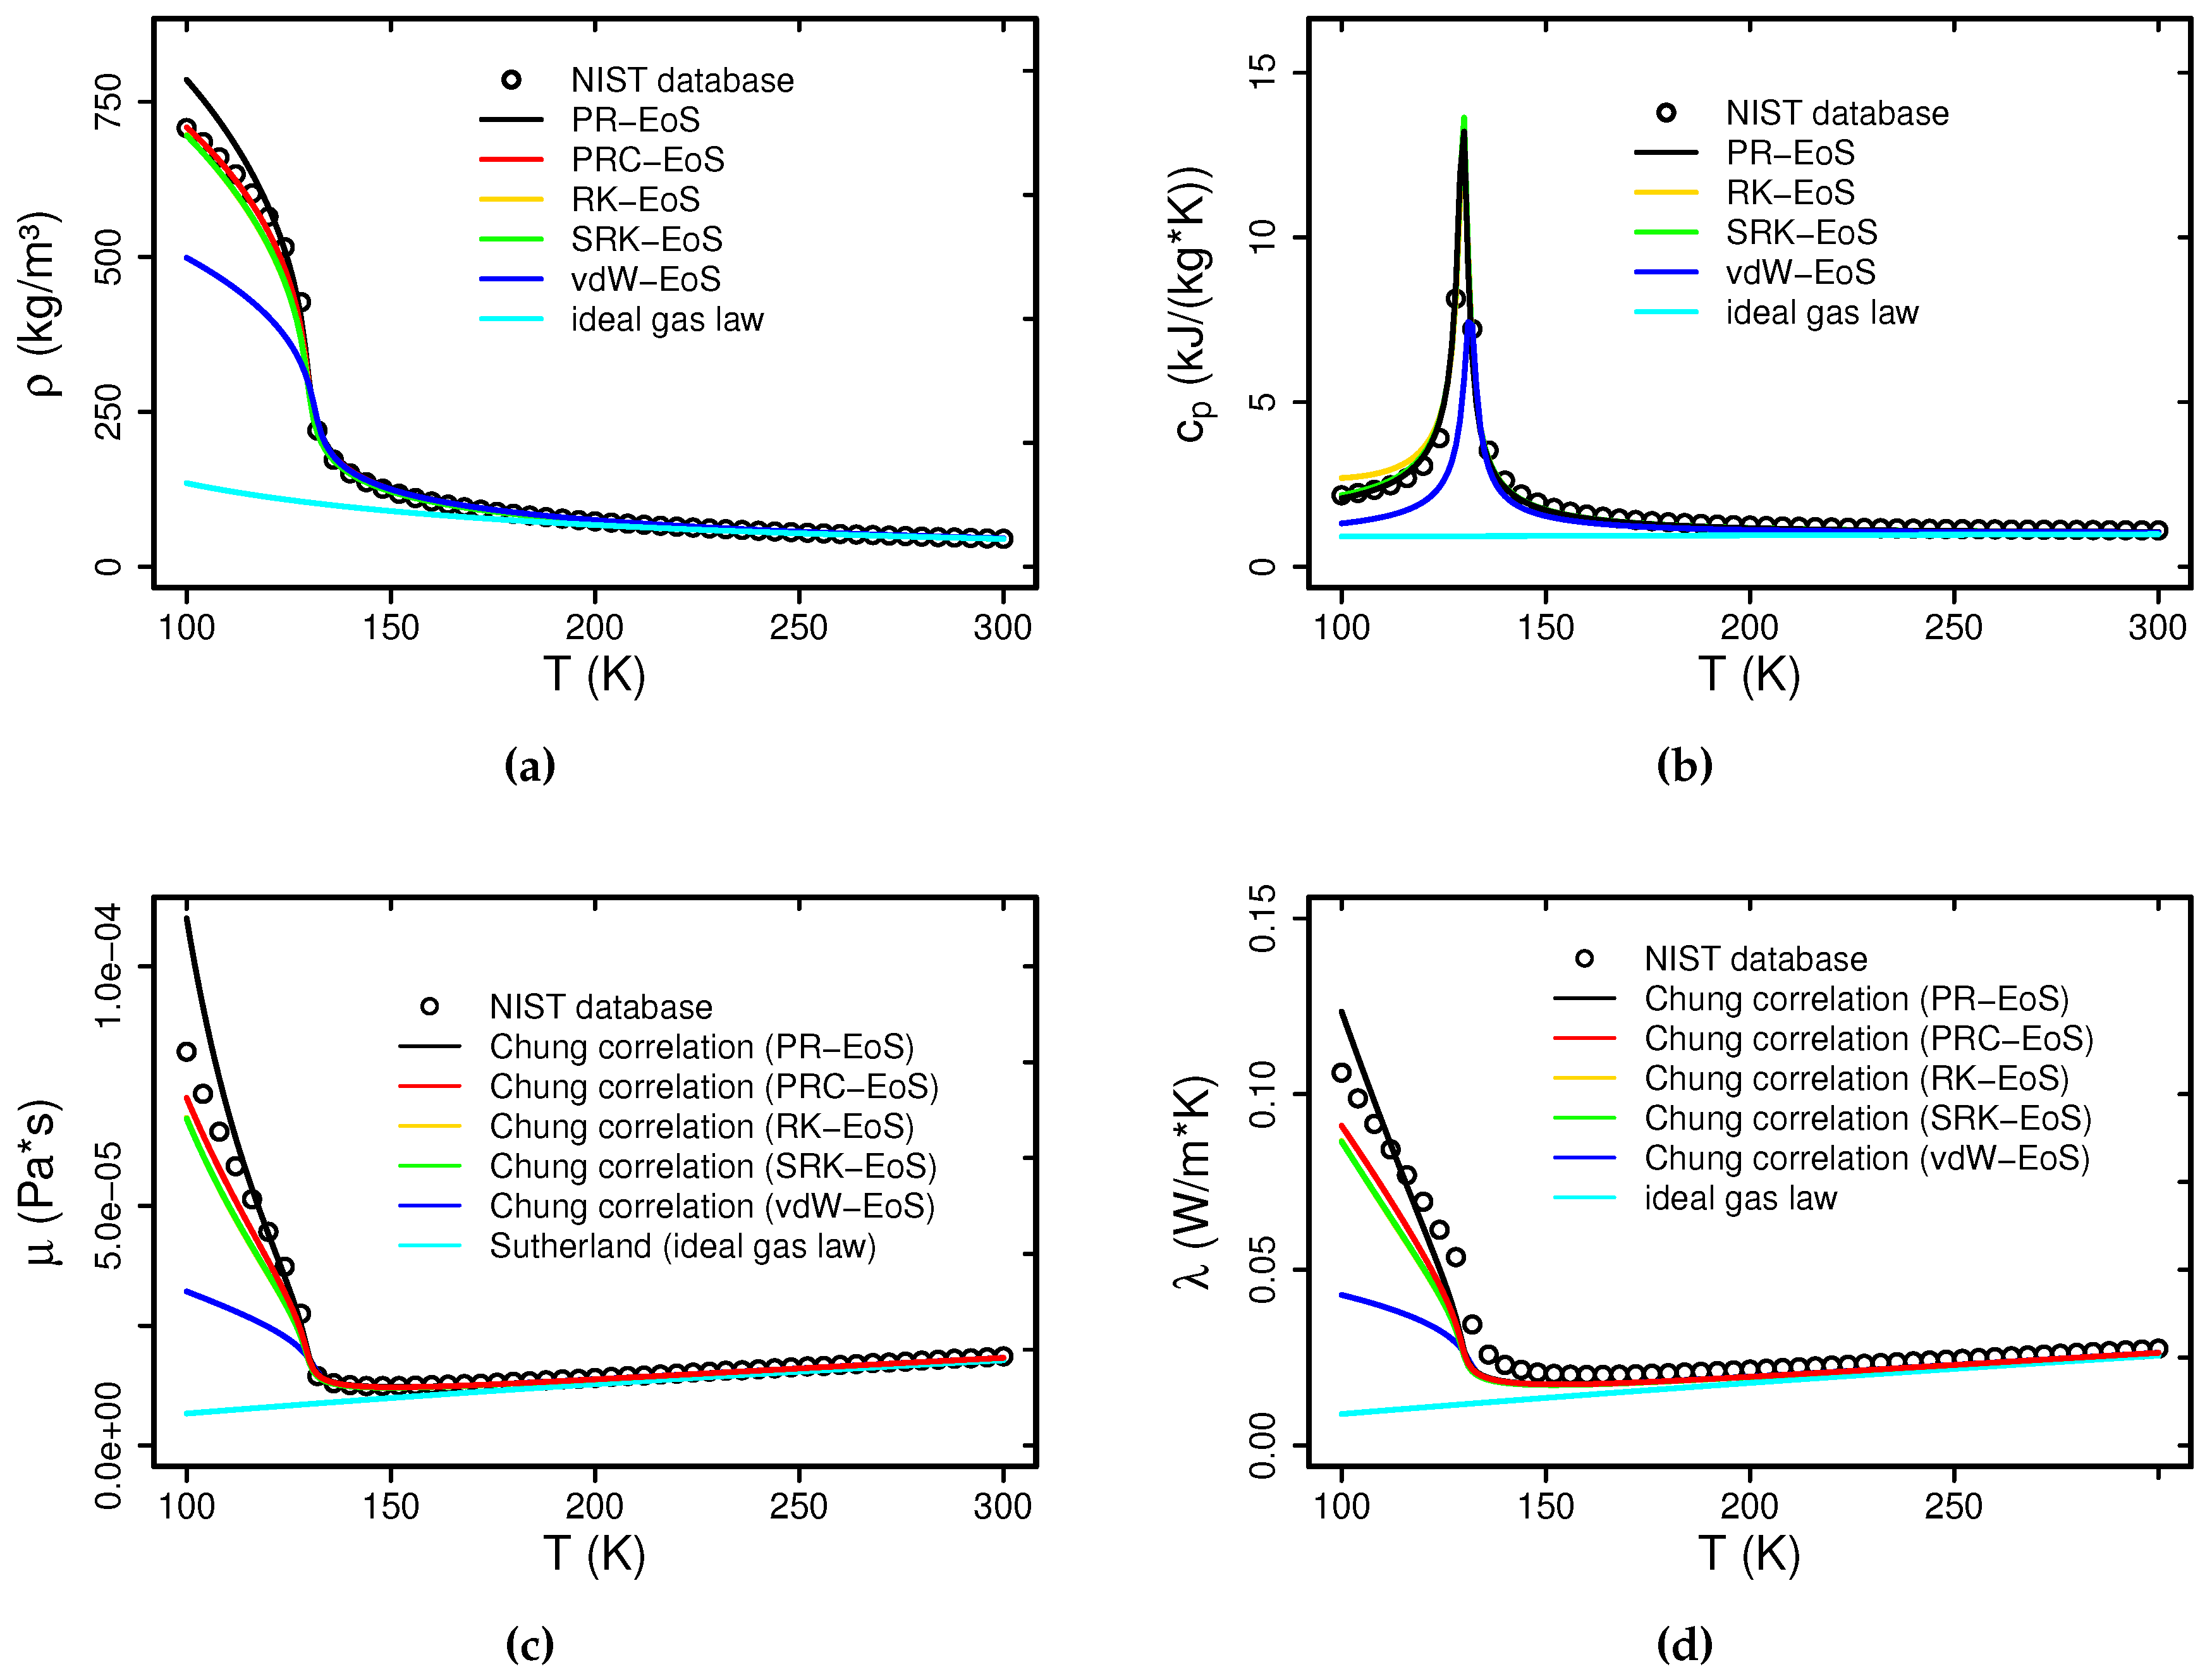
In order to close the set of governing Equations (1)–(3), expressions for , h, , and in terms of local temperature and thermodynamic pressure are required. Figure 1 presents profiles of mass density, isobaric heat capacity, molecular viscosity and thermal diffusivity of nitrogen at bar ( bar). Commonly-used cubic equations of state (EoS), the van der Waals equation (vdW-EoS) [28], the Peng–Robinson equation (PR-EoS) [29], the Redlich–Kwong equation (RK-EoS) [30], the Soave–Redlich–Kwong equation (SRK-EoS) [31] and the ideal gas law are examined. Additionally, a generalized volume-translation method proposed by Abudour et al. [32] is considered along with the PR-EoS (here denoted as corrected Peng–Robinson PRC-EoS). Non-ideal correction of sensible enthalpy and isobaric heat capacity are expressed in terms of departure functions derived from the particular EoS, whereas quantities for the hypothetical, ideal gas state are calculated using seven-coefficient NASA polynomials [33] (National Aeronautics and Space Administration). Note, as pointed out by [20] and others, that it is not feasible to include the volume-translation method of [32] in the caloric equation of state. Therefore, no values are shown for the PRC-EoS. Regarding transport properties, the correlations of Chung et al. [34], applicable for dilute and dense fluids, are applied for viscosity and thermal conductivity. All results are evaluated against reference data from [35].
In the range of the present operating conditions, the PRC-EoS, RK-EoS and SRK-EoS are well suited to predict the mass density of nitrogen, while the PR-EoS without volume translation, vdW-EoS and ideal gas law yield poor prediction at low temperatures. Regarding isobaric heat capacity, predicted values from the PR-EoS, RK-EoS and SRK-EoS are in good agreement with the reference data. These EoS are able to capture the non-ideal behavior close to the critical temperature. In contrast, the vdW-EoS and ideal gas law are not able to predict the sharp peak close to the critical temperature properly. Just as with the thermodynamic properties, the correlations of Chung et al. [34] combined with PRC-EoS, RK-EoS and SRK-EoS are well suited to predict the molecular viscosity and thermal diffusivity over the entire temperature range. Again, the vdW-EoS and ideal gas law yield poor prediction at low temperatures.
Obviously, the choice of an accurate equation of state is essential at supercritical thermodynamic conditions. Especially for low temperatures, where real gas effects dominate, the predictive quality of the EoS varies considerably. In line with the results above, the PRC-EoS combined with the correlations of Chung et al. [34] are used in the present study. Further details about the thermodynamic models employed can be found in [26].
2.3. Entropy Principle and Irreversibility
As pointed out above, entropy production in thermofluid processes is a natural consequence of the properties of materials [6]. It is linked to the amount of available work and can be used to evaluate sources of irreversibilities [7]. In the case of single phase, non-reacting and single component fluid flow with Fourier heat conduction, the second law of thermodynamics can be expressed in the form of the local imbalance of entropy given as [36]:
where s denotes the entropy density, the entropy production rate by viscous dissipation and the production by heat transport. The source terms and are always non-negative at all times, such that the imbalance of entropy holds.
Focusing on Navier–Stokes–Fourier fluid flow, the entropy production rate by viscous dissipation reads [6,36]:
and by heat transport:
Both contributions exist at the microscopic (molecular) and a mesoscopic (turbulent) level, associated with mean and fluctuating quantities [6]. Considering thermofluid processes at supercritical conditions, and contain additionally contributions due to real gas effects, e.g., changes in molecular potential energy at the supercritical state transition.
3. Configuration and Numerical Procedure
The selected test case, nitrogen injection at supercritical conditions, is first introduced. Then, the numerical procedure along with the computational setup for the direct numerical simulation is described.
3.1. Test Case
In accordance with the experimental study of ([27], Case 3), a cryogenic round jet injected into a warm nitrogen environment at supercritical conditions is investigated. The cold nitrogen jet emanates from a fully-developed turbulent pipe flow ( bar, mm, K, ) and streams into a large chamber, which is filled with warm nitrogen ( bar, K). In contrast to the experimental study, a smaller inlet velocity is chosen in the present numerical simulation leading to a reduced Reynolds number of . However, geometric dimensions of the configuration and thermodynamic operating conditions are kept identical to the experimental investigation. The thermodynamic and flow conditions of the supercritical nitrogen jet simulation are summarized in Table 1. Further information about the experimental and numerical test case can be found in [26,27].
3.2. Computational Setup
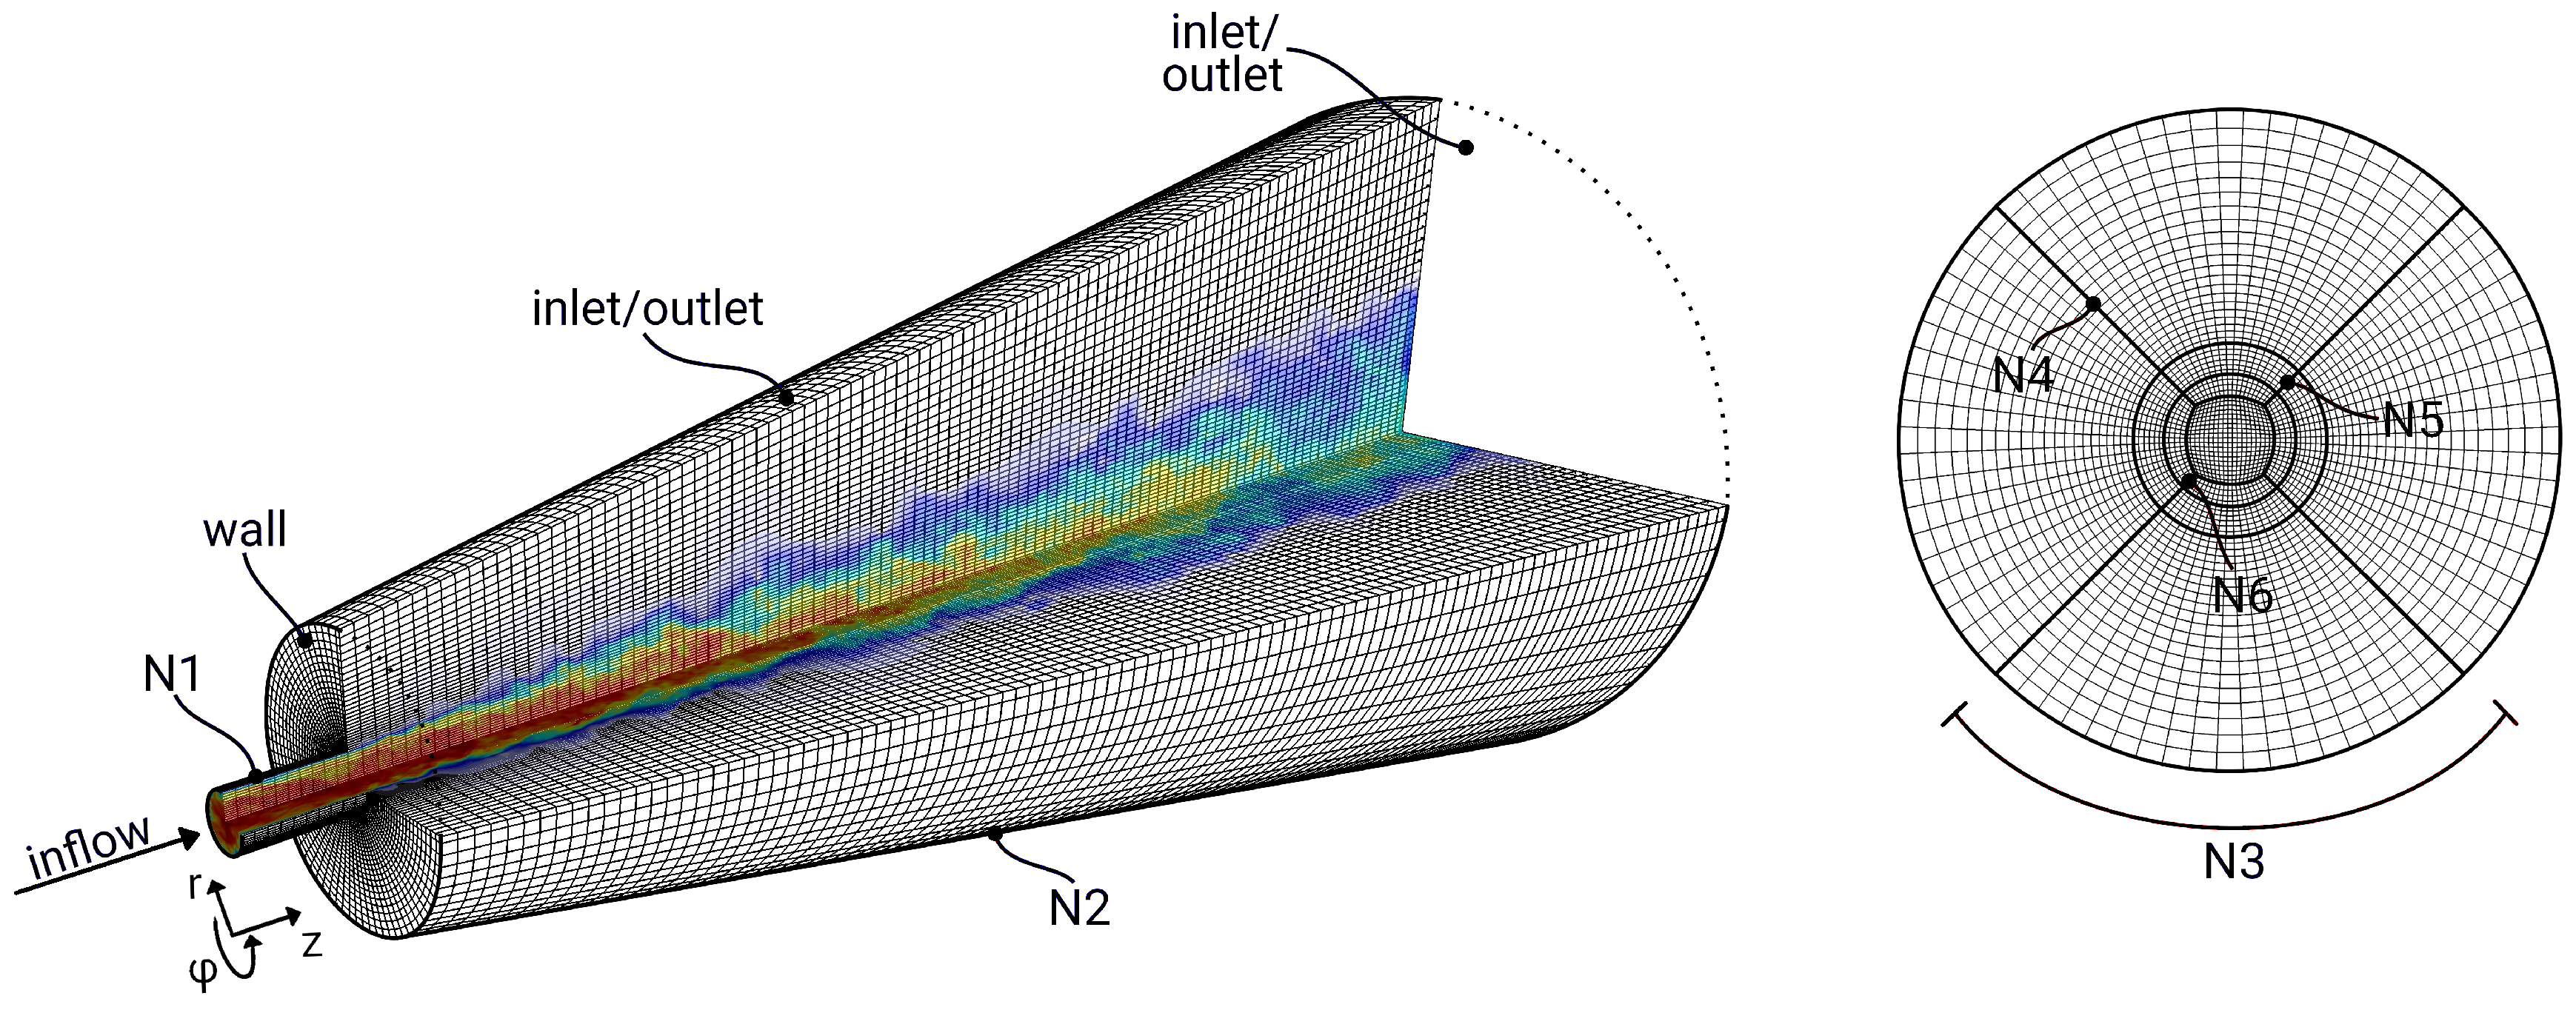
Only a small portion of the experimental chamber, corresponding to the region of interest, is simulated in the present study. The computational domain consists of an injection part with a length of 2 D and a portion of the chamber with a length of 32 D. To capture the spreading of the jet, the extent of the chamber part is increased gradually from 5 D at the injection region up to 18 D at the outflow. A representation of the three-dimensional numerical grid is coarsely depicted in Figure 2, in which one quarter of the grid is removed to qualitatively visualize the evolution of the jet.
A block-structured, three-dimensional numerical grid is employed in the present study. It consists of approximately 48 million cells and is refined around the injection region and throughout the jet’s core. As shown in the previous study [26], the selected spatial resolution enables grid-independent turbulence statistics, which ensures that the quantities of interest depend only on the physics and are no more affected by the numerical approaches used.
The jet inflow is generated by a separate direct numerical simulation of a fully-developed turbulent pipe flow at (see [26]). The instantaneous flow field is recorded at the middle section of the pipe domain and stored for each time step in a database. These data are utilized as realistic turbulent inflow conditions of the jet simulation. At the outflow, a velocity inlet/outlet boundary condition is imposed to allow entrainment of fluid from the surroundings. Thereby, incoming fluid velocity is obtained by the internal cell value, while the Neumann condition is applied in the case of outflow. At the walls, no-slip condition is applied.
3.3. Numerical Procedure
The balance equations are generally solved using a low Mach-number approach based on a merged PISO (Pressure Implicit with Splitting of Operator) [37] and SIMPLE (Semi-implicit Method for Pressure Linked Equations) [38] algorithm, which is added to the open source C++ library OpenFOAM 2.4.0. Thereby, the pressure and density are formally decoupled by defining the density through the PRC-EoS expressed in terms of local temperature and constant thermodynamic pressure. A second order central differencing scheme is utilized for the convection terms and a second order, conservative scheme for the Laplacian terms. To ensure total variation diminishing, a second order minmod differencing scheme [39] is applied in the case of enthalpy fluxes. Regarding temporal discretization, a second order backward integration method is used for all time derivative terms. Details about the discretization and numerical procedure can be found in the OpenFOAM Programmer’s guide [40] and in the previous study [26].
4. Results
In this section, the achieved results of the DNS of nitrogen injection at supercritical conditions are presented and discussed. First, for the convenience of the reader and to make the paper self-consistent, relevant results from the previous study [26] are briefly summarized. Then, analyses of thermal transport and entropy production rates are provided. Thereby, the contributions of these processes to the jet disintegration are highlighted.
4.1. Summary of the Previous Study in [26]
In the previous study [26], it was shown that distinctive features of the jet disintegration process are different at supercritical conditions compared to subcritical jets. Typically, under subcritical conditions, the break-up process results from acting surface tension, which induces ligament formation, atomization and evaporation. Once the supercritical state is reached, surface tension vanishes, and no sharp interface exists between cold liquid-like and warm gas-like fluids. This can be seen in Figure 3, which depicts the instantaneous density field at the mid-plane section of the supercritical jet. Exemplarily, the evaluation of the liquid-like jet up to = 20 into the gas-like ambient nitrogen is shown.
In addition to the vanishing surface tension, several features of the jet flow, like spreading rate, turbulence statistics, the balance of turbulent kinetic energy and the disintegration process, were found substantially different from those of subcritical, isothermal jets. Deviations from subcritical jets arise primarily from thermodynamic effects rather than turbulence dynamics phenomena, especially in the case of the disintegration process. This leads to a characteristic variation of mean and root-mean-square density along the centerline, as shown in Figure 4.
Close to the injector, the liquid-like core of the jet is almost unaffected by the gas-like surrounding. Thus, mean density remains constant, and density fluctuations are zero. Then, dense pockets of liquid-like nitrogen are separated from the core and persist for a significant length downstream, which causes a strong decrease of mean density and high density fluctuations. Finally, the liquid-like pockets break up and smear out. Thereby, density fluctuations decrease and tend asymptotically to zero.
With regard to heat transport, it was found that the spreading of the jet is significantly higher in the case of temperature than for the velocity, which implies that the propagation of heat is more dominant than momentum transport. Similar to subcritical homogeneous shear flows, the heat flux vector appears highly anisotropic in the case of turbulent jets at supercritical conditions. It turned out that radial fluxes are approximately two-times lower than axial ones, while radial gradients are considerably steeper than axial ones. This is in contradiction with the linear thermal diffusivity model, usually applied in RANS and LES.
A comprehensive database including instantaneous flow and temperature fields, mean flow characteristics, turbulence properties along with turbulent kinetic energy budget and heat flux has been provided. The correctness of the results has been established by means of a grid-sensitivity study, which led to grid-independent achievements.
4.2. Thermal Transport
To supplement the findings of the previous work [26], the physical mechanisms, which govern the thermal transport and its contribution to the disintegration process and mixture formation, are especially explored. Figure 5 shows the variations of the mean and root-mean-square temperature along the centerline.
Close to the inflow, the temperature remains constant, rises slowly while the jet breaks up and increases linearly further downstream. The reason for such a behavior becomes clearer by examining the corresponding root-mean-square temperatures along the centerline. Thereby, in contrast to the root-mean-square density (see Figure 4), four mixing stages might be distinguished. In the first stage (I), temperature fluctuations are zero, and the liquid-like core is nearly unaffected by the surroundings. Then, in the second stage (II), instabilities occur, and dense pockets of liquid-like nitrogen are separated from the core. Thereby, temperature fluctuations increase slightly. The third stage (III) is dictated by supercritical state transition. Supplied thermal energy from the ambient nitrogen is primarily used to overcome intermolecular forces, and the fluid absorbs heat without significantly increasing the temperature, while temperature fluctuations increase rapidly. In the last stage (IV), turbulent mixing dominates, and temperature increases rapidly, while normalized temperature fluctuations remain approximately constant. As will be shown in Section 4.3, each of these disintegration stages has its own driving forces and can be distinguished much better by means of entropy generation analysis.
After analyzing the thermal mixing phenomena of supercritical disintegration processes, the turbulent heat fluxes and temperature scales are examined next in order to assess appropriate heat flux modeling approaches in the context of RANS and LES for supercritical flows and to supplement the analysis of the previous study [26] as summarized in Section 4.1.
Regarding RANS, turbulent heat fluxes are often modeled using the linear eddy diffusivity hypothesis:
which states that the turbulent heat flux vector is aligned with the corresponding mean temperature gradient , with turbulent heat diffusivity as a proportional scalar factor. Here, is the normalized temperature defined as . It is well known that in the case of subcritical homogeneous shear flows, the direction of the heat flux is significantly different than that of the corresponding mean gradient (see, e.g., [41]), which is in contradiction to the linear eddy diffusivity hypothesis. This behavior is also analyzed for the present supercritical jet in Figure 6. Thereby, the deviation from isotropic behavior is visualized by plotting against . These two quantities have to be equal in the case of isotropic heat flux.
As clearly observed in Figure 6, predicted values differ significantly from isotropic behavior. Moreover, it can be seen that with increasing axial distance, the heat fluxes are returning slightly to the isotropic state, but do not reach a fully-isotropic behavior. This suggests, that extended heat flux models might be appropriate in the context of RANS, as proposed in [42,43,44] and others from investigations in subcritical applications.
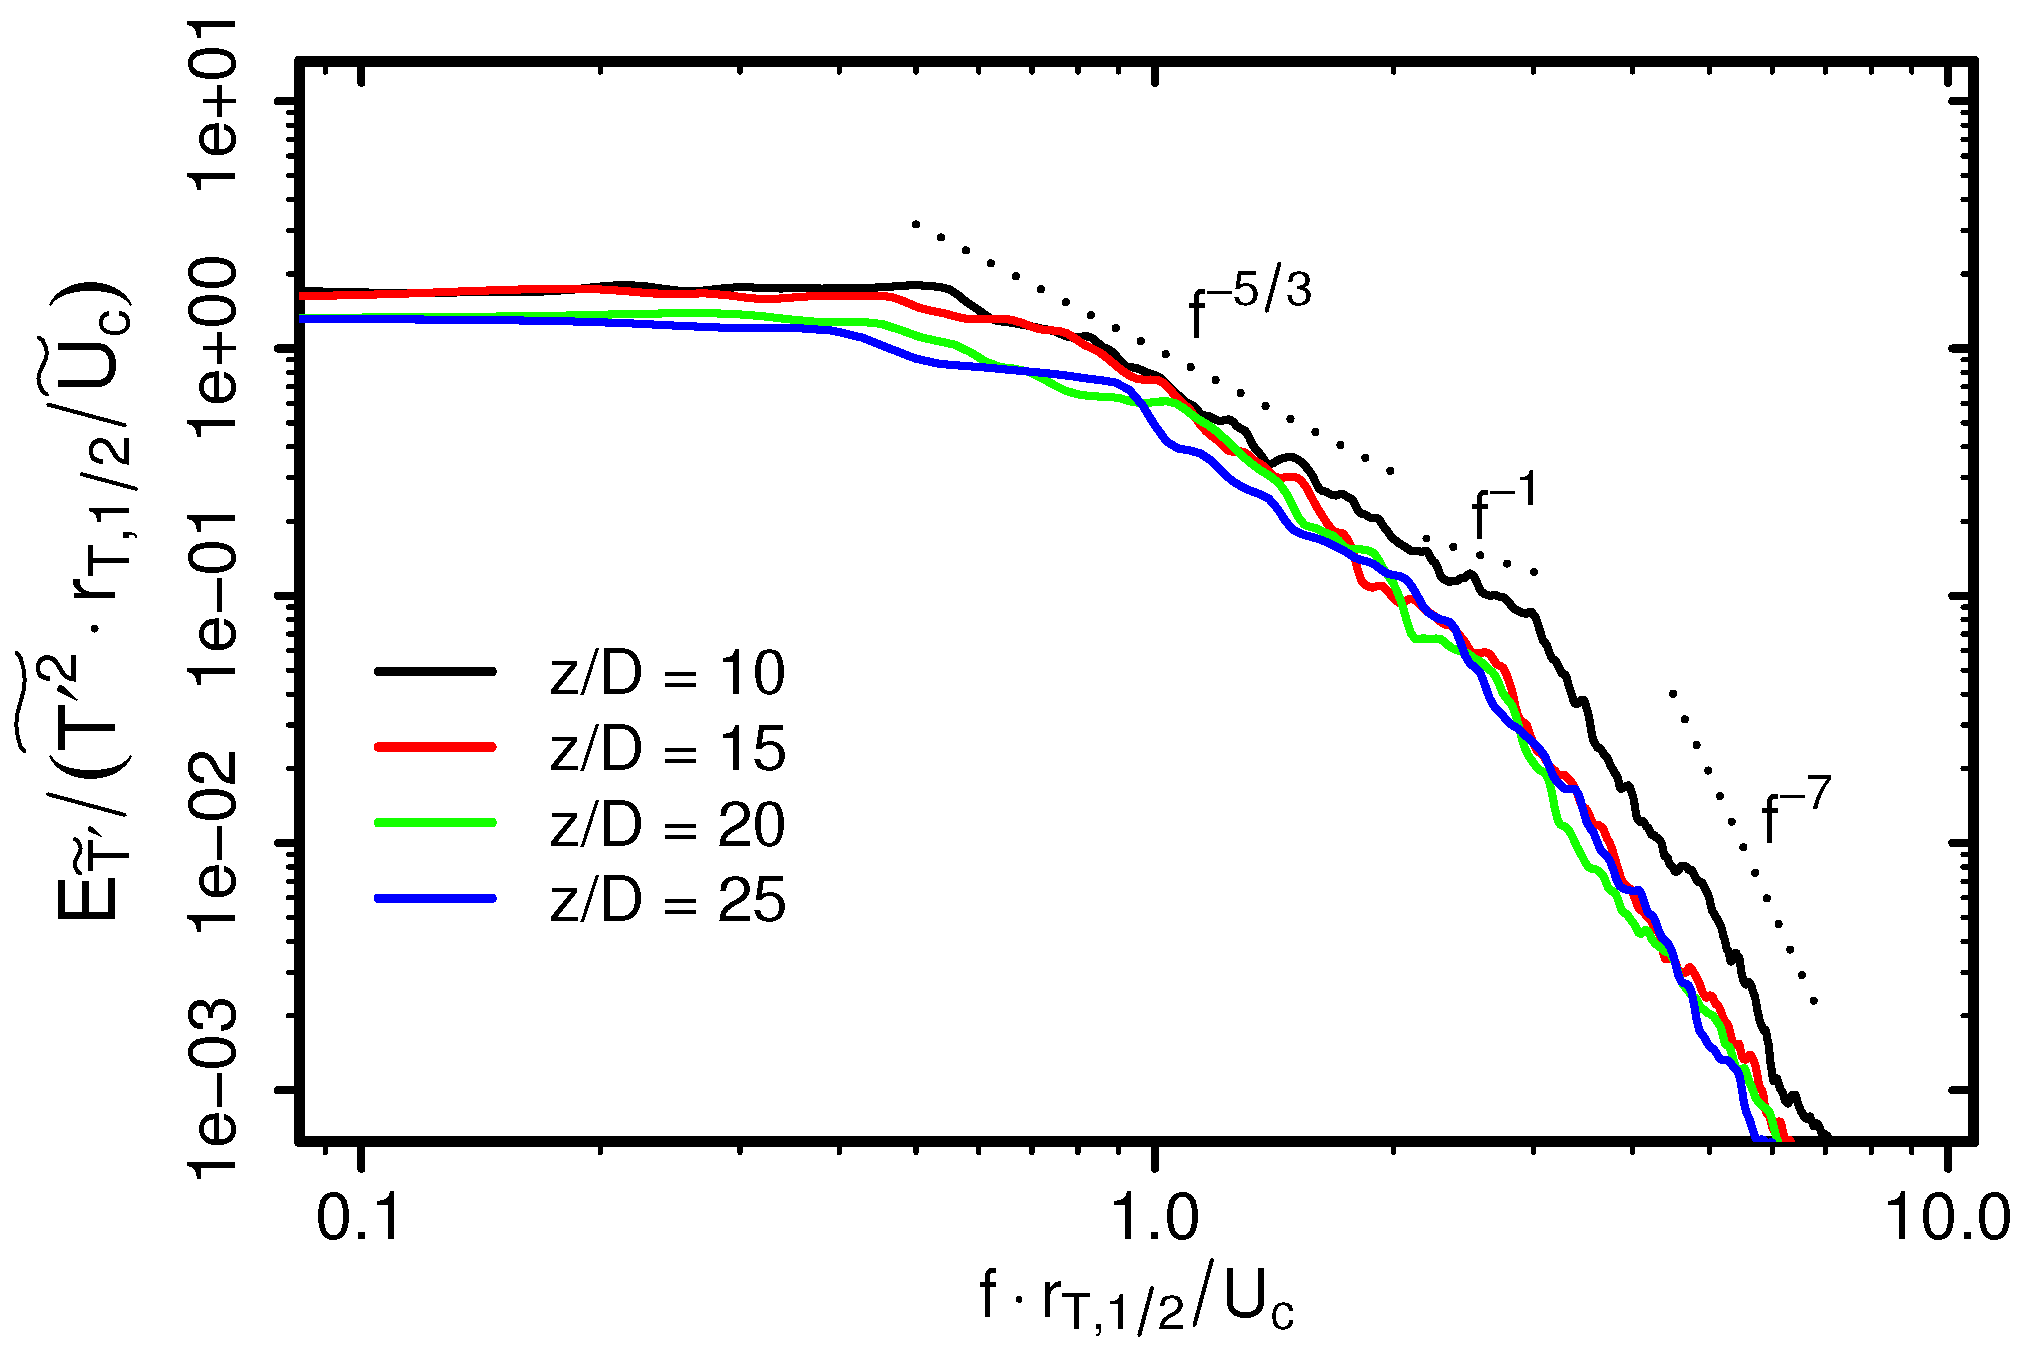
Just as in RANS, linear thermal diffusivity models are often applied in LES to model subgrid heat fluxes, assuming isotropy for small temperature scales. However, in scalar turbulence, the smallest temperature scales are not always isotropic (see, e.g., [45,46]), especially in the case of subcritical liquids or supercritical liquid-like fluids, where Schmidt or Prandtl numbers are high. This is analyzed for the supercritical jet in Figure 7, which presents temporal autospectra of the temperature at different axial locations. The spectra are normalized using local values of the jet half-width of temperature , variance of the temperature and the centerline velocity . The quantity f represents the frequency.
At , where the jet breaks up and the fluid has an almost liquid-like character, three regimes emerge in the temperature mixing spectrum. First is the universal inertial subrange, which refers to the range of scales where direct effects of thermal diffusivity are negligible. Thus, the spectrum exhibits a slope. Second is the viscous convective subrange, where temperature fluctuations are anisotropic and smoothed out by thermal diffusivity leading to a dependency. This regime is less pronounced for the present supercritical jet in comparison to the other ones. Third is the dissipation range, where viscous forces dominate and the spectrum exhibits a slope. Further downstream, where the fluid resembles a supercritical gas, the normalized mixing spectra tend towards a slope for higher frequencies, collapse onto a single curve and become self-similar. In this region, no viscous convective subrange occurs, and mixing spectra resemble flow spectra as they appear in turbulent jets of subcritical gases. Such a finding suggests that tensorial heat diffusivity models (e.g., [47,48,49,50]) might be appropriate for supercritical flows, in particular for fluids with strong liquid-like character.
4.3. Entropy Production
To complete the picture of disintegration processes under supercritical conditions, entropy generation mechanisms are analyzed in order to identify the causes of irreversibilities. Starting with the visual appearance, Figure 8 depicts instantaneous entropy production rates by heat transport and viscous dissipation at the mid-plane section of the jet, respectively. Results are shown for the entropy production evaluation of the supercritical jet up to into the ambient nitrogen.
In terms of instantaneous entropy production rates, it appears that entropy is primarily produced by heat transport including supercritical state transition, while the contribution of viscous dissipation appears negligibly small. Regarding entropy generation by heat transport, streaks with high values of are generated at the mixing layer between the liquid-like cold jet and gas-like surrounding fluid. Similar to the temperature field, these streaks are carried along by the flow and dissolve further downstream. Furthermore, it can be seen that is small at the jet’s core due to the absence of temperature gradients. In contrast, irreversibilities caused by viscous dissipation are distributed uniformly throughout the jet, and turbulent structures of seem to be smaller. As expected, the highest values of occur at the shear layer due to a large contribution of turbulent mixing. Further downstream, irreversibilities caused by viscous dissipation decrease slightly, and turbulent structures of becomes larger.
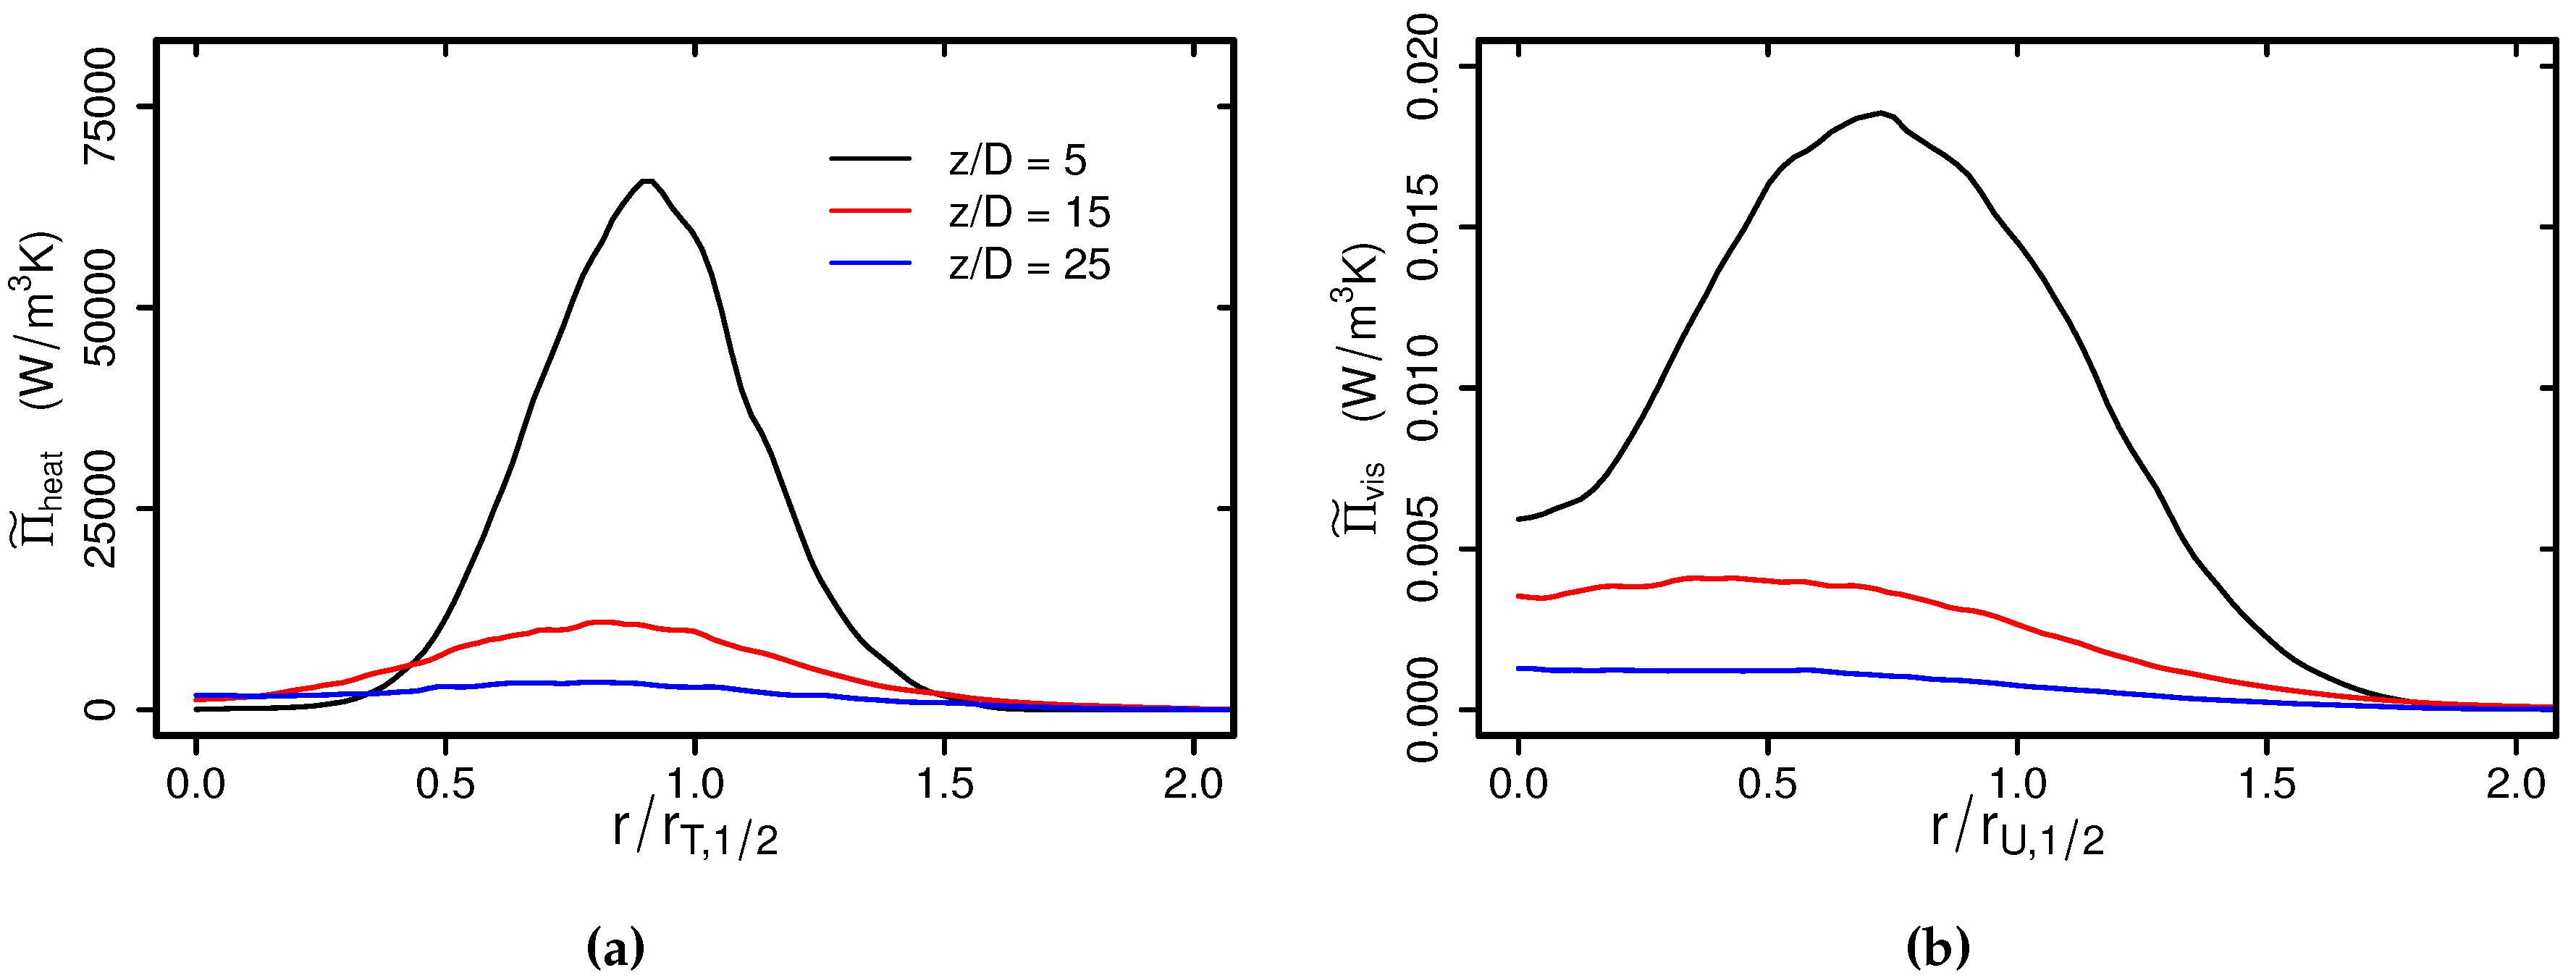
Next, the observations from the visual appearance are quantified by means of Favre-averaged profiles of entropy production rates in Figure 9. Profiles are plotted against dimensionless radial distance, where and are the jet half-widths of temperature and axial velocity, respectively. Three different axial positions (, 15 and 25) are selected, corresponding to the disintegration Stages (II), (III) and (IV).
Entropy generation by both heat transfer and by viscous dissipation increases in the radial direction, reaches a maximum around and finally tends to zero. With increasing axial distance, the profiles decrease and enlarge. Thereby, peak values are shifted towards the jet’s axis. It is remarkable that values of are about six orders of magnitude smaller than . Furthermore, the profiles of are considerably steeper than those of . Most of the entropy generation by heat transport is located at the mixing layer between the liquid-like cold jet and the gas-like surrounding fluid, whereas the contribution of viscous dissipation is more evenly distributed throughout the jet.
Next, entropy production rates along the centerline are analyzed in order to identify the causes of irreversibilities responsible for the disintegration process. This is done in Figure 10, which displays the Favre-averaged terms of the entropy production by heat transport and by viscous dissipation , respectively.
In line with the variation of root-mean-square temperature along the centerline shown in Figure 5b, four main stages associated with the disintegration process are obvious from the consideration of entropy production rates. First, close to the injector outlet (I), is zero due to the absence of temperature gradients, while is high as a result of the evolving turbulent mixing. In the next stage (II), dense pockets of liquid-like nitrogen are separated from the jet core, inducing additional shearing and temperature gradients. Thus, both entropy production terms increase. In the subsequent stage (III), dense pockets further break up, and pseudo-boiling takes place. Thereby, absorbed heat is primarily used to overcome intermolecular attraction, which leads to a rapid increase of , while at the same time, shearing is reduced and decreases. In the last stage (IV), most of the liquid-like nitrogen seems to be pseudo-evaporated, and the entropy generation is dominated by turbulent mixing processes. Thereby, decreases rapidly while declines slowly.
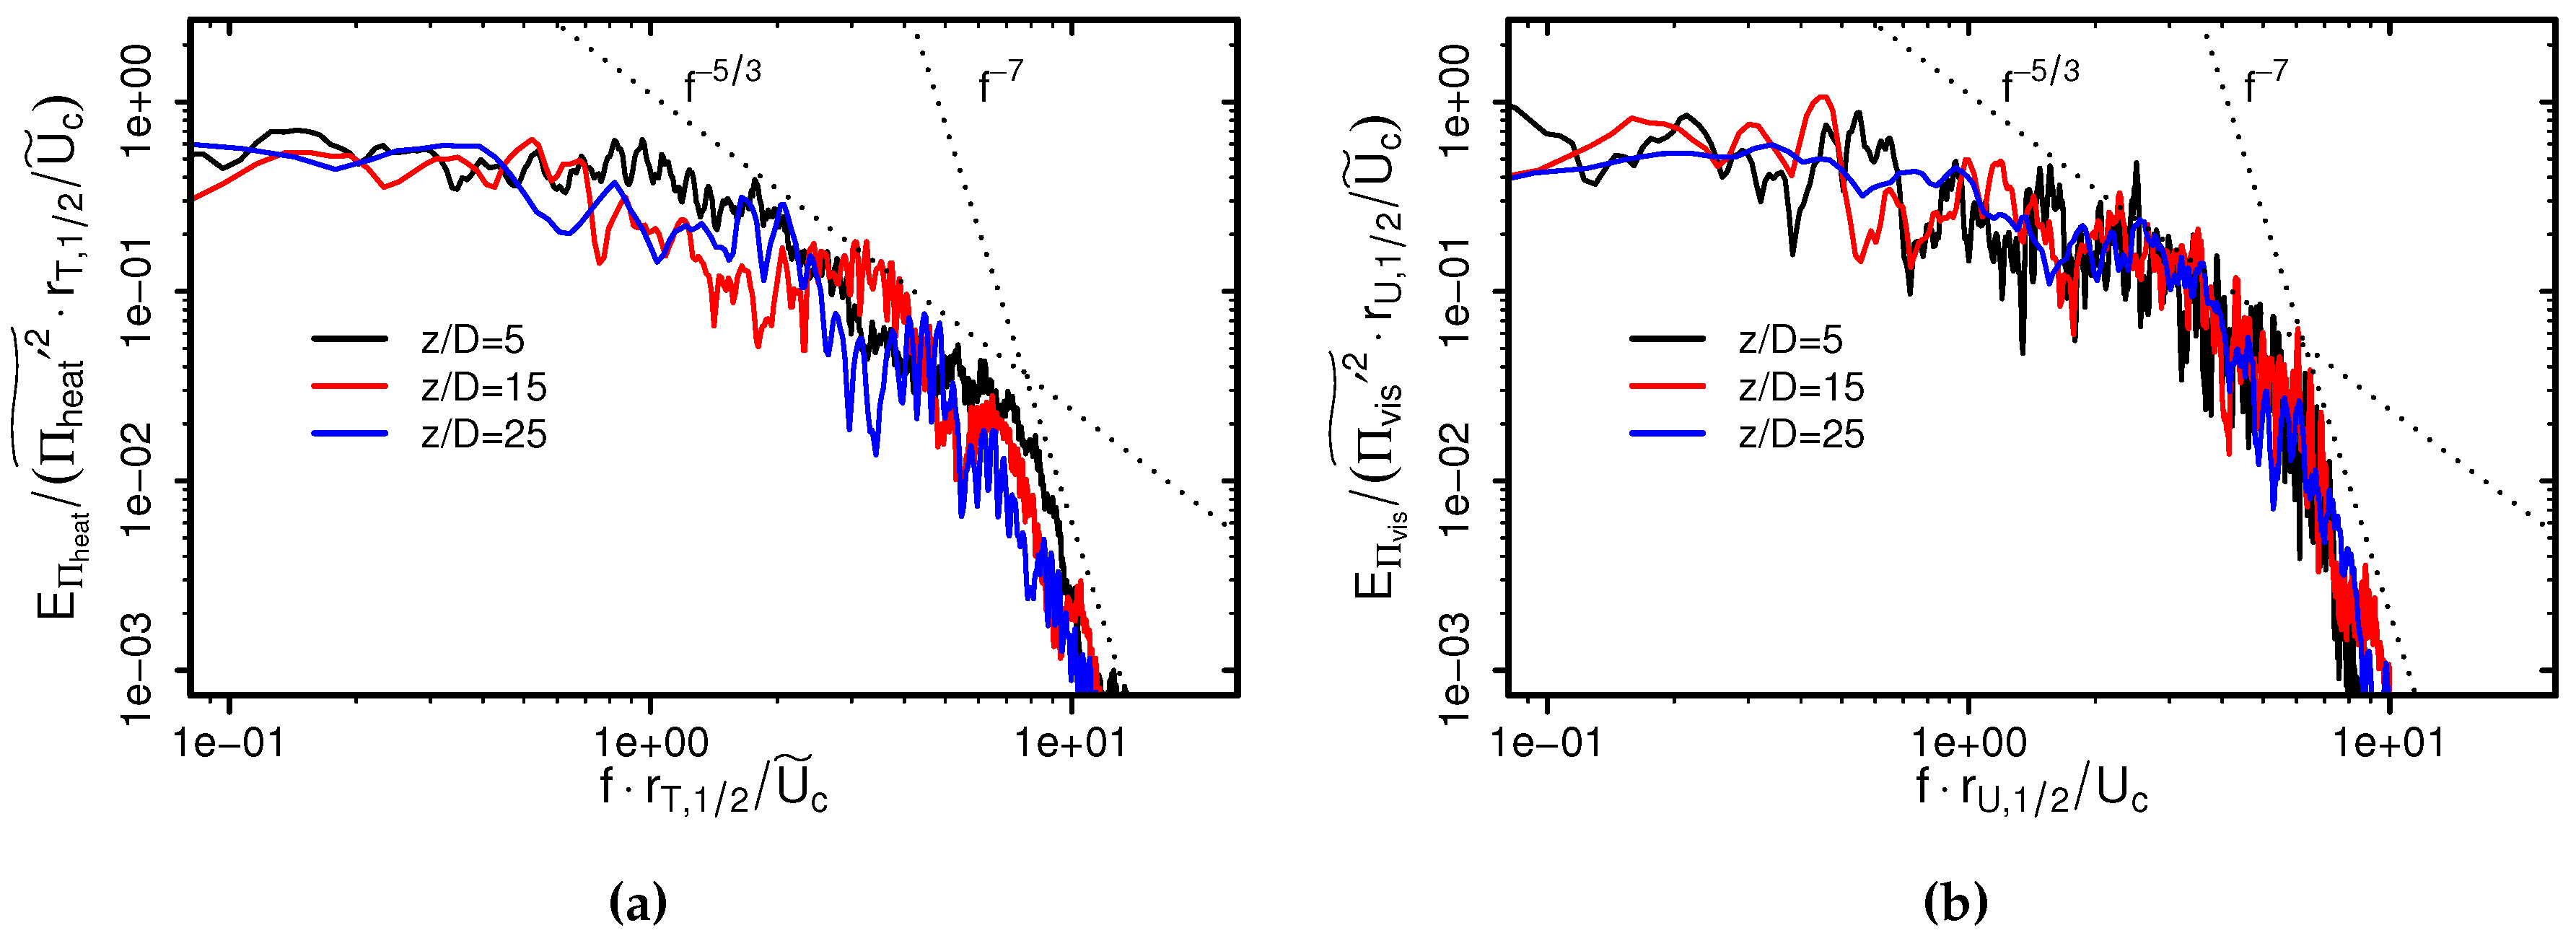
It appears that the disintegration process under supercritical conditions consists of four distinct stages and is driven by heat transport phenomena. Furthermore, it is important to identify different scales, which influence the process. For this purpose, Figure 11 presents normalized mixing autospectra of entropy production rates by heat transfer and by viscous dissipation. Fixed probes at , 15 and 25 are selected, corresponding to the disintegration stages (II), (III) and (IV).
Normalized spectra of entropy production by heat transport and by viscous dissipation exhibit a well-developed inertial and dissipation range and collapse onto a single curve at different axial locations. By comparing both spectra, it appears that more of the variance is expressed in higher frequencies in the case of mixing spectra of , while large scales dominate in the mixing spectra of . This makes clear that the entropy generation mechanisms in supercritical disintegration processes occur on different scales, but primarily on large scales in the case of heat transport and over a wide range of scales in the case of viscous dissipation.
5. Conclusions
The direct numerical simulation technique has been applied in order to investigate the thermal transport phenomena and entropy production mechanisms in a round jet under supercritical conditions and at moderate Reynolds number. Several distinctive features of the disintegration process, physical mechanisms that govern the thermal transport along with causes of irreversibilities have been pointed out. Some important observations from this study including fundamental deviations from subcritical injection processes can be outlined as follows:
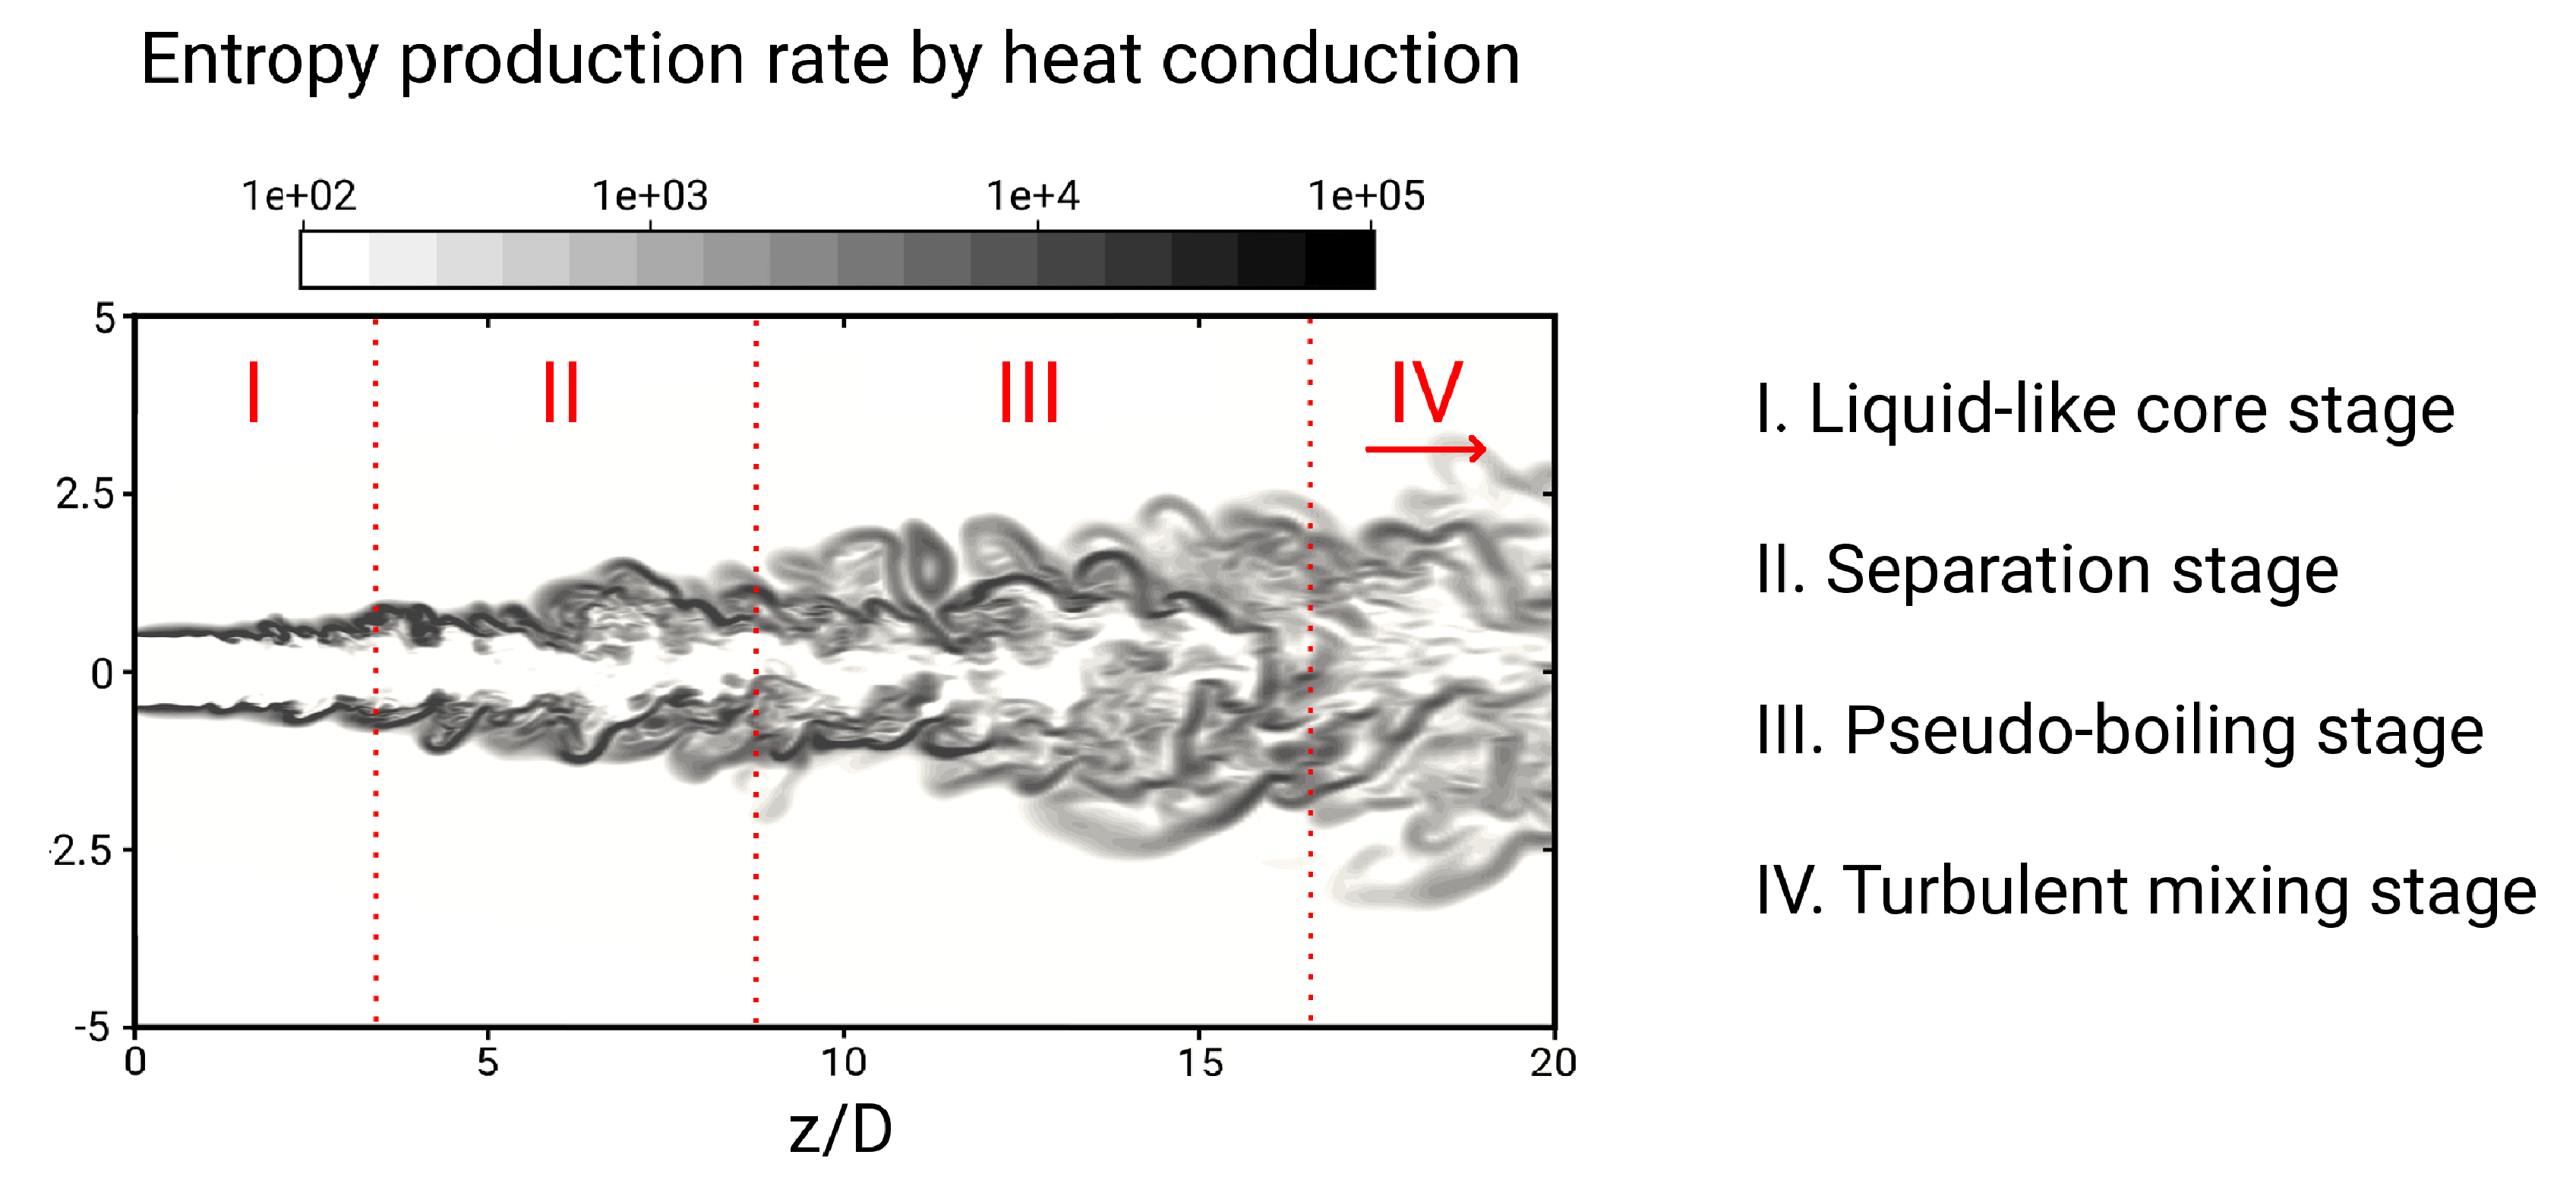
(1) It is observed that the jet disintegration process under supercritical conditions consists of four main stages.
- I
- Liquid-like core stage:The liquid-like core of the jet is almost unaffected by the surrounding. At this stage, mean temperature along the centerline remains constant, and the root-mean-square temperate is zero. The entropy production is quite small.
- II
- Separation stage:Dense pockets of liquid-like fluid are separated from the core, inducing additional shearing and temperature gradients. At this stage, both entropy production rates by heat transport and by viscous dissipation increase along the centerline.
- III
- Pseudo-boiling stage:Dense pockets tend to smear out, and pseudo-boiling takes place. Absorbed heat is primarily used to overcome intermolecular cohesion. Accordingly, shearing is reduced, and entropy production by heat transfer increases.
- IV
- Turbulent mixing stage:Most of the liquid-like nitrogen is pseudo-evaporated, and turbulent mixing dominates. While the temperature increases, the entropy production rates decrease.
(2) Examining turbulent heat fluxes, it appears that fluxes are highly anisotropic, especially close to the injection. Further downstream, heat fluxes become less anisotropic, but do not reach a fully isotropic state. This may imply that extended heat flux models might be appropriate in the context of RANS.
(3) Regarding temperature scales, small scales appear slightly anisotropic close to the injection, where the fluid is in a liquid-like state. Further downstream where the fluid has an almost gas-like character, small temperature scales return to an isotropic state. Such a finding suggests, that tensorial heat diffusivity models might be appropriate for supercritical flows in the context of LES, in particular for fluids with a strong liquid-like character.
(4) Finally, entropy production rates are analyzed including microscopic and mesoscopic considerations, as well as contributions due to real gas effects. Thereby, it turned out that the jet disintegration process under supercritical conditions is driven predominantly by heat transfer and thermodynamic effects rather than by turbulent flow dynamics. Especially the contribution resulting from the state transition process appears dominant. Furthermore, entropy generation mechanisms in supercritical disintegration processes occur on different scales. While this takes place on large scales in the case of entropy production by heat transport, it evolves over a wide range of scales in the case of viscous dissipation.
Acknowledgments
The authors gratefully acknowledge the financial support by the DFG (German Research Council) Sonderforschungsbereich Transregio 75 (SFB-TRR 75) "Droplet Dynamics Under Extreme Ambient Conditions", the support of the numerical simulations on the Lichtenberg High Performance Computer (HHLR) at the Technische Universität Darmstadt and the support by the German Research Foundation and the Open Access Publishing Fund of Technische Universität Darmstadt.
Author Contributions
Ries and Sadiki conceived of and designed the numerical experiment. Ries performed the numerical simulations, treated, exploited and analyzed the data. Together with Sadiki, they analyzed and discussed the numerical results. Ries wrote the paper, while Sadiki and Janicka contributed by providing materials and computing resources. Sadiki further supported improving the manuscript. All authors have read and approved the final manuscript.
Conflicts of Interest
The authors declare no conflict of interest.
References
- Messerschmid, L.; Fasoulas, S. Raumfahrtsysteme, 4rd ed.; Springer-Verlag: Berlin, Germany, 2011. [Google Scholar]
- Knez, Ž.; Markočič, E.; Leitgelb, M.; Primožič, M.; Knez Hrnčič, M.; Škerget, M. Industrial applications of supercritical fluids: A review. Energy 2014, 77, 235–243. [Google Scholar] [CrossRef]
- Ahn, Y.; Bae, S.J.; Kim, M.; Cho, S.K.; Baik, S.; Lee, J.I.; Cha, J.E. Review of supercritical CO2 power cycle technology and current status of research and development. Nucl. Eng. Technol. 2015, 47, 647–661. [Google Scholar] [CrossRef]
- Kumar, S.; Chauhan, M.K.; Varun. Numerical modeling of compression ignition engine: A review. Renew. Sust. Energ. Rev. 2013, 19, 517–530. [Google Scholar] [CrossRef]
- Banuti, D.T. Crossing the Widom-line—Supercritical pseudo-boiling. J. Supercrit. Fluid 2015, 98, 12–16. [Google Scholar] [CrossRef]
- Sadiki, A.; Hutter, K. On thermodynamics of turbulence: Development of first order closure models and critical evaluation of existing models. J. Non-Equilib. Thermodyn. 2000, 25, 131–160. [Google Scholar] [CrossRef]
- Bejan, A. Second-law analysis in heat transfer and thermal design. Adv. Heat Transf. 1982, 15, 1–58. [Google Scholar]
- Bejan, A. Entropy Generation Minimization: The Method of Thermodynamic Optimization of Finite-Size Systems and Finite-Time Processes; CRC Press LLC: Boca Raton, FL, USA, 1995. [Google Scholar]
- Som, S.K.; Datta, A. Thermodynamic irreversibilities and exergy balance in combustion processes. Prog. Energ. Cumbust. 2008, 34, 351–376. [Google Scholar] [CrossRef]
- Oztop, H.F.; Al-Salem, K. A review on entropy generation in natural and mixed convection heat transfer for energy systems. Renew. Sust. Energ. Rev. 2012, 16, 911–920. [Google Scholar] [CrossRef]
- Ko, T.H.; Wu, C.P. A numerical study on entropy generation induced by turbulent forced convection in curved rectangular ducts with various aspect ratios. Int. Commun. Heat Mass 2009, 36, 25–31. [Google Scholar] [CrossRef]
- Sciacovelli, A.; Verda, V.; Sciubba, E. Entropy generation analysis as a design tool-A review. Renew. Sust. Energ. Rev. 2015, 43, 1167–1181. [Google Scholar] [CrossRef]
- Ahmadi, G. A two-equation turbulence model for compressible flows based on the second law of thermodynamics. J. Non-Equilib. Thermodyn. 1989, 14, 49–59. [Google Scholar] [CrossRef]
- Sadiki, A. Extended thermodynamics as modeling tool of turbulence in fluid flows. In Trends in Applications of Mathematics to Mechanics; Wang, Y., Hutter, K., Eds.; Shaker Verlag: Aachen, Germany, 2005. [Google Scholar]
- Sierra-Pallares, J.; del Velle, J.G.; García-Carrascal, P.; Ruiz, F.C. Numerical study of supercritical and transcritical injection using different turbulent Prandlt numbers: A second law analysis. J. Supercrit. Fluid 2016, 115, 86–98. [Google Scholar] [CrossRef]
- Okong’o, N.A.; Bellan, J. Direct numerical simulations of transitional supercritical binary mixing layers: Heptane and nitrogen. Int. J. Fluid Mech. 2002, 464, 1–34. [Google Scholar] [CrossRef]
- Taskinoglu, E.; Bellan, J. A posteriori study using a DNS database describing fluid disintegration and binary-species mixing under supercritical pressure: Heptane and nitrogen. J. Fluid Mech. 2010, 645, 211–254. [Google Scholar] [CrossRef]
- Sierra-Pallares, J.; Parra-Santos, M.T.; García-Serna, J.; Castro, F.; Cocero, M.J. Numerical analysis of high-pressure fluid jets: Application to RTD prediction in supercritical reactors. J. Supercrit. Fluid 2009, 49, 249–255. [Google Scholar] [CrossRef]
- Schmitt, T.; Selle, L.; Ruiz, A.; Cuenot, B. Large-eddy simulation of supercritical-pressure round jets. AIAA J. 2010, 48, 2133–2144. [Google Scholar] [CrossRef]
- Müller, H.; Niedermeier, C.A.; Matheis, J.; Pfitzner, M.; Hickel, S. Large-eddy simulation of nitrogen injection at trans- and supercritical conditions. Phys. Fluids 2016, 28, 015102. [Google Scholar] [CrossRef]
- Selle, L.C.; Okong’o, N.A.; Bellan, J.; Harstad, K.G. Modelling of subgrid-scale phenomena in supercritical transitional mixing layers: An a priori study. J. Fluid Mech. 2007, 593, 57–91. [Google Scholar] [CrossRef]
- Selle, L.; Ribert, G. Modeling requirements for large-eddy simulation of turbulent flows under supercritical thermodynamic conditions. In Proceedings of the CTR Summer Program, Stanford, CA, USA, 6 July–1 August 2008. [Google Scholar]
- Foster, J.; Miller, R.S. A priori analysis of subgrid mass diffusion vectors in high pressure turbulent hydrogen/oxygen reacting shear layer flames. Phys. Fluids 2012, 24, 075114. [Google Scholar] [CrossRef]
- Ruiz, A.M.; Lacaze, G.; Oefelein, J.C.; Mari, R.; Cuenot, B.; Selle, L.; Poinsot, T. Numerical benchmark for high-Reynolds-number supercritical flows with large density gradients. AIAA J. 2016, 54, 1445–1460. [Google Scholar] [CrossRef]
- Kawai, S. Direct numerical simulation of transcritical turbulent boundary layers at supercritical pressures with strong real fluid effects. In Proceedings of the 54th AIAA Aerospace Sciences Meeting, San Diego, CA, USA, 4–8 January 2016. [Google Scholar]
- Ries, F.; Obando, P.; Schevchuck, I.; Janicka, J.; Sadiki, A. Numerical analysis of turbulent flow dynamics and heat transport in a round jet at supercritical conditions. Int. J. Heat Fluid Fl. 2017, 66, 172–184. [Google Scholar]
- Mayer, W.; Telaar, J.; Branam, R.; Schneider, G.; Hussong, J. Raman measurements of cryogenic injection at supercritical pressure. Heat Mass Transf. 2003, 39, 709–719. [Google Scholar] [CrossRef]
- van der Waals, J.D. Over de Continuiteit van den Gas-en Vloeistoftoestand. Ph.D. Thesis, University of Leiden, Leiden, The Netherlands, 1873. [Google Scholar]
- Peng, D.Y.; Robinson, D.P. A new two-constant equation of state. Ind. Eng. Chem. Fundamen. 1976, 15, 59–64. [Google Scholar] [CrossRef]
- Redlich, O.; Kwong, J.N.S. On the thermodynamics of solutions. V. An equation of state. Fugacities of gaseous solutions. Chem. Rev. 1949, 44, 233–244. [Google Scholar] [CrossRef] [PubMed]
- Soave, G. Equilibrium constants from a modified Redlich-Kwong equation of state. Chem. Eng. Sci. 1972, 27, 1197–1203. [Google Scholar] [CrossRef]
- Abudour, A.M.; Mohammad, S.A.; Robinson, R.L., Jr.; Gasem, K.A.M. Volume-translated Peng-Robinson equation of state for saturated and single-phase liquid densities. Fluid Phase Equilibr. 2012, 335, 74–87. [Google Scholar] [CrossRef]
- Burcat, A.; Ruscic, B. Third Millennium Ideal Gas and Condensed Phase Thermochemical Database for Combustion with Updates from Active Thermochemical Tables. Report No. TAE 960; 2005. Available online: http://atct.anl.gov/ruscic/reprints/Burcat%202005.pdf (accessed on 4 August 2017).
- Chung, T.H.; Ajlan, M.; Lee, L.L.; Starling, K.E. Generalized multiparameter correlation for nonpolar and polar fluid transport properties. Ind. Eng. Chem. Res. 1988, 27, 671–679. [Google Scholar] [CrossRef]
- Linstrom, P.J.; Mallard, W.G. NIST chemistry webbook. Available online: http://webbook.nist.gov/chemistry/fluid/ (accessed on 12 June 2017).
- Kock, F.; Herwig, H. Local entropy production in turbulent shear flows: A high-Reynolds number model with wall functions. Int. J. Heat Mass Tran. 2004, 47, 2205–2215. [Google Scholar] [CrossRef]
- Issa, R.I. Solution of the implicitly discretised fluid flow equations by operator-splitting. J. Comput. Phys. 1985, 62, 40–65. [Google Scholar] [CrossRef]
- Patankar, S.; Spalding, D. A calculation procedure for heat, mass and momentum transfer in three-dimensional parabolic flows. Int. J. Heat Mass Tran. 1972, 15, 1787–1806. [Google Scholar] [CrossRef]
- Roe, P.L. Characteristic-based schemes for the euler equations. Ann. Rev. Fluid Mech. 1986, 18, 337–365. [Google Scholar] [CrossRef]
- Greenshields, C.J. OpenFOAM Programmer’s Guide Version 3.0.1. Available online: http://foam.sourceforge.net/docs/Guides-a4/ProgrammersGuide.pdf (accessed on 4 August 2017).
- Tavoularis, S.; Corrsin, S. Experiments in nearly homogenous turbulent shear flow with a uniform mean temperature gradient. Part 1. J. Fluid Mech. 1981, 104, 311–347. [Google Scholar] [CrossRef]
- Batchelor, G.K. Diffusion in a field of homogeneous turbulence. I. Eulerian analysis. Aust. J. Chem. 1949, 2, 437–450. [Google Scholar] [CrossRef]
- Daly, B.J.; Harlow, F.H. Transport equations in turbulence. Phys. Fluids 1970, 13, 2637–2649. [Google Scholar] [CrossRef]
- Younis, B.A.; Speziale, C.G.; Clark, T.T. A rational model for the turbulent scalar fluxes. Proc. Math. Phys. Eng. Sci. 2004, 461, 575–594. [Google Scholar] [CrossRef]
- Bogucki, D.; Domaradzki, J.A.; Yeung, P.K. Direct numerical simulations of passive scalars with Pr > 1 advected by turbulent flow. J. Fluid Mech. 1997, 343, 111–130. [Google Scholar] [CrossRef]
- Borgas, M.S.; Sawford, B.L.; Xu, S.; Donzis, D.A.; Yeung, P.K. High Schmidt number scalars in turbulence: Structure functions and Lagrangian theory. Phys. Fluids 2004, 16, 3888–3899. [Google Scholar] [CrossRef]
- Peng, S.H.; Davidson, L. On a subgrid-scale heat flux model for large eddy simulation of turbulent thermal flow. Int. J. Heat Mass Tran. 2002, 45, 1393–1405. [Google Scholar] [CrossRef]
- Wang, B.; Bergstrom, D.J. A dynamic nonlinear subgrid-scale stress model. Phys. Fluids 2005, 17, 035109. [Google Scholar] [CrossRef]
- Rasam, A.; Brethouwer, G.; Johansson, A.V. An explicit algebraic model for the subgrid-scale passive scalar flux. J. Fluid Mech. 2013, 721, 541–577. [Google Scholar] [CrossRef]
- Pantangi, P.; Huai, Y.; Sadiki, A. Mixing analysis and optimization in jet mixer systems by means of large eddy simulation. In Micro and Macro Mixing: Analysis, Simulation, and Numerical Calculation; Bockhorn, H., Mewes, D., Peukert, W., Warnecke, H.J., Eds.; Springer Verlag: Berlin, Germany, 2010. [Google Scholar]
Figure 1.
Predicted mass density (a), isobaric heat capacity (b), molecular viscosity (c) and thermal diffusivity (d) of nitrogen at 40 bar with respect to temperature. Comparison of commonly-used equations of state (EoS) with reference data from [35]. PR, Peng–Robinson; PRC, corrected Peng–Robinson; RK, Redlich–Kwong; SRK, Soave–Redlich–Kwong; vdW, van der Waals.

Figure 2.
Computational domain and numerical grid of the direct numerical simulation of nitrogen injection at supercritical conditions (one quarter of the grid is removed to qualitatively visualize the evolution of the jet). The number of grid points are given as , , , , ,
Figure 2.
Computational domain and numerical grid of the direct numerical simulation of nitrogen injection at supercritical conditions (one quarter of the grid is removed to qualitatively visualize the evolution of the jet). The number of grid points are given as , , , , ,

Figure 3.
Instantaneous mass density field at the mid-plane section of the jet. Red lines denote the jet’s half-widths of the mean density.
Figure 3.
Instantaneous mass density field at the mid-plane section of the jet. Red lines denote the jet’s half-widths of the mean density.
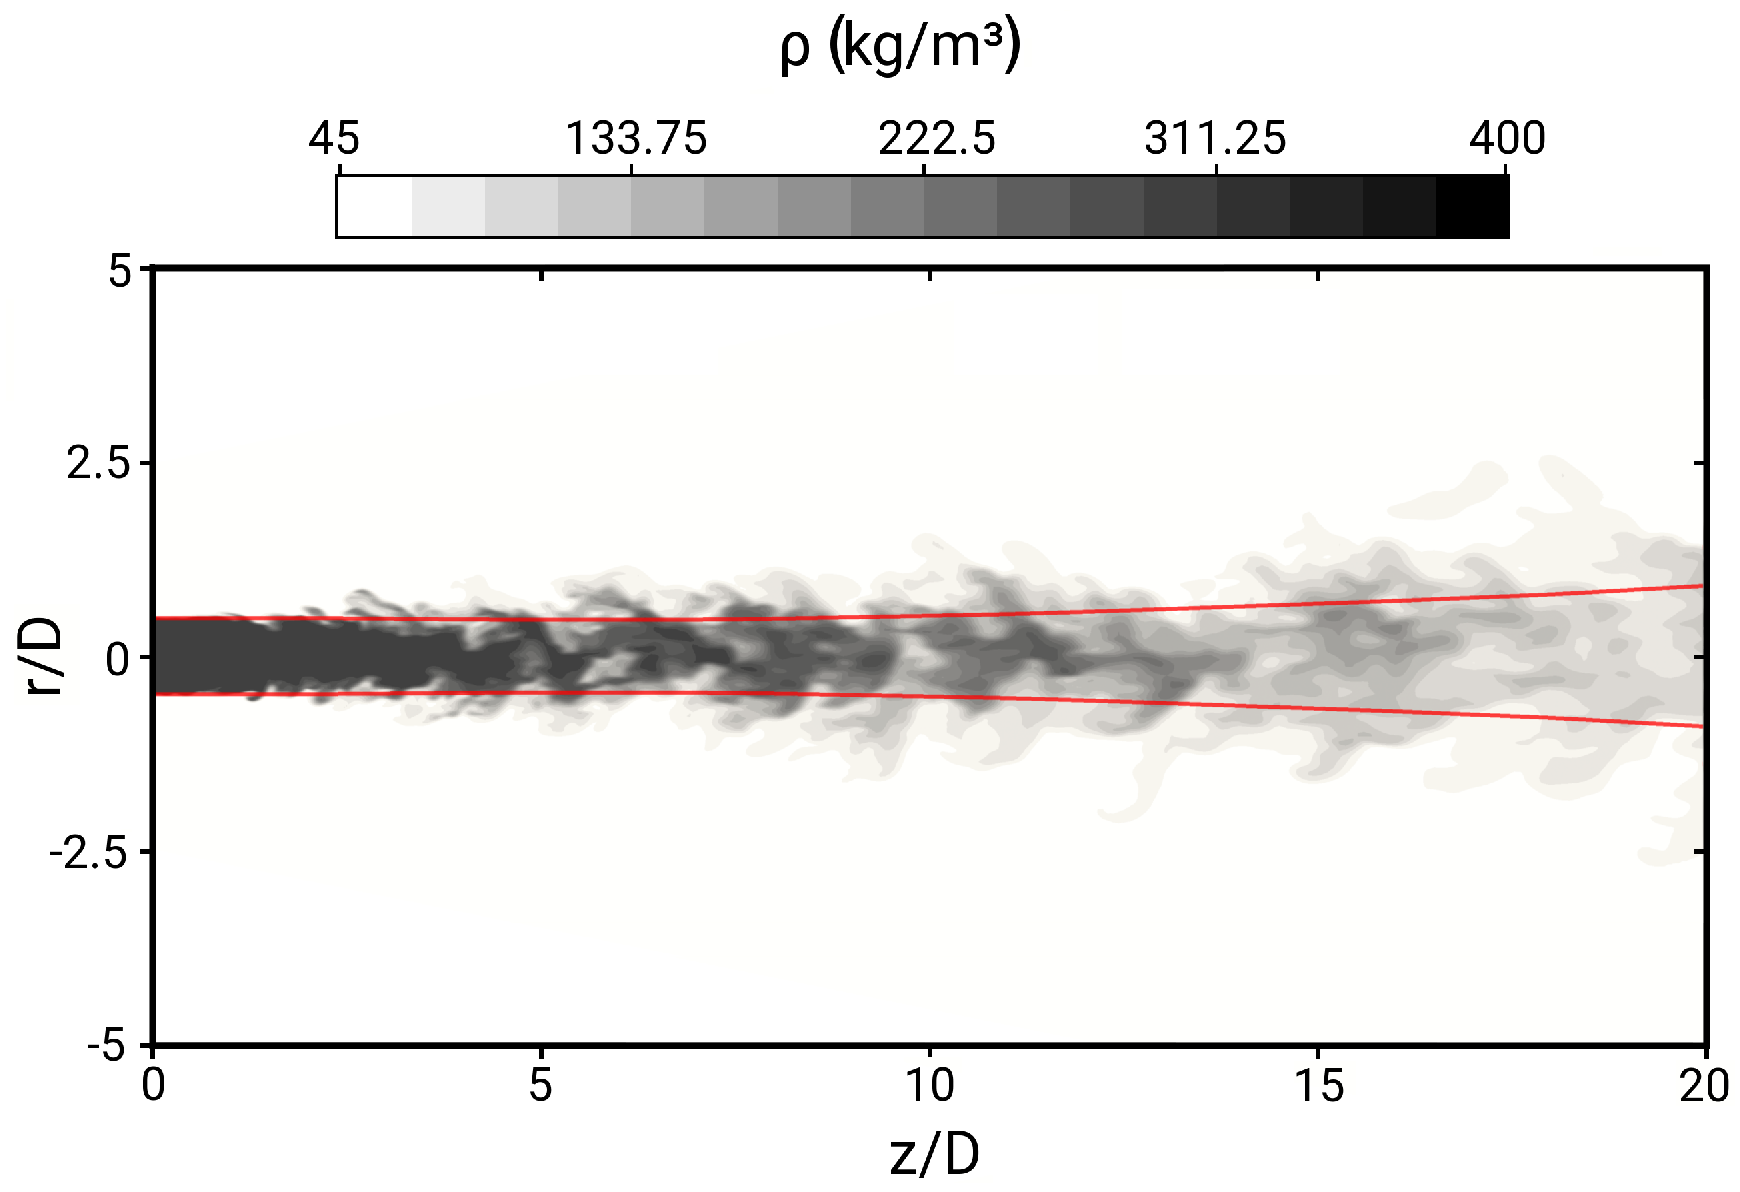
Figure 4.
Variation of mean (black) and root-mean-square density (red) along the centerline. Comparison with measurements of a supercritical round jet from Mayer et al. [27] at a higher Reynolds number.
Figure 4.
Variation of mean (black) and root-mean-square density (red) along the centerline. Comparison with measurements of a supercritical round jet from Mayer et al. [27] at a higher Reynolds number.
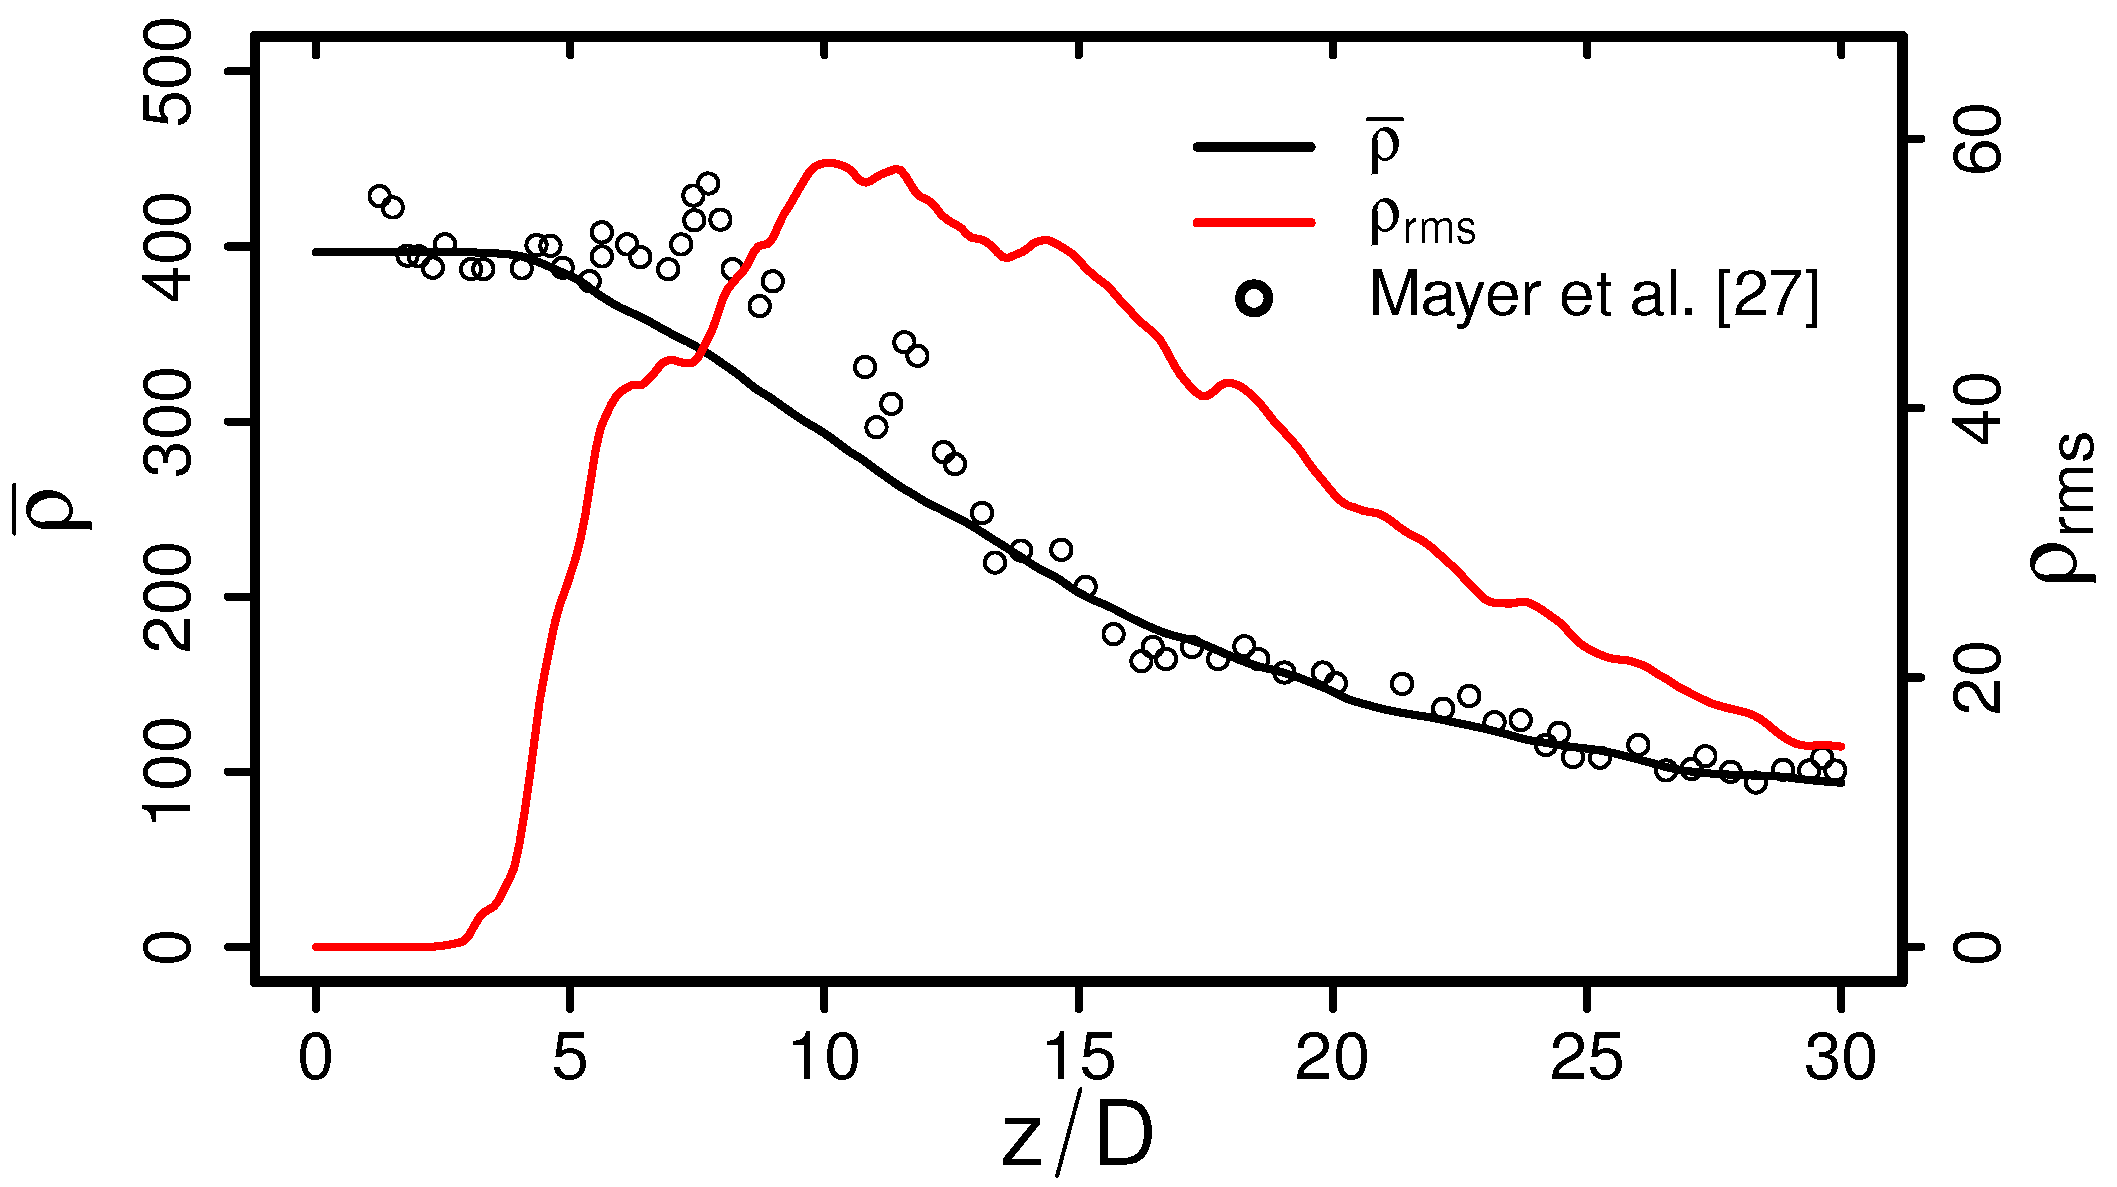
Figure 5.
Mean (a) and root-mean-square (b) temperature along the centerline.
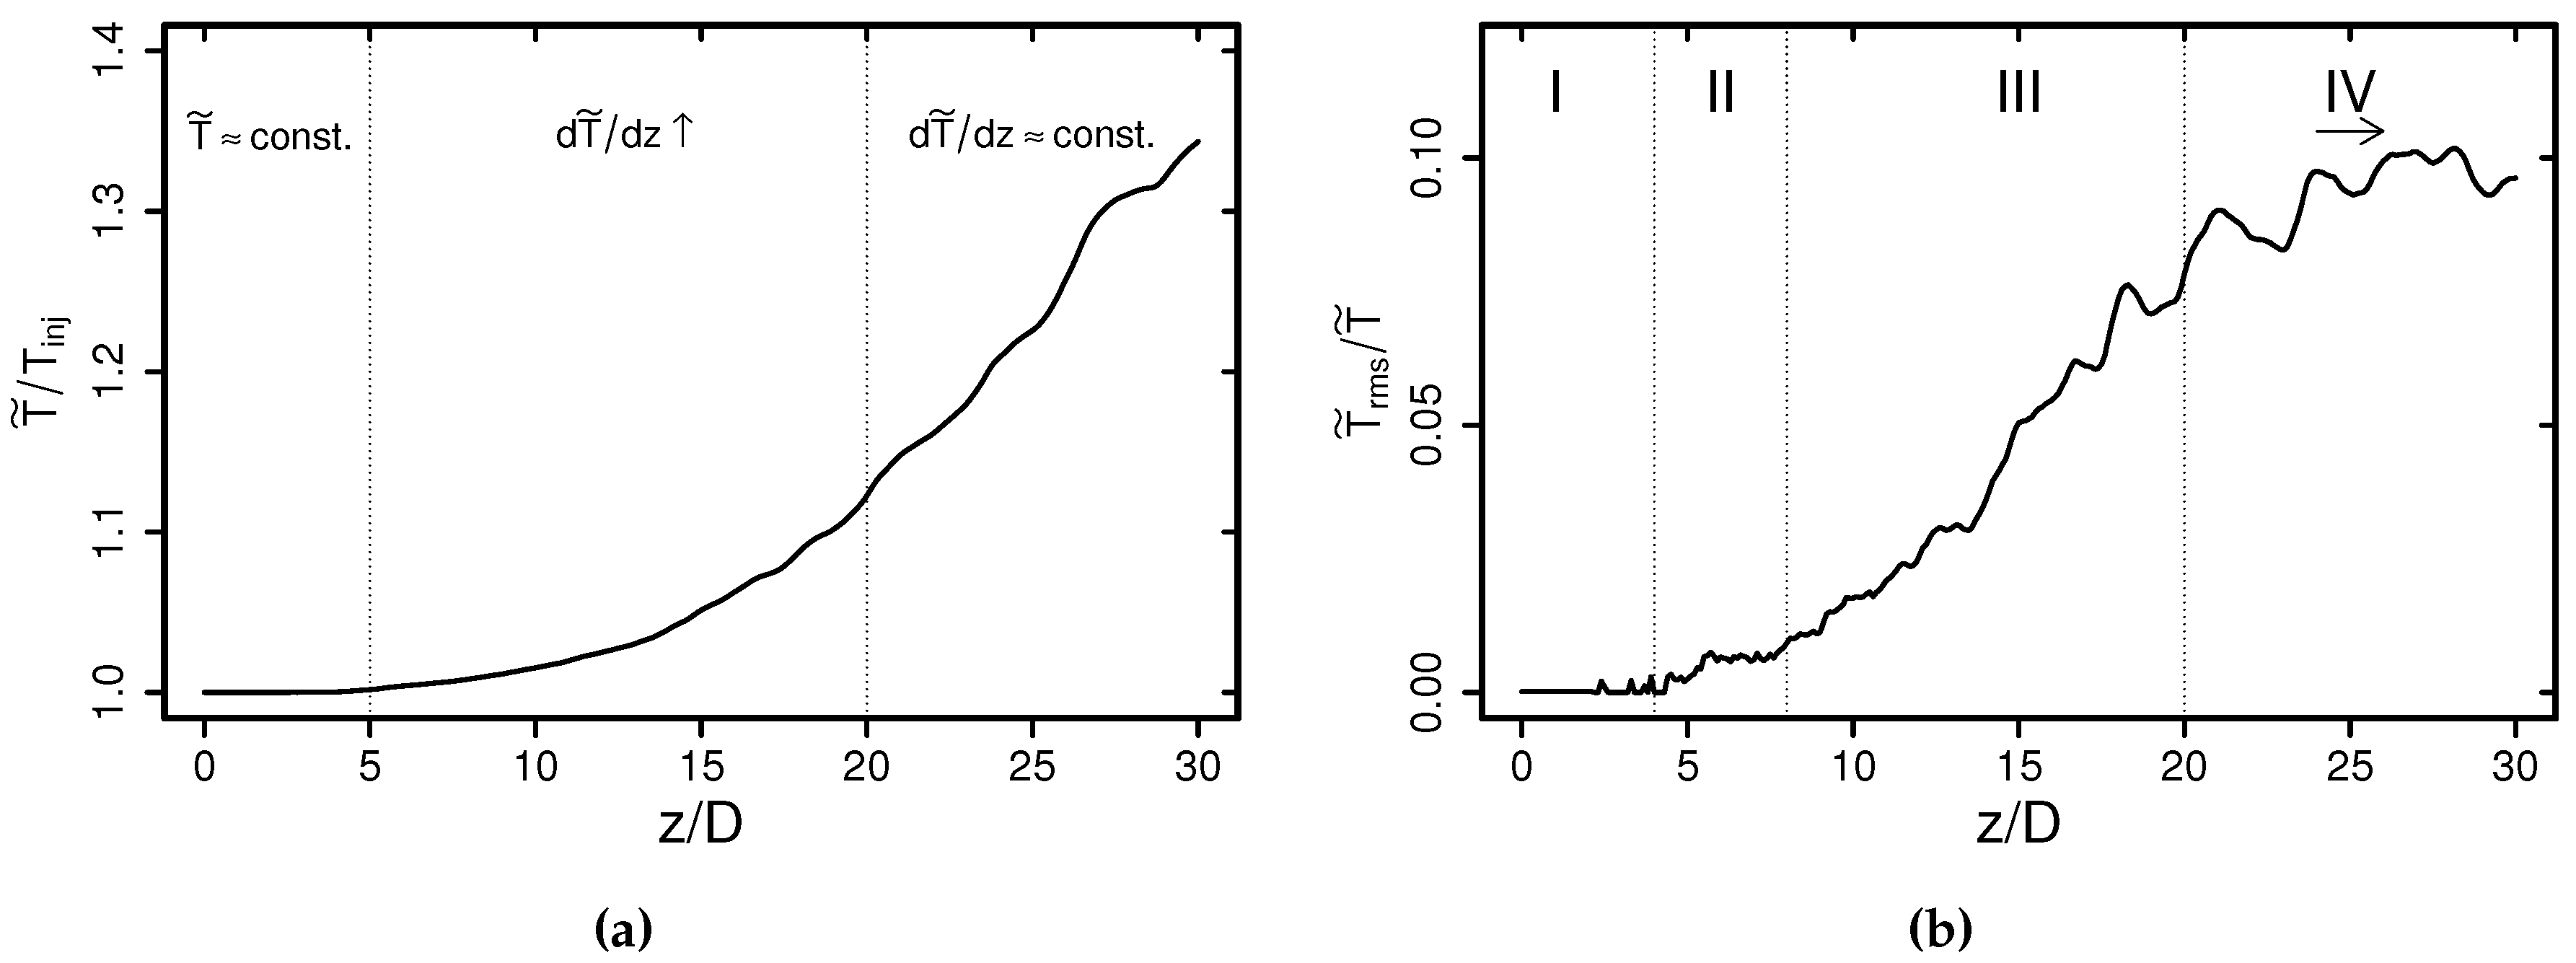
Figure 6.
Anisotropy of heat fluxes. The dashed line highlights the isotropy of heat fluxes.
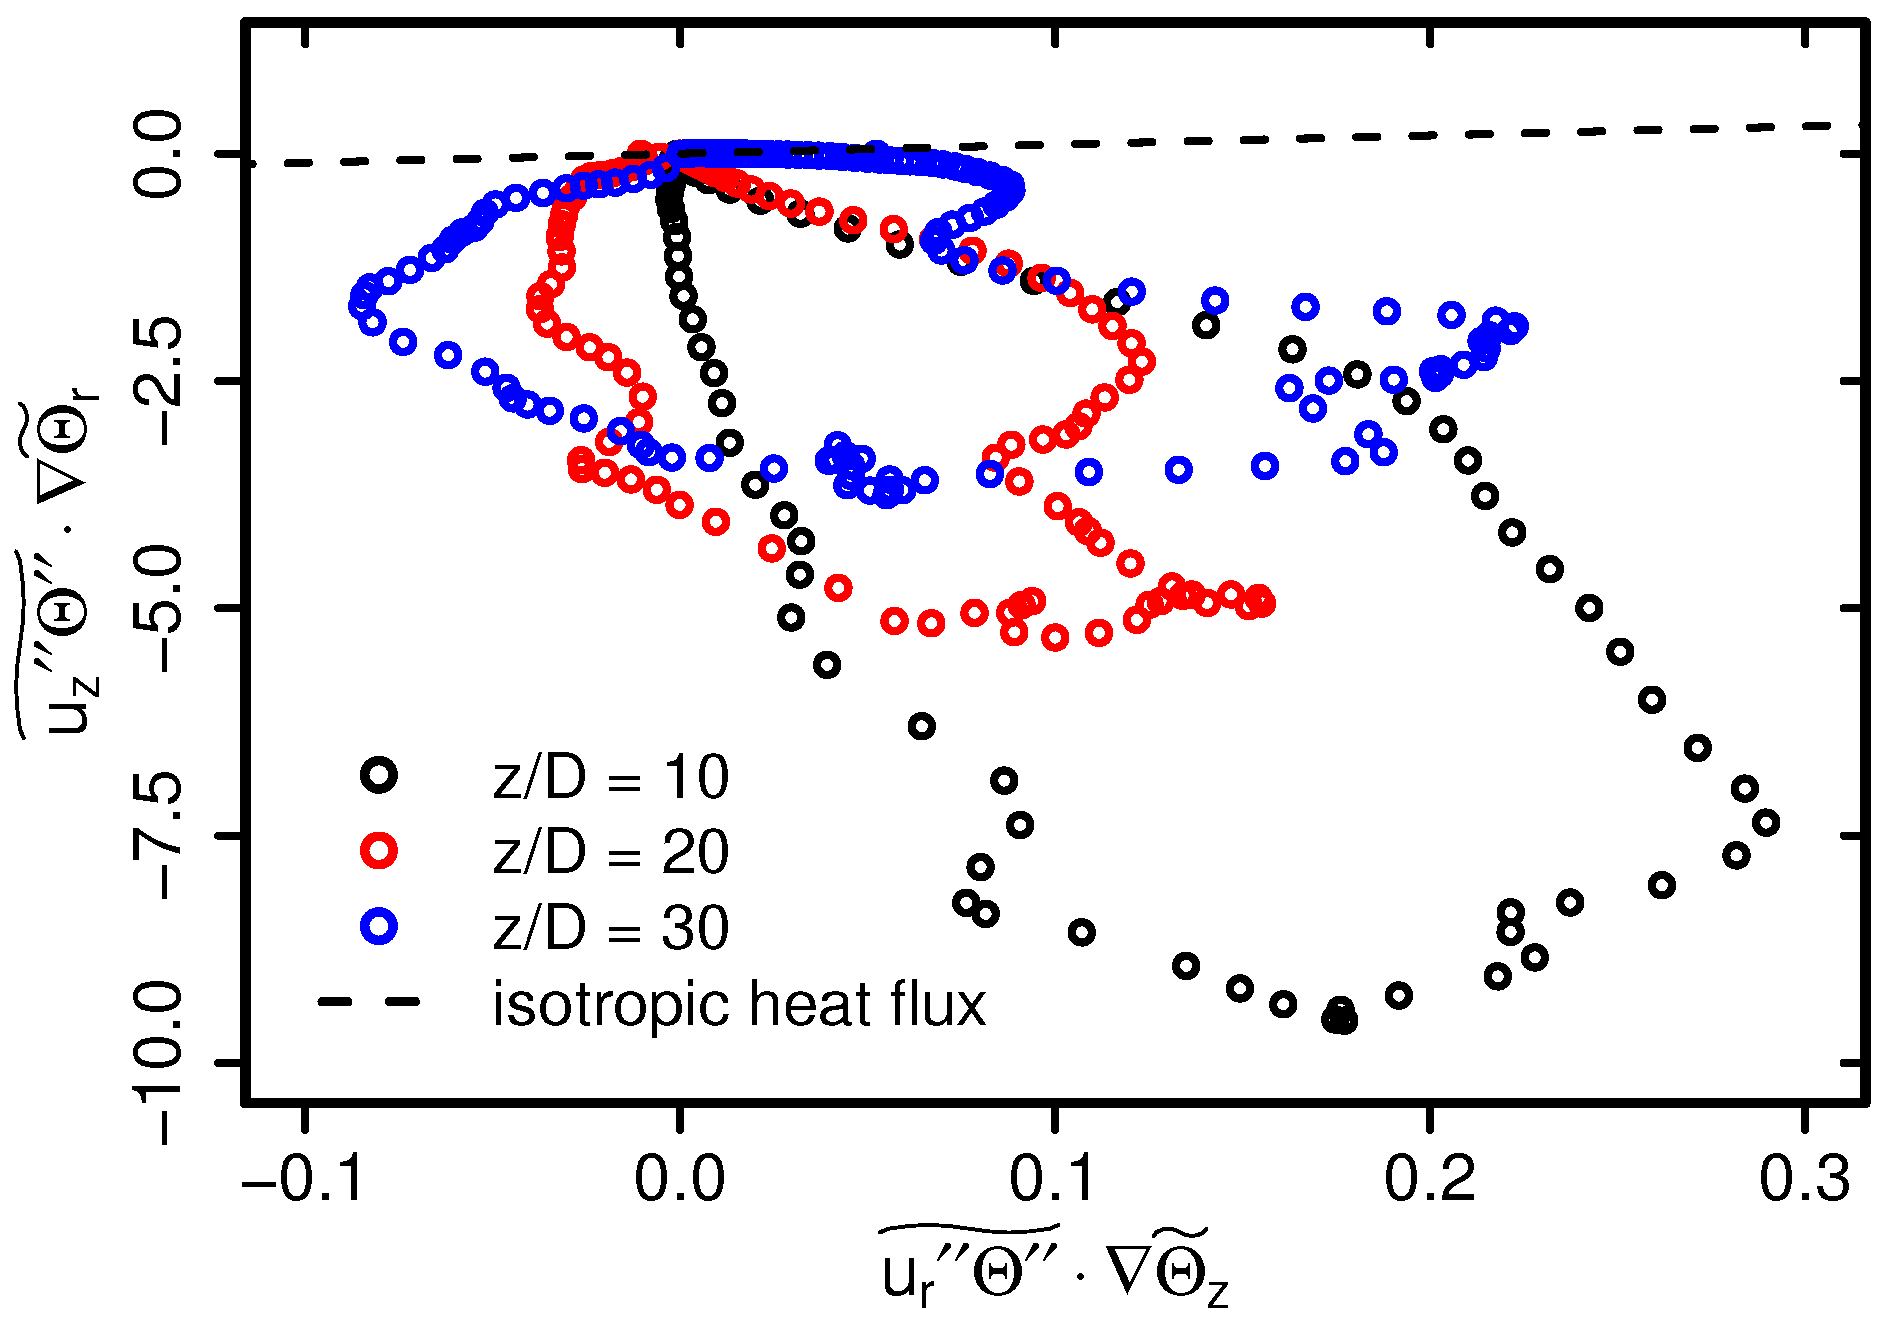
Figure 7.
Normalized autospectra of temperature at , 15, 20 and 25.

Figure 8.
Snapshots of entropy generation rate by heat transport (a) and viscous dissipation (b).
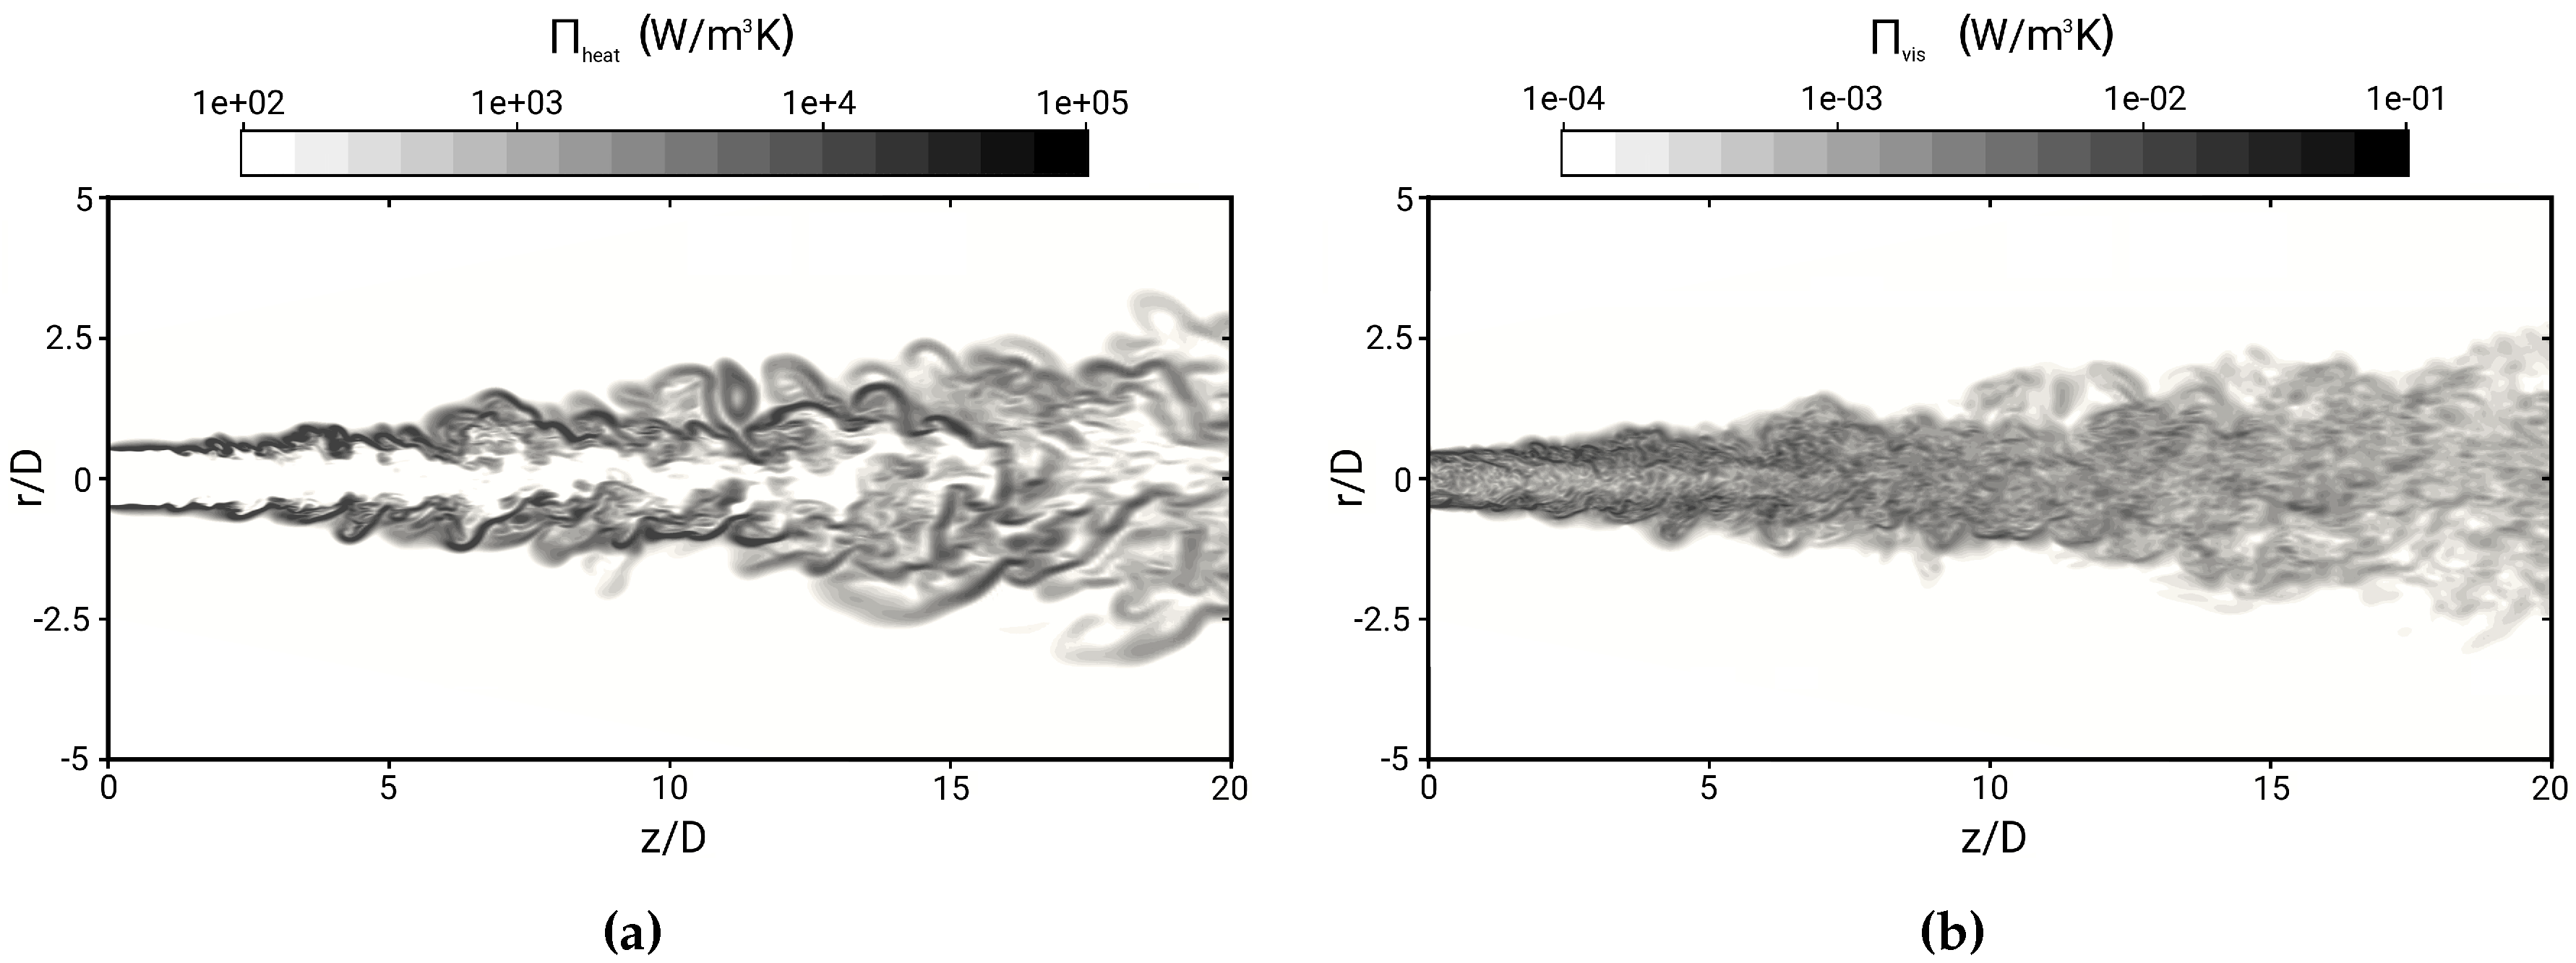
Figure 9.
Entropy production terms by heat transport (a) and viscous dissipation (b) against radial distance.
Figure 9.
Entropy production terms by heat transport (a) and viscous dissipation (b) against radial distance.

Figure 10.
Entropy production terms by heat transfer (a) and viscous dissipation (b) along the centerline.
Figure 10.
Entropy production terms by heat transfer (a) and viscous dissipation (b) along the centerline.
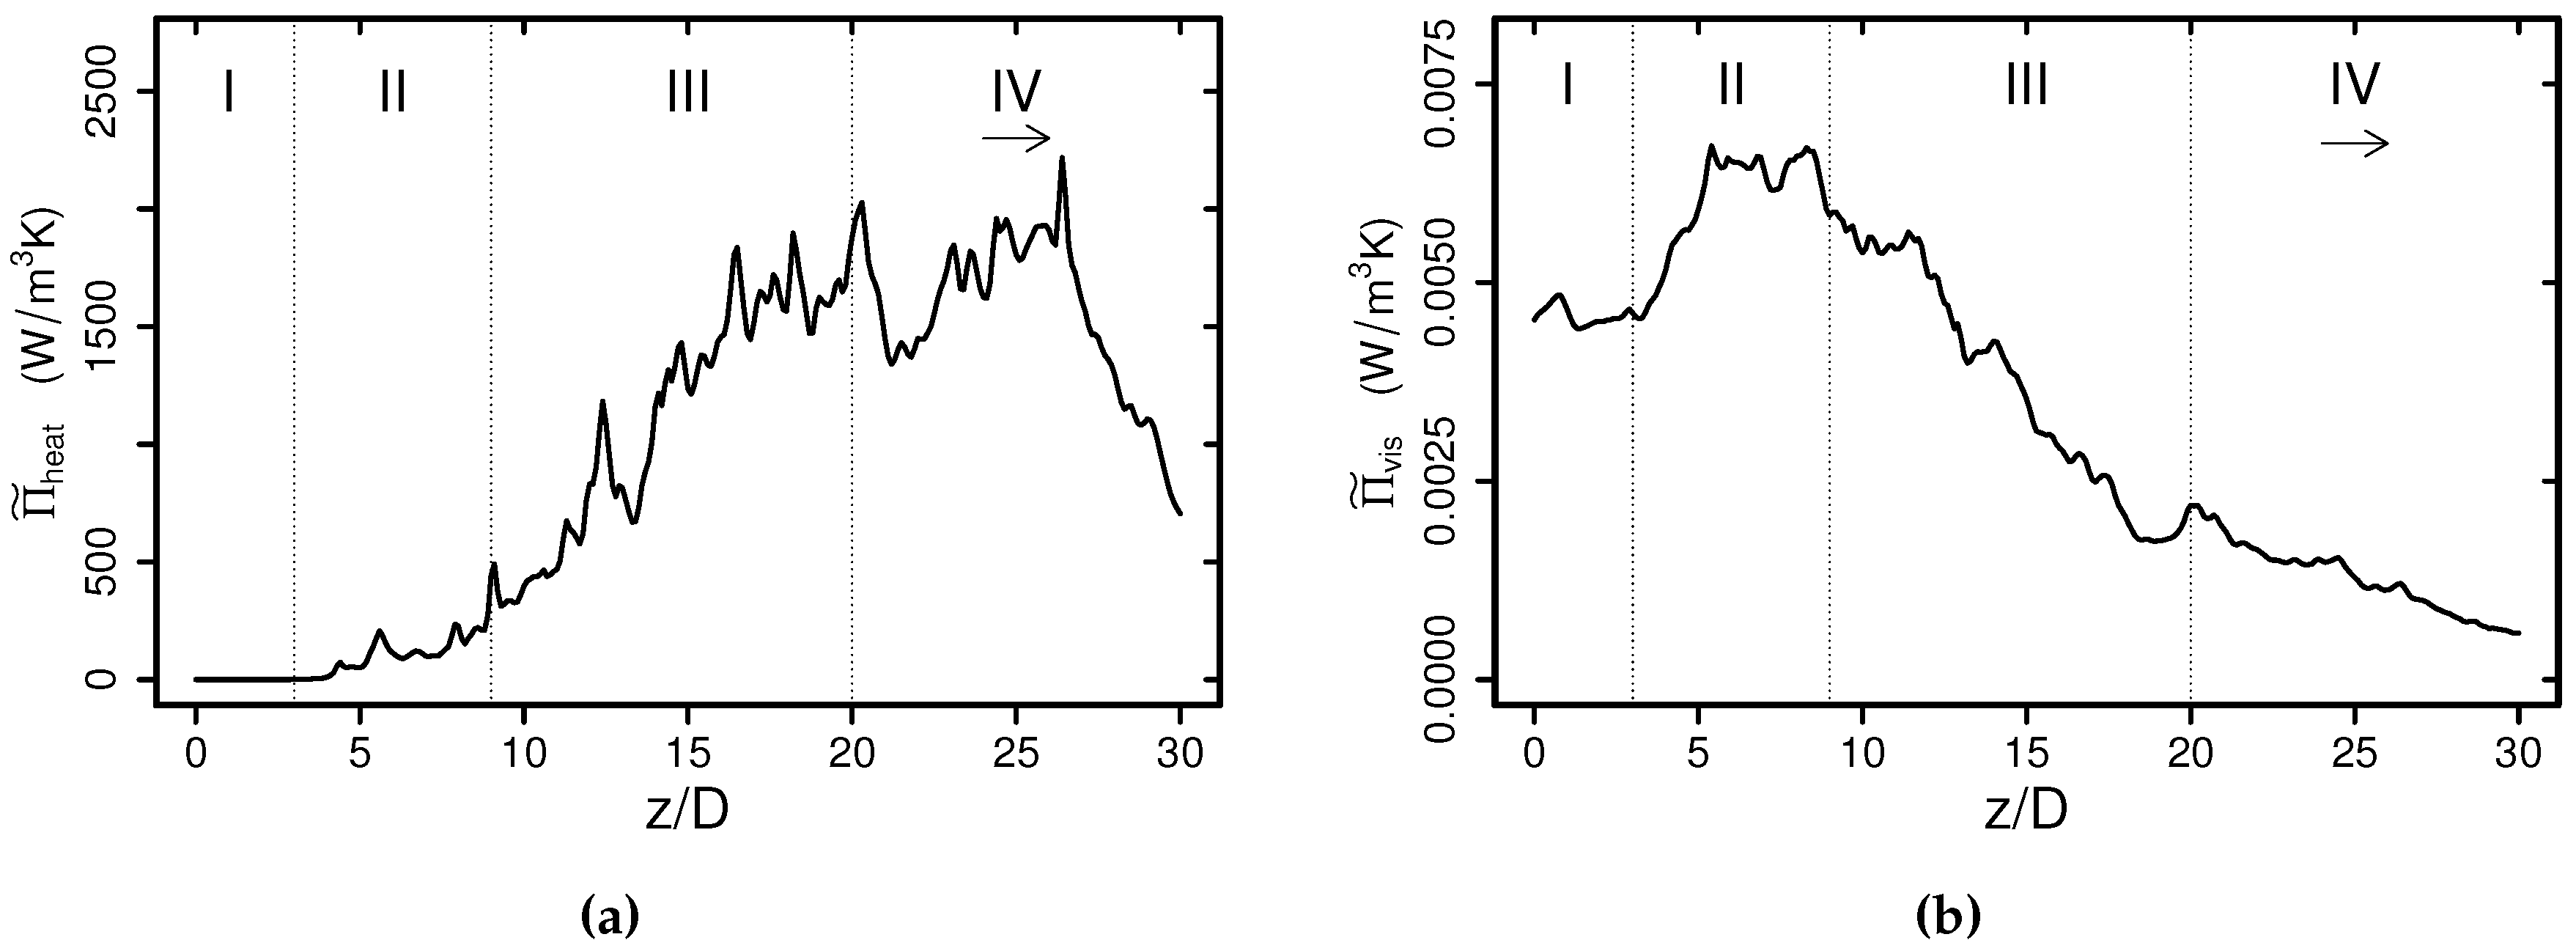
Figure 11.
Normalized autospectra of entropy generation rates by heat transport (a) and viscous dissipation (b) at , 15 and 25.
Figure 11.
Normalized autospectra of entropy generation rates by heat transport (a) and viscous dissipation (b) at , 15 and 25.


Table 1.
Operating and flow conditions of the direct numerical simulation.
| Property | Description | Value |
|---|---|---|
| injection velocity | m/s | |
| injection temperature | K | |
| chamber temperature | 298 K | |
| chamber pressure | MPa | |
| injection -number | 5300 |
© 2017 by the authors. Licensee MDPI, Basel, Switzerland. This article is an open access article distributed under the terms and conditions of the Creative Commons Attribution (CC BY) license (http://creativecommons.org/licenses/by/4.0/).
Share and Cite
MDPI and ACS Style
Ries, F.; Janicka, J.; Sadiki, A. Thermal Transport and Entropy Production Mechanisms in a Turbulent Round Jet at Supercritical Thermodynamic Conditions. Entropy 2017, 19, 404. https://doi.org/10.3390/e19080404
AMA Style
Ries F, Janicka J, Sadiki A. Thermal Transport and Entropy Production Mechanisms in a Turbulent Round Jet at Supercritical Thermodynamic Conditions. Entropy. 2017; 19(8):404. https://doi.org/10.3390/e19080404
Chicago/Turabian StyleRies, Florian, Johannes Janicka, and Amsini Sadiki. 2017. "Thermal Transport and Entropy Production Mechanisms in a Turbulent Round Jet at Supercritical Thermodynamic Conditions" Entropy 19, no. 8: 404. https://doi.org/10.3390/e19080404
Note that from the first issue of 2016, this journal uses article numbers instead of page numbers. See further details here.